Identifying Applicability Domains for Quantitative Structure Property Relationships Mordechai...
29
Identifying Applicability Domains for Quantitative Structure Property Relationships Mordechai Shacham a , Neima Brauner b Georgi St. Cholakov c and Roumiana P. Stateva d , a Dept. Chem. Eng., Ben-Gurion University Beer-Sheva, Israel b School of Engineering, Tel-Aviv University Tel-Aviv, Israel c Dept. Org. Synth. and Fuels, University of Chemical Technology and Metallurgy,Sofia, Bulgaria d Institute of Chemical Engineering, Bulgarian Academy of Sciences, Sofia 1113,
-
Upload
edmund-long -
Category
Documents
-
view
214 -
download
0
Transcript of Identifying Applicability Domains for Quantitative Structure Property Relationships Mordechai...

Identifying Applicability Domains for Quantitative Structure Property Relationships
Mordechai Shachama, Neima Braunerb
Georgi St. Cholakovc and Roumiana P. Statevad, aDept. Chem. Eng., Ben-Gurion University
Beer-Sheva, IsraelbSchool of Engineering, Tel-Aviv University
Tel-Aviv, IsraelcDept. Org. Synth. and Fuels, University of Chemical
Technology and Metallurgy,Sofia, BulgariadInstitute of Chemical Engineering, Bulgarian Academy of
Sciences, Sofia 1113, Bulgaria

The Needs
Physicochemical and biological properties are needed for risk assessment, environmental impact assessment and process design, analysis and optimization
The number of the compounds used at present by the industry or those of its immediate interest ~100,000. Those theoretically possible and may be of future interest several tens of millions.
DIPPR 801 database contains 2101 compounds (33 constant properties, 15 temperature dependent properties)

Presentation Outline
Review of Structure-Property Relationships (QSPR) based on Molecular Descriptors The “Targeted” and “Homologous Series” QSPR Methods
Representation of Liquid and Gas Properties by Molecular Descriptors
Representation of Normal Melting Temperature by Molecular Descriptors
Long Range Extrapolation from small Training Sets
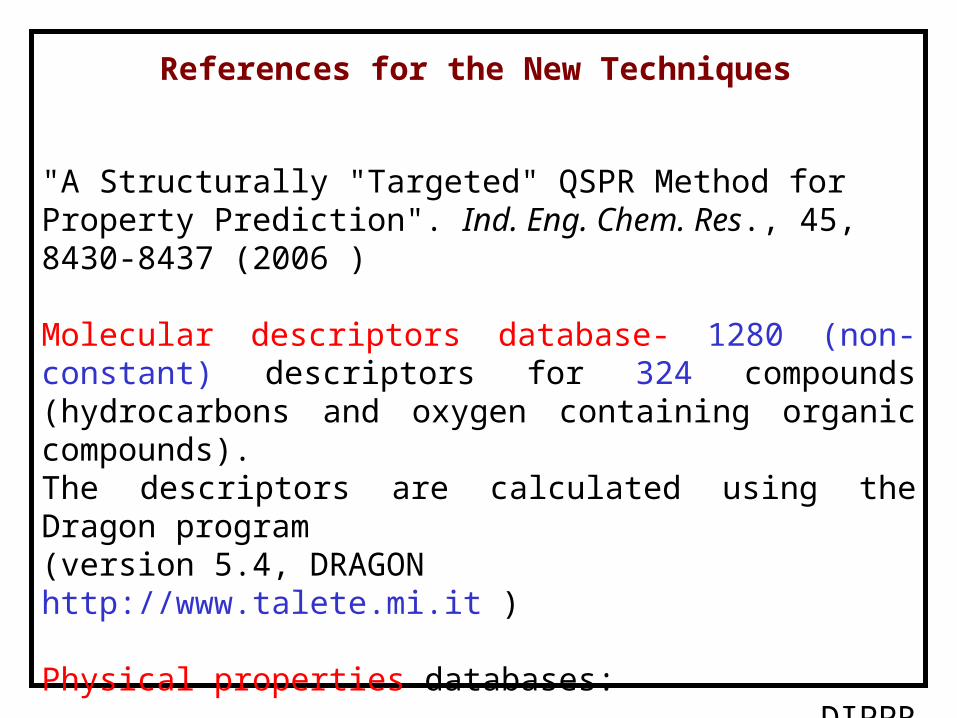
References for the New Techniques
"A Structurally "Targeted" QSPR Method for Property Prediction". Ind. Eng. Chem. Res., 45, 8430-8437 (2006 )
Molecular descriptors database- 1280 (non-constant) descriptors for 324 compounds (hydrocarbons and oxygen containing organic compounds).The descriptors are calculated using the Dragon program (version 5.4, DRAGON http://www.talete.mi.it )
Physical properties databases: DIPPR (http://dippr.byu.edu ) NIST (http://webbook.nist.gov/chemistry/ )
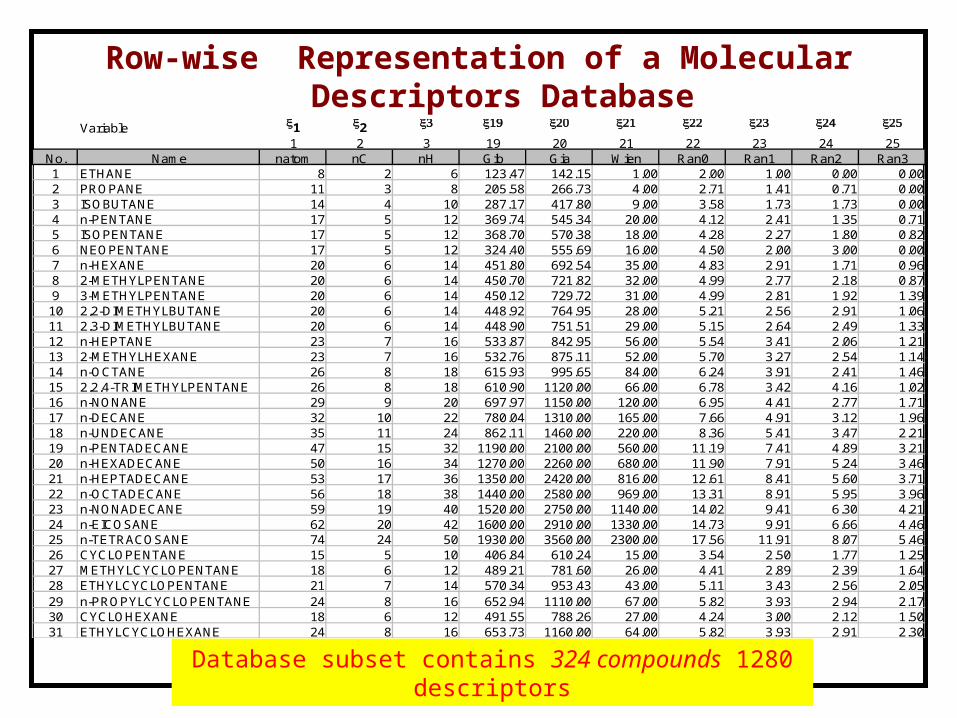
Row-wise Representation of a Molecular Descriptors Database
Database subset contains 324 compounds 1280 descriptors
Variable x1 x2 x3 x19 x20 x21 x22 x23 x24 x25
1 2 3 19 20 21 22 23 24 25No. Name natom nC nH Gib Gia Wien Ran0 Ran1 Ran2 Ran31 ETHANE 8 2 6 123.47 142.15 1.00 2.00 1.00 0.00 0.002 PROPANE 11 3 8 205.58 266.73 4.00 2.71 1.41 0.71 0.003 ISOBUTANE 14 4 10 287.17 417.80 9.00 3.58 1.73 1.73 0.004 n-PENTANE 17 5 12 369.74 545.34 20.00 4.12 2.41 1.35 0.715 ISOPENTANE 17 5 12 368.70 570.38 18.00 4.28 2.27 1.80 0.826 NEOPENTANE 17 5 12 324.40 555.69 16.00 4.50 2.00 3.00 0.007 n-HEXANE 20 6 14 451.80 692.54 35.00 4.83 2.91 1.71 0.968 2-METHYLPENTANE 20 6 14 450.70 721.82 32.00 4.99 2.77 2.18 0.879 3-METHYLPENTANE 20 6 14 450.12 729.72 31.00 4.99 2.81 1.92 1.3910 2,2-DIMETHYLBUTANE 20 6 14 448.92 764.95 28.00 5.21 2.56 2.91 1.0611 2,3-DIMETHYLBUTANE 20 6 14 448.90 751.51 29.00 5.15 2.64 2.49 1.3312 n-HEPTANE 23 7 16 533.87 842.95 56.00 5.54 3.41 2.06 1.2113 2-METHYLHEXANE 23 7 16 532.76 875.11 52.00 5.70 3.27 2.54 1.1414 n-OCTANE 26 8 18 615.93 995.65 84.00 6.24 3.91 2.41 1.4615 2,2,4-TRIMETHYLPENTANE 26 8 18 610.90 1120.00 66.00 6.78 3.42 4.16 1.0216 n-NONANE 29 9 20 697.97 1150.00 120.00 6.95 4.41 2.77 1.7117 n-DECANE 32 10 22 780.04 1310.00 165.00 7.66 4.91 3.12 1.9618 n-UNDECANE 35 11 24 862.11 1460.00 220.00 8.36 5.41 3.47 2.2119 n-PENTADECANE 47 15 32 1190.00 2100.00 560.00 11.19 7.41 4.89 3.2120 n-HEXADECANE 50 16 34 1270.00 2260.00 680.00 11.90 7.91 5.24 3.4621 n-HEPTADECANE 53 17 36 1350.00 2420.00 816.00 12.61 8.41 5.60 3.7122 n-OCTADECANE 56 18 38 1440.00 2580.00 969.00 13.31 8.91 5.95 3.9623 n-NONADECANE 59 19 40 1520.00 2750.00 1140.00 14.02 9.41 6.30 4.2124 n-EICOSANE 62 20 42 1600.00 2910.00 1330.00 14.73 9.91 6.66 4.4625 n-TETRACOSANE 74 24 50 1930.00 3560.00 2300.00 17.56 11.91 8.07 5.4626 CYCLOPENTANE 15 5 10 406.84 610.24 15.00 3.54 2.50 1.77 1.2527 METHYLCYCLOPENTANE 18 6 12 489.21 781.60 26.00 4.41 2.89 2.39 1.6428 ETHYLCYCLOPENTANE 21 7 14 570.34 953.43 43.00 5.11 3.43 2.56 2.0529 n-PROPYLCYCLOPENTANE 24 8 16 652.94 1110.00 67.00 5.82 3.93 2.94 2.1730 CYCLOHEXANE 18 6 12 491.55 788.26 27.00 4.24 3.00 2.12 1.5031 ETHYLCYCLOHEXANE 24 8 16 653.73 1160.00 64.00 5.82 3.93 2.91 2.30

Dragon Molecular Descriptor Categories

Structure-Property Relationships (QSPR) Based on Molecular Descriptors
Normal Boiling Point:
Relative Liquid Density at 20 °C:
e.g. : Chi0 – connectivity topological index, J – average distance sum index
MI – cyclomatic number

Descriptors and Model Parameters for a Linear QSPR for Predicting Melting Point (480 compounds)*
*Godavarthy et al., Ind. Eng. Chem. Res. 45, 5117 (2006)

Predicted vs. Experimental Melting Point Using a Linear QSPR with 16 Descriptors (480 compounds)*
*Godavarthy et al., Ind. Eng. Chem. Res. 45, 5117 (2006)

Limitations of the QSPR Techniques with Unrestricted Applicability Domains
Complex , often nonlinear QSPRs are needed in order to match the great variability of property values caused by the many structural differences between the various compounds.
Prediction errors are very large especially for properties which are highly sensitive to structural differences (i. e. solid properties)
The accuracy of the property prediction will be much higher for compounds which are well represented in the “training set" than for compounds which are sparsely represented. No systematic way is offered to categorize a particular target compound.
For a target compound of unmeasured properties it is impossible to assess the prediction accuracy.

The “Targeted” and “Homologous Series” QSPR Methods
In the TQSPR method, a similarity group of compounds for a target compound is first identified, using correlation coefficients between vectors of descriptors as measures of “similarity”.
In the HS-QSPR method the members of the homologous series are assigned into the “similarity group”.
In the second step a linear QSPR is tailored to a particular property of the target compound.
Row-wise representation (a row of descriptors for each compound) of a subset of the database, which contains only the members of the similarity group is used to derive the QSPR.
Only the HS-QSPR method is discussed here

Row-wise Representation of a Molecular Descriptors Database (associated with QSPR derivation)
Similarity Group contains 19-33 compounds
Variable x1 x2 x3 x19 x20 x21 x22 x23 x24 x25
1 2 3 19 20 21 22 23 24 25No. Name natom nC nH Gib Gia Wien Ran0 Ran1 Ran2 Ran31 ETHANE 8 2 6 123.47 142.15 1.00 2.00 1.00 0.00 0.002 PROPANE 11 3 8 205.58 266.73 4.00 2.71 1.41 0.71 0.003 ISOBUTANE 14 4 10 287.17 417.80 9.00 3.58 1.73 1.73 0.004 n-PENTANE 17 5 12 369.74 545.34 20.00 4.12 2.41 1.35 0.715 ISOPENTANE 17 5 12 368.70 570.38 18.00 4.28 2.27 1.80 0.826 NEOPENTANE 17 5 12 324.40 555.69 16.00 4.50 2.00 3.00 0.007 n-HEXANE 20 6 14 451.80 692.54 35.00 4.83 2.91 1.71 0.968 2-METHYLPENTANE 20 6 14 450.70 721.82 32.00 4.99 2.77 2.18 0.879 3-METHYLPENTANE 20 6 14 450.12 729.72 31.00 4.99 2.81 1.92 1.3910 2,2-DIMETHYLBUTANE 20 6 14 448.92 764.95 28.00 5.21 2.56 2.91 1.0611 2,3-DIMETHYLBUTANE 20 6 14 448.90 751.51 29.00 5.15 2.64 2.49 1.3312 n-HEPTANE 23 7 16 533.87 842.95 56.00 5.54 3.41 2.06 1.2113 2-METHYLHEXANE 23 7 16 532.76 875.11 52.00 5.70 3.27 2.54 1.1414 n-OCTANE 26 8 18 615.93 995.65 84.00 6.24 3.91 2.41 1.4615 2,2,4-TRIMETHYLPENTANE 26 8 18 610.90 1120.00 66.00 6.78 3.42 4.16 1.0216 n-NONANE 29 9 20 697.97 1150.00 120.00 6.95 4.41 2.77 1.7117 n-DECANE 32 10 22 780.04 1310.00 165.00 7.66 4.91 3.12 1.9618 n-UNDECANE 35 11 24 862.11 1460.00 220.00 8.36 5.41 3.47 2.2119 n-PENTADECANE 47 15 32 1190.00 2100.00 560.00 11.19 7.41 4.89 3.2120 n-HEXADECANE 50 16 34 1270.00 2260.00 680.00 11.90 7.91 5.24 3.4621 n-HEPTADECANE 53 17 36 1350.00 2420.00 816.00 12.61 8.41 5.60 3.7122 n-OCTADECANE 56 18 38 1440.00 2580.00 969.00 13.31 8.91 5.95 3.9623 n-NONADECANE 59 19 40 1520.00 2750.00 1140.00 14.02 9.41 6.30 4.2124 n-EICOSANE 62 20 42 1600.00 2910.00 1330.00 14.73 9.91 6.66 4.4625 n-TETRACOSANE 74 24 50 1930.00 3560.00 2300.00 17.56 11.91 8.07 5.4626 CYCLOPENTANE 15 5 10 406.84 610.24 15.00 3.54 2.50 1.77 1.2527 METHYLCYCLOPENTANE 18 6 12 489.21 781.60 26.00 4.41 2.89 2.39 1.6428 ETHYLCYCLOPENTANE 21 7 14 570.34 953.43 43.00 5.11 3.43 2.56 2.0529 n-PROPYLCYCLOPENTANE 24 8 16 652.94 1110.00 67.00 5.82 3.93 2.94 2.1730 CYCLOHEXANE 18 6 12 491.55 788.26 27.00 4.24 3.00 2.12 1.5031 ETHYLCYCLOHEXANE 24 8 16 653.73 1160.00 64.00 5.82 3.93 2.91 2.30

Derivation of the HS-QSPR Model
To tailor an HS-QSPR for a particular property of the homologous series, only members of the series with experimental data available are used (the training set).
Considering the limited variability of the property values within the similarity group, a linear structure-property relation is assumed of the form:
mmζζζy 22110
y - a p vector of the target property valuesp - number of compounds included in the similarity groupζ1, ζ2 … ζm - p vectors of the predictive molecular descriptors ( to be identified) corresponding model parameters (to be estimated).m 210 ,,

The SROV Algorithm Stepwise Regression using Orthogonalized Variables
(C&ChE, 27, 701-714, 2003)
Used to derive the property – structure correlation.
At each step (step k) of the algorithm, a new descriptor is entered into the model according to the value of the partial correlation coefficient, |yj| between the vector of the target property values y, and that of a potential predictive descriptor xj.
column vectors , are centered and normalized to a unit length.
Absolute yj values close to one ( ≈1) indicate high correlation.
Signal-to-noise ratio of the partial correlation coefficient is used as a stopping criterion for determining the number of the descriptors that should be included in the model (m).
Tjyj ξy
y jx
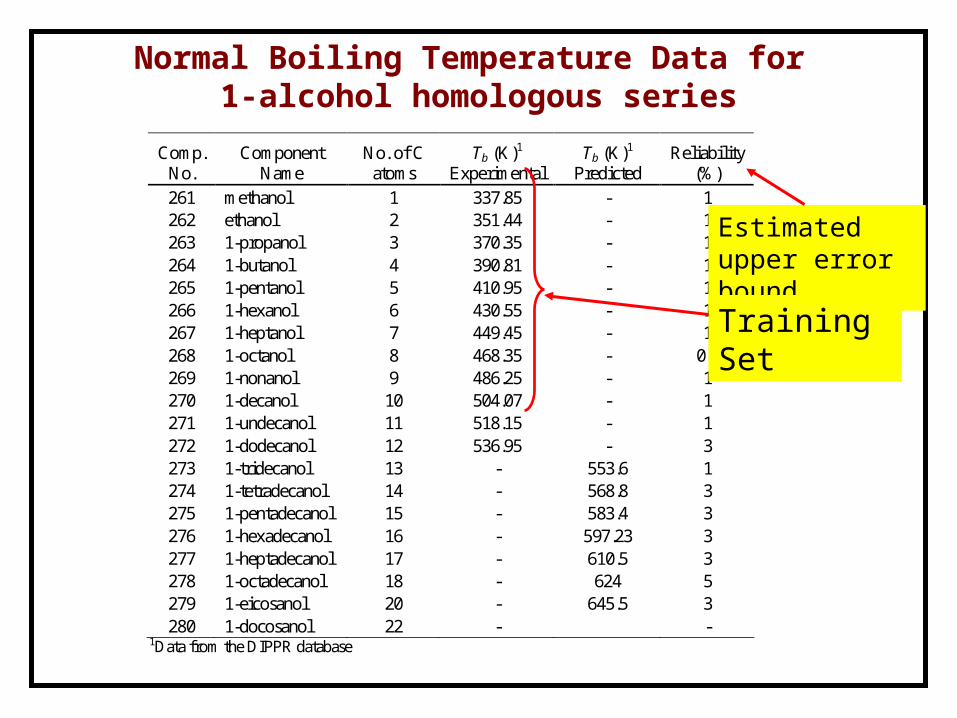
Normal Boiling Temperature Data for 1-alcohol homologous series
Comp. No.
Component Name
No. of C atoms
Tb (K)1 Experimental
Tb (K)1 Predicted
Reliability (%)
261 methanol 1 337.85 - 1 262 ethanol 2 351.44 - 1 263 1-propanol 3 370.35 - 1 264 1-butanol 4 390.81 - 1 265 1-pentanol 5 410.95 - 1 266 1-hexanol 6 430.55 - 1 267 1-heptanol 7 449.45 - 1 268 1-octanol 8 468.35 - 0.2 269 1-nonanol 9 486.25 - 1 270 1-decanol 10 504.07 - 1 271 1-undecanol 11 518.15 - 1 272 1-dodecanol 12 536.95 - 3 273 1-tridecanol 13 - 553.6 1 274 1-tetradecanol 14 - 568.8 3 275 1-pentadecanol 15 - 583.4 3 276 1-hexadecanol 16 - 597.23 3 277 1-heptadecanol 17 - 610.5 3 278 1-octadecanol 18 - 624 5 279 1-eicosanol 20 - 645.5 3 280 1-docosanol 22 - -
1Data from the DIPPR database
Estimated upper error bound
Training Set

Descriptor Name Descriptor category yj
Mor03u 3D-MoRSE descriptors -0.9998 RDF015m RDF descriptors 0.99976 Mor03e 3D-MoRSE descriptors -0.99969 RDF015u RDF descriptors 0.99969 Mor03p 3D-MoRSE descriptors -0.99969 RDCHI connectivity indices 0.99959 HTe GETAWAY descriptor 0.99952 ALOGP molecular properties 0.99951 RDF015v RDF descriptors 0.9995 Mor03v 3D-MoRSE descriptors -0.99949
The 10 descriptors with the highest correlation with Tb for 1-alcohol homologous series
Selected Descriptor
Descriptors colinear with each other for the training set

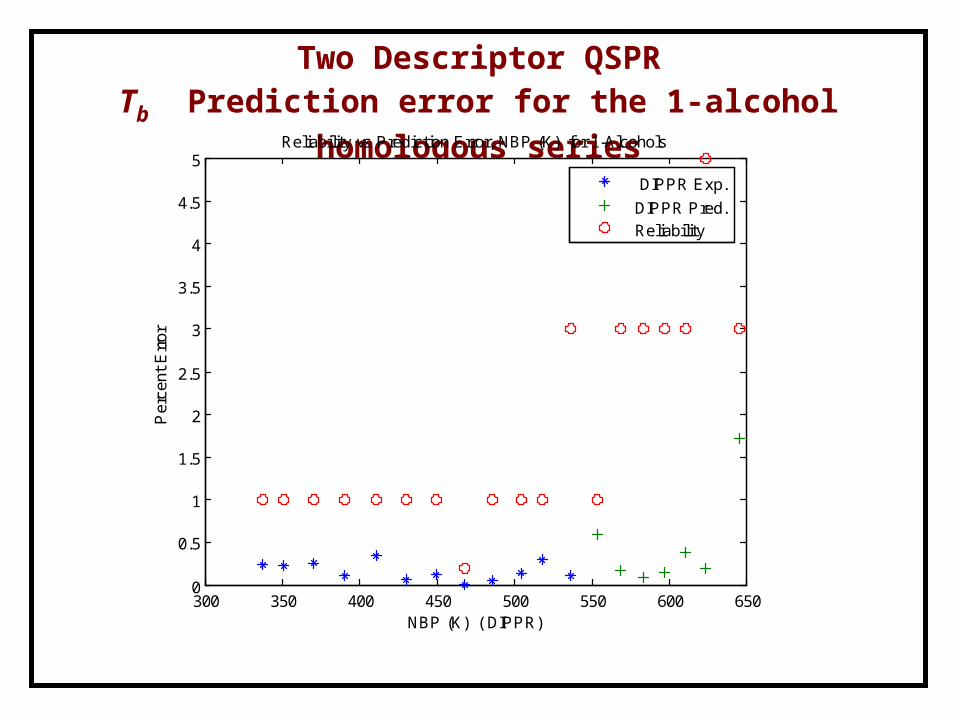
One Descriptor QSPRTb Prediction error for the 1-alcohol homologous series
300 350 400 450 500 550 600 6500
0.5
1
1.5
2
2.5
3
3.5
4
4.5
5
BP (K) ( DIPPR)
Per
cen
Err
or
Reliability vs Prediction Error, BP (K) for 1-Alcohols
DIPPR Exp.
DIPPR Pred.Reliability

Two Descriptor QSPR for the 1-alcohol series Tb = 309.6267+105.4689 H3v+7.2727 HTe
Component Name
T b (K)1
Experimental
T b (K)1
Predicted Reliability (%)1HS - QSPR Prediction
% error/ difference
methanol 337.85 - 1 338.6664 0.242ethanol 351.44 - 1 350.6268 0.2311-propanol 370.35 - 1 371.3071 0.2581-butanol 390.81 - 1 390.4097 0.1021-pentanol 410.95 - 1 409.5377 0.3441-hexanol 430.55 - 1 430.8477 0.0691-heptanol 449.45 - 1 449.983 0.1191-octanol 468.35 - 0.2 468.369 0.0041-nonanol 486.25 - 1 485.9987 0.0521-decanol 504.07 - 1 503.37 0.1391-undecanol 518.15 - 1 519.7268 0.3041-dodecanol 536.95 - 3 536.3271 0.1161-tridecanol - 553.6 1 550.3486 0.5871-tetradecanol - 568.8 3 567.8767 0.1621-pentadecanol - 583.4 3 582.8515 0.0941-hexadecanol - 597.23 3 598.1462 0.1531-heptadecanol - 610.5 3 612.8736 0.3891-octadecanol - 624 5 625.19 0.1911-eicosanol - 645.5 3 656.5721 1.7151-docosanol - - - 685.1577 -1Data from the DIPPR database
Two Descriptor QSPRTb Prediction error for the 1-alcohol homologous series
300 350 400 450 500 550 600 6500
0.5
1
1.5
2
2.5
3
3.5
4
4.5
5
NBP (K) ( DIPPR)
Per
cent
Err
or
Reliability vs Prediction Error, NBP (K) for 1-Alcohols
DIPPR Exp.
DIPPR Pred.Reliability
350
400
450
500
550
600
650
700
0 5 10 15 20 25
No. of C atoms
No
rmal
Bo
ilin
g T
emp
. (K
)
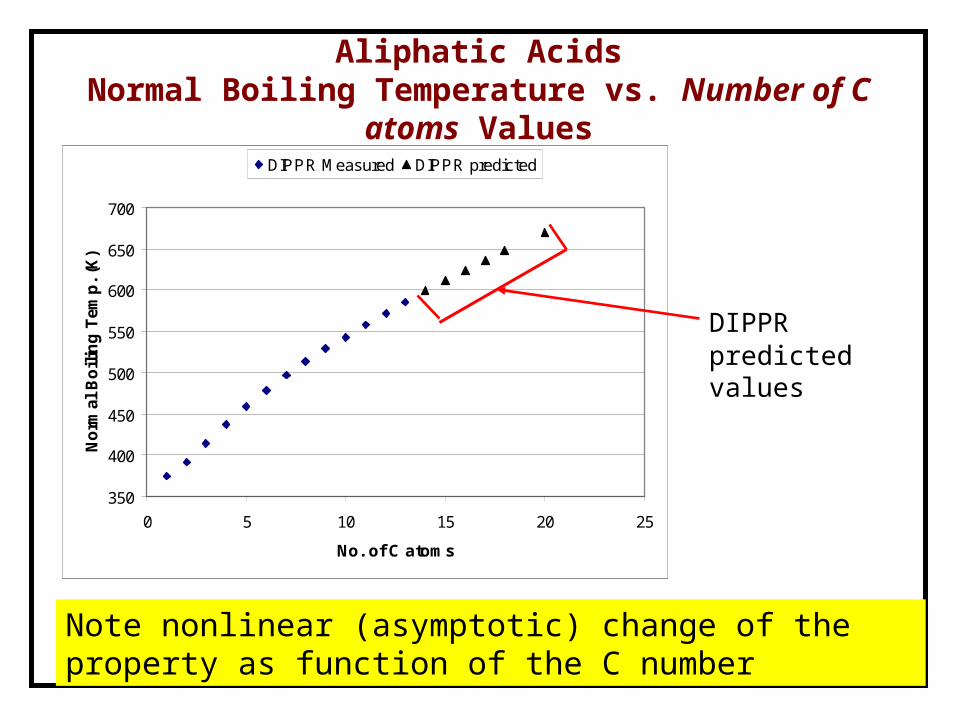
DIPPR Measured DIPPR predicted
Aliphatic AcidsNormal Boiling Temperature vs. Number of C atoms Values
Note nonlinear (asymptotic) change of the property as function of the C number
DIPPR predicted values

y = 104.56x + 187.2
R2 = 0.9989
350
400
450
500
550
600
650
700
1.5 2 2.5 3 3.5 4 4.5 5
Descriptor VEv1
No
rmal
Bo
ilin
g T
emp
. (K
)
DIPPR-Measured DIPPR-Predicted HS-QSPR Pred.
Aliphatic AcidsNormal Boiling Temperature vs. the descriptor vEv1
Note collinearity between Tb and the descriptor
DIPPR predicted values

Aliphatic Monocarboxylic AcidsNormal Melting Temperature versus number of C-atoms
For Tm the first descriptor captures only the general trend (average value) of the property.
220
240
260
280
300
320
340
360
0 2 4 6 8 10 12 14 16 18 20
No. of C Atoms
No
rmal
Mel
tin
g T
emp
. (K
)

Aliphatic Monocarboxylic AcidsNormal Melting Temperature versus Descriptor EEig06x
Note that the first descriptor captures the general trend (average value) of the property.
220
240
260
280
300
320
340
360
-1 -0.5 0 0.5 1 1.5 2 2.5
Descriptor EEig06x
No
rmal
Mel
tin
g T
emp
. (K
)
Value Linear (Value)
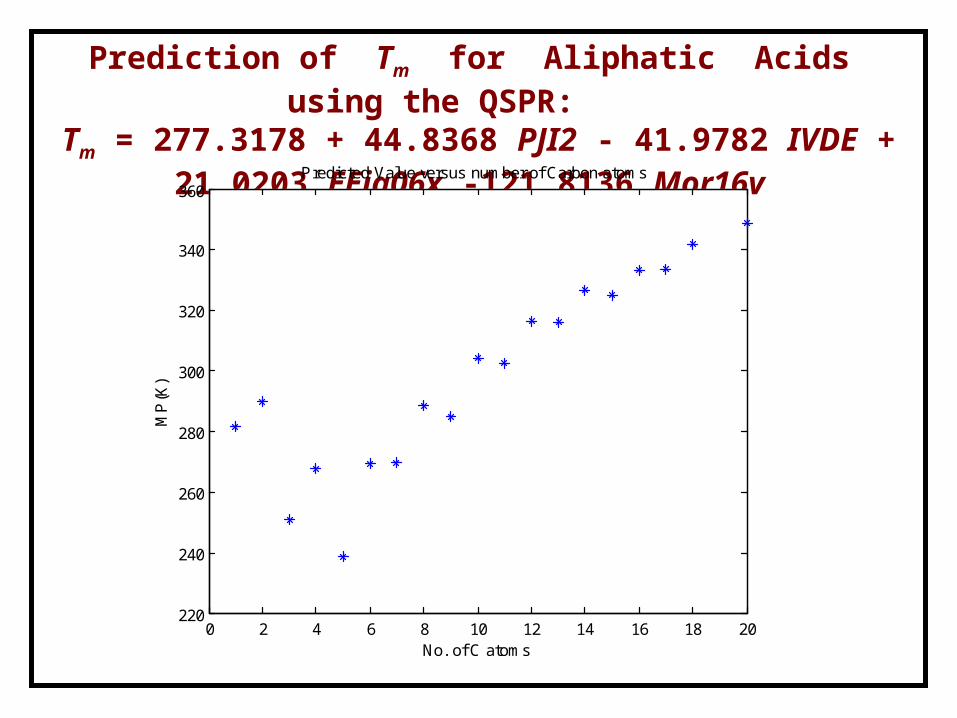
Prediction of Tm for Aliphatic Acids using the QSPR:Tm = 277.3178 + 44.8368 PJI2 - 41.9782 IVDE + 21.0203 EEig06x
-121.8136 Mor16v
0 2 4 6 8 10 12 14 16 18 20220
240
260
280
300
320
340
360
No. of C atoms
MP
(K)
Predicted Value versus number of Carbon atoms
DIPPR Exp.

Tm Prediction Error for Aliphatic Acids
220 240 260 280 300 320 340 3600
0.2
0.4
0.6
0.8
1
1.2
1.4
1.6
MP(K) ( DIPPR)
Per
cen
Err
or
Reliability vs Prediction Error, MP(K) for aliphatic-acids
DIPPR Exp.
Reliability
Prediction error exceeds reliability for
one compound

Prediction of the Critical Pressure for 1-alkenes Pc=4.469-1.5439 H3e (MPa)
The “training set” includes only five measured values
Note highly nonlinear relationship between Pc and the number of C
atoms
0 5 10 15 20 25 300.5
1
1.5
2
2.5
3
3.5
4
4.5
No. of C atoms
PC
(MP
a)
Predicted Value versus number of Carbon atoms
DIPPR Exp.
DIPPR Pred.DIPPR none
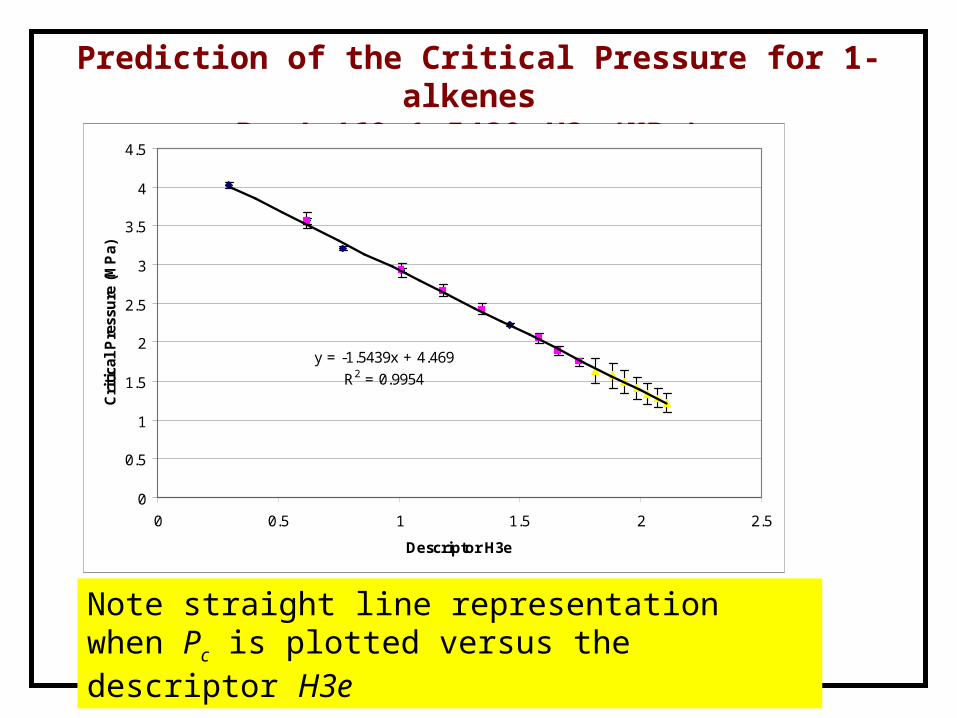
Prediction of the Critical Pressure for 1-alkenes Pc=4.469-1.5439 H3e (MPa)
y = -1.5439x + 4.469
R2 = 0.9954
0
0.5
1
1.5
2
2.5
3
3.5
4
4.5
0 0.5 1 1.5 2 2.5
Descriptor H3e
Cri
tica
l P
ress
ure
(M
Pa)
Note straight line representation when Pc is plotted versus the descriptor H3e

Prediction Error of the Critical Pressure for 1-alkenes Pc=4.469-1.5439 H3e
Prediction error exceeds reliability only for one compound in spite of the long range
extrapolation
0.5 1 1.5 2 2.5 3 3.5 4 4.50
1
2
3
4
5
6
7
8
9
10
PC(MPa) ( DIPPR)
Per
cen
Err
or
Reliability vs Prediction Error, PC(MPa) for 1-Alkenes
DIPPR Exp.
DIPPR Pred.Reliability

Conclusions
1. Prediction of constant properties (including solid properties) within experimental error (reliability) level.
2. Long range extrapolation from small training sets of 3-5 compounds for which experimental data is available.
3. Use of linear QSPRs that include one to four descriptors.
4. The maximal prediction error of the melting point temperature is 3 K. This is smaller by at least an order of magnitude than the errors reported in the literature.
Selecting the molecular descriptors that exhibit the highest level of collinearity with a particular property from a very large pool of descriptors enables developing simple linear QSPRs for prediction of properties of homologous series with the characteristics: