
Identifying and Mapping Sage-Grouse Winter Concentration ...
20
Identifying and Mapping Sage-Grouse Winter Concentration Areas in the Normally Pressured Lance Energy Field Submitted To: Governor’s Sage-Grouse Implementation Team Wyoming Game and Fish Department 5400 Bishop Boulevard Cheyenne, WY 82006 From: Wyoming Chapter of The Wildlife Society Committee on Wintering Sage-Grouse in the Normally Pressured Lance Energy Field Joshua Millspaugh, Ph.D., University of Missouri (Chair) Jeffrey Beck, Ph.D., University of Wyoming Tom Christiansen, Wyoming Game and Fish Department Matthew Dzialak, Ph.D., Hayden-Wing Associates, LLC Mark Hogan, U.S. Fish and Wildlife Service Matthew Holloran, Ph.D., Wyoming Wildlife Consultants, LLC Jennifer Morton, Bureau of Land Management Approved by Tony W. Mong, President Wyoming Chapter of The Wildlife Society 27 April 2013
Transcript of Identifying and Mapping Sage-Grouse Winter Concentration ...
Identifying and Mapping Sage-Grouse Winter Concentration Areas in the Normally Pressured Lance Energy Field
Submitted To:
Governor’s Sage-Grouse Implementation Team Wyoming Game and Fish Department
5400 Bishop Boulevard Cheyenne, WY 82006
From:
Wyoming Chapter of The Wildlife Society Committee on Wintering Sage-Grouse in the Normally Pressured Lance Energy Field
Joshua Millspaugh, Ph.D., University of Missouri (Chair)
Jeffrey Beck, Ph.D., University of Wyoming Tom Christiansen, Wyoming Game and Fish Department Matthew Dzialak, Ph.D., Hayden-Wing Associates, LLC
Mark Hogan, U.S. Fish and Wildlife Service Matthew Holloran, Ph.D., Wyoming Wildlife Consultants, LLC
Jennifer Morton, Bureau of Land Management
Approved by Tony W. Mong, President Wyoming Chapter of The Wildlife Society
27 April 2013

1
1.0 Executive Summary The Wyoming Chapter of The Wildlife Society (WYTWS) was asked by the Governor’s Sage-Grouse Implementation Team (SGIT) to review the protocol developed by the Wyoming Game and Fish Department (WGFD) and Bureau of Land Management (BLM) to map greater sage-grouse (Centrocercus urophasianus; hereafter sage-grouse) winter concentration areas (WCAs) within the Normally Pressured Lance natural gas development project area (NPL) in the Pinedale region. The WYTWS convened a group of wildlife professionals from state and federal agencies, the private sector, and academia (hereafter, the Committee) to review the protocol and respond to four specific questions asked by the SGIT about WCAs. The Committee met on April 8–9, 2013 to address these requests. Recommendations for mapping and identifying crucial sage-grouse WCAs were developed based on characteristics and data available for the NPL region. Therefore, the Committee does not necessarily endorse application of these recommendations to other regions of Wyoming or other states. Our report concludes with a summary of our discussion about the utility of various data types, as viewed by the Committee, for delineating WCAs for sage-grouse in other areas. Specifically, we discussed the utility of GPS-PTT technology, VHF transmitters, aerial flights, sign-count data, and the WGFD wildlife observation system. Protocol Review The Committee views the existing data set as valuable for delineating WCAs in the NPL, but noted several elements of the WGFD and BLM approach that might reduce defensibility. (1) There is no justification for buffer sizes scaled by the size of the flock. (2) Flock size is used as an index of patch extent and there is no literature to support this assumption. (3) The use of circular buffers results in the potential inclusion of non-target habitat, at the exclusion of potentially valuable habitat, which is likely where irregular or interspersed habitats exist. (4) The omission of observations of < 50 individuals, during all phases of WCA development, risks excluding important areas from the WCA delineation process. (5) The approach cannot account for imperfect detection and once-per-year flights might omit potentially important sage-grouse habitats in the WCA delineation process. The issue of imperfect detection is important because the Executive Order only recognizes WCAs as areas with actual sage-grouse locations. The Committee recommends that WCAs in the NPL be delineated through a combination of sage-grouse locations, as determined from live flock counts obtained from aerial surveys, and use of a resource selection function (RSF) model. Such an approach would avoid subjective buffer sizes, ensure the highest quality habitat is included in the delineated WCA area, and be dynamic with respect to changing use patterns of sage-grouse, while simultaneously confirming sage-grouse presence. Areas that are predicted as high occurrence areas in the RSF, but where sage-grouse locations are not confirmed during flights, should be flown more than once each year, while reducing survey effort in areas predicted to be of low quality habitat. SGIT Questions 1. What characterizes crucial winter sage-grouse habitat (plant community structure, topography, etc.) in the NPL WCA area? From the literature, the Committee identified several
2
commonly reported patterns of sage-grouse habitat selection in winter including the avoidance of human activity and energy infrastructure and selection of exposed, sagebrush cover at an intermediate density in areas with less rugged terrain at lower elevations. To identify specific habitat needs of sage-grouse in the NPL during winter, the Committee recommends the development of a NPL-specific RSF model using existing observation and telemetry data. The modeling for a NPL-specific RSF model would take 3-4 weeks once data are in hand and the Committee would be willing to pursue this activity should support be available. 2. How existing observation and telemetry data should be used to determine crucial sage-grouse winter habitat. Given the available data, the Committee views the live sage-grouse location data from the existing helicopter survey data set as the most appropriate basis from which to identify WCAs in the NPL. The Committee recommends use of all sage-grouse observation data collected during helicopter counts, with the exception of track count data, to develop a RSF map for the NPL. Flock size, as determined from the helicopter counts, should be considered in the RSF model. This way, all sage-grouse observations are considered, but weighed according to flock size. The RSF can be used to generate maps of relative predicted occurrence of sage-grouse throughout the NPL. Such an approach would delineate the highest quality habitats associated with WCAs where sage-grouse tend to concentrate during winter from year to year. We recommend delineating WCAs around the highest quality areas, as predicted by the RSF model, containing repeated sage-grouse observations through time with ≥ 50 birds as counted during aerial surveys. Predicted high use areas from the RSF not confirmed by direct observations of sage-grouse could be prioritized as potentially valuable habitat. Our evaluation of a RSF map, developed only in part from NPL data (Fedy et al., in revision), demonstrated the utility of this approach and the considerable overlap between the sage-grouse observation points, the buffer-based approach currently used in the NPL, and the RSF approach recommended by the Committee. However, the buffer-based approach sometimes included non-target habitat. The RSF approach recommended by the Committee would refine WCA boundaries produced by the current protocol by including the highest quality habitat around observed sage-grouse observation points and result in a rigorous, data-driven mapping approach to identify WCAs in the NPL. 3. How do crucial winter habitats relate/connect to associated crucial breeding grounds in the NPL WCA area? Between 1998 and 2011, multiple sage-grouse research projects were conducted in the Upper Green River Basin. From 2005 to 2011, 84 individual radio-equipped sage-grouse were documented using winter habitats in or near the NPL. Of these grouse, 62 (74%) were captured from leks or late summering habitats located within designated Core areas (State of Wyoming Executive Department Executive Order 2011-5). Further, using lek count data and estimates of the “resident” population, it was estimated that approximately 40% (750/1,240) of the sage-grouse counted during the winter were not resident grouse assuming all resident grouse winter in the NPL. This information indicates that sage-grouse within the Core areas use the NPL during the winter. However, we do not know the travel paths used by sage-grouse between these areas nor do we know the timing of these movements from the available data.

3
4. How do anthropocentric land uses impact wintering sage-grouse and what seasons of year would seasonal stipulations be most useful in ameliorating these impacts? Winter is arguably the least-studied life stage for sage-grouse. In general, sage-grouse avoid energy infrastructure, but the scale and type of avoidance (e.g., surface disturbance, well pad density, or distance to well pads) differs among studies and the impact of infrastructure avoidance to sage-grouse populations is not well understood. In addition, avoidance of infrastructure such as wells and roads has also been shown to be variable among individuals and may be based on avoidance of human activity associated with the infrastructure, not necessarily the infrastructure itself. The Committee concluded that sage-grouse are likely to avoid developed winter habitats with on-going human activity. The Wyoming Governor’s Sage-Grouse Executive Order (State of Wyoming 2008, 2011) and the BLM (Bureau of Land Management 2012) provide seasonal stipulations that exempt human activities associated with production and maintenance activities. Given the incompatibility of sage-grouse and human activity associated with infrastructure in developed winter habitats, the Committee expressed concerns about the effectiveness of the winter stipulations that only apply during the drilling period and exclude the long-term production and maintenance activities that follow. The Committee recommends that human activities associated with production and maintenance activities be reconsidered in the Executive Order. Given the lack of site-specific information at the NPL, the Committee agreed that we could not provide scientifically-supported recommendations regarding buffer distances around WCAs where infrastructure should be avoided or well density limits to minimize impacts to sage-grouse. However, the RSF approach we recommend offers the most useful tool to guide infrastructure siting, while improving our understanding of grouse avoidance patterns related to infrastructure sited on important winter habitat, and should be the foundation for future research investigating the efficacy of site-specific stipulations.

4
2.0 Introduction and Background The Wyoming Chapter of The Wildlife Society (WYTWS) was asked by the Governor’s Sage-Grouse Implementation Team (SGIT) to review the protocol developed by the Wyoming Game and Fish Department (WGFD, Dean Clause) and Bureau of Land Management (BLM, Rusty Kaiser and Dale Woolwine) to map greater sage-grouse (Centrocercus urophasianus; hereafter sage-grouse) winter concentration areas (WCAs) within the Normally Pressured Lance natural gas development project area (NPL) in the Pinedale area. In addition to reviewing the protocol, the SGIT also asked the WYTWS to answer four specific questions in relation to sage-grouse and winter concentration areas. The WYTWS convened a group of wildlife professionals from state and federal agencies, the private sector, and academia (hereafter, the Committee) to address these requests. The Committee held a two-day meeting, on April 8–9, 2013, to discuss and review the protocol, formulate responses to the questions presented by the SGIT and discuss the utility of various data sources for determining WCAs for sage-grouse. In developing responses, the Committee considered the WCA protocols used in the NPL, discussions with Dean Clause (WGFD), Rusty Kaiser (BLM), and Dale Woolwine (BLM) who collected the data, available data and models for the region, and scientific publications that were pertinent to these questions and the area. Recommendations for mapping and identifying crucial sage-grouse WCAs were developed based on data available for the NPL region and the characteristics of that particular region. Our report provides recommendations on the protocol currently used to delineate WCAs in the NPL and responses to the questions posed by the SGIT. Our input and recommendations for mapping and identifying crucial sage-grouse WCAs were developed based on data available for the NPL region and the characteristics of that particular region. For example, flock sizes may be much larger in the NPL than other regions of the state. Therefore, the Committee does not necessarily endorse application of these recommendations to other regions of Wyoming or other states. We end our report with some general guidance and potential applications of various data types for others considering how to identify and map crucial sage-grouse winter habitat and WCAs for other regions. This final section is intended to serve as an initial discussion. 3.0 Overview of Sage-Grouse Data Used to Delineate WCAs in the NPL The current approach to identifying WCAs involves conducting aerial surveys annually, from 2004 through 2012, throughout the NPL along transects spaced 0.5 or 1-mile apart. The location of observed sage-grouse (or sign such as tracks), along with an estimate of flock size, is recorded. Point data (observed locations of live sage-grouse) establish the center of a circular buffer with a radius that varies depending on estimated flock size. Locations associated with flocks of 50–99 individuals received a 0.5-mile radius buffer; 100–199 individuals received a 0.75-mile buffer; 200–499 individuals received a 1.0-mile buffer; more than 500 individuals received a 1.5-mile buffer. Buffers were then merged to depict continuous polygons. Notable is the use of locations associated with ≥ 50 individuals to establish polygons and the omission of observations associated with < 50 individuals during any phase of the WCA delineation process. Further, note that sage-grouse sign, including tracks, is not used in the current delineation of WCAs in the NPL.

5
4.0 Committee Review of Current Protocol to Delineate WCAs in the NPL The Committee views the existing data set as a valuable resource and the most appropriate basis from which to identify WCAs in the NPL. We propose a modification in the analytical framework that reduces subjectivity and improves defensibility. 1. There is no supporting justification for buffer sizes scaled by the size of the flock. Using the existing approach, flock size is used as an index of patch extent. While it may be intuitive that larger flocks require larger patches, patch quality also might be a strong driver of sage-grouse occurrence. In such cases, a relatively small patch may support a large number of individuals or be used with high frequency. Therefore, the positive association between flock size and patch extent is tenuous and not supported by the literature. 2. Another feature of the use of circular buffers is the potential inclusion of non-target habitat, at the exclusion of potentially valuable habitat. This is particularly problematic when important patches are irregular in shape or are interspersed throughout areas of non-target habitat. Merging buffers to establish continuity among polygons further increases the likelihood that non-target habitat will be included within polygons designated as WCAs. The Committee recommended approach below reduces the potential for including low quality habitat in delineated WCAs. 3. Further, the Committee felt that observations < 50 individuals could still be an important component to delineating WCAs. The omission of observations of < 50 individuals, during any phase of WCA identification, risks excluding important patches from the WCA delineation process. There is no literature suggesting the number of individuals which are necessary to delineate a WCA. The number of birds in the WCAs in the NPL is very high. Our recommendation below makes use of observations with < 50 in developing a resource selection function (RSF) model. 4. Last, the approach cannot account for imperfect detection of sage-grouse. The issue of imperfect detection is important because the Executive Order only recognizes WCAs as areas with actual sage-grouse locations. The Committee was concerned that the need to confirm sage-grouse presence at a site, imperfect detectability during surveys, and once-per-year sampling could result in excluding critical habitat from WCA designation during the delineation process. Our recommendation below suggests more than one survey in areas where occurrence is predicted to be high in an attempt to confirm whether sage-grouse are present in those areas. The Committee makes the following recommendations (note that section 5.2 below provides a detailed description of the RSF approach): 1. The Committee acknowledged that in the absence of detailed telemetry-based data, which could refine identification of WCAs, aerial surveys were considered the next best available source of information. However, it was also noted that telemetry-based data, particularly GPS-PTT (global positioning system platform transmitter terminal) would be beneficial in directly identifying the spatial distribution of sage-grouse WCAs while simultaneously providing
6
information about individual variability, fidelity to WCAs, whether travel corridors exist between seasonal ranges, and the timing of movements to, from, and within WCAs. 2. Given cost and logistical constraints, the Committee supported continued use of aerial surveys. However, given concerns with imperfect detectability, once-per-year sampling, and the need to confirm grouse presence at WCAs, we recommend that more than one survey per year be conducted on sites where sage-grouse occurrence is predicted to be high. These high occurrence sites would be delineated using RSF maps (Figure 1). A revised sampling protocol could be developed to place greater emphasis on these predicted high occurrence sites, which could ensure these sites are counted more than once, thus improving the odds that sage-grouse presence at those sites is confirmed, if grouse are there. Less time could be dedicated to sampling predicted low occurrence areas where it is unlikely sage-grouse are present. 3. The Committee recommends use of all sage-grouse observation data collected during helicopter counts, with the exception of track count data, to develop a RSF map for the NPL. Flock size, as determined from the helicopter counts, should be considered in the RSF model. This way, all sage-grouse observations are considered, but weighed according to flock size. The Committee supported using observation points where ≥ 50 birds were repeatedly observed as a component of the delineation process. The Committee does not advocate use of track count data to delineate WCAs due to concerns with detection bias and the lack of consistency in collecting this information. 4. Formal evaluations of detection bias could be undertaken through consideration of sightability surveys (White and Shenk 2001) should sage-grouse in the area be radio-marked or density quantified with distance sampling (Buckland et al. 1993). Such an evaluation could help managers better determine the degree and potential sources of bias using aerial transects. 5.0 Committee Responses to Questions from the SGIT The Committee was asked to address four specific questions. A response to each question is provided below. 5.1 What characterizes crucial winter sage-grouse habitat (plant community structure, topography, etc.) in the NPL WCA area? From the literature, the Committee identified the general habitat needs of sage-grouse in winter (Beck 1977, Doherty et al. 2008, Carpenter et al. 2010, Bruce et al. 2011; Dzialak et al. 2012, 2013; Frye et al. 2013). The Committee noted commonly reported patterns in the literature including the avoidance of human activity and energy development infrastructure (Doherty et al. 2008, Carpenter et al. 2010, Dzialak et al. 2012, 2013) and selection of large patches of exposed, sagebrush cover at an intermediate density in areas with less rugged terrain at lower elevations (Eng and Schladwieler 1972, Beck 1977, Berry et al. 1985, Doherty et al. 2008, Carpenter et al. 2010; Dzialak et al. 2012). The Committee noted that sage-grouse avoid energy development infrastructure, perhaps not because of the physical features, but because of the human activity associated with them.

7
To identify specific habitat needs of sage-grouse in the NPL during winter, the Committee encourages the development of a site-specific RSF model using existing observation and telemetry data. Such a model, developed solely from NPL data, would project the relative predicted occurrence of sage-grouse throughout the area based on resources (e.g., habitat features such as topography, roads, vegetation types) that are associated with sage-grouse locations in the NPL. Our rationale and recommendations for developing such a model are below in response to question 5.2. As with all models, it is important to note that this model might not apply elsewhere and is intended for application at the NPL. 5.2 How existing observation and telemetry data should be used to determine crucial sage-grouse winter habitat. The Committee recommends using existing sage-grouse location data (i.e., the sage-grouse observations collected from aerial surveys and telemetry data, not track data) to develop and validate a NPL-specific RSF model which, in turn, can be used to generate maps of the relative predicted occurrence of sage-grouse throughout the NPL. Studies of resource selection assess how habitat attributes used by wildlife, such as vegetation and landscape features, are used in relation to their availability. Resource selection function models quantify these relationships and estimate the relative probability of occurrence throughout a region based on resources that are determined to be important. When projected in a geographic information system (GIS; Figure 1), one can estimate, for example, the relative predicted occurrence of sage-grouse in a region such as the NPL. The study of resource selection has strong historical roots, but has recently developed into a cornerstone of modern ecological analysis (Manly et al. 2002). Although many of the analytical techniques used in resource selection are rooted in the statistical sciences, they have become central approaches to study resource selection by animals (Manly et al. 2002). These RSF models are being increasingly applied to issues involving conservation planning (Millspaugh and Thompson 2009) and land use alteration, in addition to identifying critical sage-grouse wintering habitat (Doherty et al. 2008, Carpenter et al. 2010, Dzialak et al. 2012, 2013). New methods of resource selection analysis allow one to estimate the absolute probability of occurrence from use and availability data (e.g., Lele and Keim 2006, Rota et al. 2013). The Committee’s recommendation is to create a RSF model for the NPL using data available from 2004-2012. The modeling for a NPL-only RSF model would take approximately 3–4 weeks once data are in hand and the Committee would be willing to pursue this activity should support be available. Using the RSF map, it is possible to delineate habitat that is consistently important through time and confirmed through sage-grouse observations of ≥ 50 birds. Estimated flock size data should be incorporated in the analysis to provide a measure of habitat quality (Johnson 2007). One way would be to weight locations based on flock size – where larger flock size would confer greater importance to that location within the NPL. Alternatively, flock size can be used as a measure of habitat importance. To define these predicted high use areas in the RSF as WCAs, the Committee recommends overlaying sage-grouse winter observations, as collected during annual flights, where ≥ 50 sage-grouse were observed, on the RSF map. Those predicted highest quality habitats surrounding sage-grouse observations where ≥ 50 sage-grouse are observed repeatedly through time would delimit the boundaries of the WCA. Binning the RSF values would be necessary to delineate

8
predicted high use from low use areas and an appropriate method would be determined once the RSF map is developed. In this way, WCAs are delimited by a combination of RSF predictions of habitat quality and confirmed sage-grouse locations with ≥ 50 birds. Such delineation of WCAs inherently considers the need for sage-grouse presence in sufficient quantity, while identifying and considering differences in habitat quality that surround those locations. Other predicted high use areas with < 50 locations could then be prioritized as potentially valuable habitat and be surveyed more than once per year to reduce the likelihood of not detecting sage-grouse, should they be present. The end product of the approach proposed by the Committee would be a rigorous, science-based, data-driven map identifying WCAs as areas within the NPL where sage-grouse are consistently observed through time. The RSF predicts the relative occurrence of sage-grouse based on the importance of various resources and helps delineate those areas around sage-grouse flocks that most likely promote sage-grouse persistence. The RSF map would be a GIS product that would be readily amenable to testing, refinement, and application by GIS users with the management agencies as well as industry in infrastructure siting decisions and other efforts to focus sustainable landscape management. The Committee wants to stress that the RSF model would only be a tool that needs to be applied and interpreted appropriately. We do not recommend this model created from NPL data be applied where field conditions differ from those in the NPL. Despite these warnings, the method is robust, statistically rigorous, standardized, and would help remove subjectivity and improve defensibility in the WCA delineation process at the NPL. While developing these recommendations the Committee acquired a RSF map, which was based, in part on data from the NPL, and is applicable to the general region (Fedy et al., in revision). We obtained this RSF map to determine the general feasibility of the approach we have recommended for WCA delineation. Note that the Committee has recommended a NPL-specific RSF model that would be based solely on NPL data, which this Committee could develop in 3–4 weeks, with the necessary support. Our visual inspection of the currently applied WGFD and BLM buffer-based delineation process of WCAs against the Fedy et al. RSF map revealed considerable overlap between the two approaches. However, the circular buffers combined with the merging process used in the WGFD and BLM protocol included areas known to be non-target habitat such as riparian areas, and excluded important habitat that fell outside of the buffers. Based on this initial assessment and proof of concept, we anticipate modest shifts to boundaries identified through the WGFD and BLM buffer-based approach, while having the advantage of delineating areas around habitats containing the highest predicted habitat quality (Figure 2). 5.3 How do crucial winter habitats relate/connect to associated crucial breeding grounds in the NPL WCA area? Between 1998 and 2011, multiple sage-grouse research projects have been conducted in the Upper Green River Basin (UGRB) and the Committee used this information as a basis for responding to this question. These projects have resulted in 750+ radio-equipped sage-grouse captured from areas throughout the basin. Aerial-based telemetry has been used to track these radio-equipped sage-grouse on generally a monthly schedule during the winters. From 2005 to 2011, 84 individual radio-equipped sage-grouse were documented using winter habitats in or
9
near the NPL. Of these grouse, 62 (74%) were captured from leks or late summering habitats located within designated Core areas (State of Wyoming Executive Department Executive Order 2011-5; see Figure 3). As an additional assessment of the importance of wintering habitats in the NPL to sage-grouse populations in the UGRB, we estimated the “resident” population residing in the NPL from counts of males on leks located within the project area. In 2011 and 2012, 211 and 200 males were counted respectively. Assuming 75% of the total male population was counted and twice the number of females as males (Connelly et al. 2003, p. 22), the resident population was roughly estimated at 750 sage-grouse. In the 2011 and 2012 winters, 1,877 and 602 grouse were counted during winter flight surveys (average 1,240), suggesting that approximately 40% (750/1,240) of the grouse counted during the winter were not resident grouse assuming all resident grouse winter in the NPL. The threefold difference in the number of wintering grouse observed between 2011 and 2012 is likely due to lower overall numbers of grouse and differing winter severity between years. The 2010–11 winter was relatively severe while the 2011–12 winter was exceptionally mild. This information from radio-equipped sage-grouse and confirmatory evidence from the lek count data indicates that sage-grouse within the Core areas use the NPL during the winter. However, we do not know the travel paths used by sage-grouse between these areas nor do we know the timing of these movements from these data. The Committee felt the telemetry data were strong and indicative of a link between the NPL and Core areas, but recommends additional research in identifying where travel paths exist and subsequent movement patterns related to changing winter conditions and the timing of sage-grouse movements onto WCAs. To meet those objectives, the Committee recommends use of GPS-PTT tags, which have been used successfully in other sage-grouse projects in Wyoming. This technology provides the opportunity to collect multiple locations per day, per sage-grouse, remotely. Therefore, it becomes possible to identify travel paths of birds. The Committee further recommends the use of Brownian bridge analyses (Horne et al. 2007, Nielson et al. 2011) or movement-state-based RSF models, which are well-suited for meeting the objective using such data types. 5.4 How do anthropocentric land uses impact wintering sage-grouse and what seasons of year would seasonal stipulations be most useful in ameliorating these impacts? Winter is arguably the least-studied life stage for sage-grouse (Connelly et al. 2004, Bruce et al. 2011). However, a growing body of research provides important insights into the behavior (Beck 1977, Back et al. 1987), movements (Eng and Schladwieler 1972, Connelly et al. 1988, Berry et al. 1985, Beck et al. 2006, Bruce et al. 2011, Fedy et al. 2012), foraging ecology and nutritional relationships (Wallestad et al. 1975; Remington and Braun, 1985, 1988; Welch et al. 1991), patterns of habitat selection (Beck 1977, Eng and Schladweiler 1972, Homer et al. 1993, Bruce et al. 2011; Dzialak et al. 2012, 2013, Frye et al. 2013), survival (Beck et al. 2006, Moynahan et al. 2006, Anthony and Willis 2009), and response to anthropogenic land uses (Doherty et al. 2008, Carpenter et al. 2010; Dzialak et al. 2012, 2013) of sage-grouse during winter. In winter, sage-grouse form same-sex-aggregated flocks (Beck 1977, but see Carpenter et al. 2010), and typically experience high over-winter survival (Beck et al. 2006), except during severe winters (Moynahan et al. 2006, Anthony and Willis 2009).

10
Recent studies provide important understandings of the response of wintering sage-grouse to oil and gas development (see Doherty et al. 2008, Carpenter et al. 2010, Dzialak et al. 2012). In general, sage-grouse avoid energy infrastructure, but the scale and type of avoidance (e.g., surface disturbance, well pad density, or distance to well pads) differed between studies and the impact of infrastructure avoidance to sage-grouse populations is not well understood. In addition, variation in avoidance response to natural gas wells among sage-grouse individuals has been documented, showing avoidance during the day, but not at night, suggesting avoidance of human activity (Dzialak et al. 2012). A winter study for sage-grouse in the Atlantic Rim area of south-central Wyoming and in northwestern Colorado indicates that survival risk for sage-grouse wintering near oil and gas infrastructure may be associated with characteristics of sagebrush communities in areas used by energy infrastructure-displaced sage-grouse (J. L. Beck, unpublished data). A study near Pinedale in southwest Wyoming recently investigated sage-grouse selection of wintering habitats from 2005 to 2010 relative to density and distance to natural gas field infrastructure, and activity levels associated with that infrastructure (M. J. Holloran, unpublished data). These results suggested sage-grouse avoided suitable winter habitats in areas with high well pad densities regardless of differences in activity levels associated with well pads; however, the results further suggested that avoidance distances around well pads with lower levels of human activity may have been less than distances around well pads with higher levels of activity. Additionally, a strong positive relationship between distance to drilling rig and average hours marked female sage-grouse spent in an area was observed, supporting the suggestion that sage-grouse were responding to human activity (M. J. Holloran, unpublished data). Avoidance of infrastructure such as wells and roads has also been shown to be variable among individuals (Dzialak et al. 2012). Doherty et al. (2008) found that sage-grouse were 1.3 times more likely to occupy sagebrush habitats lacking coal bed natural gas wells in the Powder River Basin of northeastern Wyoming within a 4-km2 area, compared to those that had the maximum allowed density of 12.3 wells per 4 km2 on federal lands. The scale of avoidance for sage-grouse from the study centered on grouse wintering near the Atlantic Rim and in northwestern Colorado for surface disturbance was 0.49 km (0.75-km²; J. L. Beck unpublished data). In southern Alberta, Carpenter et al. (2010) reported that distance to energy well was the most influential parameter driving sage-grouse selection in winter. No sage-grouse in this study was located closer than 1,293 m from a natural gas well. By comparison, using a RSF model, Carpenter et al. (2010) recommended a setback distance of ≥1,900 m be instituted for critical sage-grouse winter habitats identified with their resource selection modeling. In terms of seasonal stipulations, the Wyoming Governor’s Sage-Grouse Executive Order (State of Wyoming 2008, 2011) and The Bureau of Land Management (Bureau of Land Management 2012) have provided seasonal stipulations as follows: “Surface disturbing and or disruptive activities in sage-grouse WCAs are prohibited from December 1 to March 14 to protect core populations of sage-grouse that use these winter concentration habitats (BLM IM 2012).”
11
“Activity [production and maintenance activity exempted (emphasis added)] will be allowed from July 1 to March 14 outside of the 0.6 mile perimeter of a lek in core areas where breeding, nesting and early brood-rearing habitat is present. While the bulk of winter habitat necessary to support core sage-grouse populations likely occurs inside Core Population Areas, seasonal stipulations (December 1 to March 14) should be considered in locations outside core population areas where they have been identified as winter concentration areas necessary for supporting biologically significant numbers of sage-grouse nesting in Core population areas. All efforts should be made to minimize disturbance to mature sagebrush cover in identified winter concentration areas (Wyoming SGEO 2011-5).” These seasonal stipulations exempt human activities associated with production and maintenance. Given the incompatibility of sage-grouse and human activities associated with infrastructure in developed winter habitats, the Committee expressed concerns about the effectiveness of the winter stipulations that only apply during the drilling period and exclude the long-term production and maintenance activities that follow. The Committee felt that seasonal stipulations applied only during the drilling phase were not effective. Therefore, the Committee recommends that human activities associated with production and maintenance activities be reconsidered in the Executive Order. Given the lack of site-specific information at the NPL, the Committee agreed that we could not provide scientifically-supported recommendations regarding buffer distances around WCAs where infrastructure should be avoided or well density limits to reduce impacts to sage-grouse. However, the RSF approach we recommend offers the most useful tool to guide infrastructure siting, while improving our understanding of grouse avoidance patterns related to infrastructure sited on important winter habitat, and should be the foundation for future research investigating the efficacy of site-specific stipulations. 6.0 Utility of Various Data Sources In order to provide guidance to managers with interest in delineating WCAs, the Committee discussed the following question: “If you want to delineate WCAs for sage-grouse in other areas, what type of data would you collect?” This led the Committee to identify different data types and their potential utility. Below is a summary of our discussion outlining various data types and their advantages and disadvantages, as viewed by the Committee, for delineating WCAs for sage-grouse for other areas. The Committee stresses that the utility of all data are ultimately determined by the underlying sampling strategy used to collect the data. Even the most rigorous field methodology is not useful unless data are sampled and collected in an appropriate manner relative to the objective. One note is that the GPS-PTT, VHF, and aerial count data described below can be incorporated into the RSF approach we recommend. 6.1 GPS-PTT data. We considered GPS-PTT data to be the gold standard for collecting information about WCAs, when it is available, or possible to collect. Because it is possible to get detailed location information from radio-equipped birds, this method allows managers the opportunity to directly estimate the extent of area and habitats used. For example, it is possible to use the aforementioned Brownian bridge models (Horne et al. 2007) and kernel-based estimates (Kernohan et al. 2001) to define utilization distributions, which could directly delineate

12
the spatial distribution of sage-grouse on WCAs. As with other methods, it is important to sample appropriately, both in terms of the number of birds and the number and timing of locations for each bird. In addition to directly estimating the extent of area and habitat used on WCAs, it is possible to estimate home ranges, a RSF model, survival rates, corridor use and linkages between seasonal ranges, site fidelity, and individual variability in these metrics. The Committee also noted that use of GPS-PTTs can readily address day versus nighttime movements and resource use, which has been shown to differ for sage-grouse (Dzialak et al. 2012). Also, the technique provides a safer alternative to managers collecting data when compared with aerial flights because data can be downloaded remotely. During seasons beyond winter, these GPS-PTT units help identify new leks and more accurately determine the timing of nest initiation. Overall, the Committee noted that these GPS-PTTs allow managers to more completely understand the needs of sage-grouse while providing a rigorous and defensible data collection method to delineate WCAs and their boundaries when such data exist. There were several potential drawbacks identified by the Committee related to use of GPS-PTT data. First, unless there is an attempt to collect flock count data, it is unknown how many sage-grouse are located with the radio-equipped bird. That is, when collecting observations on radio-equipped birds remotely, we do not automatically collect information on flock size. A second concern related to cost. GPS-PTT units currently being used for sage-grouse can cost upwards of $3,750/each plus associated airtime fees, which are variable depending on download options. There are trade-offs between cost of GPS-PTT units and associated airtime fees and data necessary to delineate winter habitat. While the “per point” costs might be less for GPS-PTT tags when compared with VHF transmitters, it is important to consider that field costs for bi-monthly telemetry flights intended to delineate winter habitat will be much less than overall costs for GPS-PTT tags. Third, the use of GPS-PTT tags often restricts the number of birds that are marked and instead, there is tendency to have fewer marked birds, while collecting more locations per bird. Such an approach is problematic because a large number of locations on few birds limits inference. Managers should consider these trade-offs and must consider their objectives before selecting this advanced technology. Fourth, there were questions about whether GPS-PTT units negatively affect female sage-grouse survival and this issue should be addressed further. 6.2 VHF data. Similar to GPS-PTT units, one can also use VHF transmitters to collect sage-grouse locations from individual birds. However, the manual nature of data collection often precludes addressing fine-scale questions regarding use of a WCA, such as corridor use between seasonal ranges. The ability to address these fine-scale questions is dependent on the ability of the researcher to record observations in the field. For example, it would prove difficult to estimate corridor use of sage-grouse with VHF transmitters unless birds were continuously monitored in the field. However, it would be possible to estimate survival rates using data provided by VHF data. Further, it is possible to collect data to estimate home range, site fidelity, and individual variability in these metrics as long as enough data are collected. Managers could use VHF transmitters to locate birds and count flock sizes and such an application was viewed favorably by the Committee. In situations where funds are limited, fitting sage-grouse with VHF units could be coupled with repeated aerial flights in the winter to effectively determine the location of WCAs. Such an approach could result in an adequate sample of individuals, while giving managers a cost effective option to data collection. The optimal number of radio-tags is
13
dependent on flock size and number of WCAs in a region, in addition to factors such as fidelity to flocks. Projects involving VHF radiotelemetry could result in a rigorous and defensible data collection method to delineate WCAs in the manner recommended here. 6.3 Aerial flights. Aerial flights, including both fixed wing and helicopter flights, can be used to locate and count flocks of sage-grouse on WCAs. The use of fixed wing aircraft is cheaper and more readily available for use, but is more likely to have detection biases (i.e., no flushing of birds for counting). In contrast, helicopter flights are more costly and less available, but have the advantage of increasing detection of sage-grouse during flights. In addition to spotting and counting birds during aerial flights such as those used in the NPL (i.e., count flocks along transects), it is also possible to obtain sage-grouse location and count data using infrared technology during aerial flights. Using fixed wing aircraft with infrared ability might alleviate concerns noted above about flushing sage-grouse and should be further evaluated as a tool to monitor sage-grouse populations. Although the Committee viewed the aerial surveys conducted in the NPL to be adequate to delineate WCAs, we recommend that managers collect distance measurements (i.e., distance from helicopter to observed sage-grouse) to determine if distance from sage-grouse flocks and the helicopter and/or sage-grouse flock size is a source of bias when using this technique. 6.4 Sign-count data. There are several sources of sign that could be used to determine the presence of sage-grouse. In addition to tracks identified during aerial flights, others have counted sage-grouse pellets (Schroeder and Vander Haegen 2011) to determine presence and habitat use. These methods are often prone to observation bias and convenience sampling, although careful sampling (Schroeder and Vander Haegen 2011) can produce useful results. As with other methods, we stress the importance of rigorous sampling designs to collect these data. While the Committee felt sign-count data could be used as confirmatory evidence that sage-grouse exist at a site, there were also many problems noted with these data. The primary issue when using pellet counts relates to the timing of deposition. Unless one clears plots of fecal samples and returns during the season of interest, it is impossible to determine when the sample was deposited. Second, it might prove difficult to obtain fecal samples over a large area because it is labor-intensive. Last, there are detectability issues with collecting pellets. Snow track data are quite vulnerable to bias associated with detectability because of snow and wind conditions. New snow and windy conditions will inevitably result in a loss of tracks. It is also difficult to record tracks during aerial flights because of the continuous nature of the track data. Neither technique provides information about the abundance of birds. While tracks can provide confirmatory evidence of sage-grouse presence on WCAs, we do not advocate their use in delineating the boundaries of WCAs. 6.5 Wildlife observation system. The state of Wyoming has a wildlife observation system that provides information about the presence of wildlife species throughout the state. These data are collected using numerous methods such as ancillary observations during big game counts to observations made from roads. The system provides data using opportunistic sampling methods. Such data can be used as confirmatory evidence of wildlife existence at locations, but lacks the necessary resolution, sampling requirements, and objectivity necessary to rigorously delineate
14
WCAs. Although the Committee sees utility in the system for many purposes, we do not advocate using data from the wildlife observation system alone to delineate WCAs. 7.0 Literature Cited Anthony, R. G., and M. J. Willis. 2009. Survival rates of female greater sage-grouse in autumn
and winter in southeastern Oregon. Journal of Wildlife Management 73:538-545. Back, G. N., M. R. Barrington, and J. K. McAdoo. 1987. Sage grouse use of snow burrows in
northeastern Nevada. The Wilson Bulletin 99:488-490. Beck, J. L., K. P. Reese, J. W. Connelly, and M. B. Lucia. 2006. Movements and survival of
juvenile greater sage-grouse in southeastern Idaho. Wildlife Society Bulletin 34:1070-1078.
Beck, T. D. I. 1977. Sage grouse flock characteristics and habitat selection in winter. Journal of Wildlife Management 41:18-26.
Berry, J., D. Berry, and R. L. Eng. 1985. Movements and fidelity to seasonal use areas by female sage grouse. Journal of Wildlife Management 49:237-240.
Bruce, J. R., W. D. Robinson, S. L. Peterson, and R. F. Miller. 2011. Greater sage-grouse movements and habitat use during winter in central Oregon. Western North American Naturalist 71:418-424.
Buckland, S. T., D. R. Anderson, K. P. Burnham, and J. L. Laake. 1993. Distance sampling: estimating abundance of biological populations. Chapman and Hall, London, UK.
Bureau of Land Management. 2012. Greater sage-grouse habitat management policy on Wyoming Bureau of Land Management (BLM) administered public lands including the Federal Mineral Estate. Instruction Memorandum No. WY-2012-019.
Carpenter, J., C. Aldrige, and M. S. Boyce. 2010. Sage-grouse habitat selection during winter in Alberta. Journal of Wildlife Management 74:1806-1814.
Connelly, J. W., H. W. Browers, and R. J. Gates. 1988. Seasonal movements of sage grouse in southeastern Idaho. Journal of Wildlife Management 52:116-122.
Connelly, J. W., S. T. Knick, M. A. Schroeder, and S. J. Stiver. 2004. Conservation assessment of greater sage-grouse and sagebrush habitats. Western Association of Fish and Wildlife Agencies. Unpublished Report. Cheyenne, Wyoming.
Connelly, J. W., K. P. Reese, and M. A. Schroeder. 2003. Monitoring of greater sage-grouse habitats and populations. Univ. of Idaho College of Natural Resources Experiment Station Bulletin 80. 50 pp.
Doherty, K. E., D. E. Naugle, B. L. Walker, and J. M. Graham. 2008. Greater sage-grouse winter habitat selection and energy development. Journal of Wildlife Management 72:187-195.
Dzialak, M. R., C. V. Olson, S. M. Harju, S. L. Webb, and J. B. Winstead. 2012. Temporal and hierarchical spatial components of animal occurrence: conserving seasonal habitat for greater sage-grouse. Ecosphere 3(4):30.
Dzialak, M. R., S. L. Webb, S. M. Harju, C. V. Olson, J. B. Winstead, and L. D. Hayden-Wing. 2013. Greater sage-grouse and severe winter conditions: identifying habitat for conservation. Rangeland Ecology and Management 66:10-18.
Eng, R. L., and P. Schladweiler. 1972. Sage grouse winter movements and habitat use in central Montana. Journal of Wildlife Management 36:141-146.
15
Fedy, B. C., C. L. Aldridge, K. E. Doherty, M. O’Donnell, J. L. Beck, B. Bedrosian, M. J. Holloran, G. D. Johnson, N. W. Kaczor, C. P. Kirol, C. A. Mandich, D. Marshall, G. McKee, C. Olson, C. C. Swanson, and B. L. Walker. 2012. Interseasonal movements of greater sage-grouse, migratory behavior, and an assessment of the core regions concept in Wyoming. Journal of Wildlife Management 76:1062-1071.
Fedy, B.C., K. E. Doherty, C. L. Aldridge, M. O’Donnell, J. L. Beck, B. Bedrosian, D. L. Gummer, M. J. Holloran, G. D. Johnson, N. W. Kaczor, C. P. Kirol, C. A. Mandich, D. Marshall, G. McKee, C. Olson, A. C. Pratt, C. C. Swanson, and B. Walker. In revision. Habitat prioritization across large landscapes, multiple seasons, and novel areas: an example using greater sage-grouse in Wyoming. Wildlife Monographs.
Frye, G. G., J. W. Connelly, D. D. Musil, and J. S. Forbey. 2013. Phytochemistry predicts habitat selection by an avian herbivore at multiple spatial scales. Ecology 94:308-314.
Homer, C. G., T. C. Edwards, Jr., R. D. Ramsey, and K. P. Price. 1993. Use of remote sensing methods in modeling sage grouse winter habitat. Journal of Wildlife Management 57:78-84.
Horne, J. S., E. O. Garton, S. M. Krone, and J. S. Lewis. 2007. Analyzing animal movements using Brownian bridges. Ecology 88:2354-2363.
Johnson, M. D. 2007. Measuring habitat quality: a review. Condor 109:489-504. Kernohan, B. J., R. A. Gitzen, and J. J. Millspaugh. 2001. Analysis of animal space use and
movements. Pages 125-166 in J. J. Millspaugh and J. M. Marzluff, editors. Radio Tracking and Animal Populations. Academic Press, San Diego, California, USA.
Lele, S. R., and J. L. Keim. 2006. Weighted distributions and estimation of resource selection probability functions. Ecology 87:3021-3028.
Manly, B. F. J., L. L. McDonald, D. L. Thomas, T. L. McDonald, and W. P. Erickson. 2002. Resource selection by animals. Kluwer Academic Publishers, Dordrecht, The Netherlands.
Millspaugh, J. J., and F. R. Thompson, III, editors. 2009. Models for planning wildlife conservation in large landscapes. Elsevier Science, San Diego, California, USA.
Moynahan, B. J., M. S. Lindberg, and J. W. Thomas. 2006. Factors contributing to process variance in annual survival of female greater sage-grouse in Montana. Ecological Applications 16:1529-1538.
Nielson, R. M., H. Sawyer, and T. L. McDonald. 2011. BBMM: Brownian bridge movement model for estimating the movement path of an animal using discrete location data, R package version 2.2, 21.4.2011, Available from:
http://CRAN.Rproject.org/package=BBMM Remington, T. E., and C. E. Braun. 1985. Sage grouse food selection in winter, North Park,
Colorado. Journal of Wildlife Management 49:1055-1061. Remington, T. E., and C. E. Braun. 1988. Carcass composition and energy reserves of sage
grouse during winter. Condor 90:15-19. Rota, C. T., J. J. Millspaugh, D. C. Kesler, C. P. Lehman, M. A. Rumble, and C. M. Bodinof.
2013. A re-evaluation of a case-control model with contaminated controls to estimate resource selection probability functions. Journal of Animal Ecology: In press.
Schroeder, M. A., and W. M. Vander Haegen. 2011. Response of greater sage-grouse to the Conservation Reserve Program in Washington state. Pages 517-529 in S. T. Knick and J. W. Connelly, editors. Greater sage-grouse: ecology and conservation of a landscape species and its habitats. Studies in Avian Biology (Vol. 38), University of California Press, Berkeley, California, USA.
16
State of Wyoming. 2008. Office of Governor Freudenthal. State of Wyoming Executive Department Executive Order. Greater Sage Grouse Area Protection. 2008-02.
State of Wyoming. 2011. Office of Governor Mead. State of Wyoming Executive Department Executive Order. Greater Sage Grouse Area Protection. 2011-05.
USDI Bureau of Land Management (BLM). 2012. Greater sage-grouse habitat management policy on Wyoming Bureau of Land Management administered public lands including the federal mineral estate. Wyoming BLM, Cheyenne, USA.
Wallestad, R. O., J. G. Peterson, and R. L. Eng. 1975. Foods of adult sage grouse in central Montana. Journal of Wildlife Management 39:628-630.
Welch, B. L., F. J. Wagstaff, and J. A. Roberson. 1991. Preference of wintering sage grouse for big sagebrush. Journal of Range Management 44:462-465.
White, G. C., and T. M. Shenk. 2001. Population estimation with radio-marked animals. Pages 330-350 in J. J. Millspaugh and J. M. Marzluff, editors. Radio Tracking and Animal Populations. Academic Press, San Diego, California, USA.
17
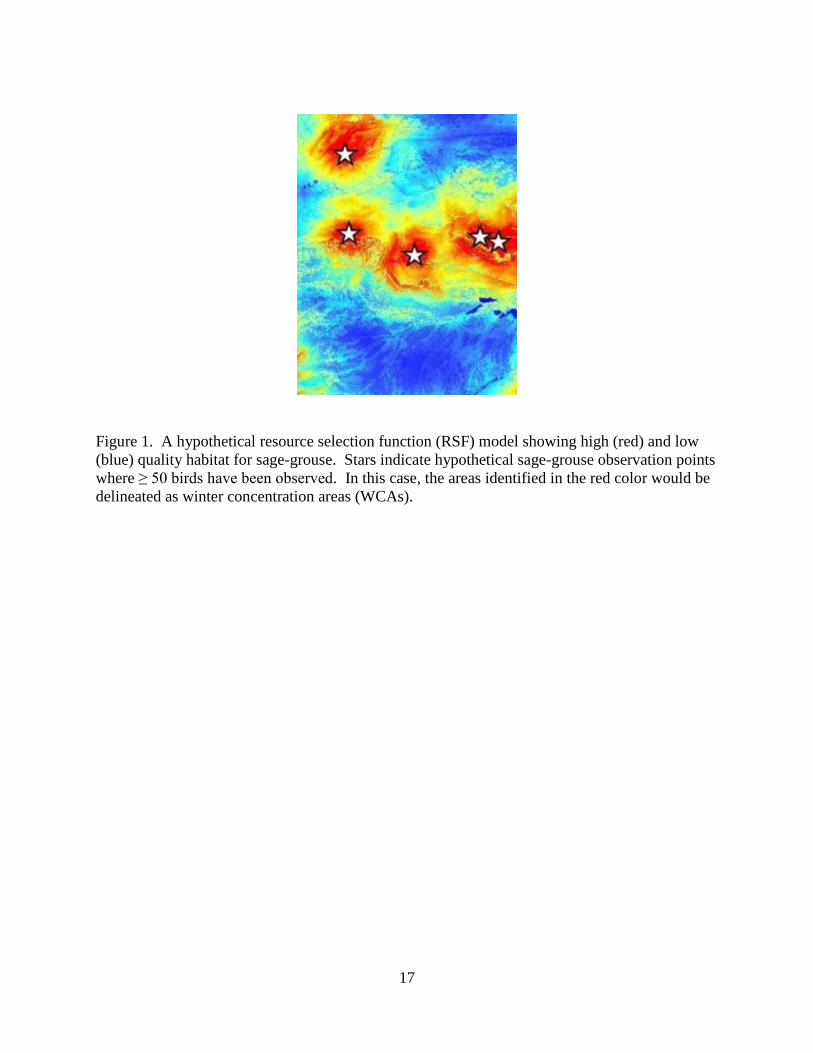
Figure 1. A hypothetical resource selection function (RSF) model showing high (red) and low (blue) quality habitat for sage-grouse. Stars indicate hypothetical sage-grouse observation points where ≥ 50 birds have been observed. In this case, the areas identified in the red color would be delineated as winter concentration areas (WCAs).

18
Figure 2. An example of current delineation compared with refined delineation of winter concentration areas for sage-grouse based on resource selection functions. It is expected that modifications to concentration area designation would more adequately capture high quality habitat around sage-grouse observation points.
19
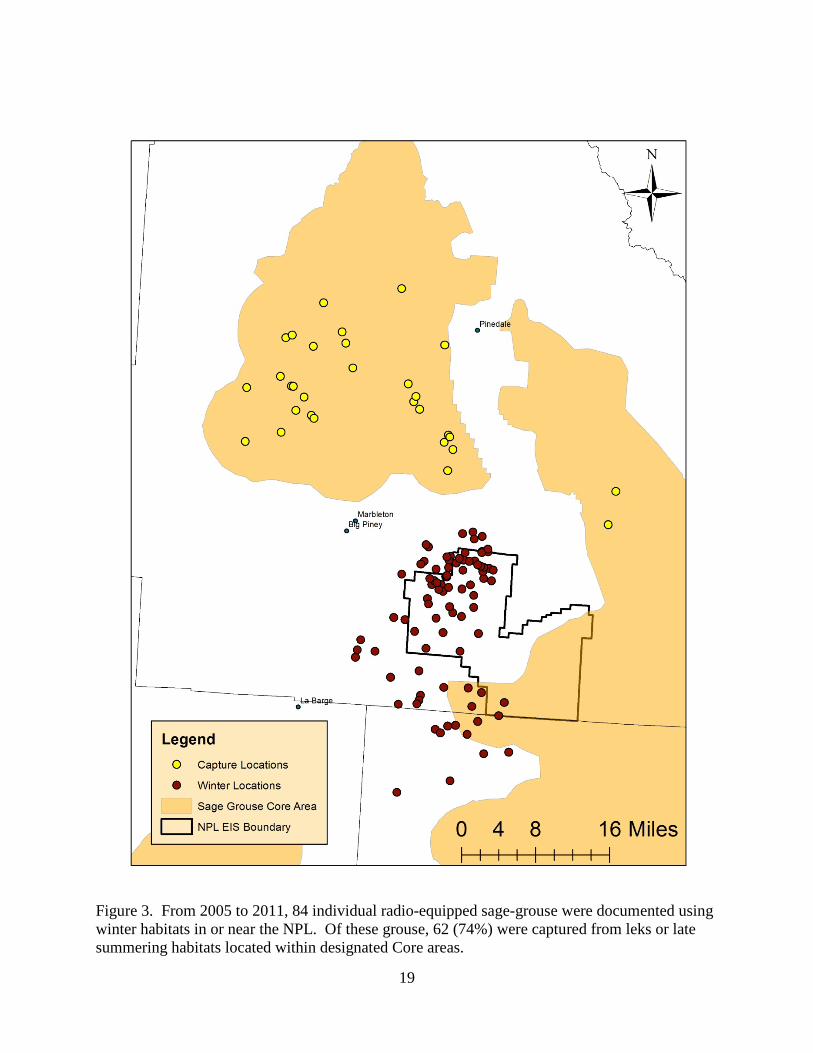
Figure 3. From 2005 to 2011, 84 individual radio-equipped sage-grouse were documented using winter habitats in or near the NPL. Of these grouse, 62 (74%) were captured from leks or late summering habitats located within designated Core areas.


