The Open-source Eclipse Plugin for Force.com Development, Summer ‘14
41 CONTAINER MONITORING & MANAGEMENT
IDENTIFYING AND COLLECTING CONTAINER DATAby RUSS MCKENDRICK
With the introduction of containers and microservices, moni-toring solutions have to handle more ephemeral services and server instances than ever before. And while the infrastruc-
ture landscape has changed, operations teams still need to monitor the same information on the central processing unit (CPU), random access memory (RAM), hard disk drive (HDD), network utilization, and the avail-ability of application endpoints.
While you can use an older tool or existing monitoring service for traditional infrastructures, there are newer cloud-based offerings that can ensure monitoring solutions are as scalable as the services being built and monitored. Many of these cloud-based and self-hosted tools are purpose-built for containers. No matter what solution or service you use, you still need to know how you’re going to collect the metrics you’re looking to monitor.
There are quite a few options when it comes to collecting metrics from your containers. This article overviews some of the the services available for container monitoring. We’ve included a mixture of self-hosted open

42 CONTAINER MONITORING & MANAGEMENT
IDENTIFYING AND COLLECTING CONTAINER DATA
source solutions and commercial cloud-based services to reflect the current landscape.
However, it’s important to keep in mind that we’ve included a relatively small amount of examples compared to the wide variety of solutions available. These examples are meant to be illustrative of a few different ways to approach the problem of collecting metrics.
DockerThe Docker engine itself provides access to most of the core metrics we’re looking to collect as part of its native monitoring functions. Running the docker stats command will give you access to CPU, memory, network
FIG 1: Running the docker stats command.
and disk utilization for all of the containers running on your host.
The data streams automatically and is useful if you need to get a quick overview of your containers at any given moment. There are a few flags you can add, for example:
• The flag --all shows you stopped containers, though you won’t see any metrics for them.
• The flag --no-stream displays the output of the first run and then stops the stream of metrics.
There are some disadvantages. For one, the data isn’t stored anywhere — you can’t go back and review the metrics. It can also be tedious watching a constantly refreshing terminal with no points of reference. It’s
43 CONTAINER MONITORING & MANAGEMENT
IDENTIFYING AND COLLECTING CONTAINER DATA
hard to spot what’s going on in the data.Luckily, the docker stats command is actually an interface to the stats API endpoint. The stats API exposes all of the information in the stats command and more. To view for yourself, run the following command:
curl --unix-socket /var/run/docker.sock...
http:/containers/container_name/stats
As you’ll be able to see from the output, there is a lot more information being returned, all wrapped in a JavaScript Object Notation (JSON) array, which is ready to be ingested by third-party tools.
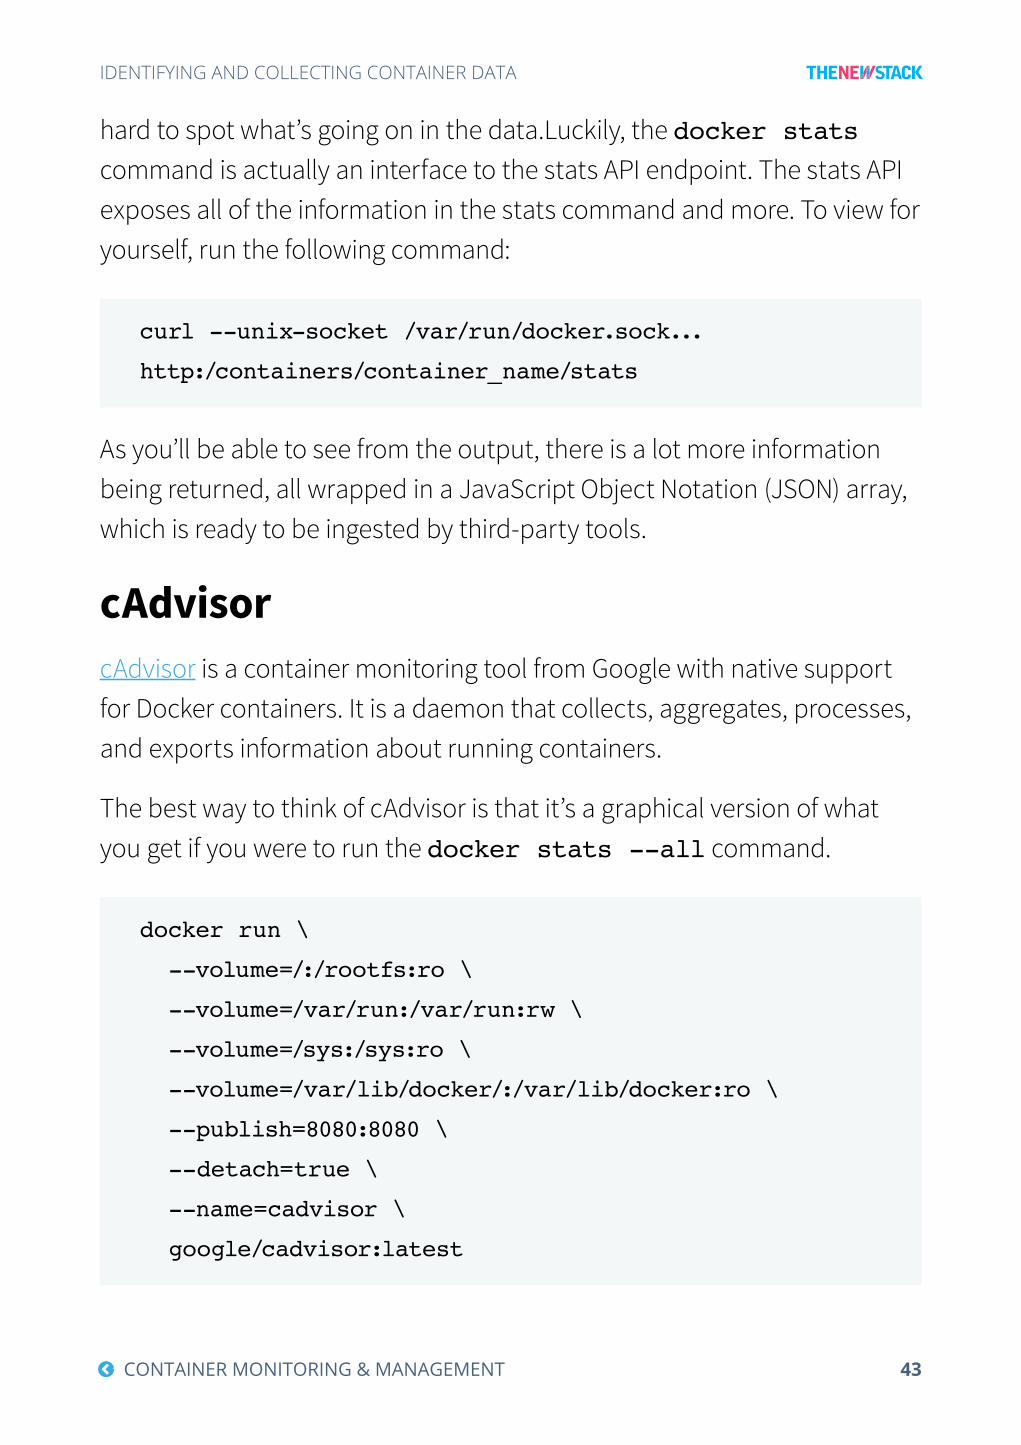
cAdvisorcAdvisor is a container monitoring tool from Google with native support for Docker containers. It is a daemon that collects, aggregates, processes, and exports information about running containers.
The best way to think of cAdvisor is that it’s a graphical version of what you get if you were to run the docker stats --all command.
docker run \
--volume=/:/rootfs:ro \
--volume=/var/run:/var/run:rw \
--volume=/sys:/sys:ro \
--volume=/var/lib/docker/:/var/lib/docker:ro \
--publish=8080:8080 \
--detach=true \
--name=cadvisor \
google/cadvisor:latest

44 CONTAINER MONITORING & MANAGEMENT
IDENTIFYING AND COLLECTING CONTAINER DATA
cAdvisor is easy to get up and running, as it is shipped in a single container. All you have to do is run the above command to launch a cAdvisor container and expose the web interface on port 8080.
Once launched, cAdvisor will hook itself into the Docker daemon running on your host machine and start gathering metrics for all of your running containers, including the cAdvisor container itself. Opening http://localhost:8080/ in a browser will take you straight to the web interface.
FIG 2: Accessing the localhost web interface.
As you can see from Figure 2, there is a minute’s worth of data being streamed in real time; however, you can’t view any metrics further back with just a standard installation of cAdvisor. Luckily, Google has you covered by including options to export the data from cAdvisor into time series databases such as Elasticsearch, InfluxDB, BigQuery and Prometheus.

45 CONTAINER MONITORING & MANAGEMENT
IDENTIFYING AND COLLECTING CONTAINER DATA
To sum up, cAdvisor is a great tool for getting quick insight into what’s happening with your running containers. It is simple to install and gives you more granular metrics than Docker does out of the box. It can also act as a monitoring agent for other tools in the same way that Zabbix or Nagios agents were used in the past.
PrometheusPrometheus is an open source monitoring system and time series database originally built by SoundCloud. It is currently hosted by the Cloud Native Computing Foundation (CNCF), alongside other projects such as Kubernetes and OpenTracing. Upon reading the description of the service, it may sound like quite a traditional server and agent setup; however, Prometheus works differently. Rather than having its own agent, it scrapes data from the data points on hosts, storing it in its own time series database.
At the end of October 2016, a pull request to expose a metrics endpoint in the Docker Engine itself was merged. This likely means that an upcoming release of Docker will have support for Prometheus to scrape your container metrics out of the box; however, until that release, you need to use an intermediary service such as cAdvisor. As of 1.13, the Docker engine supports an optional “/metrics” Prometheus endpoint. It’s important to note that this currently exposes internal Docker Engine metrics versus container metrics. There is ongoing discussion about expanding this to cover container metrics, and possibly replacing the Stats API altogether.
Prometheus’s biggest strength is as a data source. You can front the data being scraped by Prometheus with Grafana, which has supported Prometheus since mid-2015, and is now the recommended frontend for Prometheus. Like most of the tools we are looking at, Grafana can also be launched as a container.

46 CONTAINER MONITORING & MANAGEMENT
IDENTIFYING AND COLLECTING CONTAINER DATA
Once up and running, the only configuration needed is to add your Prometheus URL as a data source, then import one of the predefined Prometheus dashboards.
FIG 3: Metrics stored in Prometheus and displayed with Grafana.
The dashboard in Figure 3 displays over an hour of metrics from cAdvisor, which are stored in Prometheus and rendered in Grafana. As Prometheus

47 CONTAINER MONITORING & MANAGEMENT
IDENTIFYING AND COLLECTING CONTAINER DATA
is essentially taking snapshots of the current cAdvisor state, it’s are also recording metrics for containers long since removed.
Prometheus also has alerting capabilities. By using the inbuilt reporting language, you can create alerts such as the following:
ALERT InstanceDown
IF up == 0
FOR 5m
LABELS { severity = “page” }
ANNOTATIONS {
summary = “Instance {{ $labels.instance }} down”,
description = “{{ $labels.instance }} of job {{
$labels.job }} has been down for more than 5 minutes.”,
}
Once your alert has been written and deployed on the Prometheus server, you can use the Prometheus Alertmanager to route your alerts. In the example above, we have assigned a label of severity = “page”. Alertmanager will intercept the alert and forward it to a service such as PagerDuty, OpsGenie, a Slack or HipChat channel, or any number of different endpoints.
Prometheus is a powerful platform and works brilliantly as a middleman between different technologies. It is easy to start off with a basic installation, like the one described above, then expand it, giving a single pane of glass view of both your container and host instances.
Agentless System CrawlerAgentless System Crawler (ASC) is a cloud monitoring tool from IBM with support for containers. It collects monitoring information from running

48 CONTAINER MONITORING & MANAGEMENT
IDENTIFYING AND COLLECTING CONTAINER DATA
containers including metrics, system state and configuration information. ASC provides deep visibility into containers, beyond just utilization and performance metrics, for security and configuration analytics. It is designed as a pipeline for building collection plugins for container features, function plugins for on-the-fly data aggregation or analysis, and output plugins for target monitoring and analytics endpoints. Provided plugins include traditional data collection features such as utilization metrics, processes running in the container and listening on a port, and data about the configuration file and application packages.
ASC can be deployed either as a Python package or as a single container with privileges. For example, ASC operates by interacting with the Docker daemon, container cgroups and namespaces. Here is how you can launch ASC as a container:
docker run \
--privileged \
--net=host \
--pid=host \
-v /cgroup:/cgroup:ro \
-v /var/lib/docker:/var/lib/docker:ro \
-v /sys/fs/cgroup:/sys/fs/cgroup:ro \
-v /var/run/docker.sock:/var/run/docker.sock \
-it crawler --crawlmode OUTCONTAINER ${CRAWLER_ARGS}
Once running, it subscribes to the Docker daemon for events and periodically monitors all the containers running in the system. ASC can be easily extended with plugins for custom data collection, which helps to collect both container and environment information. Each plugin simply exports a crawl() method for their specific monitored feature; ASC iterates over each crawl() function implemented by the collection

49 CONTAINER MONITORING & MANAGEMENT
IDENTIFYING AND COLLECTING CONTAINER DATA
plugins enabled in its deployed configuration. ASC can be currently configured to emit data to Kafka, Graphite, filesystem and the console as endpoints, and allows for additional output plugins. Figure 4 shows an example view from an ASC configuration, emitting container data to a Graphite/Grafana endpoint.
One use case of ASC monitoring is to gain deeper insight into container execution. The following example shows the basic output frame of ASC when configured to collect the process and connection features of a container in addition to base metrics. Based on this frame, we can see that this is a container running at 100 percent CPU utilization, with a single Python process listening on port 5000.
metadata “metadata” {“id”:”ef0fc187dc0a4b85a3cb”, …}
cpu “cpu-0” {… ,”cpu_util”:100.0}
process “python/1” {“cmd”:”python web.py”,
“python”,”pid”:74, …}
connection “74/127.0.0.1/5000” {“pid”:74,…,”connstatus”:”LISTEN”}
This enables users to couple monitoring with system state for better understanding of container behavior and to drive additional analytics. For
FIG 4: View of ASC Container Monitoring with Graphite/Grafana Endpoint.

50 CONTAINER MONITORING & MANAGEMENT
IDENTIFYING AND COLLECTING CONTAINER DATA
instance, we can dig deeper into the Python process used in the container and track the underlying Python packages used by the application by enabling another feature plugin, “python-package” in this case, which gives us the additional insight on the used packages and versions in the application:
python-package “click” {“ver”:”6.6”,”pkgname”:”click”}
python-package “Flask” {“ver”:”0.11.1”,”pkgname”:”Flask”}
python-package “itsdangerous” {“ver”:”0.24”,”pkgname”:”itsdangerous”
python-package “Jinja2” {“ver”:”2.8”,”pkgname”:”Jinja2”}
python-package “pip” {“ver”:”8.1.2”,”pkgname”:”pip”}
python-package “setuptools” {“ver”:”20.8.0”,”pkgname”:”setuptools”
python-package “Werkzeug” {“ver”:”0.11.11”,”pkgname”:”Werkzeug”}
In summary, ASC is a simple tool to set up and use; it’s similar to cAdvisor for gaining visibility into running containers. In addition to basic monitoring metrics, ASC puts a lot of emphasis on deep visibility into container state and configuration to enable monitoring, security and other analytics solutions. It provides a simple, plugin-based approach for extensibility of data collection and support for different endpoints.
Open Source SysdigSysdig is an open source solution which installs a kernel module on your host machine. The service hooks into the host’s kernel, which means it doesn’t entirely rely on getting metrics from the Docker daemon.
Using Csysdig, the built-in ncurses-based command interface, you can view all sorts of information on your host. For example, running the command csysdig -vcontainers gives you the view in Figure 5.
As you can see, this shows all containers running on the host. You can also

51 CONTAINER MONITORING & MANAGEMENT
IDENTIFYING AND COLLECTING CONTAINER DATA
FIG 5: Using Sysdig’s command interface.
drill down into a container to see what resources individual processes are consuming. Much like running the docker stats command and using cAdvisor, the open source version of Sysdig is about getting a real-time view of your containers; however, you are able to record and replay system activity using the following:
• The command sysdig -w trace.scap records the system activity to a trace file.
• The command csysdig -r trace.scap replays the trace file.
The open source version of Sysdig is not your traditional monitoring tool; it allows you to drill down into your containers, giving access to a wider range of information. It also allows you to add orchestration context by hooking directly into your orchestrator, thereby allowing you to troubleshoot by pod, cluster, namespace, etc.
CA Application Performance ManagementDynamic microservices and the ephemeral nature of containers has guided the unique architecture of CA Application Performance Management. Recognizing that traditional static topology mapping and instrumentation best suited for monolithic systems has less relevance for microservices, CA APM employs a radical, future-proofing approach
52 CONTAINER MONITORING & MANAGEMENT
IDENTIFYING AND COLLECTING CONTAINER DATA
to managing containerized systems. Fundamental to this approach is fast, simplified configuration and visibility into modern system complexity, especially microservice interdependencies and communication flows.
CA APM for microservice architectures is a multi-faceted monitoring solution. As a foundational service, agentless monitoring automates the discovery of containers and dependencies, immediately surfacing key health indicators, such as CPU saturation, error rates and latency. A powerful service it itself, this solution is further enhanced by the automated capture of container attributes and a data model that enables microservice performance to be viewed from multiple perspectives. This approach is well matched to microservices architectures, since engineers can quickly and easily distil complex topologies into service views where performance is automatically aggregated.
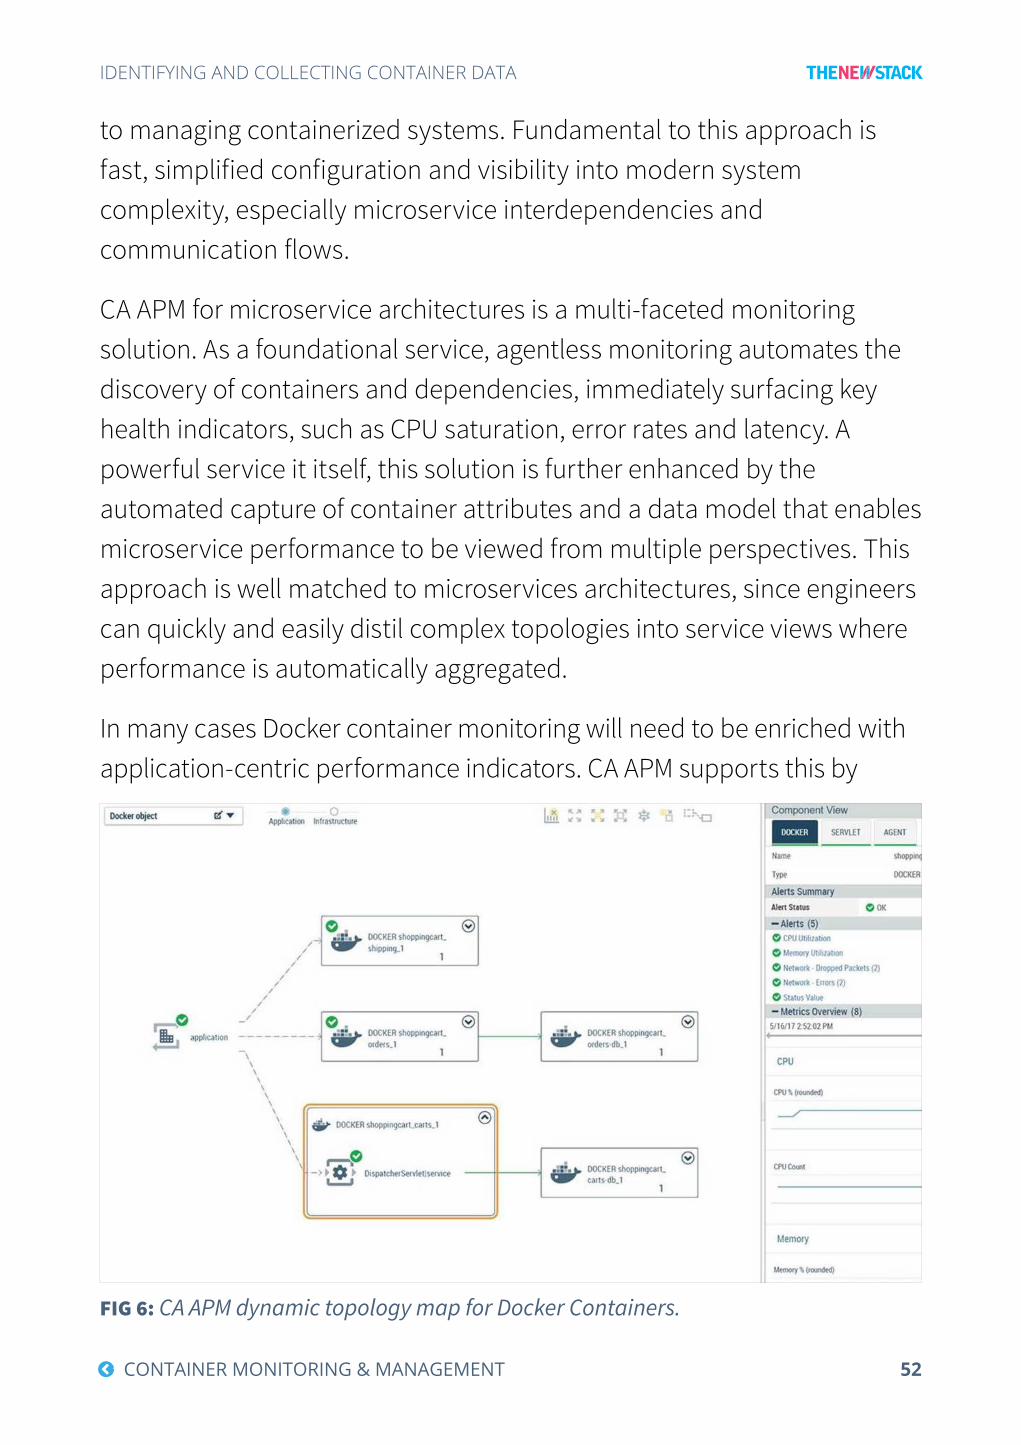
In many cases Docker container monitoring will need to be enriched with application-centric performance indicators. CA APM supports this by
FIG 6: CA APM dynamic topology map for Docker Containers.

53 CONTAINER MONITORING & MANAGEMENT
IDENTIFYING AND COLLECTING CONTAINER DATA
enabling application instrumentation within containers. This allows access to advanced application performance services in context of supporting microservice architectures. For example, statistical techniques can manage performance baselining and reduce alert noise, while transaction tracing and assisted triage can gather detailed evidence and builds remediation workflows.
Agentless container-centric monitoring and deeper application instrumentation are valuable services in themselves, but CA APM combines the information they expose to deliver higher level insights. By automatically correlating application performance to container health, CA APM not only provides DevOps teams with exact problem root cause indicators, but also details which container-application configurations deliver the best possible performance.
Other Tools for Collecting DataThere are services that can collect, collate and report on metrics from your containers and host instances. Here’s an overview of other tools available. There are many more in the Container Monitoring Directory.
Other Tools for Collecting DataVendor Solution Description
CoScale CoScale is a full-stack monitoring cloud service that monitors the responsiveness of applications. It combines server and container resource metrics with application-specific performance metrics. Its lightweight agents have little overhead.
Datadog Datadog is a full-stack cloud-based monitoring and alerting service for IT operations and development teams. It has containerized agents that can monitor container environments.
Dynatrace Dynatrace has a new suite of monitoring tools, based on its Ruxit technology, for container monitoring and alerting. Its agent is injected into a container, where it can then auto-discover new services running on a host and fetch data from the Docker API. Dynatrace is also developing artificial intelligence technology to help with root cause analysis.
Elastic Beats are single-purpose data shippers that install as lightweight agents and send data from machines to Logstash or Elasticsearch. Dockbeat is the shipper for Docker containers.

54 CONTAINER MONITORING & MANAGEMENT
IDENTIFYING AND COLLECTING CONTAINER DATA
ConclusionAll of the tools we’ve covered will be able to get you started with container visibility and monitoring. It’s up to you to decide what combination of tools is needed to collect the information that will help you monitor and optimize your applications and systems. We covered the basics that everyone needs to know, which includes using the native functionality of Docker’s Stats API and cAdvisor. That will go a long way towards introducing users to the basic necessities of monitoring containers.
There are many ways to monitor containers, and solution vendors have opinionated ways of solving these problems. You might see this as a choice between open source and SaaS solutions, but it has more to do with finding the combination of solutions that fits your workload. No matter how you ultimately build your monitoring stack, you still need to know how to collect the metrics you’re looking to monitor.
TABLE 1: There are a variety of other tools and solutions that can be used for identify-ing and collecting container data.
Other Tools for Collecting DataVendor Solution Description
InfluxData Telegraf is an open source agent that collects metrics with a Docker plugin; it’s part of the stack that InfluxData is creating to collect and analyze metrics. The metrics are sent to InfluxDB or a variety of outputs.
New Relic New Relic has updated its suite of products around their Digital Intelligence Platform for application and infrastructure performance. Its agent-based approach is particularly good for troubleshooting code-related application performance issues.
Sematext Sematext has a Docker-native monitoring and log collection agent that collects and processes Docker metrics, events and logs for all cluster nodes and all auto-discovered containers. It has its own log management solution as well as performance monitoring service.
SignalFx SignalFX has a collectd-docker plugin that captures metrics about CPU, memory, network, and disk using Docker’s stats API. SignalFx has built-in Docker monitoring dashboards, which let you add dimensions (tags) metadata to aggregate, filter, and group metrics by property.