Wake County Public School System Academically Intellectually Gifted Program
275
Gifted Child QuarterlyVolume 52 Number 4
Fall 2008 275-296© 2008 National Association for
Gifted Children10.1177/0016986208321808
http://gcq.sagepub.comhosted at
http://online.sagepub.com
Identifying Academically Gifted English-Language Learners Using Nonverbal Tests
A Comparison of the Raven, NNAT, and CogAT
David F. LohmanKatrina A. KorbJoni M. LakinUniversity of Iowa
Abstract: In this study, the authors compare the validity of three nonverbal tests for the purpose of identifyingacademically gifted English-language learners (ELLs). Participants were 1,198 elementary children(approximately 40% ELLs). All were administered the Raven Standard Progressive Matrices (Raven), the NaglieriNonverbal Ability Test (NNAT), and Form 6 of the Cognitive Abilities Test (CogAT). Results show that the U.S.national norms for the Raven substantially overestimate the number of high-scoring children; that because oferrors in norming, the NNAT overestimates the number of both high-scoring and low-scoring children; thatprimary-level ELL children score especially poorly on the NNAT; that the standard error of measurement wastwice as large for the NNAT as for the Raven or the CogAT; that ELL children scored .5 to .67 standard deviationslower than non-ELL children on the three nonverbal tests; and that none of the nonverbal tests predict achievementfor ELL students very well.
Putting Research to Use: Do nonverbal reasoning tests level the field for ELL children? Many practitionershave assumed that they do. However ELL children in this study scored 8 to 10 points lower than non-ELLchildren on the three nonverbal tests. The study also shows that practitioners cannot assume that nationalnorms on the tests are of comparable quality. When put on the same scale as CogAT, Raven scores averaged10 points higher than CogAT and NNAT scores. For NNAT, the mean is correct but the variability was up to40% too large. Thus, when using national norms, both the Raven and NNAT will substantially overestimatethe number of high-scoring children.
Keywords: identification; English-language learners; nonverbal tests
English-language learners (ELLs) are underrepre-sented in programs that serve gifted students.
Because of this, program administrators havesearched for alternative procedures for identifyingacademic talent that would increase the representa-tion of these children in their programs (Ford &Harris, 1999; Frasier, García, & Passow, 1995). Mostof these procedures rely heavily or exclusively ongroup-administered, nonverbal reasoning tests.
Nonverbal tasks have long formed an importantpart of both individual intelligence tests such as theWechsler Scales (e.g., Wechsler, 1949) and groupability tests such as the Lorge-Thorndike Intelligence
Tests (Lorge, Thorndike, & Hagen, 1964). Scores onthe nonverbal batteries of these tests provided oneindicator of ability for native speakers of the languagebut often served as the only measure of ability forexaminees who were not fluent speakers of the lan-guage. The nonverbal test enabled examiners to interpretthe scores of all examinees—both those with languagedifficulties and those without such difficulties—usingthe same norms tables.
The question, then, is not whether nonverbal testsshould be administered to ELL children. All wouldagree that such tests can provide helpful information.Rather, the issue is whether nonverbal tests should provide
at The University of Iowa Libraries on October 7, 2008 http://gcq.sagepub.comDownloaded from
the only estimate of ability or if other measures of abilityshould be used to provide additional information abouta student’s academic aptitude. Additional measures arenot needed if nonverbal tests can adequately capturethe aptitude constructs of interest.
Differential psychologists have long cautioned thatnonverbal reasoning tests do not capture the sameability construct that is measured by tests that use lan-guage (Anastasi & Urbina, 1997) and thereforeshould not be used alone to make decisions aboutacademic giftedness (Terman, 1930) or general intel-lectual competence (J. Raven, Raven, & Court, 1998;McCallum, Bracken, & Wasserman, 2001).
Even though nonverbal reasoning tests may be goodmeasures of general ability (g), they do not measure thespecific verbal and quantitative abilities that add impor-tantly to the prediction of academic success for studentsfrom all ethnic backgrounds (Gustafsson & Balke,1993; Keith, 1999; Lohman, 2005b). Webb, Lubinski,and Benbow (2007) argue that in addition to verbal andquantitative reasoning, spatial ability should also rou-tinely be assessed in talent searches. However, nonver-bal tests such as Raven’s Progressive Matrices Test (J.C. Raven, 1941), the Naglieri Nonverbal Ability Test(NNAT; Naglieri, 1997), and the Nonverbal Battery ofthe Cognitive Abilities Test (CogAT; Lohman & Hagen,2001) measure fluid reasoning ability, not spatial abil-ity. Good tests of spatial ability require examinees tocreate and transform visual images, for example bymentally rotating images in three-dimensional space.Such tests show substantial sex differences. However,the Raven, NNAT, or the CogAT do not require theseskills and therefore do not show significant sex differ-ences. These non-verbal reasoning tests are not effec-tive for identifying students who excel in visual-spatialthinking (Lohman, 1994).
Nevertheless, those who use nonverbal tests to helpidentify academically gifted students are generally moreinterested in identifying students who might excel in tra-ditionally structured academic programs than in mea-suring visual thinking abilities. But there is a tradeoff. Inthe language of test score validity, nonverbal reasoningtests can reduce the amount of construct-irrelevant
variance in test scores for nonnative speakers by reduc-ing the impact of language. This enhances validity. Butnot measuring the ability to reason in verbal or quantita-tive symbol systems, underrepresents the construct offluid reasoning ability and therefore reduces the validityof the test scores. (Braden, 2000). How practitionersmight negotiate this tradeoff is one of the issues we hopeto address in this study.
Estimating Score Differences BetweenELL and Non-ELL Children
In spite of concerns about construct underrepre-sentation, nonverbal reasoning tests are sometimesused to screen all students for inclusion in programsfor the gifted because it is thought that such tests levelthe playing field for ELL and non-ELL children.However, studies that compare the performance ofELL and non-ELL children on nonverbal tests arerare, and so it is uncertain how much nonverbal rea-soning tests reduce the difference in mean scores ofELL and non-ELL students. Instead, most studiescompare the performance of students from differentethnic groups (Lewis, 2001; Stephens, Kiger, Karnes,& Whorton, 1999) rather than ELL and non-ELLchildren within those ethnic groups. But even thesestudies have given widely varying estimates of themagnitude of score differences between childrenfrom different ethnic backgrounds.
Several reports on the Naglieri Nonverbal AbilityTest (NNAT; Naglieri, 1996) have examined thisissue. For example, in an analysis of the NNAT fallstandardization data, Naglieri and Ronning (2000a)reported a 3-point difference on the NonverbalAbility Index (NAI) scale (M = 100, SD = 15)between the average scores of Hispanic and Whitechildren. However, this difference was obtained afterstudents were equated on socioeconomic status(SES), region of the country, gender, urbanicity(urban or rural area of residence), and school type(public or private school attendance). Controlling forthese variables also reduced differences between
276 Gifted Child Quarterly, Vol. 52, No. 4
Authors’ Note: Katrina A. Korb is now at the University of Jos, Nigeria. We gratefully acknowledge the support and assistance of theProject Bright Horizon Research Team, particularly Peter Laing who supervised the monumental task of collecting the data for this pro-ject. The views and opinions expressed in this article are those of the authors and should not be ascribed to any members of the ProjectBright Horizon staff or its consulting partners. The research reported in this paper was sponsored by a Jacob K. Javits Gifted and TalentedEducation Grant Program to the Project Bright Horizon Research Team: Peter Laing, Project Director/Co–Principal Investigator,Washington Elementary School District, Phoenix, AZ; Dr. Jaime Castellano, Project Consultant; and Dr. Ray Buss, Arizona StateUniversity at the West Campus, Principal Investigator. Please address correspondence to David F. Lohman, Belin-Blank Center, 600Honors Center, University of Iowa, Iowa City, IA 52242; e-mail: [email protected].
Note: This article was accepted under the editorship of Paula Olszewski-Kubilius.
at The University of Iowa Libraries on October 7, 2008 http://gcq.sagepub.comDownloaded from
Hispanic and White children on the MathematicsBattery of the Stanford Achievement Test (1995) bythe same amount. This suggests that equating studentson demographic variables equated them on other fac-tors as well. Furthermore, the practice of statisticallycontrolling for the effects of social class and otherenvironmental variables on a presumably cultural fairtest is inherently illogical. If the test were in fact cul-ture fair, then such controls would be unnecessary.
Although controlling unwanted sources of variationcan clarify relationships between variables, it can alsoobscure them. For example, SES is commonly definedby three variables: family income, parental education,and parental occupational status. Therefore, control-ling for SES also controls for that portion of the abilityvariance that predicts how much education parentsobtain or that may be required for their occupations.However, controlling for parent ability also controls inpart for the abilities of the parent’s biological children.Failure to keep track of the shared, construct-relevantvariance when controlling ability test scores for SES isone example of a larger problem called the partialingfallacy (see Lubinski, 2000). In addition to the poten-tial for introducing conceptual confusions, the practiceof statistically controlling for variables can make it dif-ficult for users to estimate the magnitude of group dif-ferences that they might expect to see in their schools.
In a second analysis of the same data—this timenot controlling other variables—Naglieri and Ford(2003) reported that the NNAT identified equal pro-portions of high-scoring White, Black, and Hispanicchildren as gifted. However, other investigators havenot found that the NNAT identified equal proportionsof high-scoring students from different ethnic groups,either with groups of Black and White students(Shaunessy, Karnes, & Cobb, 2004; Stephens et al.,1999) or with groups of Hispanic and White students(Drake, 2006; Lewis, 2001). Indeed, an independentanalysis of the NNAT standardization data foundlarge differences between the scores of White, Black,and Hispanic students at all ages (George, 2001). Onthe NAI scale (M = 100, SD = 15), the differencesbetween White and Hispanic students ranged from 9points at level A to 3 points at Level G, with a medianacross levels of 6 points. The median Black–Whitedifference was 12 NAI points. The inconsistencybetween the Naglieri and Ford (2003) report of pro-portional representation of White, Hispanic, andBlack students on the NNAT and that of other inves-tigators who have used the same or similar tests withthese populations has never been explained, despitequestions about the integrity of the analyses that were
performed on the data (Lohman, 2005a, 2006).Nevertheless, Naglieri (2007) asserts that the Naglieriand Ford (2003) paper is one of the most importantstudies on the NNAT.
In a third analysis of the NNAT standardization datathat once again controlled for urbanicity, SES, region ofthe country, type of school, and gender, Naglieri,Booth, and Winsler (2004) reported a 1-point differenceon the NAI scale between ELL and non-ELL Hispanicchildren. This comparison directly addresses how muchthe scores of ELL and non-ELL children might differ—at least within the world in which students do not differon these demographic variables. Unfortunately, therewas no external criterion for identifying ELL studentsin the many schools that participated in the test stan-dardization. Even when given explicit criteria for iden-tifying ELL students, schools differed widely on howthey interpreted the criteria (Lutkus & Mazzeo, 2003).Therefore, some ELL children may have been includedin the non-ELL group and vice versa, thereby underes-timating the difference between ELL and non-ELLstudents. Furthermore, it is unclear how large the dif-ference between ELL and non-ELL students might beif one or more of the five demographic variables werenot controlled.
There is also uncertainty about the magnitude ofdifferences between ELL and non-ELL Hispanicstudents on the Standard Progressive Matrices(Raven; J. C. Raven, Court, & Raven, 1996).Although at least one study found no differencesbetween the performance of Hispanic and Whitestudents on the Raven (e.g., Powers, Barkan, & Jones,1986), most investigators report differences of .5 to .7SD (Hoffman, 1983; Mills & Tissot, 1995; Saccuzzo& Johnson, 1995). Of course, many Hispanicchildren are not ELLs, and so the Hispanic–Whitedifference mostly likely underestimates the size ofthe difference between Hispanic ELL children andWhite non-ELL children, especially when thesegroups also differ in socioeconomic status (J. Raven,1989). A larger problem for selection decisions, how-ever, is that the Raven has never been properlynormed on the U.S. population. This has led to con-siderable confusion about the interpretability of nor-mative scores on the test.
For Form 6 of the Cognitive Abilities Test(CogAT; Lohman & Hagen, 2001), there have beeneven fewer reports of ethnic differences. However,differences between ethnic groups were estimatedfor analyses of item bias (Lohman & Hagen, 2002).Within each school in the standardization sample, allstudents belonging to a particular minority group
Lohman et al. / Nonverbal Tests in Identifying Gifted Students 277
at The University of Iowa Libraries on October 7, 2008 http://gcq.sagepub.comDownloaded from
were identified. Then an equal number of majoritystudents were randomly sampled from the sameschool. Differences in the mean scores for these twogroups of students were averaged across all schoolsin the national sample. One advantage of this methodis that it provides an unbiased estimate of the size ofthe test score difference that test users are likely tosee within their schools. Differences between Whiteand Hispanic students averaged 5 Standard Age Score(SAS) points on the Nonverbal Battery (M = 100;SD = 16). When adjusted for differences in score scale(SD = 16 on CogAT versus SD = 15 on NNAT), thesedifferences between Hispanic and White students areapproximately the same as those obtained by Naglieriand Ronning (2000a) on the NNAT. We know of noother reports of score differences between White andHispanic students on the CogAT.
A major difficulty with all of these studies is thatthe category Hispanic includes students from diversecultural backgrounds with markedly differentEnglish-language skills. For example, Lohman(2005b) reported that Hispanic students with at leasttwo high scores (stanines of 8 or 9) on the threeCogAT batteries (Verbal, Quantitative, andNonverbal) were no more likely than Black students,and even less likely than Asian American students, toshow a profile of lower verbal reasoning abilities.These high-ability Hispanic students performed morelike other ethnic minority students than like ELLstudents. This reinforces the need to separate theinfluences of ethnicity and ELL status on observedscore differences.
Finally, just because group differences are largeron one test (e.g., the CogAT Verbal Battery) than onanother test (the CogAT Nonverbal Battery) does notmean that the latter test can better identify the mostacademically talented students. The problem is thatmeans and correlations can tell quite different storiesabout the data.
Means Versus Correlations
Two traditions have dominated the long history ofquantitative research in education and psychology(Cronbach, 1957). Each of these methods considersas error the variance that the other method hopes toexplain. On the one side are those who study differ-ences between the mean scores of groups—usuallygroups formed by random assignment of individualsto treatments. Differences among individuals withintreatment groups are considered random error. On theother side are those who study correlations among
scores on different measures. The individual differ-ences that are considered error when means are com-pared represent the systematic variation that thecorrelational method hopes to explain.
When applied to the same data, these twoperspectives—analyses of means versus analyses ofcorrelations—can lead to different interpretations. Forexample, although individuals vary widely in height,males are on average taller than females. However,the genetic factor that explains the difference betweenthe average heights of males and females (i.e., thepresence of a Y chromosome) cannot explain individ-ual differences in height within either group.
There is a similar paradox here: Although manipu-lations that reduce the impact of construct-irrelevantsources of difficulty can enhance construct validity,the same manipulations can also reduce constructvalidity by curtailing the extent to which the test mea-sures important aspects of cognition that define theconstruct. For example, by reducing the languagedemands of tests, one can reduce the differencebetween the mean scores of ELL and non-ELLstudents. However, nonverbal tests measure a nar-rower range of cognitive abilities and thus show lowercorrelations with measures of academic accomplish-ment than do ability tests that also assess students’reasoning abilities in those symbol systems (verbaland quantitative) most needed for success in academiclearning (Lohman, 2005b; Mills & Tissot, 1995).Importantly, when properly computed within ethnicgroups, the magnitude of these correlations does notdiffer across ethnic groups. Correlations between non-verbal, figural reasoning abilities and reading achieve-ment typically range from r = .4 to .5; correlationswith mathematics achievement typically range from r = .5 to .6 (Lohman & Hagen, 2002; Naglieri &Ronning, 2000b; Powers et al., 1986). Although sig-nificant, these correlations are considerably smallerthan the correlation of r = .8 between verbal reasoningand reading achievement or between quantitative rea-soning and mathematics achievement (Lohman &Hagen, 2002; Thorndike & Hagen, 1995). Becauselower predictive validity can substantially impair theability of the test to identify academically talentedstudents, college admissions tests such as the SAThave continued to measure verbal and quantitative rea-soning abilities, even though questions about test biaswould be easier to address with a nonverbal test.
Recognizing these limitations, several investigatorshave counseled caution in the use of nonverbal testsfor screening children for inclusion in programs forthe gifted (e.g., Bittker, 1991; Lohman, 2005b; Mills
278 Gifted Child Quarterly, Vol. 52, No. 4
at The University of Iowa Libraries on October 7, 2008 http://gcq.sagepub.comDownloaded from
& Tissot, 1995). They note that nonverbal tests violatethe dictum that abilities assessed by the identificationprocedures should correspond with those that arerequired for success in the program (Mills & Tissot,1995; Renzulli, 2005). Academic learning requiresverbal, quantitative, and spatial abilities in addition tog, and so by this argument, tests that measure acade-mic aptitude must measure all of these abilities.
Purposes of the Study
Clearly then there is controversy both about howbest to identify academically talented minoritystudents and about the efficacy of different nonverbaltests for achieving this goal. The primary goal of thisstudy was to compare the performance of a large sam-ple of ELL and non-ELL children on three of themost widely used nonverbal tests: the StandardProgressive Matrices Test, the NNAT, and theNonverbal Battery of Form 6 of the CogAT. In addi-tion to analyses of group differences, the relativeeffectiveness of the three nonverbal tests in identify-ing those ELL and non-ELL children who displayedthe strongest academic achievement was also exam-ined. Academic achievement, of course, is not syn-onymous with either the broad construct of giftednessor with the narrower construct of academic gifted-ness. Nevertheless, good achievement tests provide auseful indicator of academic talent.
Several controls were implemented to enhance thevalidity of the study. These included counterbalanc-ing the order of administration of the three tests,using only trained examiners, testing children in thefamiliar surroundings of their regular classrooms,giving directions in Spanish or English (as appropri-ate), and securing the collaboration of the authors oftwo of these tests (Dr. Naglieri and Dr. Lohman) inthe design of the study. Each collaborating partnerwas then given a copy of the data to analyze.
Specifically, we asked the following questions: (a)Are the normative scores similar for each test? (b)How large are the differences between ELL and non-ELL children on each test? (c) Do the tests identifysimilar proportions of high-scoring ELL and non-ELL students or of students from different ethnicgroups? (d) Are the tests sufficiently reliable to makedecisions about giftedness? and (e) When comparedto measures of verbal and quantitative reasoning, howwell do the nonverbal tests identify the most academ-ically successful ELL students?
Method
Participants
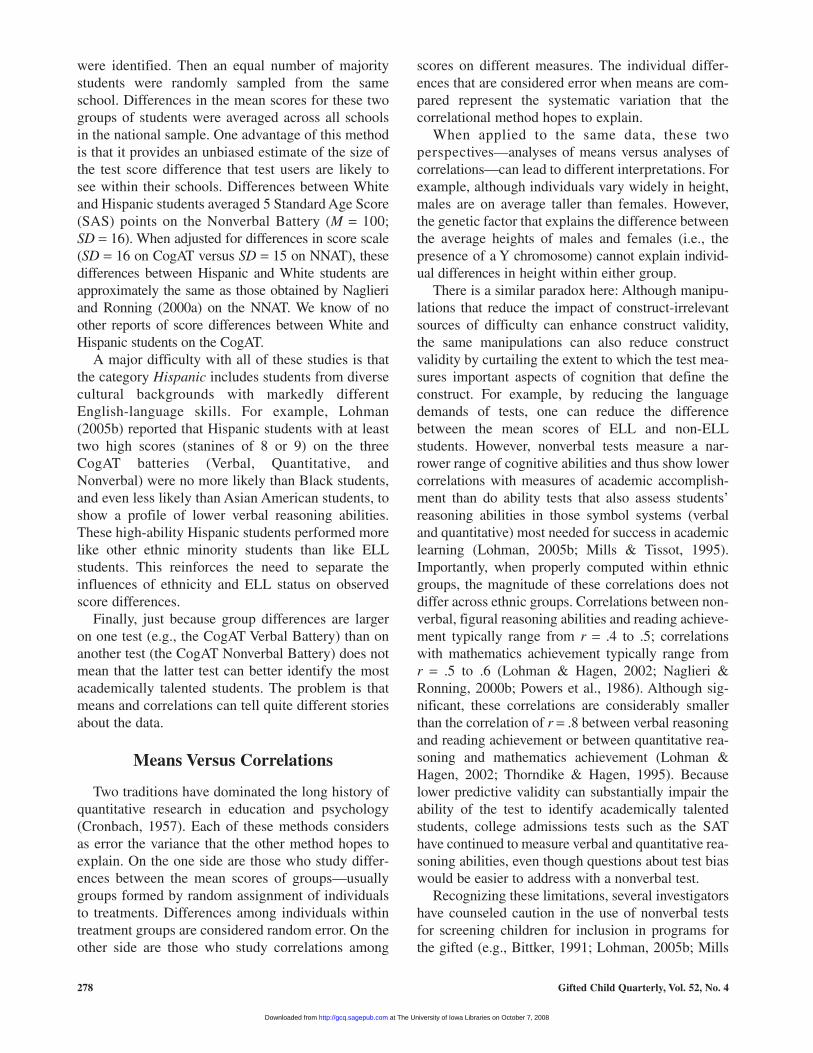
In all, 2,087 students were administered at leastone nonverbal test. Only the 1,198 that completed allthree nonverbal tests were included in these analyses.Some characteristics of these students are reported inTable 1. All attended grades K to 6 in two elementaryschools in a large Southwestern school district in theUnited States. Students were classified as NewEnglish-language learners (NELL) or ContinuingEnglish-language learners (CELL) based on the typeof services they were receiving and their scores on theStanford English Language Proficiency Test (SELP;Harcourt Educational Measurement, 2003). Except atkindergarten (where all ELL students were classifiedas NELL), 80 to 88% of the ELL students at eachgrade were classified as CELL. The native languageof almost all ELL students was Spanish. Almost all(95.4%) of the 786 Hispanic children, 90.8% of the164 students from other minority groups, and 53.2%of the 248 White students were eligible for free orreduced lunch.
Measures
Raven’s Standard Progressive Matrices. J. C.Raven devised the Progressive Matrices Test to mea-sure the eductive component of Spearman’s g. Theessential feature of eductive ability is “the ability togenerate new, largely nonverbal, concepts” (J. C.Raven et al., 1996, p. 1). The most recent version ofthe Standard Progressive Matrices uses the sameitems as the 1938 version of the test (J. C. Raven,1941). This test consists of five sets of 12 problemsthat follow a common theme. Each item requiresstudents to examine the components of an incompletematrix and then to select the empty box that bestcompletes the matrix.
Administration of the Raven required approxi-mately 60 minutes. Because the Raven has only onelevel, students at all grades took the same test.Students recorded their answers on a separate answersheet, which was then scored by hand.
Naglieri Nonverbal Ability Test. The NNAT isdescribed as “a brief, culture-fair, nonverbal measureof school ability” (Naglieri, 1997, p. 1). The test uses afigural matrix format similar to the Raven. There areseveral differences between the NNAT and the Raven.First, items on the NNAT have five rather than six or
Lohman et al. / Nonverbal Tests in Identifying Gifted Students 279
at The University of Iowa Libraries on October 7, 2008 http://gcq.sagepub.comDownloaded from
eight response options. Items are printed in blue,white, and yellow and are clustered into four groups(Pattern Completion, Reasoning by Analogy, SerialReasoning, and Spatial Visualization). The proportionof items in each cluster varies across levels of the test.Pattern Completion items require examinees to iden-tify the missing portion of a patterned rectangle.Reasoning by Analogy and Serial Reasoning itemsrequire examinees to determine how a figure changesacross the rows and columns of a design. SpatialVisualization items require that examinees determinehow two or more designs combine to create a new figure.
The test is organized into seven levels, each ofwhich contains 38 different items. The recommendedNNAT level was administered for each grade.Students marked their answers directly in test book-lets for Levels A through C and on a separate,machine-readable answer sheet at Levels D and E.
Cognitive Abilities Test (Form 6). Form 6 ofCogAT consists of three separate batteries that mea-sure verbal, quantitative, and nonverbal reasoning(Lohman & Hagen, 2001). Although each battery canbe administered alone, all three batteries were admin-istered in this study. The Primary Edition of CogAT(Levels K, 1, and 2) is designed for students inkindergarten through second grade. Each of the threeprimary batteries has 40, 44, and 48 items at LevelsK, 1, and 2, respectively. The items in each batteryare divided into two subtests with different item for-mats. No reading is required. Children listen to theteacher read a question and then choose the picturethat best answers the question. For the Verbal Battery,the subtests are Oral Vocabulary and VerbalReasoning; for the Quantitative Battery, they are
Relational Concepts and Quantitative Concepts; andfor the Nonverbal Battery, they are Matrices andFigure Classification. The Matrices subtest followsthe same general format as the items on the Ravenand the NNAT. The Figure Classification subtest pre-sents three figures in the stem. The student mustselect the fourth figure that belongs to the set.
The Multilevel Edition of CogAT6 (Levels A to H)is typically administered to students in Grades 3through 12. The Multilevel Verbal (65 items),Quantitative (60 items), and Nonverbal (65 items)batteries each contain three subtests that use differentitem formats. The student must read individual wordson two subtests of the Verbal Battery (VerbalAnalogies and Verbal Classification) and a sentenceon the third (Sentence Completion). The three sub-tests of the Quantitative Battery are Number Series,Quantitative Relations, and Equation Building. Thethree subtests of the Nonverbal Battery are FigureClassification, Figure Analogies, and Figure Analysis.The Figure Classification subtest presents threefigures in the stem, and the examinee is required todetermine a fourth figure that belongs to the set.Figure Analogies contains three figures in an analogy(A�B : C�__) that the student must complete.Figure Analysis requires the examinee to determinehow a folded, hole-punched paper will appear whenunfolded.
The recommended level of CogAT was administeredat each grade. Students marked their answers directly intest booklets for Levels K, 1, and 2 and on a separate,machine-readable answer sheet for Levels A to D.
Achievement Tests. The Arizona Instrument toMeasure Standards Dual Purpose Assessment (AIMSDPA) was designed to yield normative and criterion-referenced information about student achievement.Thirty to 50% of the items on the AIMS DPA weretaken from the TerraNova achievement tests(CTB/McGraw-Hill, 2002). The remaining itemswere developed by educators specifically for theAIMS DPA to better align the test with state educa-tional goals (Arizona Department of Education,2006). A combined Reading/Language Arts subtestand the Mathematics subtest of the AIMS DPA eachcontained approximately 80 items. Separate scoresare reported for Reading, Language, and Mathematics.In this study, national grade percentile ranks based onthe norm-referenced TerraNova items were reportedas part of the description of the student sample (seeTable 2). Composite reading and mathematics scores
280 Gifted Child Quarterly, Vol. 52, No. 4
Table 1Number of Students, by Gender,
Ethnicity, and ELL Status
Gender Ethnicity ELL
Grade Male Female White Hispanic Other New Continuing
K 63 62 27 82 16 65 01 130 100 48 148 34 23 912 100 90 44 113 33 15 593 81 90 26 121 24 12 694 101 90 37 131 23 9 505 85 73 36 103 19 5 336 62 71 30 88 15 4 30
Note: For ethnicity, other consists of 69 Black, 61 AmericanIndian, and 34 Asian American students. ELL = English-languagelearner.
at The University of Iowa Libraries on October 7, 2008 http://gcq.sagepub.comDownloaded from
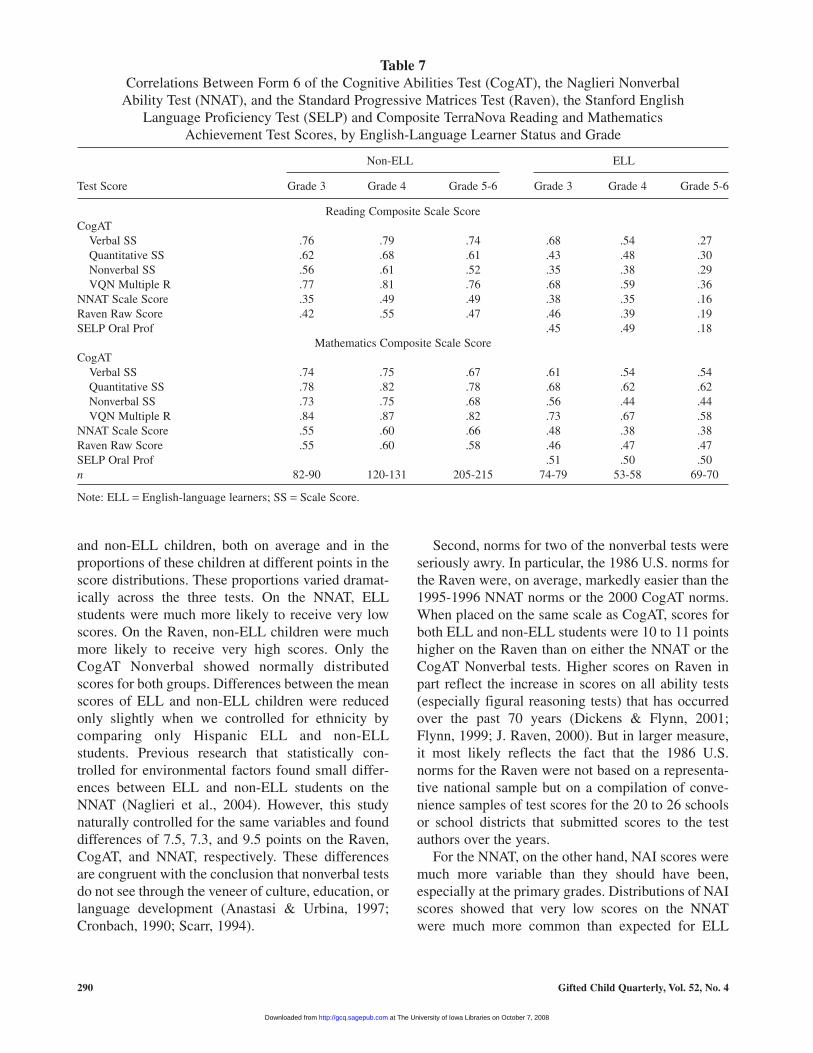
that combined items from both assessments (the fullAIMS DPA) were used when investigating the rela-tionships between scores on the three ability tests andstudent achievement. (Refer to Table 7 in the Resultssection.)
Stanford English Language Proficiency Test. TheStanford English Language Proficiency (SELP;Harcourt Educational Assessment, 2003) test is basedon the standards developed by the Teachers ofEnglish to Speakers of Other Languages and mea-sures the English listening, reading, comprehension,writing, and speaking skills of K-12 ELL students.The SELP tests are untimed and group administeredexcept for the speaking portion of the test, which isadministered individually. Administration time istypically less than 2 hr.
Procedure
The three ability tests were administered by trainedexaminers to intact classes in counterbalanced order inlate April and early May of 2006. Directions for thetests were given in Spanish or English as appropriate.Each of the three nonverbal tests was administered ina single session separated by approximately 1 week.
The Verbal and Quantitative batteries of CogAT werealso administered to all children, but in separate ses-sions from the Nonverbal Battery. These sessionswere generally conducted during the same week inwhich the CogAT Nonverbal Battery was adminis-tered. Analyses were performed using SPSS 14.0(SPSS Inc., 2005).
Results
Judgments about exceptionality depend importantlyon the quality and recency of the test norms, the nor-mality of the score distributions, and the reliability andvalidity of the test scores. Therefore, we first reportbasic descriptive statistics, score distributions, reliabil-ities, and the proportions of ELL versus non-ELLstudents at each score stanine for each of the threetests. Ability tests that aim to identify the most acade-mically talented students should identify many of thestudents who currently excel academically. Therefore,in the second part of the Results section, we examinecorrelations between the nonverbal assessments witheach other and with measures of reading and mathe-matics achievement. These address the basic issue ofpredictive validity for the ability tests.
Lohman et al. / Nonverbal Tests in Identifying Gifted Students 281
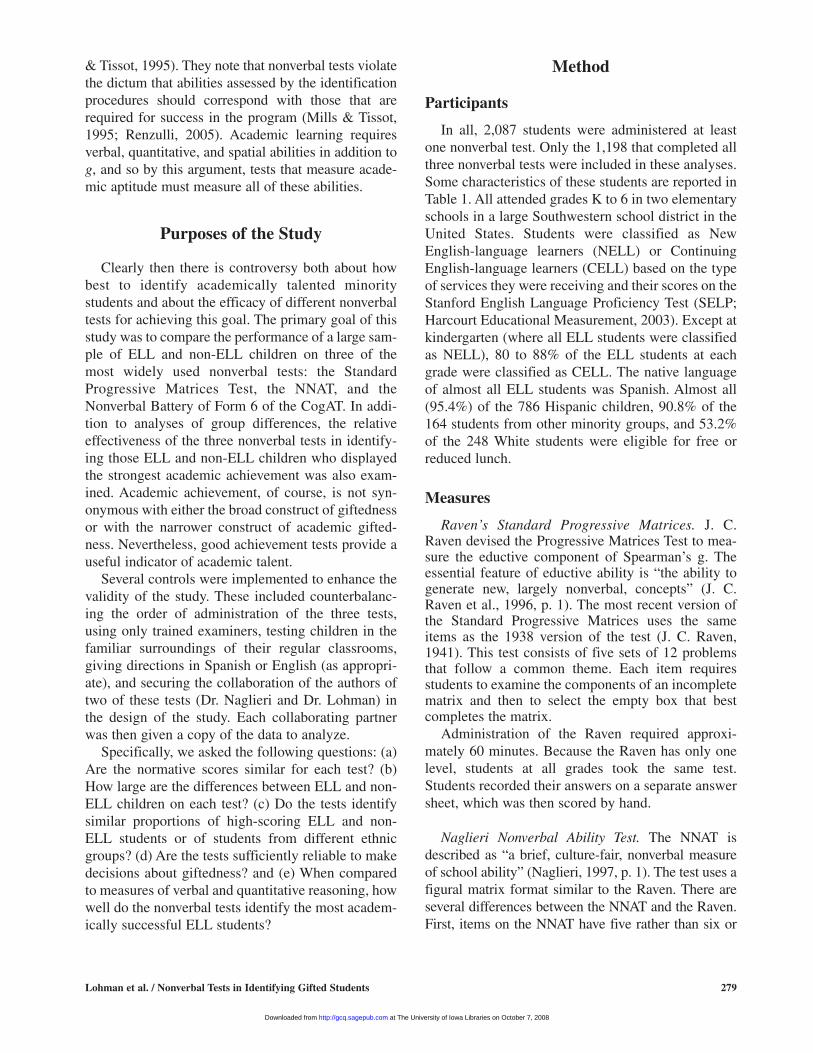
Table 2Median National Grade Percentile Ranks on Form 6 of the Cognitive Abilities Test (CogAT)Verbal, Quantitative, and Nonverbal Batteries; the Naglieri Nonverbal Abilities Test (NNAT);
the Standard Progressive Matrices Test (Raven); and the TerraNova Mathematics,Reading, and Language Tests, by ELL Status and Grade
CogAT TerraNova
Grade n V Q N NNAT Ravena Math Reading Lang
Non-ELLK 44-60 14 20 46 38 831 113-116 32 40 57 55 852 114-116 38 44 64 53 823 82-90 32 43 40 50 75 39 36 404 121-132 39 33 46 51 75 43 41 445 115-120 34 38 55 50 70 39 48 516 94-99 37 44 58 59 70 49 52 43
ELLK 55-65 8 11 27 27 621 107-114 6 14 42 35 632 73-74 7 12 35 37 623 76-81 10 20 24 39 60 20 14 154 58-59 6 10 25 34 53 18 18 185 37-38 5 14 18 35 41 17 12 146 33-34 4 12 17 44 44 11 14 20
Note: ELL = English-language learner; V = Verbal; Q = Quantitative; N = Nonverbal; Lang = Language.a. National Age Percentile Rank. Grade percentile ranks not available.
at The University of Iowa Libraries on October 7, 2008 http://gcq.sagepub.comDownloaded from
Descriptive Statistics
Comparisons with achievement tests. Comparisonsbetween the three nonverbal tests and the TerraNova(CTB/McGraw-Hill, 2000) reported in Table 2 provideboth information on the characteristics of the sampleand a comparison of norms on the tests. Grade per-centile ranks (PRs) were used for all tests except theRaven, which reports only age percentile ranks.However, median age and grade percentile ranks for theCogAT and NNAT were similar, as is the case whenstudents’ ages are typical for their grades. Non-ELLchildren performed at or somewhat below the nationalaverage and ELL students considerably below thenational average. For example, the median PRs on theMathematics Battery ranged from 39 to 49 for non-ELLand from 11 to 20 for ELL children. Percentile ranks onthe CogAT Quantitative Battery were generally similar.
Percentile ranks on the Raven were considerablyhigher than the CogAT Nonverbal or the NNAT scoresexcept for ELL children in grades 5 and 6. For non-ELLchildren, Raven percentile ranks were 25 points higherthan both CogAT and NNAT percentile ranks. Althoughit is possible that the percentile ranks for the NNAT and
the CogAT Nonverbal are both too low, this is unlikely,given the congruence between the CogAT QuantitativeBattery and the Mathematics subtest of the TerraNova.Rather, the Raven norms appear to be far too lenient.
Nonverbal tests only: All ELL and non-ELL students.Means, standard deviations, and sample sizes for eachof the three nonverbal tests are reported separately forELL and non-ELL students by grade in Table 3. For theCogAT, Standard Age Scores (M = 100, SD = 16) arereported; for the NNAT, Nonverbal Ability Index (NAI)scores (M = 100, SD = 15) are reported. For the Raven,a comparable score dubbed the Raven Ability Index(RAI; M = 100, SD = 16) was constructed using thenational age percentile ranks from the 1986 U.S. norms(Table RS3SPM6 in J. C. Raven, 1990).1
The mean score for ELL students was substantiallylower than the mean score for non-ELL students on allthree tests. The means for the CogAT Nonverbal andthe NNAT were similar (ELL: M = 92 for CogAT andM = 91 for NNAT; non-ELL: M = 101 for both CogATand NNAT). However, scores on the Raven were about11 points higher than the other two tests (M = 103 andM = 112 for ELL and non-ELL students, respectively).
282 Gifted Child Quarterly, Vol. 52, No. 4
Table 3Means (Standard Deviations) for All Students on Form 6 of the Cognitive Abilities Test
(CogAT) Nonverbal Battery, the Naglieri Nonverbal Abilities Test (NNAT), and the StandardProgressive Matrices Test (Raven), by ELL Status and Grade
CogAT Nonverbal SAS NNAT NAI Raven Ability Index
Grade M SD M SD M SD n
Non-ELLK 96.4 (13.0) 94.8 (19.2) 112.4 (13.7) 60a
1 102.9 (15.9) 101.6 (20.9) 116.6 (16.1) 116a
2 106.3 (12.8) 104.1 (16.9) 116.4 (14.3) 116 3 96.6 (15.5) 99.6 (16.7) 110.4 (15.8) 90 4 97.8 (13.0) 100.3 (15.5) 110.1 (15.6) 132 5 101.6 (13.8) 98.1 (12.9) 108.2 (14.2) 120 6 100.4 (14.4) 103.8 (14.0) 107.9 (15.4) 99
All grades 100.7 (14.4) 100.7 (16.8) 111.5 (15.5) 733 ELL
K 91.6 (15.5) 88.5 (18.2) 103.9 (11.5) 65a
1 98.0 (14.5) 91.3 (20.2) 106.6 (17.1) 114a
2 95.1 (13.7) 90.1 (17.2) 105.2 (16.1) 743 89.9 (13.8) 93.3 (15.2) 103.9 (16.7) 814 88.9 (11.1) 90.4 (17.1) 101.2 (13.6) 595 85.9 (10.0) 88.9 (12.0) 99.0 (16.6) 386 86.4 (12.3) 91.1 (14.2) 98.6 (14.4) 34
All grades 92.4 (14.1) 90.7 (17.2) 103.4 (15.8) 465
All Students 97.5 (14.9) 96.8 (17.6) 108.5 (16.1) 1198
Note: For the CogAT and the Raven, population SD = 16; for the NNAT, population SD = 15. SAS = Standard Age Score.a. Because students aged 6 and younger were excluded from Raven norms, n = 17 for non-ELL in Grade K; 91 for non-ELL, Grade 1;24 for ELL, Grade K; and 89 for ELL, Grade 1.
at The University of Iowa Libraries on October 7, 2008 http://gcq.sagepub.comDownloaded from
When the data were examined by grade, the pat-tern of mean scores was similar for the three tests fornon-ELL students but different for ELL students.Raven scores were substantially higher than eitherCogAT or NNAT scores at all grades. The next largestdifference was between NNAT scores and CogATNonverbal scores for Grade 1 and Grade 2 ELLstudents: NNAT scores for these students were sig-nificantly lower than CogAT Nonverbal scores by 6.7points at Grade 1, t (113) = 5.19; p < .001, and 5.8points at Grade 2, t (73) = 3.91; p < .001. However,there were no differences between scores on thesetwo tests for non-ELL children at Grades 1 and 2.Finally, NNAT scores were somewhat higher thanCogAT scores at Grades 3 to 6, although the differ-ences were smaller and only sometimes statisticallysignificant.
Differences in variability. By design, the popula-tion SD is 16 for the CogAT Nonverbal SAS and theRaven RAI score and is 15 for the NNAT NAI score.Because it is unlikely that the two schools that partic-ipated in this study represent the full range of abilityin the U.S. population, we would expect the SDs inthis sample to be somewhat smaller than their popu-lation values. This was the case for the CogAT andthe Raven. Overall SDs for ELL and non-ELL
children were both below the population value of 16.For the NNAT, on the other hand, the overall SD of17.2 for ELL children was significantly greater thanthe population value of 15; χ2 (464) = 611, p < .0001.The SD of 16.8 for non-ELL children was also sig-nificantly greater than the population value of 15,χ2(732) = 915, p < .0001.
When examined by grade, none of the SDs foreither the CogAT Nonverbal or the Raven were sig-nificantly larger than the population value of 16. Forthe NNAT, however, SDs both for ELL and non-ELLchildren in grades K, 1, and 2 were all significantlygreater than the population SD of 15.
Score distributions. Giftedness is an inferenceabout ability that is made when scores fall in theupper tail of a score distribution. Differences in thevariability of score distributions can therefore changeinferences about exceptionality. The number ofstudents who score above a particular value dependsboth on the shape of the score distribution and on thenorms that are used. If the norms do not represent thepopulation, then the number of students who exceedthe cutoff may be unexpectedly high (or low).
To better understand the unexpectedly large SDsfor the NNAT and its impact on giftedness classifica-tions, we constructed histograms of age stanines (basedon national norms) for all three tests, separately by
Lohman et al. / Nonverbal Tests in Identifying Gifted Students 283
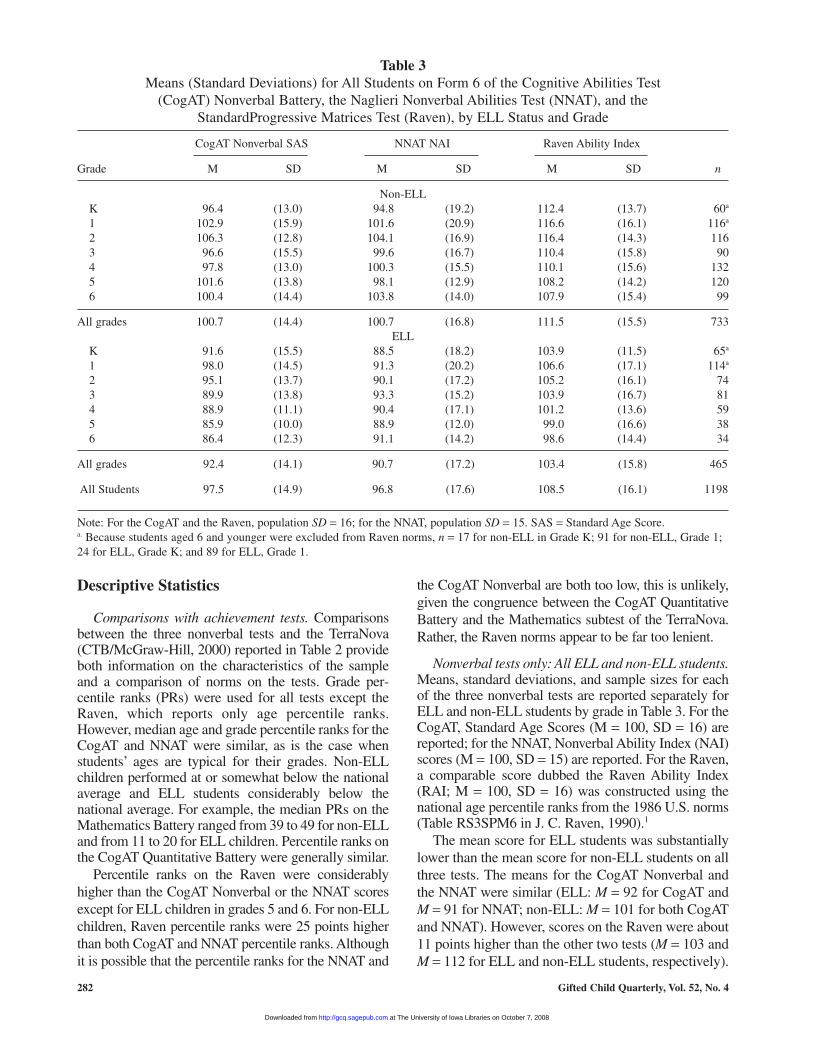
Frequency distributions of national age stanines at grades K (0), 1, 2, and 3 for non–English-language learners on the StandardProgressive Matrices (Raven; J. C. Raven et al., 1996), the Nonverbal Battery of Form 6 of the Cognitive Abilities Test (CogAT; Lohman& Hagen, 2001), and the Naglieri Nonverbal Ability Test (NNAT; Naglieri, 1996). See Table 1 for sample sizes.
Figure 1Non–English-Language Learners
at The University of Iowa Libraries on October 7, 2008 http://gcq.sagepub.comDownloaded from
grade and ELL status. We created histograms forstudents in grades K to 3, because these gradesshowed the greatest variability in both Ms and SDsacross the three tests (see Table 3). Distributions ofage stanines are shown in Figure 1 for non-ELLstudents and in Figure 2 for ELL students. Samplesizes for the Raven are somewhat smaller at grades Kand 1 because children aged 6 and younger areexcluded from the norms tables. Although RAI scorescould not be computed for these children, their datawere included in all analyses that used raw scores.
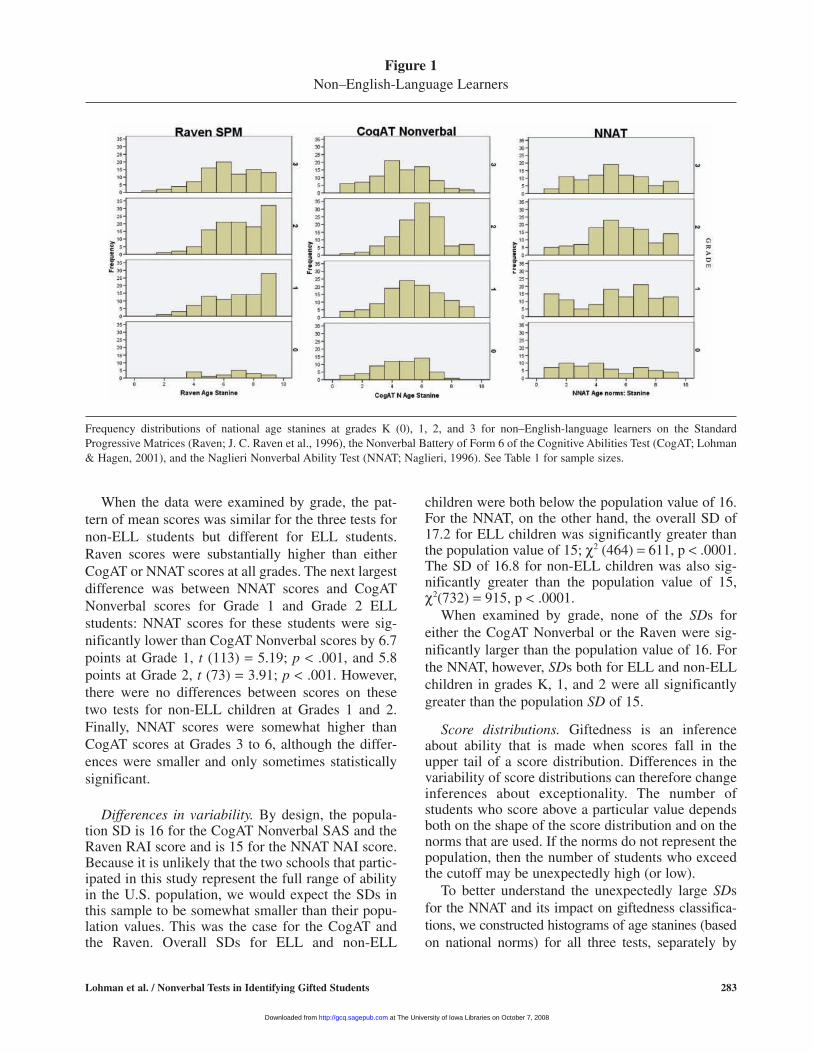
The histograms in Figures 1 and 2 show thatCogAT scores were approximately normally distrib-uted for both ELL and non-ELL students at allgrades. This was not the case for either the Raven orthe NNAT. Extremely high stanine scores were muchmore common on the Raven than on either the NNATor the CogAT. Indeed, the modal stanine was 9 on theRaven for non-ELL children in Grades 1 and 2. Thisindicates that the 1986 U.S. Raven norms result in fartoo many students being identified as gifted.However, for ELL students in grades K, 1, and 2 andfor non-ELL students in grades K and 1 taking theNNAT, the opposite pattern was evident: For thesestudents, extremely low scores were more commonthan expected. In fact, the modal stanine on theNNAT was only 1 for ELL students in Grade 1.
The preponderance of low scores in the NNAT dis-tributions for ELL children in Figure 2 may indicatethat some children did not understand what they weresupposed to do, despite the fact that test directionswere given in Spanish when appropriate. However,this does not explain the excess of high-scoringchildren in the non-ELL distributions for grades 1and 2 (see Figure 1). Instead, the generally flatter andmore variable NNAT score distributions could reflecta problem in the initial scaling or norming of the testor simply could reflect more error of measurement inthe scores. Whatever its cause, the increased variabil-ity of the NNAT results in many more students beingclassified as very high or very low ability than onewould expect in a normally distributed populationwith an SD of 15.
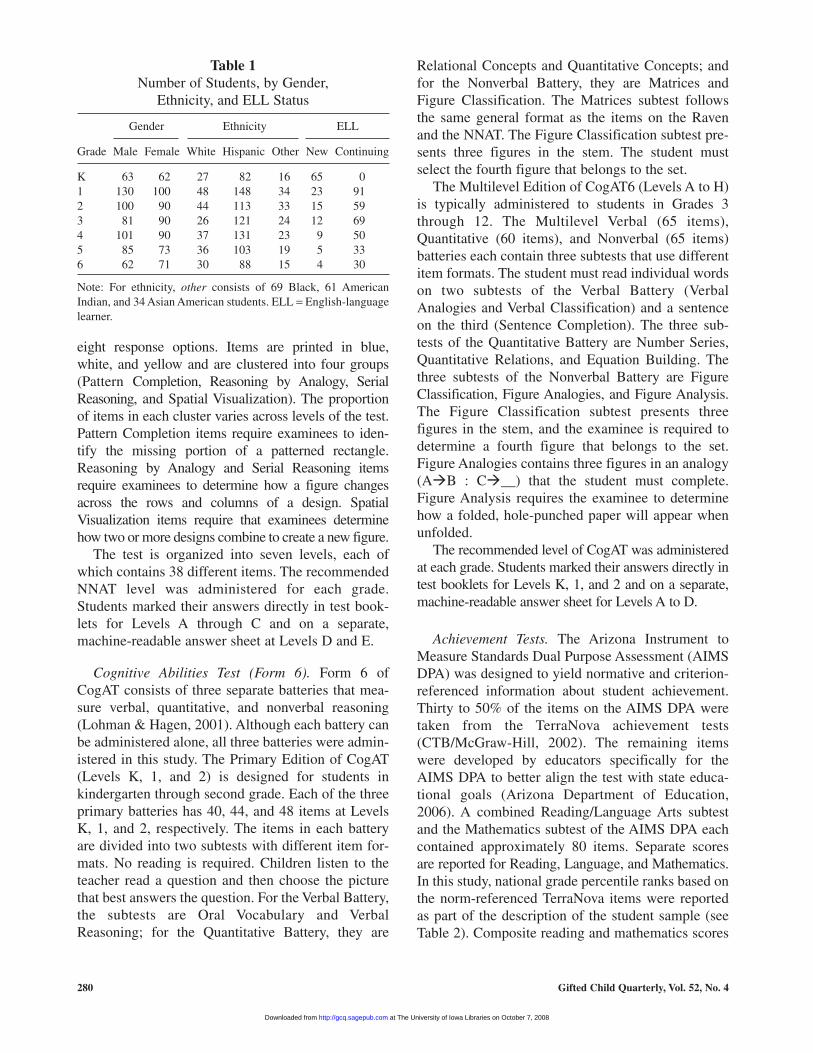
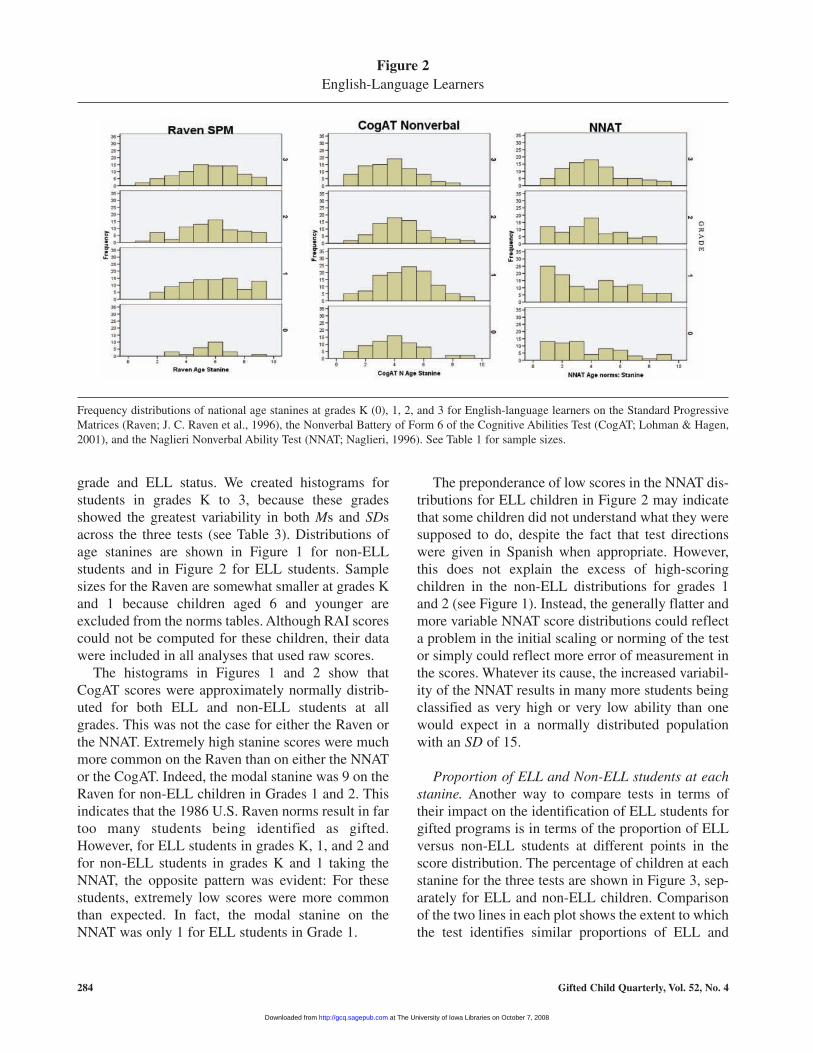
Proportion of ELL and Non-ELL students at eachstanine. Another way to compare tests in terms oftheir impact on the identification of ELL students forgifted programs is in terms of the proportion of ELLversus non-ELL students at different points in thescore distribution. The percentage of children at eachstanine for the three tests are shown in Figure 3, sep-arately for ELL and non-ELL children. Comparisonof the two lines in each plot shows the extent to whichthe test identifies similar proportions of ELL and
284 Gifted Child Quarterly, Vol. 52, No. 4
Figure 2English-Language Learners
Frequency distributions of national age stanines at grades K (0), 1, 2, and 3 for English-language learners on the Standard ProgressiveMatrices (Raven; J. C. Raven et al., 1996), the Nonverbal Battery of Form 6 of the Cognitive Abilities Test (CogAT; Lohman & Hagen,2001), and the Naglieri Nonverbal Ability Test (NNAT; Naglieri, 1996). See Table 1 for sample sizes.
at The University of Iowa Libraries on October 7, 2008 http://gcq.sagepub.comDownloaded from
non-ELL children. If the proportions are the same,then the two lines would be coincident. For NNAT(leftmost panel), the critical feature is the preponder-ance of ELL students (dashed line) with very lowscores. Raven stanine scores (rightmost panel) showthe opposite pattern: a preponderance of non-ELLstudents with high scores. The CogAT stanine scores(center panel) show two essentially normal distribu-tions, one to the left of the other. However, for allthree tests, proportionately fewer ELL childrenobtained higher stanine scores.
ELL versus Non-ELL Hispanic students. One ofthe key questions that we sought to address in thisstudy was the magnitude of score differencesbetween ELL and non-ELL Hispanic children onthese three tests. Naglieri et al. (2004) reported a dif-ference of only 1 scale point on the NNAT betweenHispanic children with and without limited Englishproficiency. This difference was obtained after sam-ples were first equated on SES (approximated bywhether the child was on free or reduced lunch andby the average educational level of parents in theschool district), region of the country, gender, urban-icity (urban or rural area of residence), and schooltype (public or private school attendance). By design,all of these variables were controlled in this study aswell: Children in this study all attended publicschools, lived in the same city, and of necessity, in thesame region of the country. In addition, more than
95% of the Hispanic children were eligible for free orreduced lunch. Other studies have shown that scoresfor elementary school children do not vary by genderon any of the three tests (Lohman & Hagen, 2002; J.Raven et al., 1998; Rojahn & Naglieri, 2006).
Table 4 shows the Ms (and SDs) on each of thethree tests for ELL and non-ELL Hispanic children,by grade. Although there was some variation acrossgrades, differences between ELL and non-ELLHispanic children were large on all three tests. Acrossgrades, the average differences were 7.5, 6.3, and 9.5points on the Raven, CogAT, and NNAT or effectsizes of .47, .46, and .63, respectively. This is a muchlarger disparity between ELL and non-ELL Hispanicstudents than the 1-point difference reported byNaglieri et al. (2004). Even though the ELL and non-ELL Hispanic children were similar in manyrespects, the ELL Hispanic children at all gradeswere on average less able to cope with the demandsof the tests than were non-ELL Hispanic children.
Typically, large differences at the mean translateinto much larger discrepancies in the odds of obtainingextreme scores (Feingold, 1994; Hedges & Nowell,1995). However, the large differences between themean scores for ELL and non-ELL Hispanic childrenwere offset by the somewhat greater variability ofscores for ELL students, especially on the NNAT.Once again, this illustrates the importance of under-standing how distributions of scores differ across testsfor particular groups of examines.
Lohman et al. / Nonverbal Tests in Identifying Gifted Students 285
Figure 3Percentage of students at each stanine on the Naglieri Nonverbal Ability Test (NNAT; left panel), the
Cognitive Abilities Test Nonverbal Battery (CogAT N; center panel), and the Standard Progressive Matrices(Raven; right panel) for ELL students (dashed line) and non-ELL students (solid line).
at The University of Iowa Libraries on October 7, 2008 http://gcq.sagepub.comDownloaded from
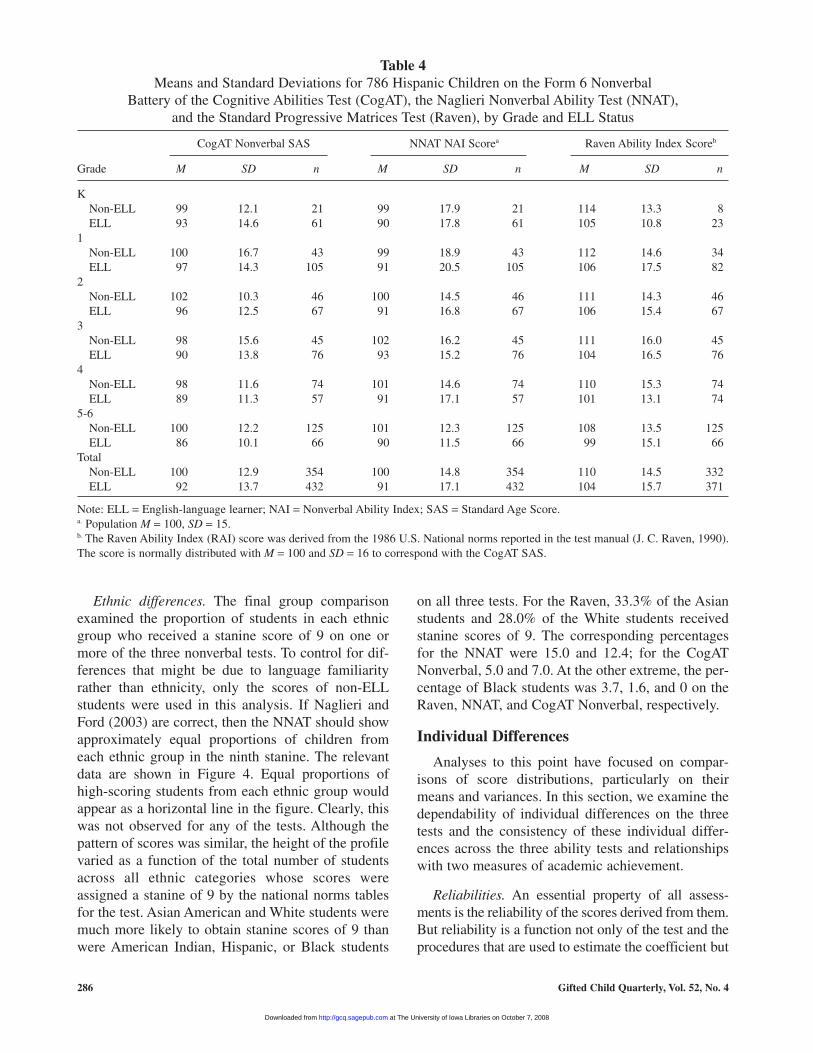
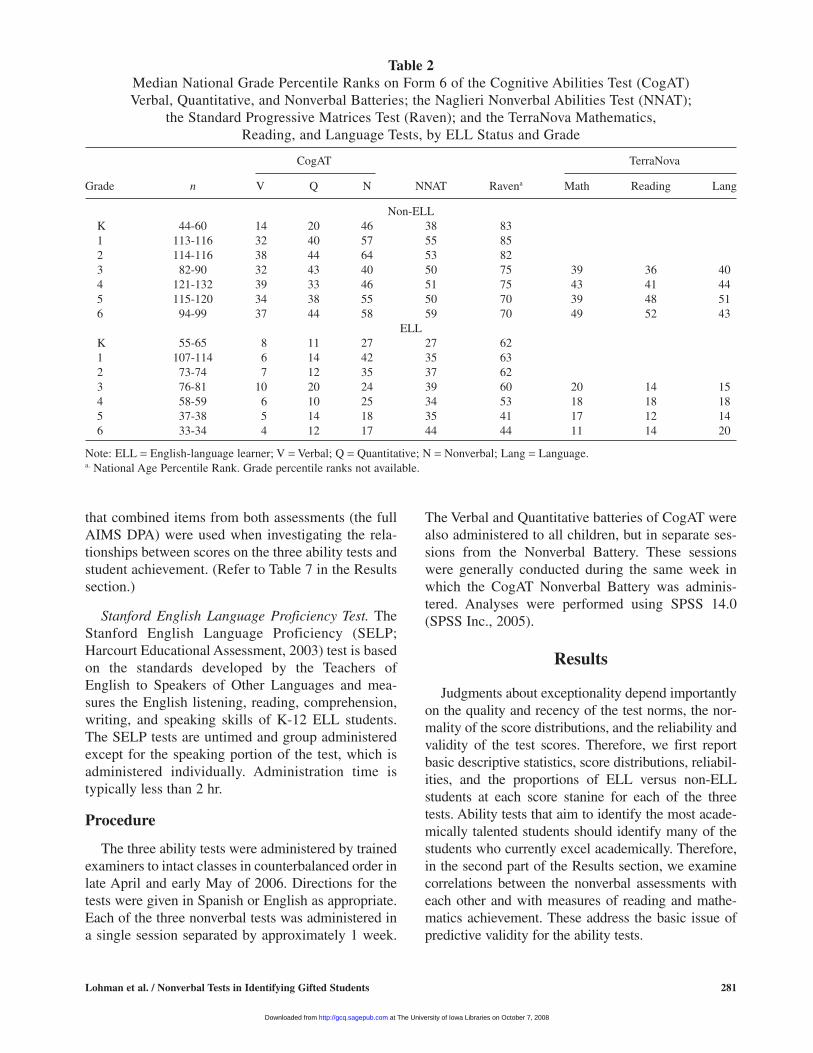
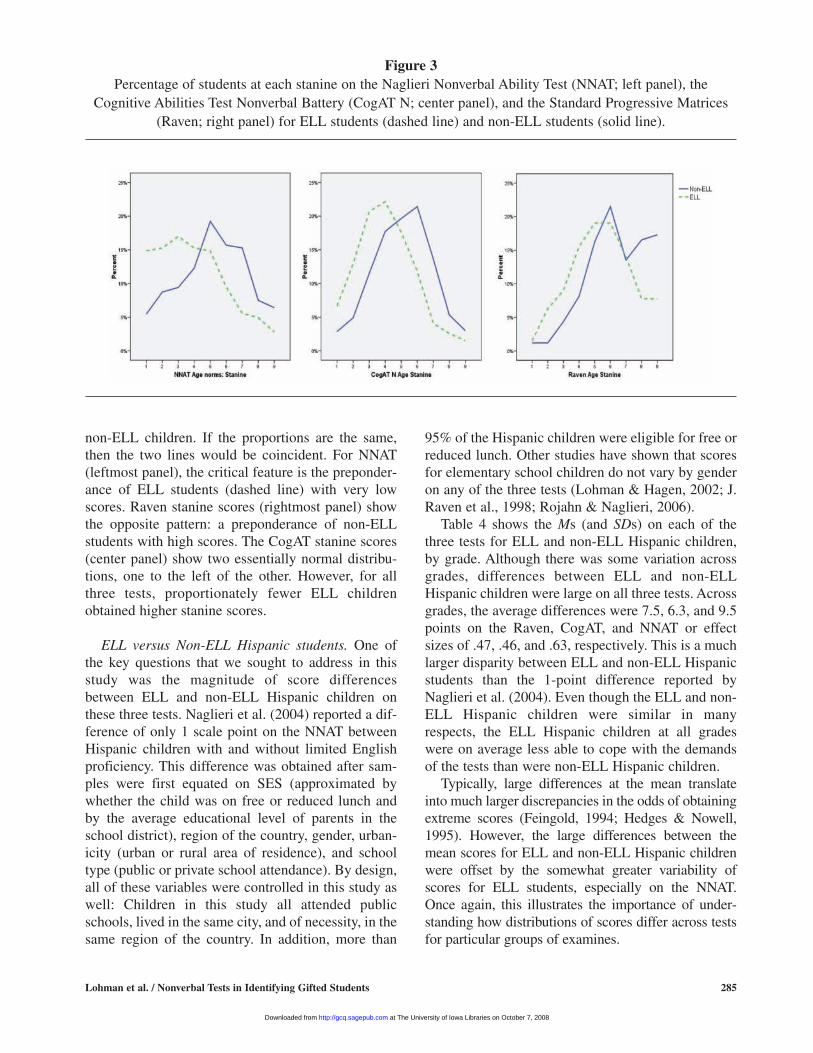
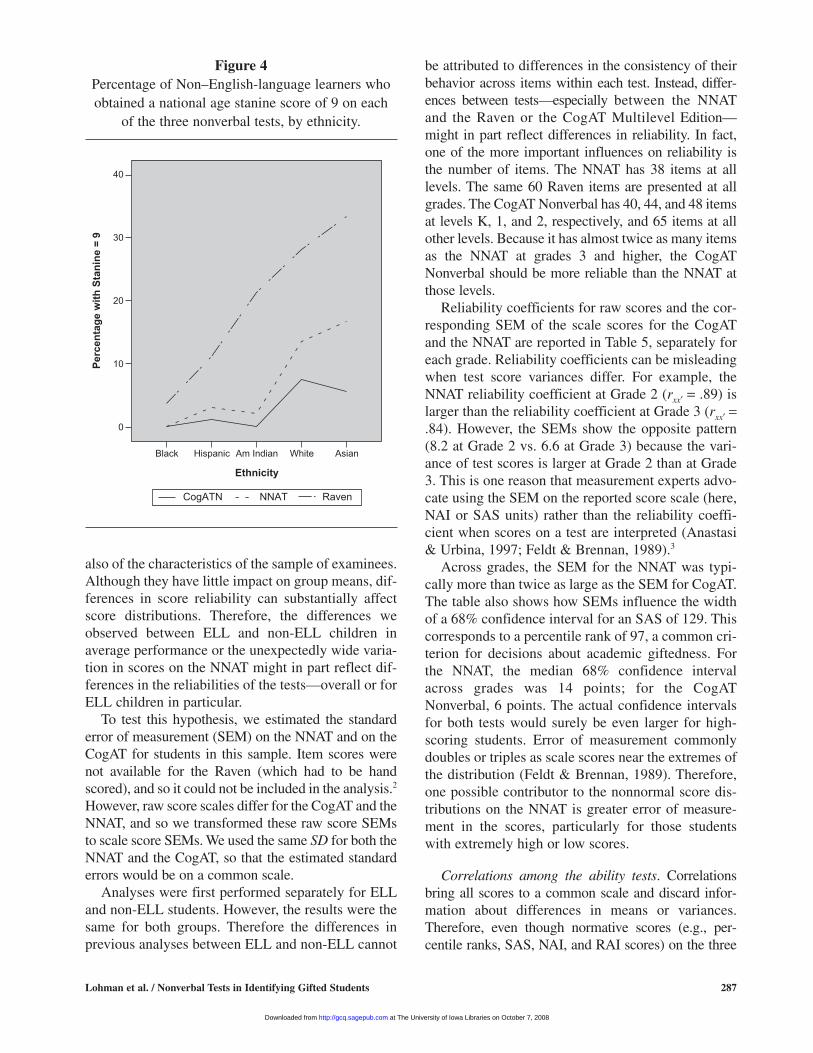
Ethnic differences. The final group comparisonexamined the proportion of students in each ethnicgroup who received a stanine score of 9 on one ormore of the three nonverbal tests. To control for dif-ferences that might be due to language familiarityrather than ethnicity, only the scores of non-ELLstudents were used in this analysis. If Naglieri andFord (2003) are correct, then the NNAT should showapproximately equal proportions of children fromeach ethnic group in the ninth stanine. The relevantdata are shown in Figure 4. Equal proportions ofhigh-scoring students from each ethnic group wouldappear as a horizontal line in the figure. Clearly, thiswas not observed for any of the tests. Although thepattern of scores was similar, the height of the profilevaried as a function of the total number of studentsacross all ethnic categories whose scores wereassigned a stanine of 9 by the national norms tablesfor the test. Asian American and White students weremuch more likely to obtain stanine scores of 9 thanwere American Indian, Hispanic, or Black students
on all three tests. For the Raven, 33.3% of the Asianstudents and 28.0% of the White students receivedstanine scores of 9. The corresponding percentagesfor the NNAT were 15.0 and 12.4; for the CogATNonverbal, 5.0 and 7.0. At the other extreme, the per-centage of Black students was 3.7, 1.6, and 0 on theRaven, NNAT, and CogAT Nonverbal, respectively.
Individual Differences
Analyses to this point have focused on compar-isons of score distributions, particularly on theirmeans and variances. In this section, we examine thedependability of individual differences on the threetests and the consistency of these individual differ-ences across the three ability tests and relationshipswith two measures of academic achievement.
Reliabilities. An essential property of all assess-ments is the reliability of the scores derived from them.But reliability is a function not only of the test and theprocedures that are used to estimate the coefficient but
286 Gifted Child Quarterly, Vol. 52, No. 4
Table 4Means and Standard Deviations for 786 Hispanic Children on the Form 6 Nonverbal
Battery of the Cognitive Abilities Test (CogAT), the Naglieri Nonverbal Ability Test (NNAT),and the Standard Progressive Matrices Test (Raven), by Grade and ELL Status
CogAT Nonverbal SAS NNAT NAI Scorea Raven Ability Index Scoreb
Grade M SD n M SD n M SD n
K Non-ELL 99 12.1 21 99 17.9 21 114 13.3 8ELL 93 14.6 61 90 17.8 61 105 10.8 23
1Non-ELL 100 16.7 43 99 18.9 43 112 14.6 34ELL 97 14.3 105 91 20.5 105 106 17.5 82
2Non-ELL 102 10.3 46 100 14.5 46 111 14.3 46ELL 96 12.5 67 91 16.8 67 106 15.4 67
3Non-ELL 98 15.6 45 102 16.2 45 111 16.0 45ELL 90 13.8 76 93 15.2 76 104 16.5 76
4Non-ELL 98 11.6 74 101 14.6 74 110 15.3 74ELL 89 11.3 57 91 17.1 57 101 13.1 74
5-6Non-ELL 100 12.2 125 101 12.3 125 108 13.5 125ELL 86 10.1 66 90 11.5 66 99 15.1 66
TotalNon-ELL 100 12.9 354 100 14.8 354 110 14.5 332ELL 92 13.7 432 91 17.1 432 104 15.7 371
Note: ELL = English-language learner; NAI = Nonverbal Ability Index; SAS = Standard Age Score.a. Population M = 100, SD = 15.b. The Raven Ability Index (RAI) score was derived from the 1986 U.S. National norms reported in the test manual (J. C. Raven, 1990).The score is normally distributed with M = 100 and SD = 16 to correspond with the CogAT SAS.
at The University of Iowa Libraries on October 7, 2008 http://gcq.sagepub.comDownloaded from
also of the characteristics of the sample of examinees.Although they have little impact on group means, dif-ferences in score reliability can substantially affectscore distributions. Therefore, the differences weobserved between ELL and non-ELL children inaverage performance or the unexpectedly wide varia-tion in scores on the NNAT might in part reflect dif-ferences in the reliabilities of the tests—overall or forELL children in particular.
To test this hypothesis, we estimated the standarderror of measurement (SEM) on the NNAT and on theCogAT for students in this sample. Item scores werenot available for the Raven (which had to be handscored), and so it could not be included in the analysis.2
However, raw score scales differ for the CogAT and theNNAT, and so we transformed these raw score SEMsto scale score SEMs. We used the same SD for both theNNAT and the CogAT, so that the estimated standarderrors would be on a common scale.
Analyses were first performed separately for ELLand non-ELL students. However, the results were thesame for both groups. Therefore the differences inprevious analyses between ELL and non-ELL cannot
be attributed to differences in the consistency of theirbehavior across items within each test. Instead, differ-ences between tests—especially between the NNATand the Raven or the CogAT Multilevel Edition—might in part reflect differences in reliability. In fact,one of the more important influences on reliability isthe number of items. The NNAT has 38 items at alllevels. The same 60 Raven items are presented at allgrades. The CogAT Nonverbal has 40, 44, and 48 itemsat levels K, 1, and 2, respectively, and 65 items at allother levels. Because it has almost twice as many itemsas the NNAT at grades 3 and higher, the CogATNonverbal should be more reliable than the NNAT atthose levels.
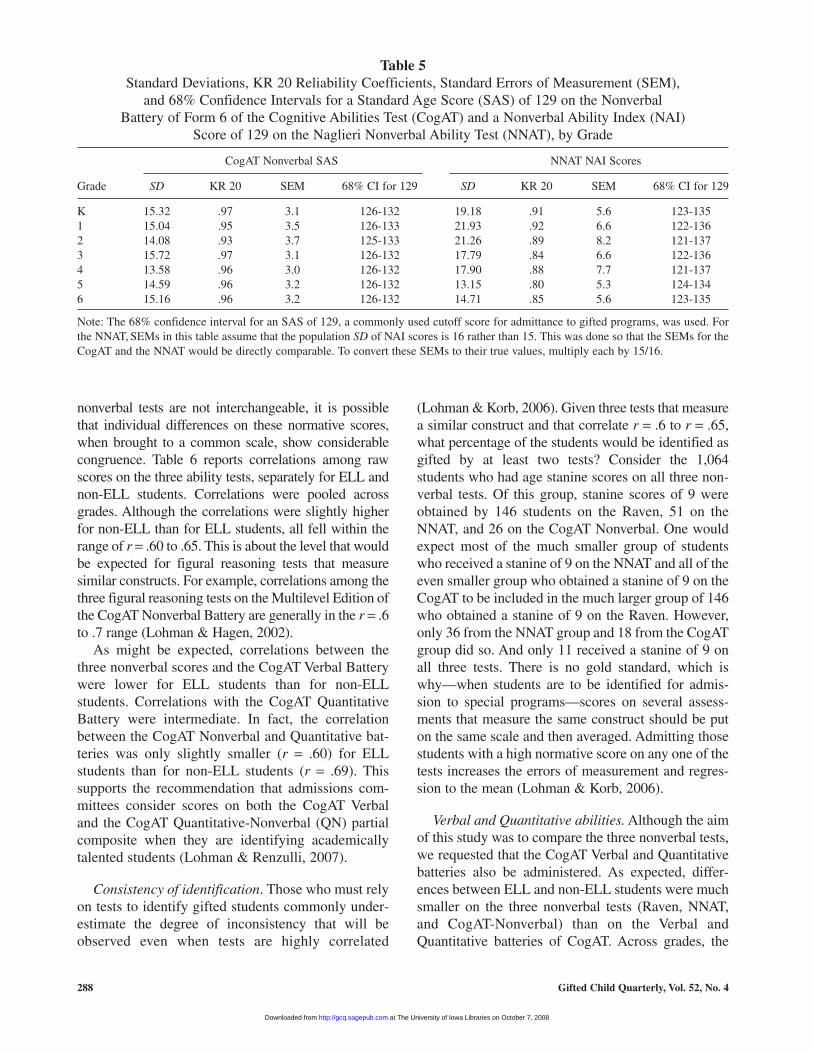
Reliability coefficients for raw scores and the cor-responding SEM of the scale scores for the CogATand the NNAT are reported in Table 5, separately foreach grade. Reliability coefficients can be misleadingwhen test score variances differ. For example, theNNAT reliability coefficient at Grade 2 (rxx′ = .89) islarger than the reliability coefficient at Grade 3 (rxx′ =.84). However, the SEMs show the opposite pattern(8.2 at Grade 2 vs. 6.6 at Grade 3) because the vari-ance of test scores is larger at Grade 2 than at Grade3. This is one reason that measurement experts advo-cate using the SEM on the reported score scale (here,NAI or SAS units) rather than the reliability coeffi-cient when scores on a test are interpreted (Anastasi& Urbina, 1997; Feldt & Brennan, 1989).3
Across grades, the SEM for the NNAT was typi-cally more than twice as large as the SEM for CogAT.The table also shows how SEMs influence the widthof a 68% confidence interval for an SAS of 129. Thiscorresponds to a percentile rank of 97, a common cri-terion for decisions about academic giftedness. Forthe NNAT, the median 68% confidence intervalacross grades was 14 points; for the CogATNonverbal, 6 points. The actual confidence intervalsfor both tests would surely be even larger for high-scoring students. Error of measurement commonlydoubles or triples as scale scores near the extremes ofthe distribution (Feldt & Brennan, 1989). Therefore,one possible contributor to the nonnormal score dis-tributions on the NNAT is greater error of measure-ment in the scores, particularly for those studentswith extremely high or low scores.
Correlations among the ability tests. Correlationsbring all scores to a common scale and discard infor-mation about differences in means or variances.Therefore, even though normative scores (e.g., per-centile ranks, SAS, NAI, and RAI scores) on the three
Lohman et al. / Nonverbal Tests in Identifying Gifted Students 287
Figure 4Percentage of Non–English-language learners whoobtained a national age stanine score of 9 on each
of the three nonverbal tests, by ethnicity.
Ethnicity
AsianWhiteAm IndianHispanicBlack
Perc
enta
ge w
ith S
tani
ne =
9
40
30
20
10
0
Raven NNAT CogATN
at The University of Iowa Libraries on October 7, 2008 http://gcq.sagepub.comDownloaded from
nonverbal tests are not interchangeable, it is possiblethat individual differences on these normative scores,when brought to a common scale, show considerablecongruence. Table 6 reports correlations among rawscores on the three ability tests, separately for ELL andnon-ELL students. Correlations were pooled acrossgrades. Although the correlations were slightly higherfor non-ELL than for ELL students, all fell within therange of r = .60 to .65. This is about the level that wouldbe expected for figural reasoning tests that measuresimilar constructs. For example, correlations among thethree figural reasoning tests on the Multilevel Edition ofthe CogAT Nonverbal Battery are generally in the r = .6to .7 range (Lohman & Hagen, 2002).
As might be expected, correlations between thethree nonverbal scores and the CogAT Verbal Batterywere lower for ELL students than for non-ELLstudents. Correlations with the CogAT QuantitativeBattery were intermediate. In fact, the correlationbetween the CogAT Nonverbal and Quantitative bat-teries was only slightly smaller (r = .60) for ELLstudents than for non-ELL students (r = .69). Thissupports the recommendation that admissions com-mittees consider scores on both the CogAT Verbaland the CogAT Quantitative-Nonverbal (QN) partialcomposite when they are identifying academicallytalented students (Lohman & Renzulli, 2007).
Consistency of identification. Those who must relyon tests to identify gifted students commonly under-estimate the degree of inconsistency that will beobserved even when tests are highly correlated
(Lohman & Korb, 2006). Given three tests that measurea similar construct and that correlate r = .6 to r = .65,what percentage of the students would be identified asgifted by at least two tests? Consider the 1,064students who had age stanine scores on all three non-verbal tests. Of this group, stanine scores of 9 wereobtained by 146 students on the Raven, 51 on theNNAT, and 26 on the CogAT Nonverbal. One wouldexpect most of the much smaller group of studentswho received a stanine of 9 on the NNAT and all of theeven smaller group who obtained a stanine of 9 on theCogAT to be included in the much larger group of 146who obtained a stanine of 9 on the Raven. However,only 36 from the NNAT group and 18 from the CogATgroup did so. And only 11 received a stanine of 9 onall three tests. There is no gold standard, which iswhy—when students are to be identified for admis-sion to special programs—scores on several assess-ments that measure the same construct should be puton the same scale and then averaged. Admitting thosestudents with a high normative score on any one of thetests increases the errors of measurement and regres-sion to the mean (Lohman & Korb, 2006).
Verbal and Quantitative abilities. Although the aimof this study was to compare the three nonverbal tests,we requested that the CogAT Verbal and Quantitativebatteries also be administered. As expected, differ-ences between ELL and non-ELL students were muchsmaller on the three nonverbal tests (Raven, NNAT,and CogAT-Nonverbal) than on the Verbal andQuantitative batteries of CogAT. Across grades, the
288 Gifted Child Quarterly, Vol. 52, No. 4
Table 5Standard Deviations, KR 20 Reliability Coefficients, Standard Errors of Measurement (SEM),
and 68% Confidence Intervals for a Standard Age Score (SAS) of 129 on the NonverbalBattery of Form 6 of the Cognitive Abilities Test (CogAT) and a Nonverbal Ability Index (NAI)
Score of 129 on the Naglieri Nonverbal Ability Test (NNAT), by Grade
CogAT Nonverbal SAS NNAT NAI Scores
Grade SD KR 20 SEM 68% CI for 129 SD KR 20 SEM 68% CI for 129
K 15.32 .97 3.1 126-132 19.18 .91 5.6 123-1351 15.04 .95 3.5 126-133 21.93 .92 6.6 122-1362 14.08 .93 3.7 125-133 21.26 .89 8.2 121-1373 15.72 .97 3.1 126-132 17.79 .84 6.6 122-1364 13.58 .96 3.0 126-132 17.90 .88 7.7 121-1375 14.59 .96 3.2 126-132 13.15 .80 5.3 124-1346 15.16 .96 3.2 126-132 14.71 .85 5.6 123-135
Note: The 68% confidence interval for an SAS of 129, a commonly used cutoff score for admittance to gifted programs, was used. Forthe NNAT, SEMs in this table assume that the population SD of NAI scores is 16 rather than 15. This was done so that the SEMs for theCogAT and the NNAT would be directly comparable. To convert these SEMs to their true values, multiply each by 15/16.
at The University of Iowa Libraries on October 7, 2008 http://gcq.sagepub.comDownloaded from
average difference between ELL and non-ELLstudents was 16.6 SAS points on the CogAT VerbalBattery and 13.2 points on the Quantitative Battery.Thus, the differences between ELL and non-ELLstudents were twice as large on the CogAT VerbalBattery (16.6 points) as on the CogAT NonverbalBattery (8.3 points). But does this mean that the non-verbal test is a better measure of academic talent?
Predictive validity. Correlations between the threeability tests and measures of reading and mathemat-ics achievement are shown in Table 7. Correlationswith the reading and mathematics achievement scoresare reported separately by grade and ELL status. Theachievement tests were only administered at grades 3through 6. The Grade 5 and 6 samples were combinedin an effort to obtain a sufficiently large sample ofELL students.4
There were several noteworthy results. First, corre-lations were uniformly higher for non-ELL studentsthan for ELL students. There are several ways tointerpret this finding. For example, it could mean thatthe ability tests are less valid for ELL students, thatthe achievement tests are less valid (or reliable) forELL students, or that some ELL students respondedmuch more to instruction than other ELL students
between the time the ability and achievement testswere administered.
Second, none of the nonverbal tests predicted read-ing achievement very well. Except for the Grade 5-6ELL sample, the CogAT Verbal Battery was a muchbetter predictor of reading achievement for both ELLand non-ELL children. The median correlations forthe three nonverbal tests with reading achievementwere r = .49 and .35 for non-ELL and ELL children,respectively. Interestingly, the median correlationbetween NNAT and reading comprehension inSpanish was also r = .35 in a separate study (Naglieri& Ronning, 2000a). Thus, that the TerraNova readingtest was in English does not appear to be the cause ofthe lower correlation between the nonverbal tests andreading comprehension for ELL students.
The correlations between the CogAT Verbal andreading achievement were considerably higher: r = .76and .54 for non-ELL and ELL students, respectively.This represents a substantial increase in predictivevalidity. However, as shown by the VQN multiple cor-relations in Table 7, the CogAT Nonverbal scores addedlittle or nothing to the prediction of reading compre-hension afforded by the CogAT Verbal scores alone(again, with the exception of the Grade 5-6 ELL group).Indeed, the regression weight for the Nonverbal scorehovered around zero—sometimes positive, sometimesnegative—for both ELL and non-ELL students.
Third, although the three nonverbal tests betterpredicted mathematics achievement than readingachievement, the CogAT Quantitative showed highercorrelations. However, as shown in Table 7, the bestprediction was obtained when CogAT Verbal andNonverbal were also entered into the regression. Thisis a common finding. Learning mathematics and per-forming well on mathematics achievement testsrequire verbal reasoning and figural–spatial reason-ing as well as quantitative reasoning ability (Floyd,Evans, & McGrew, 2003). This applies to allstudents—those who are native speakers of Englishand those who are learning to speak the language.
Discussion
This controlled comparison of the Raven, the NNAT,and the CogAT showed that the three tests differ impor-tantly in the quality of their norms, in the reliability ofthe scores they produce, and in their ability to identifythe most academically able ELL and non-ELL students.
First, and most important, we observed substantialdifferences between the nonverbal test scores of ELL
Lohman et al. / Nonverbal Tests in Identifying Gifted Students 289
Table 6Pooled Within-Grade Correlations Among RawScores for Non–English-Language Learners and
English-Language Learners on Form 6 of theCognitive Abilities Test (CogAT), the Naglieri
Nonverbal Ability Test (NNAT), and the StandardProgressive Matrices Test (Raven)
CogAT NNAT Raven
Test Verbal Quantitative Nonverbal
Non-ELL (n = 664)CogAT
Verbal 1.00 0.71 0.64 0.44 0.50Quantitative 1.00 0.69 0.55 0.56Nonverbal 1.00 0.65 0.62
NNAT 1.00 0.66Raven 1.00
ELL (n = 426)CogAT
Verbal 1.00 0.53 0.40 0.31 0.35Quantitative 1.00 0.60 0.48 0.48Nonverbal 1.00 0.60 0.61
NNAT 1.00 0.64Raven 1.00
Note: ELL = English-language learners.
at The University of Iowa Libraries on October 7, 2008 http://gcq.sagepub.comDownloaded from
and non-ELL children, both on average and in theproportions of these children at different points in thescore distributions. These proportions varied dramat-ically across the three tests. On the NNAT, ELLstudents were much more likely to receive very lowscores. On the Raven, non-ELL children were muchmore likely to receive very high scores. Only theCogAT Nonverbal showed normally distributedscores for both groups. Differences between the meanscores of ELL and non-ELL children were reducedonly slightly when we controlled for ethnicity bycomparing only Hispanic ELL and non-ELLstudents. Previous research that statistically con-trolled for environmental factors found small differ-ences between ELL and non-ELL students on theNNAT (Naglieri et al., 2004). However, this studynaturally controlled for the same variables and founddifferences of 7.5, 7.3, and 9.5 points on the Raven,CogAT, and NNAT, respectively. These differencesare congruent with the conclusion that nonverbal testsdo not see through the veneer of culture, education, orlanguage development (Anastasi & Urbina, 1997;Cronbach, 1990; Scarr, 1994).
Second, norms for two of the nonverbal tests wereseriously awry. In particular, the 1986 U.S. norms forthe Raven were, on average, markedly easier than the1995-1996 NNAT norms or the 2000 CogAT norms.When placed on the same scale as CogAT, scores forboth ELL and non-ELL students were 10 to 11 pointshigher on the Raven than on either the NNAT or theCogAT Nonverbal tests. Higher scores on Raven inpart reflect the increase in scores on all ability tests(especially figural reasoning tests) that has occurredover the past 70 years (Dickens & Flynn, 2001;Flynn, 1999; J. Raven, 2000). But in larger measure,it most likely reflects the fact that the 1986 U.S.norms for the Raven were not based on a representa-tive national sample but on a compilation of conve-nience samples of test scores for the 20 to 26 schoolsor school districts that submitted scores to the testauthors over the years.
For the NNAT, on the other hand, NAI scores weremuch more variable than they should have been,especially at the primary grades. Distributions of NAIscores showed that very low scores on the NNATwere much more common than expected for ELL
290 Gifted Child Quarterly, Vol. 52, No. 4
Table 7Correlations Between Form 6 of the Cognitive Abilities Test (CogAT), the Naglieri Nonverbal
Ability Test (NNAT), and the Standard Progressive Matrices Test (Raven), the Stanford English Language Proficiency Test (SELP) and Composite TerraNova Reading and Mathematics
Achievement Test Scores, by English-Language Learner Status and Grade
Non-ELL ELL
Test Score Grade 3 Grade 4 Grade 5-6 Grade 3 Grade 4 Grade 5-6
Reading Composite Scale ScoreCogAT
Verbal SS .76 .79 .74 .68 .54 .27Quantitative SS .62 .68 .61 .43 .48 .30Nonverbal SS .56 .61 .52 .35 .38 .29VQN Multiple R .77 .81 .76 .68 .59 .36
NNAT Scale Score .35 .49 .49 .38 .35 .16Raven Raw Score .42 .55 .47 .46 .39 .19SELP Oral Prof .45 .49 .18
Mathematics Composite Scale ScoreCogAT
Verbal SS .74 .75 .67 .61 .54 .54Quantitative SS .78 .82 .78 .68 .62 .62Nonverbal SS .73 .75 .68 .56 .44 .44VQN Multiple R .84 .87 .82 .73 .67 .58
NNAT Scale Score .55 .60 .66 .48 .38 .38Raven Raw Score .55 .60 .58 .46 .47 .47SELP Oral Prof .51 .50 .50n 82-90 120-131 205-215 74-79 53-58 69-70
Note: ELL = English-language learners; SS = Scale Score.
at The University of Iowa Libraries on October 7, 2008 http://gcq.sagepub.comDownloaded from
students in grades K to 2 and for non-ELL students atGrade 1. On the other hand, high NAI scores weremore common than expected for non-ELL students.We explored the possibility that the excessively largeSDs might reflect the fact that the SEM for the NNATwas typically more than twice as large as the SEM forthe Raven or the CogAT Nonverbal. However, a con-sistently larger SEM cannot explain why the varianceof NAI scores increased systematically as one movedfrom level E downward to level A.
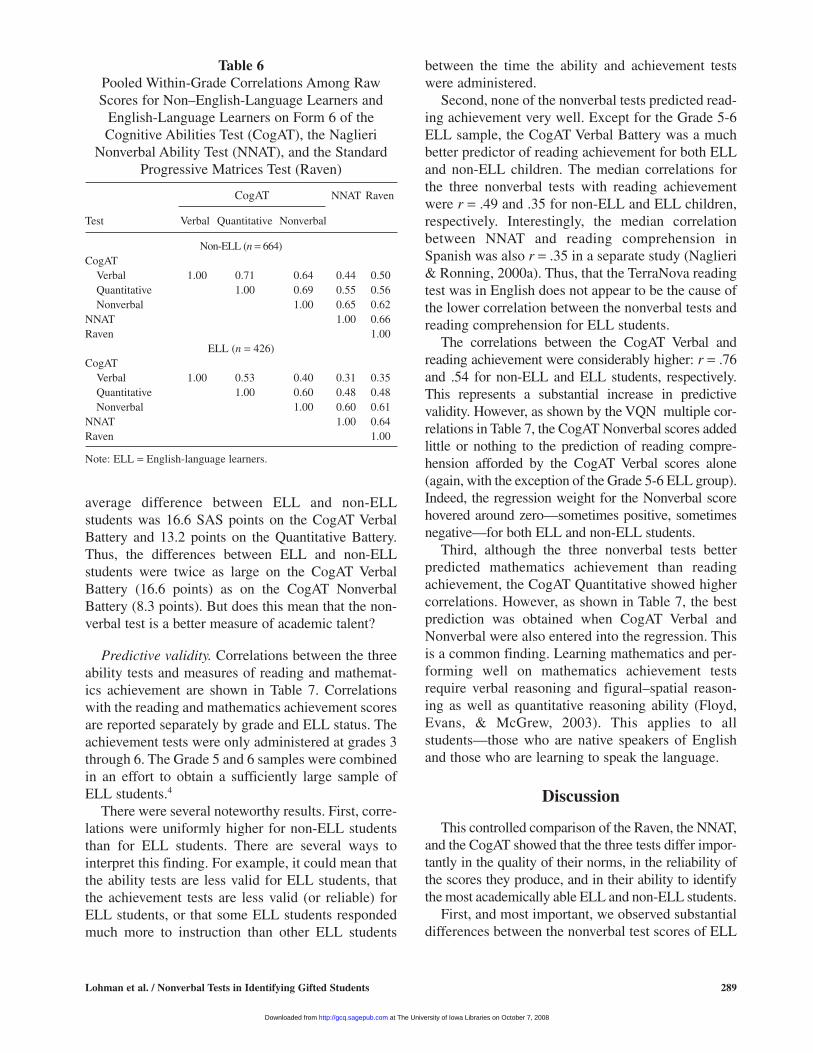
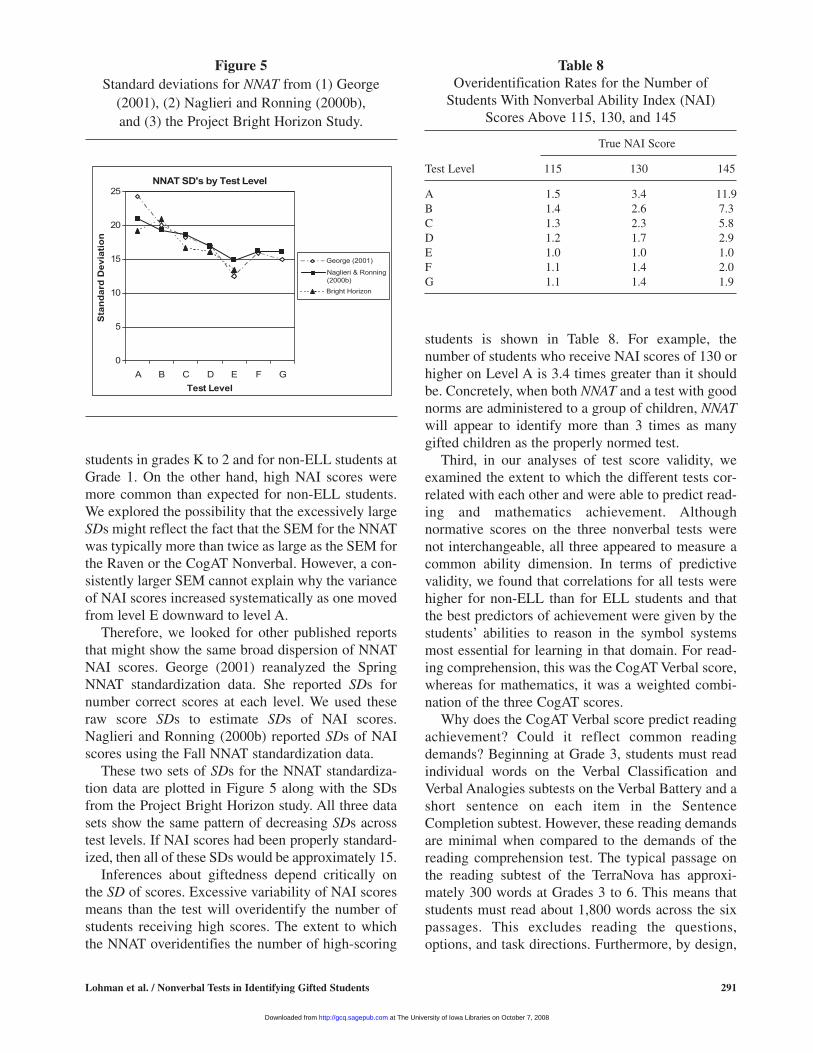
Therefore, we looked for other published reportsthat might show the same broad dispersion of NNATNAI scores. George (2001) reanalyzed the SpringNNAT standardization data. She reported SDs fornumber correct scores at each level. We used theseraw score SDs to estimate SDs of NAI scores.Naglieri and Ronning (2000b) reported SDs of NAIscores using the Fall NNAT standardization data.
These two sets of SDs for the NNAT standardiza-tion data are plotted in Figure 5 along with the SDsfrom the Project Bright Horizon study. All three datasets show the same pattern of decreasing SDs acrosstest levels. If NAI scores had been properly standard-ized, then all of these SDs would be approximately 15.
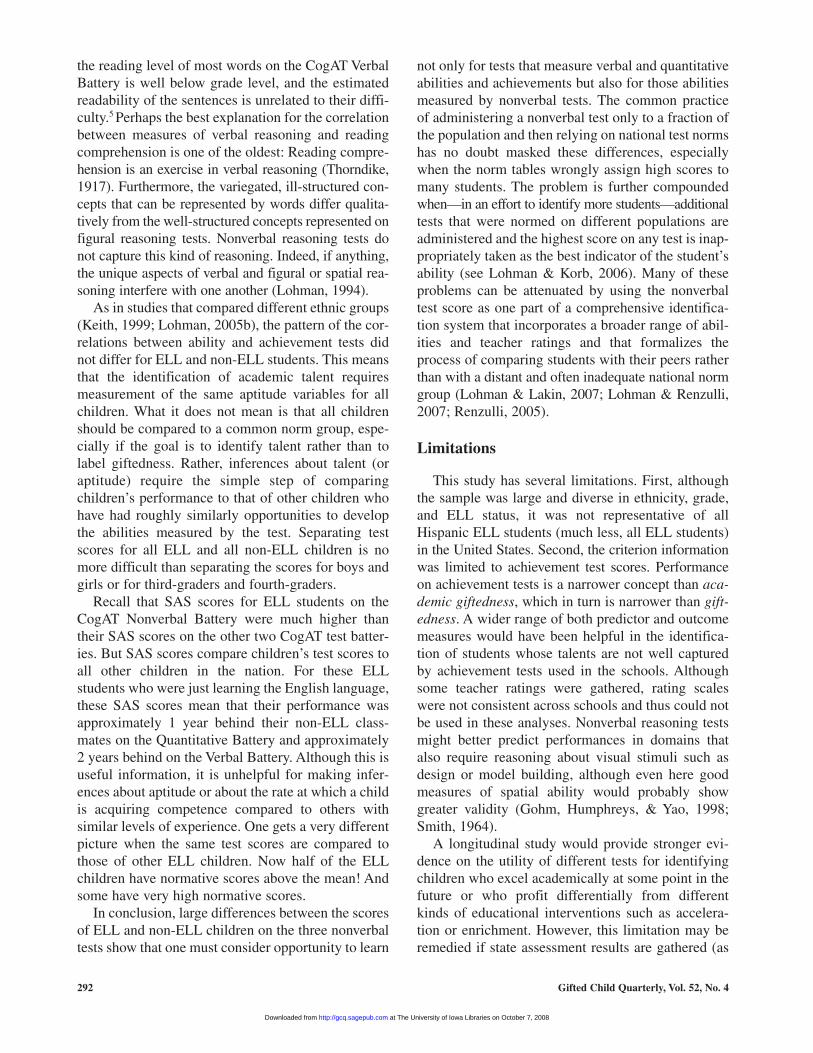
Inferences about giftedness depend critically onthe SD of scores. Excessive variability of NAI scoresmeans than the test will overidentify the number ofstudents receiving high scores. The extent to whichthe NNAT overidentifies the number of high-scoring
students is shown in Table 8. For example, thenumber of students who receive NAI scores of 130 orhigher on Level A is 3.4 times greater than it shouldbe. Concretely, when both NNAT and a test with goodnorms are administered to a group of children, NNATwill appear to identify more than 3 times as manygifted children as the properly normed test.
Third, in our analyses of test score validity, weexamined the extent to which the different tests cor-related with each other and were able to predict read-ing and mathematics achievement. Althoughnormative scores on the three nonverbal tests werenot interchangeable, all three appeared to measure acommon ability dimension. In terms of predictivevalidity, we found that correlations for all tests werehigher for non-ELL than for ELL students and thatthe best predictors of achievement were given by thestudents’ abilities to reason in the symbol systemsmost essential for learning in that domain. For read-ing comprehension, this was the CogAT Verbal score,whereas for mathematics, it was a weighted combi-nation of the three CogAT scores.
Why does the CogAT Verbal score predict readingachievement? Could it reflect common readingdemands? Beginning at Grade 3, students must readindividual words on the Verbal Classification andVerbal Analogies subtests on the Verbal Battery and ashort sentence on each item in the SentenceCompletion subtest. However, these reading demandsare minimal when compared to the demands of thereading comprehension test. The typical passage onthe reading subtest of the TerraNova has approxi-mately 300 words at Grades 3 to 6. This means thatstudents must read about 1,800 words across the sixpassages. This excludes reading the questions,options, and task directions. Furthermore, by design,
Lohman et al. / Nonverbal Tests in Identifying Gifted Students 291
Figure 5Standard deviations for NNAT from (1) George
(2001), (2) Naglieri and Ronning (2000b),and (3) the Project Bright Horizon Study.
NNAT SD's by Test Level
0
5
10
15
20
25
A B C D E F GTest Level
Sta
ndar
d D
evia
tion
George (2001)
Naglieri & Ronning(2000b)Bright Horizon
Table 8Overidentification Rates for the Number of
Students With Nonverbal Ability Index (NAI) Scores Above 115, 130, and 145
True NAI Score
Test Level 115 130 145
A 1.5 3.4 11.9B 1.4 2.6 7.3C 1.3 2.3 5.8D 1.2 1.7 2.9E 1.0 1.0 1.0F 1.1 1.4 2.0G 1.1 1.4 1.9
at The University of Iowa Libraries on October 7, 2008 http://gcq.sagepub.comDownloaded from
the reading level of most words on the CogAT VerbalBattery is well below grade level, and the estimatedreadability of the sentences is unrelated to their diffi-culty.5 Perhaps the best explanation for the correlationbetween measures of verbal reasoning and readingcomprehension is one of the oldest: Reading compre-hension is an exercise in verbal reasoning (Thorndike,1917). Furthermore, the variegated, ill-structured con-cepts that can be represented by words differ qualita-tively from the well-structured concepts represented onfigural reasoning tests. Nonverbal reasoning tests donot capture this kind of reasoning. Indeed, if anything,the unique aspects of verbal and figural or spatial rea-soning interfere with one another (Lohman, 1994).
As in studies that compared different ethnic groups(Keith, 1999; Lohman, 2005b), the pattern of the cor-relations between ability and achievement tests didnot differ for ELL and non-ELL students. This meansthat the identification of academic talent requiresmeasurement of the same aptitude variables for allchildren. What it does not mean is that all childrenshould be compared to a common norm group, espe-cially if the goal is to identify talent rather than tolabel giftedness. Rather, inferences about talent (oraptitude) require the simple step of comparingchildren’s performance to that of other children whohave had roughly similarly opportunities to developthe abilities measured by the test. Separating testscores for all ELL and all non-ELL children is nomore difficult than separating the scores for boys andgirls or for third-graders and fourth-graders.
Recall that SAS scores for ELL students on theCogAT Nonverbal Battery were much higher thantheir SAS scores on the other two CogAT test batter-ies. But SAS scores compare children’s test scores toall other children in the nation. For these ELLstudents who were just learning the English language,these SAS scores mean that their performance wasapproximately 1 year behind their non-ELL class-mates on the Quantitative Battery and approximately2 years behind on the Verbal Battery. Although this isuseful information, it is unhelpful for making infer-ences about aptitude or about the rate at which a childis acquiring competence compared to others withsimilar levels of experience. One gets a very differentpicture when the same test scores are compared tothose of other ELL children. Now half of the ELLchildren have normative scores above the mean! Andsome have very high normative scores.
In conclusion, large differences between the scoresof ELL and non-ELL children on the three nonverbaltests show that one must consider opportunity to learn
not only for tests that measure verbal and quantitativeabilities and achievements but also for those abilitiesmeasured by nonverbal tests. The common practiceof administering a nonverbal test only to a fraction ofthe population and then relying on national test normshas no doubt masked these differences, especiallywhen the norm tables wrongly assign high scores tomany students. The problem is further compoundedwhen—in an effort to identify more students—additionaltests that were normed on different populations areadministered and the highest score on any test is inap-propriately taken as the best indicator of the student’sability (see Lohman & Korb, 2006). Many of theseproblems can be attenuated by using the nonverbaltest score as one part of a comprehensive identifica-tion system that incorporates a broader range of abil-ities and teacher ratings and that formalizes theprocess of comparing students with their peers ratherthan with a distant and often inadequate national normgroup (Lohman & Lakin, 2007; Lohman & Renzulli,2007; Renzulli, 2005).
Limitations
This study has several limitations. First, althoughthe sample was large and diverse in ethnicity, grade,and ELL status, it was not representative of allHispanic ELL students (much less, all ELL students)in the United States. Second, the criterion informationwas limited to achievement test scores. Performanceon achievement tests is a narrower concept than aca-demic giftedness, which in turn is narrower than gift-edness. A wider range of both predictor and outcomemeasures would have been helpful in the identifica-tion of students whose talents are not well capturedby achievement tests used in the schools. Althoughsome teacher ratings were gathered, rating scaleswere not consistent across schools and thus could notbe used in these analyses. Nonverbal reasoning testsmight better predict performances in domains thatalso require reasoning about visual stimuli such asdesign or model building, although even here goodmeasures of spatial ability would probably showgreater validity (Gohm, Humphreys, & Yao, 1998;Smith, 1964).
A longitudinal study would provide stronger evi-dence on the utility of different tests for identifyingchildren who excel academically at some point in thefuture or who profit differentially from differentkinds of educational interventions such as accelera-tion or enrichment. However, this limitation may beremedied if state assessment results are gathered (as
292 Gifted Child Quarterly, Vol. 52, No. 4
at The University of Iowa Libraries on October 7, 2008 http://gcq.sagepub.comDownloaded from
planned) for those students in this study who remainin the state in future years.
Implications
This study has several important implications foreducators. First, one cannot assume that nonverbaltests level the playing field for children who comefrom different cultures or who have had different edu-cational opportunities. The ELL children in this studyscored from .5 to .6 SD lower than non-ELL childrenon all three nonverbal tests. The lower performanceof ELL children could not be attributed to economicfactors, to the student’s age or grade, or to otherdemographic factors. Nor could it be attributed to aninability to understand the test directions, becausedirections were given in Spanish whenever necessary.
The second implication is more of a caution.Practitioners need to be appropriately skeptical aboutnational norms, especially for tests that were normedon different populations. The unwary user who admin-istered the Progressive Matrices or the NNAT afteradministering a test with good norms would incor-rectly assume that these tests were much more suc-cessful in identifying gifted children than the first test.Because of outdated or improperly computed norma-tive scores, many more students will obtain unusuallyhigh (and, on the NNAT, unusually low) scores thanthe norms tables would lead one to expect.
A related implication is that practitioners shouldalways examine the distributions of test scores. This isnot difficult to do. Many teachers construct histogramsby hand for scores on classroom tests. If asked, mosttest publishers will report these distributions and localnorms derived from them. However, anyone who canuse a basic spreadsheet (such as Microsoft Excel) cando it with a few mouse clicks on the data sets that pub-lishers provide. It was only by examining score distri-butions that we discovered that the most commonscore for ELL children in Grade 1 was a stanine scoreof 1 on the NNAT or that the most common score fornon-ELL children in both grades 1 and 2 was a staninescore of 9 on the Progressive Matrices Test.
Finally, this controlled comparison of the Raven,NNAT, and CogAT provided no support for the claimthat the NNAT identifies equal proportions of high-scoring students from different ethnic or languagegroups. Nonverbal tests need not fulfill a utopianvision as measures of innate ability unencumbered byculture, education, or experience in order to play auseful role in the identification of academically giftedchildren. Nonverbal reasoning tests do help identify
bright children, especially those who are poor or whoare not fluent in the language of the dominant culture.When combined with measures of quantitative reason-ing and spatial ability, nonverbal reasoning tests areparticularly effective for identifying students who willexcel in engineering, mathematics, and related fields(Shea, Lubinski, & Benbow, 2001). As this exampleillustrates, the identification of talent in any domain isbest made from measures that are more proximal to thespecific cognitive, affective, and conative aptitudesrequired for success in that domain than from mea-sures of more distal constructs. Students who mightsomeday excel as writers, mathematicians, or artistswill generally show rapid learning when given theopportunity to learn concepts and skills in thosedomains. These students will also obtain high scoreson the verbal, quantitative, or spatial tests that measurethe specific aptitudes required to develop competencein the domain (Corno et al., 2002). But their develop-ment will not be considered unusual unless their testscores are compared to the test scores of other childrenwho have had roughly similar opportunities to developthe abilities that are measured (Lohman & Lakin,2007). This applies to all abilities—even those abilitiesmeasured by nonverbal reasoning tests.
Notes
1. This was accomplished by finding the score in a normal dis-tribution with a mean of 100 and SD of 16 that corresponded witheach percentile rank. For example, percentile ranks of 16, 50, and84 correspond with RAI scores of 84, 100, and 116, respectively.
2. For each test, we first estimated KR 20 reliability (rxx′) fromthe item scores and then computed the error variance V(e) by V(e)= V(x) (1 − rxx′), where V(x) is the variance of the raw scores. Forthe CogAT, this was done separately for each subtest and the errorvariances summed (Feldt & Brennan, 1998). The square root ofthis total error variance gives the raw score SEM. Our best guessis that the SEM for Raven would be approximately 2.7 to 3.0 ona scale with M = 100 and SD = 16. Oddly, SEMs are only reportedgraphically in the Raven test manual.
3. The reliability coefficient is estimated by the ratio of twovariances:
Observed Score Variance – Error VarianceReliability Coefficient = _______________________________________
Observed Score Variance
A large increase in observed score variance is generally asso-ciated with a much smaller increase in error variance. Indeed, theerror variance is often assumed to be constant across samples.
4. Even though scale scores are used for all tests except theRaven (for which raw scores on the same test form are compara-ble across grades), combining the grade 5 and 6 samples in thisway may have introduced other factors, especially for theachievement tests. This could explain the lower than expectedcorrelations for the Grade 5-6 group.
Lohman et al. / Nonverbal Tests in Identifying Gifted Students 293
at The University of Iowa Libraries on October 7, 2008 http://gcq.sagepub.comDownloaded from
5. Students who have reading difficulties can be administeredthe test orally. The assertion that the CogAT Verbal Battery is justa reading test cannot explain why the reliability of differencesbetween the CogAT Verbal score and ITBS Reading Comprehen-sion is about r = .7. If the two tests measured the same thing, thenthis reliability would be 0. Nor is it true that items are difficult toread. Naglieri and Ford (2005) calculated the readability of itemson Level D (i.e., Grade 6) of the CogAT Sentence Completionsubtest using the Flesch-Kincaid Grade Level method (Flesch,1948). However, readability formulas require passages with aminimum of 100 words. Applying these formulas to sentencesproduces a result that is mostly random noise. Thus, it is unsur-prising that these readability numbers have no relationship withthe actual difficulties of the items (Lohman, 2005b). What is sur-prising is that the readability numbers continue to be presented asdependable facts (Naglieri, 2007), even after these basic misusesof the readability statistics were pointed out. As the late SenatorMoynihan once observed, “Everyone is entitled to his or her ownopinion, but not to his or her own facts.”
References
Anastasi, A., & Urbina, S. (1997). Psychological testing (7th ed.).Upper Saddle River, NJ: Prentice Hall.
Arizona Department of Education. (2006, November). AIMSstudent guides. Retrieved September 4, 2007, fromhttp://www.ade.state.az.us/standards/AIMS/AIMSSTGuides/
Bittker, C. M. (1991). Patterns of academic achievement instudents who qualified for a gifted program on the basis ofnonverbal tests. Roeper Review, 14, 65-68.
Braden, J. P. (2000). Perspectives on the nonverbal assessment ofintelligence. Journal of Psychoeducational Assessment, 18,204-210.
Corno, L., Cronbach, L. J., Kupermintz, H., Lohman, D. F.,Mandinach, E. B., Porteus, A. W., et al. (2002). Remaking theconcept of aptitude: Extending the legacy of Richard E. Snow.Hillsdale, NJ: Erlbaum.
Cronbach, L. J. (1957). The two disciplines of scientific psychol-ogy. American Psychologist, 12, 671-684.
Cronbach, L. J. (1990). Essentials of psychological testing (5thed.). New York: Harper & Row.
CTB/McGraw-Hill. (2002). TerraNova, the Second Edition.Monterey, CA: Author.
Dickens, W. T., & Flynn, J. R. (2001). Heritability estimates ver-sus large environmental effects: The IQ paradox resolved.Psychological Review, 108, 346-369.
Drake, K. S. (2006, June). Gifted services identification report.Saint Paul, MN: Saint Paul Public Schools, Department ofResearch, Evaluation and Assessment, Office of Research andDevelopment.
Feingold, A. (1994). Gender differences in variability in intellec-tual abilities: A cross-cultural perspective. Sex Roles: AJournal of Research, 30, 81-92.
Feldt, L. S., & Brennan, R. L. (1989). Reliability. In R. L. Linn(Ed.), Educational measurement (3rd ed., pp. 105-146). NewYork: Macmillan.
Flesch, R. (1948). A new readability yardstick. Journal ofApplied Psychology, 32, 221-233.
Floyd, R. G., Evans, J. J., & McGrew, K. S. (2003). Relationsbetween measures of Cattell-Horn-Carroll (CHC) Cognitive
Abilities and mathematics achievement across the school-ageyears. Psychology in the Schools, 40, 155-171.
Flynn, J. R. (1999). Searching for justice: The discovery of IQgains over time. American Psychologist, 54, 5-20.
Frasier, M. M., García, J. H., & Passow, A. H. (1995). A review ofassessment issues in gifted education and their implicationsfor identifying gifted minority students (RM95204). Storrs,CT: The National Research Center on the Gifted and Talented.Retrieved September 4, 2007, from the University ofConnecticut, Neag Center for Gifted Education and TalentDevelopment Web site: http://www.gifted.uconn.edu/nrcgt/reports/rm95204/rm95204.pdf
Ford, D. Y., & Harris, J. J., III. (1999). Multicultural gifted educa-tion (Education and Psychology of the Gifted Series). New York:Teachers College Press.
George, C. E. (2001). The Naglieri Nonverbal Ability Test:Assessment of cross-cultural validity, reliability, and differentialitem functioning (Doctoral dissertation, Fordham University,2001). Dissertation Abstracts International, 62, 6018.
Gohm, C. L., Humphreys, L. G., & Yao, G. (1998).Underachievement among spatially gifted students. AmericanEducational Research Journal, 35, 515-531.
Gustafsson, J.-E., & Balke, G. (1993). General and specific abil-ities as predictors of school achievement. MultivariateBehavioral Research, 28, 407-434.
Harcourt Educational Assessment. (2003). Stanford EnglishLanguage Proficiency Test. San Antonio, TX: Author.
Hedges, L. V., & Nowell, A. (1995). Sex differences in mentaltest scores, variability, and numbers of high-scoring individu-als. Science, 269, 41-45.
Hoffman, H. V. (1983). Regression analysis of test bias in theRaven’s Progressive Matrices for Whites and Mexican-Americans (Doctoral dissertation, The University of Arizona,1983). Dissertation Abstracts International, 44, 3509.
Keith, T. Z. (1999). Effects of general and specific abilities onstudent achievement: Similarities and differences across eth-nic groups. School Psychology Quarterly, 14, 239-262.
Lewis, J. D. (2001). Language isn’t needed: Nonverbal assess-ments and gifted learners. Proceedings of the GrowingPartnership for Rural Special Education Conference. SanDiego, CA. (ERIC Document Reproduction Service No. ED453026)
Lohman, D. F. (1994). Spatially gifted, verbally, inconvenienced. InN. Colangelo, S. G. Assouline, & D. L. Ambroson (Eds.), Talentdevelopment: Vol. 2. Proceedings from the 1993 Henry B. andJocelyn Wallace National Research Symposium on TalentDevelopment (pp. 251-264). Dayton: Ohio Psychology Press.
Lohman, D. F. (2005a). Review of Naglieri and Ford (2003):Does the Naglieri Nonverbal Ability Test identify equal pro-portions of high-scoring White, Black, and Hispanic students?Gifted Child Quarterly, 49, 19-28.
Lohman, D. F. (2005b). The role of nonverbal ability tests inidentifying academically gifted students: An aptitude perspec-tive. Gifted Child Quarterly, 49, 111-138.
Lohman, D. F. (2006). Identifying academically gifted children ina linguistically and culturally diverse society. Invited presen-tation at the Eighth Biennial Henry B. & Jocelyn WallaceNational Research Symposium on Talent Development,University of Iowa, Iowa City. Retrieved August 28, 2007,from The University of Iowa Web site: http://faculty.educa-tion.uiowa.edu/dlohman/
294 Gifted Child Quarterly, Vol. 52, No. 4
at The University of Iowa Libraries on October 7, 2008 http://gcq.sagepub.comDownloaded from
Lohman, D. F., & Hagen, E. P. (2001). Cognitive Abilities Test(Form 6). Itasca, IL: Riverside.
Lohman, D. F., & Hagen, E. P. (2002). Cognitive Abilities Test(Form 6): Research handbook. Itasca, IL: Riverside.
Lohman, D. F., & Korb, K. A. (2006). Gifted today but not tomor-row? Longitudinal changes in ITBS and CogAT scores duringelementary school. Journal for the Education of the Gifted,29, 451-484.
Lohman, D. F., & Lakin, J. (2007). Nonverbal test scores as onecomponent of an identification system: Integrating ability,achievement, and teacher ratings. In J. VanTassel-Baska (Ed.),Alternative assessments for identifying gifted and talentedstudents (pp. 41-66). Austin, TX: Prufrock Press.
Lohman, D. F., & Renzulli, J. (2007). A simple procedure forcombining ability test scores, achievement test scores, andteacher ratings to identify academically talented children.Unpublished manuscript, The University of Iowa. RetrievedAugust 28, 2007, from The University of Iowa Web site:http://faculty.education.uiowa.edu/dlohman/
Lorge, I., Thorndike, R. L., & Hagen, E. (1964). The Lorge-Thorndike Intelligence Tests. Boston, MA: Houghton Mifflin.
Lubinski, D. (2000). Scientific and social significance of assess-ing individual differences: “Sinking shafts at a few criticalpoints.” Annual Review of Psychology, 51, 405-444.
Lutkus, A. D., & Mazzeo, J. (2003). Including special-needsstudents in the NAEP 1998 Reading Assessment: Part I.Comparison of overall results with and without accommoda-tions (Report NCES 2003-467). Washington, DC: U.S.Department of Education, Institute of Education Sciences,National Center for Education Statistics. Retrieved September4, 2007, from http://www.nces.ed.gov/pubsearch/pubsinfo.asp?pubid=2003467
McCallum, R. S., Bracken, B. A., & Wasserman, J. D. (2001).Essentials of nonverbal assessment. Hoboken, NJ: Wiley.
Mills, C. J., & Tissot, S. L. (1995). Identifying academic poten-tial in students from under-represented populations: Is usingthe Raven Progressive Matrices a good idea? Gifted ChildQuarterly, 39, 209-217.
Naglieri, J. A. (1996). Naglieri Nonverbal Ability Test. SanAntonio, TX: Harcourt Brace Educational Measurement.
Naglieri, J. A. (1997). Naglieri Nonverbal Ability Test: Multileveltechnical manual. San Antonio, TX: Harcourt BraceEducational Measurement.
Naglieri, J. A. (2007). Traditional IQ: 100 years of misconceptionand its relationship to minority representation in gifted pro-grams. In J. VanTassel-Baska (Ed.), Alternative assessmentsfor identifying gifted and talented students (pp. 67-88). Waco,TX: Prufrock Press.
Naglieri, J. A., Booth, A. L., & Winsler, A. (2004). Comparisonof Hispanic children with and without limited English profi-ciency on the Naglieri Nonverbal Ability Test. PsychologicalAssessment, 16, 81-84.
Naglieri, J. A., & Ford, D. Y. (2003). Addressing underrepresen-tation of gifted minority children using the Naglieri NonverbalAbility Test (NNAT). Gifted Child Quarterly, 47, 155-160.
Naglieri, J. A., & Ronning, M. E. (2000a). Comparison of White,African American, Hispanic, and Asian children on theNaglieri Nonverbal Ability Test. Psychological Assessment,12, 328-334.
Naglieri, J. A., & Ronning, M. E. (2000b). The relationshipbetween general ability using the Naglieri Nonverbal Ability
Test (NNAT) and the Stanford Achievement Test (SAT) read-ing achievement. Journal of Psychoeducational Assessment,18, 230-239.
Powers, S., Barkan, J. H., & Jones, P. B. (1986). Reliability of theStandard Progressive Matrices Test for Hispanic and White-American children. Perceptual and Motor Skills, 62, 348-350.
Raven, J. (1989). The Raven Progressive Matrices: A review ofnational norming studies and ethnic and socioeconomic vari-ation within the United States. Journal of EducationalMeasurement, 26, 1-16.
Raven, J. (2000). The Raven’s Progressive Matrices: Change andstability over culture and time. Cognitive Psychology, 41, 1-48.
Raven, J., Raven, J. C., & Court, J. H. (1998). Manual for Raven’sProgressive Matrices and Vocabulary Scales: Section 1. Generaloverview. Oxford, UK: Oxford Psychologists Press.
Raven, J. C. (1941). Standardisation of Progressive Matrices,1938. British Journal of Medical Psychology, 19, 137-150.
Raven, J. C. (1990). Manual for Raven’s Progressive Matricesand Vocabulary Scales: Research supplement No. 3 (2nd ed.).Oxford, UK: Oxford Psychologists Press.
Raven, J. C., Court, J. H., & Raven, J. (1996). Manual forRaven’s Progressive Matrices and Vocabulary Scales: Section3. Standard Progressive Matrices. Oxford, UK: OxfordPsychologists Press.
Renzulli, J. S. (2005). Equity, excellence, and economy in a sys-tem for identifying students in gifted education: A guidebook(RM05208). Storrs, CT: The National Research Center on theGifted and Talented.
Rojahn, J., & Naglieri, J. A. (2006). Developmental gender dif-ferences on the Naglieri Nonverbal Ability Test in a nationalnormed sample of 5-17 year olds. Intelligence, 34, 253-260.
Saccuzzo, D. P., & Johnson, N. E. (1995). Traditional psychometrictests and proportionate representation: An intervention and pro-gram evaluation study. Psychological Assessment, 7, 183-194.
Scarr, S. (1994). Culture-fair and culture-free tests. In R. J. Sternberg(Ed.), Encyclopedia of human intelligence (pp. 322-328). NewYork: Macmillan.
Shaunessy, E., Karnes, F. A., & Cobb, Y. (2004). Assessing poten-tially gifted students from lower socioeconomic status withnonverbal measures of intelligence. Perceptual and MotorSkills, 98, 1129-1138.
Shea, D. L., Lubinski, D., & Benbow, C. P. (2001). Importance ofassessing spatial ability in intellectually talented young ado-lescents: A 20-Year longitudinal study. Journal of EducationalPsychology, 93, 604-614.
Smith, I. M. (1964). Spatial ability: Its educational and socialsignificance. San Diego, CA: Robert R. Knapp.
SPSS, Inc. (2005). SPSS 14.0 for Windows [Computer software].Chicago: Author.
Stanford Achievement Test (9th ed.). (1995). San Antonio, TX:The Psychological Corporation.
Stephens, K., Kiger, L., Karnes, F. A., & Whorton, J. E. (1999).Use of nonverbal measures of intelligence in identification ofculturally diverse gifted students in rural areas. Perceptualand Motor Skills, 88, 793-796.
Terman, L. M. (1930). Autobiography of Lewis M. Terman. In C.Murchison (Ed.), History of psychology in autobiography(Vol. 2, pp. 297-331). Worcester, MA: Clark University Press.
Thorndike, E. L. (1917). Reading as reasoning: A study of mis-takes in paragraph reading. Journal of EducationalPsychology, 8, 323-332.
Lohman et al. / Nonverbal Tests in Identifying Gifted Students 295
at The University of Iowa Libraries on October 7, 2008 http://gcq.sagepub.comDownloaded from
Thorndike, R. L., & Hagen, E. (1995). Cognitive Abilities Test(Form 5) research handbook. Chicago: Riverside.
Webb, R. M., Lubinski, D., & Benbow, C. P. (2007). Spatial abil-ity: A neglected dimension in talent searches for intellectuallyprecocious youth. Journal of Educational Psychology, 99,397-420.
Wechsler, D. (1949). Wechsler Intelligence Scale for Children.New York: The Psychological Corporation.
David F. Lohman is Professor of Educational Psychology at theUniversity of Iowa. He currently directs the Institute for Researchand Policy on Acceleration at the Belin-Blank International Centerfor Gifted Education and Talent Development. His research inter-ests include the effectiveness of different curricular adaptations
for academically talented students, conceptualization andmeasurement of reasoning abilities, and general issues in the iden-tification and development of talent. Since 1998, he has workedwith Elizabeth Hagen on the Cognitive Abilities Test.
Katrina A. Korb is a lecturer in Educational Psychology at theUniversity of Jos in Jos, Nigeria. Her primary research interest isin the development of symbolic numerical thinking.
Joni M. Lakin is a doctoral student in Educational Psychology atthe University of Iowa. Her research interests include cognitiveand noncognitive predictors of academic achievement and the useof assessments to identify gifted students, especially giftedstudents who are English-language learners.
296 Gifted Child Quarterly, Vol. 52, No. 4
at The University of Iowa Libraries on October 7, 2008 http://gcq.sagepub.comDownloaded from