![Cancer Metabolism - MDPI · 2019. 2. 13. · Cancer Metabolism Charlotte Domblides 1,2, ... lipids, proteins and nucleic acids [5]. 2. Metabolism of Tumor Cells Tumor cells modify](https://static.fdocuments.in/doc/165x107/60fa278848cf54668f113ed7/cancer-metabolism-mdpi-2019-2-13-cancer-metabolism-charlotte-domblides-12.jpg)
Identification of Tumor -Associated Proteins in Oral...
25
This is a pre-published version This is a pre-published version 1 Identification of Tumor-Associated Proteins in Oral Tongue Squamous Cell Carcinoma by Proteomics Qing-Yu He 1,2 , Jia Chen 3 , Hsiang-Fu Kung 3 , Anthony Po-Wing Yuen 4 and Jen-Fu Chiu 2,3 1 Department of Chemistry, 2 Open Laboratory of Chemical Biology of the Institute of Molecular Technology for Drug Discovery and Synthesis, 3 Institute of Molecular Biology, 4 Department of Surgery, University of Hong Kong, Hong Kong, China Running title: Proteomics of Tongue Squamous Cell Carcinoma Correspondence to: Dr. Qing-Yu He, Department of Chemistry, University of Hong Kong, Pokfulam, Hong Kong, China. Tel: (852)2299-0787, Fax: (852)2817-1006, E-mail: [email protected] List of Abbreviations: UADTSCC, upper aerodigestive tract squamous cell carcinoma; MS, mass spectrometry; MALDI-TOF, matrix-assistant laser desorption/ionization – time of flight; IEF, isoelectric focusing; IPG, immobilized pH gradient; TC, tumor center; SM, surrounding histologically normal mucosa; MHC & MLC, myosin heavy and light chain; HSP, heat shock protein. Keywords: 2D-PAGE, tongue cancer, protein profile, MS fingerprinting
Transcript of Identification of Tumor -Associated Proteins in Oral...

This is a pre-published versionThis is a pre-published version1
Identification of Tumor-Associated Proteins in Oral Tongue Squamous Cell Carcinoma by Proteomics
Qing-Yu He1,2 , Jia Chen3, Hsiang-Fu Kung3, Anthony Po-Wing Yuen4
and Jen-Fu Chiu2,3
1Department of Chemistry, 2Open Laboratory of Chemical Biology of the Institute of
Molecular Technology for Drug Discovery and Synthesis, 3Institute of Molecular Biology,
4Department of Surgery, University of Hong Kong, Hong Kong, China
Running title: Proteomics of Tongue Squamous Cell Carcinoma
Correspondence to: Dr. Qing-Yu He, Department of Chemistry, University of Hong Kong,
Pokfulam, Hong Kong, China. Tel: (852)2299-0787, Fax: (852)2817-1006, E-mail:
List of Abbreviations:
UADTSCC, upper aerodigestive tract squamous cell carcinoma; MS, mass spectrometry;
MALDI-TOF, matrix-assistant laser desorption/ionization – time of flight; IEF, isoelectric
focusing; IPG, immobilized pH gradient; TC, tumor center; SM, surrounding histologically
normal mucosa; MHC & MLC, myosin heavy and light chain; HSP, heat shock protein.
Keywords: 2D-PAGE, tongue cancer, protein profile, MS fingerprinting

2
Summary
Oral tongue carcinoma is common, particularly in chronic smokers, drinkers and betal squid
chewers. This is an aggressive tumor in which patients often present in late stage and have
high recurrence rate after treatment. In this article, we report the first proteomic analysis of
oral tongue carcinoma to globally search for the tumor-related proteins. Apart from helping
us to understand the molecular pathogenesis of the tumor, these proteins may also have
potential clinical applications as biomarkers in the surveillance of early cancers of high-risk
persons, the treatment response prediction and the detection of residual or recurrent
carcinoma after treatment. The protein expression profiles of ten oral tongue squamous cell
carcinomas and their matched normal mucosal resection margins were examined by 2D gel
electrophoresis and MALDI-TOF mass spectroscopy. A number of tumor-associated proteins
including HSP60, HSP27, α B-crystalline, ATP synthase β, calgranulin B, myosin,
tropomyosin and galectin 1 have been found consistently and significantly altered in their
expression levels in tongue carcinoma tissues, compared with their paired normal mucosae.
The expression profile portrays a global protein alteration that appears specific to the oral
tongue cancer. The potential of utilizing these tumor-related proteins for screening cancer and
monitoring recurrence warrants further investigation.

3
1 Introduction
Upper aerodigestive tract carcinoma (UADTSCC) is a major public health problem
worldwide. Oral tongue carcinoma is one of the common UADTSCC. The genetic
pathogenesis is still largely unclear. The clinical diagnostic methods mainly rely on
symptoms presentation, physical signs and X-ray examination. Unfortunately, the majority of
patients were in the advanced stage at the time of first symptomatic presentation and clinical
diagnosis [1-6]. The recurrence rate after treatment increases with stage. For those patients
with recurrent carcinoma, further salvage treatment is successful only when the tumors are
detected in the early stage. All patients who were not feasible for surgical salvage died of
recurrence despite of giving chemotherapy and/or radiotherapy [7, 8]. With the present
clinical assessment method, half of the patients are not salvageable at the time of diagnosis of
recurrence and another quarter of patients fail to respond to the salvage treatment because of
the advanced stage of recurrence. Obviously, a better method for screening UADTSCC and
an early detection of residual or recurrent tumor after treatment are necessary to improve the
curative rate.
Proteomics is a powerful analytic technology newly developed to enhance our study
on the diagnosis, treatment and prevention of human diseases [9-11]. Two-dimensional (2D)
gel electrophoresis has been the principal tool in proteomics, which is able to resolve
thousands of proteins in one experiment, providing the highest resolution in protein
separation. By comprehensively examining the expression profiles of proteins between
normal and diseased samples via 2D electrophoresis, proteomics can produce information on
new biomarkers, disease-associated targets and the process of pathogenesis. This technique
has been extensively employed to investigate various diseases [12-15] but there is currently
no report concerning the proteomic study on UADTSCC. In this study, we used 2D
electrophoresis to analyze protein samples extracted from oral tongue tumor tissue and
4
matched surrounding histologically normal mucosa from surgical specimens. By carefully
selecting carcinoma confining to one subsite of the upper aerodigestive tract and patients
without any prior radiotherapy and chemotherapy treatment to the tissue, we hope to reduce
the tissue variability, avoid treatment-induced effect on protein expression and yield more
consistent results. By comparing the protein profiles between tumor and normal samples, we
report herein the identification of proteins that were differentially expressed in tumor. Further
global characterization of these proteins provides information for better understanding the
pathogenesis of tongue cancer and thus help developing new diagnostic and therapeutic
strategies.

5
2 Materials and methods
2.1 Tissue and sample preparation
Ten pairs of surgical specimens of primary oral tongue sqaumous cell carcinoma and their
matched adjacent normal mucosae were collected from Queen Mary Hospital, the University
of Hong Kong, and were stored in deep freezer (–80oC) until use. The study has been
approved by ethnic committee. All patients have sent a consent form to donate tissue and
blood for research purpose. There were 5 male and 5 female patients ranging from 29 to 81
year old. The AJCC pathologic stages were 1 T1N0 M0, 7 T2(6N0, 1N2)M0, 2 T3(1N0,
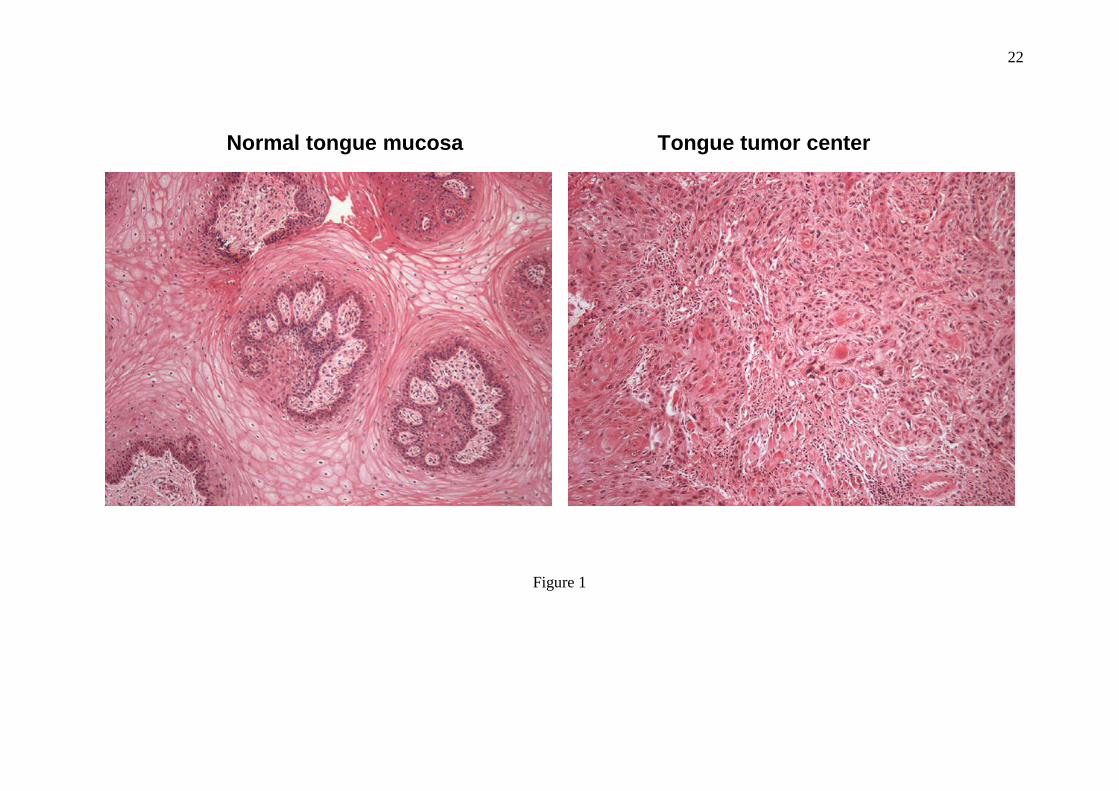
1N2)M0. Table 1 lists detailed histological data for the tissue samples used and Figure 1 is a
representative histological picture showing a pair of matched tissue samples side by side.
Overall, the tumor specimens contain 64 ± 22 % tumor cells.
Tissues (~200 mg) were cut into about 2 mm3 in size and were then homogenized
with 0.5 ml Lysis Buffer (Reagent 3, Bio-Rad, containing protease inhibitor cocktail, Sigma
8340, DNase I 1 Uunit/ml) for 5 min on ice using a mini-homogenizer. The lysate was spun
down at 14,000 rpm for 10 minutes at 4oC, the supernatant was transferred into another tube,
and then ultra-centrifuged at 100,000 g for 1 hour at 4oC. The protein concentration of the
resulting supernatants was determined by the method of Bradford and the protein samples
were stored at –80oC in aliquot.
2.2 2D-gel electrophoresis
The 2D-gel electrophoresis was carried out with Amersham Biosystems IPGphor IEF and
Ettan Dalt six electrophoresis units by following the protocol described previously [16].
Protein samples (150 ~ 200 µg) extracted from tumor center (TC) and surrounding
histologically normal mucosa (SM) were applied to the 2D gel electrophoresis and run in pair

6
side by side. Triplicate electrophoresis was performed for each pair sample to ensure the
reproducibility. All gels were visualized by silver staining [16].
2.3 Image analysis and MS peptide sequencing
Image acquisition and analysis were performed by using an ImageScanner (Amersham) and
the ImageMaster 2D Elite software (Amersham) [16]. Comparison was made between gel
images of TC and SM samples pair by pair. Normalized volume differences were statistically
calculated for all the ten cases. Those consistently and significantly different spots were
selected for analysis with MALDI-TOF mass spectrometry. Protein spots were cut out in
small pieces and subjected to in-gel tryptic digestion overnight [16]. Peptide mass spectra
were recorded and parameters for spectra acquisition were used as stated previously [16]. In
database protein matching using MS-Fit (http://prospector.ucsf.edu/), 20 ppm or better mass
accuracy and MOWSE scores over 200 were obtained in most of analysis. For those lower
mass accuracy and score matching, duplicate or triplicate run and analysis were carried out to
ensure the accuracy.

7
3 Results
3.1 Sample preparation and protein separation.
Before applied to 2D-gel separation, proteins were extracted from tissue samples and
subjected to concentration determination. Total protein extraction rates have no significant
difference between tumor and matched surrounding tissues, with 31.7 ± 8.5 and 30.3 ± 7.5
µg/mg respectively for TC and SM samples. Usually 200 µg of proteins each sample were
used for 2D-gel separation and the proteins were quite evenly distributed in the 18 cm gel
with ranges of pI 4-10 and MW 6-200kDa. Figure 2 is the typical master gel image for both
TC and SM samples side by side. Around 600 protein spots in each gel were detected through
ImageMaster software. Some proteins present in train spots, indicating that modified proteins
or isoforms were fairly separated by the 2D-gel electrophoresis. Highlighted in squares are
the eight areas showing consistent and significant differences at least in nine of the ten cases.
Statistic data for these proteins (or the sum of isoforms) were summarized in Table 2 with
total normalized volumes (% Vol) and fold differences between TC and SM samples (for
total ten pairs). Roughly, nine proteins (or isoforms) are up-regulated and six proteins
(isoforms) are suppressed significantly in tumor tissues.
3.2 Protein identification.
Each different protein spot was excised and subjected to in-gel tryptic digestion, MALDI-
TOF mass measurement and database matching. Isoforms that gave an identical primary
structure in the protein matching are classified into one protein. Table 3 is the summary for
the protein identification, most of the protein matching have high sequence coverage, mass
accuracy and MOWSE score.
Figure 3 & 4 show the alterations of expression levels for each identified protein
between tumor and normal mucosae. Myosin heavy chain 1 (MHC1) and galectin 1 are
8
evidently increased (+5, and +1.5 folds, respectively) in tumor tissue, whereas myosin light
chains (MLC) are dramatically down-regulated (−5.7 to –11 folds) (Fig. 3 I & V). MLC has
three groups respectively belong to light chain 1, alkali light chain and regulatory light chain
from high to lower MW in the gel. In some cases, all the three MLC groups were suppressed
to an undetectable level in tumor center tissues. Interestingly, tropomyosin has alterations
similar to myosin in expression level. Tropomyosin β chain was significantly decreased (−4.5
folds) and its lower MW isoform was remarkably increased (+6.1 folds) in tumor (Fig. 3 III).
Compared to those in normal mucosa, other proteins consistently showing apparent
increase in expression level in tumor samples include heat shock 60k protein (HSP60) (+2
folds), heat shock 27k protein (HSP27) (+1.5 folds), nuclear FMRP interacting protein 1
(+1.7 folds), calgranulin B (+1.5 folds) and hemoglobin (+2.1 folds), while proteins
considerably suppressed in tumor are ATP synthase β chain (−2.3 folds) and crystalline αB
(−2.9 folds) (Fig. 4). It should be pointed out that almost all these proteins and isoforms have
molecular weights matching to their experimental values in gels. The only exception is
nuclear FMRP interacting protein 1; it has 31.3 kDa in size, the spot that appeared in 15 kDa
region obviously is a fragment of the protein. The matched peptides (all in the beginning part
of the protein sequence) and sequence coverage in the protein matching justify the
assignment.

9
4 Discussion
Oral tongue squamous cell carcinoma originates from the mucosa layer. Tongue consists
largely of skeletal muscle covered by a thin layer of mucosa and submucosa. Pathologic
feature of muscular invasion is therefore present in most tongue cancer starting from early
stage. Muscular invasion was observed in all tumor specimens in this study. Myosin is the
structural component of the muscle cytoskeleton. Myosin modulation participates in the
process of epithelial cancer progression [17, 18]. In ras transformed fibroblast cells [19] and
muscle cells treated with tumor necrosis factor-α [20] and cancer cachexia [21], both MHC
and MLC were significantly suppressed. Our finding of the dramatic decline in MLC
expression level in tongue tumor tissue reflects the muscle destruction during cancer invasion
and migration process. What surprised us is the fact that, despite of the reduction of MLC,
there was substantially increased level of MHC (isoform 1) consistently found in tumor
tissue. This unexpected finding has not been previously reported in other cancers, and thus
may suggest a pathologic phenomenon specific to oral tongue cancer muscular invasion
process. Further study is necessary to elucidate the underlying molecular pathogenesis.
Tropomyosin is a cytoskeletal microfilament binding protein expressed in muscle and
non-muscle cells. There are several tropomyosin isoforms, and their expression is known to
be associated with cell transformation events. Suppression of high MW isoforms of muscle
tropomyosin was commonly observed in malignant tumors such as breast, ovarian and
prostate cancer [22]. Interestingly, we found in this study that, accompanying with a
substantial suppression of the higher MW tropomyosin β, a low MW tropomyosin isoform
was siginificantly over-expressed in tongue tumor tissue (Table 2). This may indicate that
different tropomyosin isoforms perform distinct physiological functions in tissue, resulting in
diverse regulation in malignant cells [23-26]. In addition, earlier studies revealed that
increased expression of a low MW tropomyosin isoform was correlated to the metastatic
10
potential of other tumors such as primary breast carcinoma [27], melanoma [28] and Lewis
lung carcinoma [29], a similar finding in this study suggests that the correlation between
tropomyosin and metastasis may also play a role in oral tongue cancer.
Another muscle-related protein with altered expression level in tongue tumor is
galectin 1. Galectin 1, together with galectin 3, belongs to a family of β-galactoside-binding
animal lectins, which are involved in cell differentiation, morphogenesis, tumor progression
and metastasis. Extensive investigation has shown that up-regulation of galectin 1 & 3 were
found in various carcinomas including colon cancer [30], prostate cancer [31], intrahepatic
cholangiocarcinoma [32], bladder transitional-cell carcinoma [33], and head and neck tumors
[34-36]. The observed elevated expression of galectin 1 in this report implicates that tongue
SCC tumor may share the similar mechanism of malignant progression mediated by galectin
in promoting cancer cell invasion and migration. It has been suggested that galectin
modulates cell adhesion, regulates cell growth, inhibits apoptosis, and therefore enhances the
migratory capabilities of tumor astrocytes and their biological aggressiveness [37-39].
HSP60, HSP27 and alpha B-crystallin are a group of stress-related proteins which
expression was considerably altered in tumor tissues. Heat-shock proteins are synthesized by
cells in response to heat and other environmental stress. Their expression in cells may have
important physiological and pathological implications such as protection, cell proliferation,
migration and differentiation and disease prognosis. However, numerous research data from
different laboratories indicated that these three HSP proteins were modulated independently
in response to stress [22, 40-43]. While the expression of HSP60 and HSP27 was stimulated
[22, 44-46], alpha B-crystallin was suppressed [40-43, 47] in various tumors. The current
observations on the expression of this group of HSP proteins in tongue tumor (Table 2) are
exactly consistent with the published results from studies on other cancers. This confirms that

11
the small heat shock protein, alpha B-crystallin, may play a distinctive role in the process of
carcinogenesis although it shares structural and functional properties with HSP27.
Calgranulin B, also called S100A9 and MRP14, is a member of S100 calcium-binding
protein family predominantly expressed in granulocytes. Its biological functions include the
intracellular inhibition of casein kinase II which results in the regulation of cellular
transcription and translation and the extracellular chemotactic and cytotoxic activity against
bacteria, fungi and tumor cells [48]. Calgranulin B over-expression has been found in colon
and colorectal cancers [49-51] and this protein has been identified to be tumor-associated
protein [52-54]. The higher expression of calgranulin B in TC samples in this study confirms
that this tumor marker is also positively up-regulated in oral tongue cancer. However,
previous study using a cDNA array hybridization method revealed that the cDNA level of
calgranulin B was much higher in non-malignant cells than that in tumor cells of
nasopharyngeal carcinoma [55]. The reasonable explanation would be that cDNA level may
not necessarily reflect protein expression level and the protein expression differs in different
tissue types.
ATP synthase β chain, the catalytic subunit in the ATP synthase complex, was found
being markedly down-regulated in tumor tissue (Table 2). This seems contradictory to the
fact that tumor cell growth needs a lot of energy from ATP synthesized by ATP synthase.
However, recent studies showed that, while ATP synthase D and E chains increased their
expression in lung, liver and thyroid tumors [56-59], ATP synthase β in fact decreased its
content in hepatocellular carcinoma [60, 61]. The reduction of ATP synthase β was
subsequently found to be related to the over-expression of an ATPase inhibitor protein in
tumor, which prevents hydrolysis of glycolytic ATP, declines the activity of the ATP
synthase and therefore modulates the expression of ATP synthase β [60]. The process of oral
tongue SCC may share the similar mechanism in this respect.

12
The last two proteins that had higher expression levels in tumor samples are nuclear
FMRP interacting protein and hemoglobin. The nuclear FMRP interacting protein is a newly
discovered RNA-binding protein that interacts with the fragile X mental retardation protein
(FMRP) responsible for the fragile X syndrome through its silenced expression [62, 63].
There is currently no report concerning the expression of the FMRP interacting protein in
tumors. The reason for the up-regulation of this protein in tongue cancer is unclear. On the
other hand, the relationship between tissue hemoglobin level and tongue SCC tumor appears
indirect. Angiogenesis is one of the important factor to promote tumor growth. Angiogenesis
in oral tongue carcinoma is an unfavorable prognostic factor [64-66]. The higher hemoglobin
level in tumor tissues compared with normal mucosa is consistent with the higher vascular
density of growing tumor in normal tissues.
In summary, we have used proteomic technology to globally analyze tongue SCC
cancer for the first time. The elicited identification of tumor-associated proteins, including
myosin, tropomyosin, galectin 1, HSP60, HSP27, α B-crystalline, ATP synthase β and
calgranulin B, and the alterations of these proteins in expression level help us better
understand the carcinogenesis of oral tongue cancer. These proteins individually may not be
specific to tongue SCC cancer, however, a combinational evaluation integrated with the
functions and quantitative changes of these proteins holds a potential to be a unique index for
assessing the disease. It is therefore worthwhile to further study the plasma levels of these
protein biomarkers for their clinical application in screening cancer and monitoring
recurrence after treatment. This possibility is under investigation.

13
Acknowledgements
This work was supported by Hong Kong Research Grants Council Grants HKU 7227/02M
(to Q.Y.H.) and HKU 7218/02M (to J.F.C.), the Department of Chemistry, and the Areas of
Excellence scheme of Hong Kong University Grants Committee. We thank Ms. Yuan Zhou
for technical assistance.

14
5 References
[1] Yuen, P. W., Lam, K. Y., Chan, A. C., Wei, W. I., Lam, L. K., Am. J Surg. 1998, 175, 242-244.
[2] Yuen, A. P. W., Wei, W. I., Wong, Y. M., Tang, K. C., Chinese Med. J. 1997, 110, 859-864.
[3] Yuen, A. P. W., Wei, W. I., Wong, Y. M., Tang, K. C., Head Neck 1997, 19, 583-588.
[4] Yuen, A. P. W., Lam, K. Y., Chan, C. L. A., Wei, W. I. et al., Am. J. Surg. 1999, 177, 90-92.
[5] Yuen, A. P. W., Lam, K. Y., Wei, W. I., Ho, W. K., Am. J Surg. 2000, 180, 139-143.
[6] Yuen, A. P. W., Lam, K. Y., Lam, L. K., Ho, C. M. et al., Head Neck 2002, 24, 513-520.
[7] Yuen, A. P. W., Wei, W. I., Lam, L. K., Ho, W. K., Kwong, D., Ann. Otol. Rhino. Laryngol. 1997, 106, 779-782.
[8] Yuen, A. P. W., Wei, W. I., Wong, S. H. W., Ng, R. W. M., Ear Nose Throat J. 1998, 77, 181-184.
[9] Borman, S., Chem. Engineering News 2000, 78, 31-37.
[10] Hunt, D. F., J. Proteome Res. 2002, 1, 15-19.
[11] He, Q. Y., Chiu, J. F., J. Cell. Biochem. 2003, in press.
[12] Jungblut, P. R., Zimny-Arndt, U., Stulik, J., Koupilova, K. et al., Electrophoresis 1999, 20, 2100-2110.
[13] Poon, T. C. W., Chan, A. T. C., Zee, B., Ho, S. K. W. et al., Oncology 2001, 61, 275-283.
[14] Hanash, S. M., Madoz-Gurpide, J., Misek, D. E., Leukemia 2002, 16, 478-485.
[15] Srinivas, P. R., Srivastava, S., Hanash, S., Wright, G. L., Jr., Clin Chem 2001, 47, 1901-1911.
[16] He, Q. Y., Lau, G. K. K., Zhou, Y., Yuen, S.-T. et al., Proteomics 2003, 3, 666-674.
[17] Zhu, Y., Lin, H., Wang, M., Li, Z. et al., Int. J Oncol 2001, 18, 1299-1305.
[18] Chiavegato, A., Bochaton-Piallat, M. L., D'Amore, E., Sartore, S., Gabbiani, G., Virchows Arch. 1995, 426, 77-86.
[19] Kumar, C. C., Chang, C., Cell Growth Differ. 1992, 3, 1-10.
[20] Cheema, I. R., Hermann, C., Postell, S., Barnes, P., Cytobios 2000, 103, 169-176.

15
[21] Diffee, G. M., Kalfas, K., Al Majid, S., McCarthy, D. O., Am. J Physiol Cell Physiol2002, 283, C1376-C1382.
[22] Alaiya, A. A., Franzen, B., Auer, G., Linder, S., Electrophoresis 2000, 21, 1210-1217.
[23] Braverman, R. H., Cooper, H. L., Lee, H. S., Prasad, G. L., Oncogene 1996, 13, 537-545.
[24] Novy, R. E., Lin, J. L., Lin, C. S., Lin, J. J., Cell Motil. Cytoskeleton 1993, 25, 267-281.
[25] Prasad, G. L., Masuelli, L., Raj, M. H., Harindranath, N., Oncogene 1999, 18, 2027-2031.
[26] Shah, V., Braverman, R., Prasad, G. L., Somat. Cell Mol Genet. 1998, 24, 273-280.
[27] Franzen, B., Linder, S., Uryu, K., Alaiya, A. A. et al., Br. J Cancer 1996, 73, 909-913.
[28] Miyado, K., Kimura, M., Taniguchi, S., Biochem Biophys Res Commun 1996, 225, 427-435.
[29] Takenaga, K., Nakamura, Y., Sakiyama, S., Mol Cell Biol 1988, 8, 3934-3937.
[30] Hittelet, A., Legendre, H., Nagy, N., Bronckart, Y. et al., Int. J Cancer 2003, 103, 370-379.
[31] van den Brule, F. A., Waltregny, D., Castronovo, V., J Pathol. 2001, 193, 80-87.
[32] Shimonishi, T., Miyazaki, K., Kono, N., Sabit, H. et al., Hum. Pathol. 2001, 32, 302-310.
[33] Cindolo, L., Benvenuto, G., Salvatore, P., Pero, R. et al., Int. J Cancer 1999, 84, 39-43.
[34] Delbrouck, C., Doyen, I., Belot, N., Decaestecker, C. et al., Lab Invest 2002, 82, 147-158.
[35] Chiariotti, L., Berlingieri, M. T., Battaglia, C., Benvenuto, G. et al., Int. J Cancer 1995, 64, 171-175.
[36] Gillenwater, A., Xu, X. C., Estrov, Y., Sacks, P. G. et al., Int. J Cancer 1998, 75, 217-224.
[37] Rabinovich, G. A., Baum, L. G., Tinari, N., Paganelli, R. et al., Trends Immunol. 2002, 23, 313-320.
[38] Camby, I., Belot, N., Lefranc, F., Sadeghi, N. et al., J Neuropathol. Exp Neurol. 2002, 61, 585-596.
[39] Perillo, N. L., Marcus, M. E., Baum, L. G., J Mol Med 1998, 76, 402-412.
[40] Kato, K., Ito, H., Hasegawa, K., Inaguma, Y. et al., J Neurochem 1996, 66, 946-950.
[41] Kato, M., Herz, F., Brijlall, D., Kato, S., Experientia 1994, 50, 479-482.

16
[42] Klemenz, R., Scheier, B., Muller, A., Steiger, R., Aoyama, A., Verh. Dtsch. Ges. Pathol. 1994, 78, 34-35.
[43] Hitotsumatsu, T., Iwaki, T., Fukui, M., Tateishi, J., Cancer 1996, 77, 352-361.
[44] Malusecka, E., Zborek, A., Krzyzowska-Gruca, S., Krawczyk, Z., Anticancer Res 2001, 21, 1015-1021.
[45] Trieb, K., Gerth, R., Windhager, R., Grohs, J. G. et al., Immunobiology 2000, 201, 368-376.
[46] Michils, A., Redivo, M., Zegers, d. B., V, de, M., V et al., Lung Cancer 2001, 33, 59-67.
[47] Takashi, M., Sakata, T., Ohmura, M., Kato, K., Urol. Res 1997, 25, 173-177.
[48] Hessian, P. A., Edgeworth, J., Hogg, N., J Leukoc. Biol 1993, 53, 197-204.
[49] Jungblut, P. R., Zimny-Arndt, U., Zeindl-Eberhart, E., Stulik, J. et al., Electrophoresis1999, 20, 2100-2110.
[50] Stulik, J., Osterreicher, J., Koupilova, K., Knizek et al., Electrophoresis 1999, 20, 1047-1054.
[51] Stulik, J., Kovarova, H., Macela, A., Bures, J. et al., Clin Chim. Acta 1997, 265, 41-55.
[52] Chaurand, P., DaGue, B. B., Pearsall, R. S., Threadgill, D. W., Caprioli, R. M., Proteomics. 2001, 1, 1320-1326.
[53] Gebhardt, C., Breitenbach, U., Tuckermann, J. P., Dittrich, B. T. et al., Oncogene 2002, 21, 4266-4276.
[54] Arai, K., Teratani, T., Nozawa, R., Yamada, T., Oncol Rep. 2001, 8, 591-596.
[55] Fung, L. F., Lo, A. K., Yuen, P. W., Liu, Y. et al., Life Sci. 2000, 67, 923-936.
[56] Srisomsap, C., Subhasitanont, P., Otto, A., Mueller, E. C. et al., Proteomics. 2002, 2, 706-712.
[57] Ying, H., Yu, Y., Xu, Y., Oncol Res 2000, 12, 485-490.
[58] Chen, J., Gokhale, M., Li, Y., Trush, M. A., Yager, J. D., Carcinogenesis 1998, 19, 2187-2193.
[59] Chen, G., Gharib, T. G., Huang, C. C., Thomas, D. G. et al., Clin Cancer Res 2002, 8, 2298-2305.
[60] Capuano, F., Guerrieri, F., Papa, S., J Bioenerg. Biomembr. 1997, 29, 379-384.
[61] Capuano, F., Varone, D., D'Eri, N., Russo, E. et al., Biochem Mol Biol Int. 1996, 38, 1013-1022.
[62] Bardoni, B., Schenck, A., Mandel, J. L., Hum. Mol Genet. 1999, 8, 2557-2566.

17
[63] Bardoni, B., Mandel, J. L., Curr. Opin. Genet. Dev. 2002, 12, 284-293.
[64] Shpitzer, T., Chaimoff, M., Gal, R., Stern, Y. et al., Arch. Otolaryngol. Head Neck Surg. 1996, 122, 865-868.
[65] Mineta, H., Miura, K., Ogino, T., Takebayashi, S. et al., Anticancer Res. 2002, 22, 1039-1044.
[66] Hogmo, A., Kuylenstierna, R., Lindholm, J., Munck-Wikland, E., J. Clin. Pathol. 1999, 52, 35-40.

18
Table 1. Patients’ information and histological data for the tissue samples used.
PATIENTS SEX/AGE T STAGE SAMPLE PAIRS
TUMORCELLS (%)
NORMALMUCOSALCELLS (%)
MUSCLECELLS (%)
CONNECTIVE TISSUE CELLSLYMPHOCYTES, VESSEL CELLS,
FIBROBLAST (%)1 F/29 T2 Tumor (TC)
Mucosa (SM)650
0100
150
200
2 M/70 T2 Tumor (TC)Mucosa (SM)
600
030
3020
1050
3 F/62 T2 Tumor (TC)Mucosa (SM)
600
020
560
3520
4 M/53 T3 Tumor (TC)Mucosa (SM)
900
025
020
1055
5 M/59 T3 Tumor (TC)Mucosa (SM)
900
040
020
1040
6 M/50 T2 Tumor (TC)Mucosa (SM)
350
030
6060
510
7 F/81 T2 Tumor (TC)Mucosa (SM)
500
020
570
4510
8 M/69 T2 Tumor (TC)Mucosa (SM)
900
095
00
105
9 F/70 T1 Tumor (TC)Mucosa (SM)
250
040
5020
2540
10 F/59 T2 Tumor (TC)Mucosa (SM)
700
040
2020
1040
* Relative percentage (%) of cells was round up to 5%, cells less than 5% were counted as 0 as the number was too small.

19
Table 2: Summary of protein alterations
PROTEIN ID AREA EXPERIMENTALMW/PI
TC (% VOL) SM (% VOL) FOLD DIFFERENCE
Myosin heavy chain SM1 I 200kD/7.5pI 0.997 ± 0.577 0.200 ± 0.104 +5
Heat shock 60kD protein 1 II 65kD/5.2-5.5pI 0.320 ± 0.203 0.162 ± 0.144 +2
ATP synthase β chain II 56kD/5.0-5.4pI 0.372 ± 0.329 0.840 ± 0.563 –2.3
Tropomyosin β chain III 39-43kD/4.9pI 0.601 ± 0.312 2.687 ± 1.088 -4.5
Tropomyosin isoform III 36kD/4.9pI 0.546 ± 0.327 0.090 ± 0.055 +6.1
Heat shock protein 27 IV 30kD/5.8-6.5pI 1.153 ± 0.397 0.790 ± 0.260 +1.5
Myosin light chain 1 V 25kD/4.7-5.1pI 0.604 ± 0.509 3.456 ± 0.862 –5.7
Myosin alkali light chain 1 V 13-14kD/4.6pI 0.238 ± 0.372 1.543 ± 0.617 –6.5
Myosin regulatory light chain 2 V 16-20kD/4.6-5.1pI 0.316 ± 0.242 3.439 ± 1.449 –11
Galectin 1 V 12-13kD/4.9-5.3pI 1.981 ± 0.971 1.308 ± 0.289 +1.5
Crystallin α B (HSP20 like-protein) VI 22-23kD/6.7-7.3pI 0.345 ± 0.362 0.994 ± 0.328 –2.9
Nuclear FMRP interacting protein 1 VII 15kD/6.3pI 1.096 ± 0.366 0.647 ± 0.319 +1.7
Calgranulin B VII 14kD/5.5pI 0.774 ± 0.398 0.546 ± 0.140 +1.5
Hemoglobin VIII 15.9kD/8.2pI 6.336 ± 4.259 3.041 ± 2.068 +2.1
* SM: Surrounding mucosa; TC: Tumor center.

20
Table 3. Results of MALDI-TOF mass spectra and database searching for protein
identification.
PROTEIN ID PEPTIDES MATCHED
SEQUENCE COVERAGE
MASS ACCURACY
MOWSE SCORE
Myosin heavy chain SM1 24 16% 41 ppm 3528
HSP60 (chaperonin) 5 12% 20 ppm 241
ATP synthase β chain 13 31% 6 ppm 20830
Tropomyosin β chain 14 46% 25 ppm 771
Tropomyosin isoform 18 47% 10 ppm 2121
Heat shock protein 27 11 59% 12 ppm 3207
Myosin light chain 1 10 51 % 11 ppm 3527
Myosin alkali light chain 10 45% 13 ppm 3920
Myosin regulatory light chain 2
7 42% 5 ppm 213
Galectin 1 5 41 % 17 ppm 41
Nuclear FMRP interacting protein 1
5 13 % 8 ppm 23
Calgranulin B 11 84% 13 ppm 1122
Crystallin α B (HSP20 like-protein)
13 51% 20 ppm 3770
Hemoglobin β chain 11 77 % 14 ppm 1126
Hemoglobin α chain 6 74 % 10 ppm 4817
* SM: Surrounding mucosa; TC: Tumor center.

21
Figure Legends
Figure 1. Representative histological picture showing a pair of matched tissue specimens
side by side.
Figure 2. Representative master 2D-gel images of tumor center and surrounding mucosa
samples. Highlighted in squares are the eight areas showing significant and consistent
differences in protein expression level.
Figure 3. Patterns of protein alterations in Area I, III and V. MHC & MLC: myosin heavy
and light chains.
Figure 4. Protein alterations in Areas II, IV, VI, VII and VIII.
22
Figure 1
Normal tongue mucosa Tongue tumor center

23
Tumor center (TC) Surrounding mucosa (SM)
I
II
III
V
IV
VI
VII VIII
200K
6K
M.W.
pH 3 pH 10

24
TC SM
I
V
III
MLC
MHC
Galectin 1
Tropomyosin

25
TC SM
II
IV
VI
VII
HSP 60
ATP Synthase
Crystallin ααααB(HSP 20)
FMRP protein
HemoglobinVIII
HSP 27
Calgranulin B

![Interleukin-13 receptor–targeted nanovesicles are a ... · nanovesicle drug delivery system for brain tumor therapy. [Mol Cancer Ther 2006;5(12):3162–9] ... of functional proteins](https://static.fdocuments.in/doc/165x107/605c528dd7458439f66ac842/interleukin-13-receptoratargeted-nanovesicles-are-a-nanovesicle-drug-delivery.jpg)