Identification of transcription factors and response ...
132
Identification of transcription factors and response elements driving expression of Plin5 Master Thesis in nutrition Tone Lise Aarnes Hjørnevik Department of Nutrition Institute of Basic Medical Sciences Faculty of Medicine University of Oslo June 2012
Transcript of Identification of transcription factors and response ...

Identification of transcription factors and response elements driving
expression of Plin5
Master Thesis in nutrition
Tone Lise Aarnes Hjørnevik
Department of Nutrition Institute of Basic Medical Sciences
Faculty of Medicine
University of Oslo
June 2012

II

III

IV
© Tone Lise Aarnes Hjørnevik
2012
Identification of transcription factors and response elements driving expression of Plin5
Tone Lise Aarnes Hjørnevik
http://www.duo.uio.no/
Trykk: CopyCat

Acknowledgements
I
Acknowledgements This work was conducted at Department of Nutrition, Institute of Basic Medical Sciences,
University of Oslo from August 2011 to June 2012 in the laboratory of Professor Hilde I.
Nebb.
I would like to express my gratitude to my supervisor Dr.philos Knut Tomas Dalen for
introducing me to the field of lipid droplets and perilipins, and for patience and support during
this work. Your enthusiasm for research has been an inspiration. A special thanks to Christina
Steppeler, for being my laboratory teacher the first month. You made lab-work look so easy,
and you were a true inspiration. Thank you for taking the time to explain and show me how
things were done when I needed it. I would also like to thank all the other members of the
research group for including me in the group, with a special thanks to Ole Berg and Christian
Bindesbøll for valuable advices and technical support in the laboratory.
I would also like to acknowledge Kathrine Vinknes, who took the time to help with the
statistics, and Kjersti Trangsrud for excellent collaboration during the last years as students.
Finally I want to thank my beloved wife Linda for endless support, encouragment and love;
my family for always believing in me; and my friends outside the world of nutrition for being
who you are. You all make my life complete.
Oslo, june 2012
Tone Lise Aarnes Hjørnevik

Acknowledgements
II

Abstract
III
Abstract Obesity is a major health problem in the world today, as it results in several metabolic
changes leading to elevated risk of various severe conditions such as cancer, diabetes
mellitus, coronary heart disease and stroke. The mechanisms leading to development of
excess body fat is complex, and there are still many unanswered questions regarding the
factors involved.
Lipid droplets (LDs) function as cellular fat stores, and are coated with various proteins such
as members of the Perilipin family. This family consists of five members (perilipin 1-5,
encoded by the genes Plin1-5) that differ in tissue expression, transcriptional regulation,
protein stability and binding affinity to the LDs. The perilipins are thought to have unique
roles in the regulation of fatty acid metabolism in various tissues. Previous studies have
demonstrated that perilipin 1, 2 and 4 is transcriptionally regulated by direct binding of
Peroxisome Proliferator-Activated Receptors (PPARs) to responsive elements in the
promoters.
The focus in this thesis has been the transcriptional regulation of perilipin 5 in cultured mouse
muscle cells. Perilipin 5 is the latest discovered member of the perilipin family. This family
member has been demonstrated by our group and others to be highly expressed in tissues with
active fatty acid oxidation, such as heart, liver, striated muscles and brown adipose tissue, and
to be induced by PPARα. Preliminary studies in our group suggested that activation of
PPARδ stimulate Plin5 expression in muscle. Based on existing literature, we also
hypothesized that the PGC1s and ERRs transcription factors could be important regulators of
Plin5.
The main objective for this thesis was to investigate the role of the transcription factors
PPARs, PGC1s and ERRs for perilipin 5 expression in cultured mouse muscle cells, and to
identify any response elements used by these transcription factors in the Plin5 promoter. Our
results confirmed that activation of PPARα regulates the expression of perilipin 5 in muscle
cells. However, they also demonstrated that PPARδ is an important regulator of Plin5
expression. Furthermore, when PPARα is over expressed or PPARδ is ligand-activated, the
relative level of perilipin 5 increase with time, suggesting the involvement of other factors.
We found that overexpression of either PGC1α or PGC1β enhanced basal expression of

Abstract
IV
perilipin 5 compared to non-transfected cells. Interestingly, cells overexpressing these co-
activators, especially PGC1β, were less responsive to ligand activation of PPARs. This result
suggests that overexpression of these coactivators functions to activate the PPARs similar to
ligand activation. ERRs did not appear to regulate Plin5 expression. We were also able to
confirm a novel functional PPRE in the Plin5 promoter, located downstream of the Plin5
transcriptional start site at position +139 to +151 in intron 1 of the Plin5 gene. This
establishes Plin5 as a novel direct PPAR target gene in mouse muscle cells.

Abbreviations
V
Abbreviations ΔCT Delta CT
AC Adenylyl Cyclase
ADP Adenosine diphosphate
ADRP Adipocyte Differentiation-Related Protein
ATP Adenosine-5’-triphosphate
BAT Brown Adipose Tissue
BRL-49653 Synthetic PPARγ ligand
BSA Bovine Serum Albumin
cDNA complementary DNA
DAG Diacylglycerol
dH2O Distilled water
DMEM Dulbecco’s Modified Eagle’s Medium
DMSO Dimethyl sulfoxide
DNA Deoxyribonucleic Acid
dNTP Deoxyribonucleoside Triphosphate
DR Direct repeat
ER Endoplasmatic Reticulum
ERR Estrogen Related Receptor
FBS Fetal Bovine Serum
gDNA genomic DNA
GW-501516 Synthetic PPARδ ligand
h hours
LBD Ligand Binding Domain
LD Lipid Droplet
LSDP5 Lipid Storage Droplet Protein 5

Abbreviations
VI
Luc Luciferase
MAG Monoacylglycerol
mRNA messenger RNA
MPR Mannose 6-Phosphate Receptor
ng nanogram
NR Nuclear Receptor
OA Oleic acid
PAT Perilipin, ADRP, TIP47
PBS Phosphate buffered saline solution
PCR Polymerase Chain Reaction
P/S Penicillin/Streptomycin
PGC-1 PPARγ Coactivator-1
PKA Protein Kinase A
PPAR Peroxisome Proliferator-Activated Receptor
PPRE PPAR Response Element
PUFA Polyunsaturated Fatty Acids
qRT-PCR quantitative Real-Time PCR
RAR Retinoic Acid Receptor
RE Response Element
RNA Ribonucleic Acid
Rnase Ribonuclease
Rt Room temperature
RT Reverse Transcription
RT-PCR Reverse Transcription PCR
RXR Retinoid X Receptor
TAG Triglyceride (TAG, Triacylglycerol)
TIP47 Tail-interacting Protein of 47kDa

Abbreviations
VII
TF Transcription Factor
WAT White Adipose Tissue
WT Wild Type
WY-14643 Synthetic PPARα ligand

Content
VIII
Content Acknowledgements ..................................................................................................................... I
Abstract .................................................................................................................................... III
Abbreviations ............................................................................................................................ V
Content .................................................................................................................................. VIII
1 Introduction ........................................................................................................................ 1
1.1 Lifestyle diseases and energy balance ......................................................................... 1
1.2 Nutrition and gene regulation ...................................................................................... 1
1.3 Transcriptional regulation ............................................................................................ 2
1.3.1 The basic transcriptional machinery .................................................................... 3
1.4 Nuclear receptors ......................................................................................................... 5
1.4.1 Retinoid X Receptors ........................................................................................... 7
1.4.2 Peroxisome Proliferator Activated Receptors (PPAR) ........................................ 8
1.4.3 Estrogen-related receptors .................................................................................. 14
1.4.4 Coregulators ....................................................................................................... 15
1.5 Lipid droplets ............................................................................................................. 17
1.5.1 Lipid droplets characteristics and function ........................................................ 18
1.5.2 Lipid droplet formation ...................................................................................... 19
1.5.3 Fat mobilization from lipid droplets ................................................................... 21
1.6 Lipid droplet associated proteins ............................................................................... 22
1.6.1 Perilipins ............................................................................................................. 23
1.6.2 Perilipin 1 ........................................................................................................... 25
1.6.3 Perilipin 2 (ADRP) ............................................................................................. 27
1.6.4 Perilipin 3 (Tip 47) ............................................................................................. 28
1.6.5 Perilipin 4 (S3-12) .............................................................................................. 28
1.6.6 Perilipin 5 (LDSP 5) ........................................................................................... 29
2 Aims of the study ............................................................................................................. 31
2.1 Objectives .................................................................................................................. 31
2.2 Hypothesis ................................................................................................................. 31
3 Materials ........................................................................................................................... 33
3.1 Equipment and chemicals .......................................................................................... 33
3.2 Instruments ................................................................................................................ 34

Content
IX
3.3 Kits............................................................................................................................. 35
3.4 Software and internet resources ................................................................................. 35
3.5 Cell-lines, plasmids and vectors ................................................................................ 36
4 Methods ............................................................................................................................ 37
4.1 Transformation .......................................................................................................... 37
4.1.1 Heat shock transformation of DH5α E.coli ....................................................... 38
4.1.2 Electroporation of E. Coli strains ....................................................................... 39
4.2 Plasmid isolation........................................................................................................ 39
4.3 PCR mutagenesis ....................................................................................................... 41
4.4 Measuring of DNA and RNA concentration on NanoDrop-1000 ............................. 45
4.5 Cell culturing ............................................................................................................. 46
4.5.1 Counting of cells ................................................................................................ 46
4.5.2 Culturing of C2C12 cells .................................................................................... 46
4.6 Transfection of cells .................................................................................................. 48
4.6.1 Transfection of C2C12 cells ............................................................................... 49
4.7 Dual Luciferase measurement ................................................................................... 50
4.8 Total RNA isolation of C12C12 cells........................................................................ 52
4.9 cDNA synthesis by reverse transcription .................................................................. 52
4.10 Quantitative Real-Time PCR (qRT-PCR) ............................................................. 53
4.11 Statistical analyses ................................................................................................. 57
5 Results .............................................................................................................................. 59
5.1 PPARα is an important transcription factor regulating expression of Plin5 ............. 59
5.2 Ligand stimulation of PPARδ results in a cell-line expressing Plin5 ....................... 62
5.3 The effect of PPARα and PPARδ on Plin5 expression increases with time ............. 64
5.4 PGC1β is an important coactivator for expression of Plin5 in muscle cells ............. 67
5.5 PPARs bind to a conserved PPRE located in Plin5 intron 1 ..................................... 69
6 Discussion ........................................................................................................................ 75
6.1 Methodology .............................................................................................................. 75
6.2 General discussion ..................................................................................................... 80
7 Conclusion ........................................................................................................................ 91
8 Suggested further work ......................................................................................................... 93
References ................................................................................................................................ 95
Appendix A ............................................................................................................................ 115

Content
X
Appendix B ............................................................................................................................ 116

Introduction
1
1 Introduction
1.1 Lifestyle diseases and energy balance The World Health Organization has referred to obesity as “the most blatantly visible, yet most
neglected public health problem” (1). Overweight and obesity origin from excessive neutral
lipid storage, and are important determinants of health and lead to adverse metabolic changes,
including unfavorable cholesterol levels, increases in blood pressure and increased resistance
to insulin. They result in elevated risk of coronary heart disease, stroke, diabetes mellitus, and
many forms of cancer (2). On the other hand, lack of neutral lipid storage is associated with
lipodystrophies (3). Understanding the molecular mechanisms that regulate neutral lipid
storage holds the key to develop therapeutic treatments for these metabolic diseases.
1.2 Nutrition and gene regulation The effects of nutrition on health and disease cannot be understood without a profound
understanding of how nutrients act at the molecular level (4). From a molecular standpoint,
nutrients are considered to be “signaling molecules” that, through appropriate cellular sensing
mechanisms, result in translation of these dietary signals into changes in gene, protein, and
metabolite expression (5). A gene is “expressed” when its code is produced into a protein (or
RNA). For this to happen several steps are required, such as transcription and translation
(Figure 2). This information flow from DNA to RNA to protein was named of Francis Crick
as “the central dogma” of molecular biology already in 1958 (6): “once information has got
into a protein it can never get out again”. The “information” he refers to is the amino acid
residues defining the protein, the product of the translation process. This was thought to apply
for all organisms, but later it was found that for RNA viruses the flow of genetic information
is starting from RNA.
Figure 1: The central dogma of molecular biology.
Introduction
2
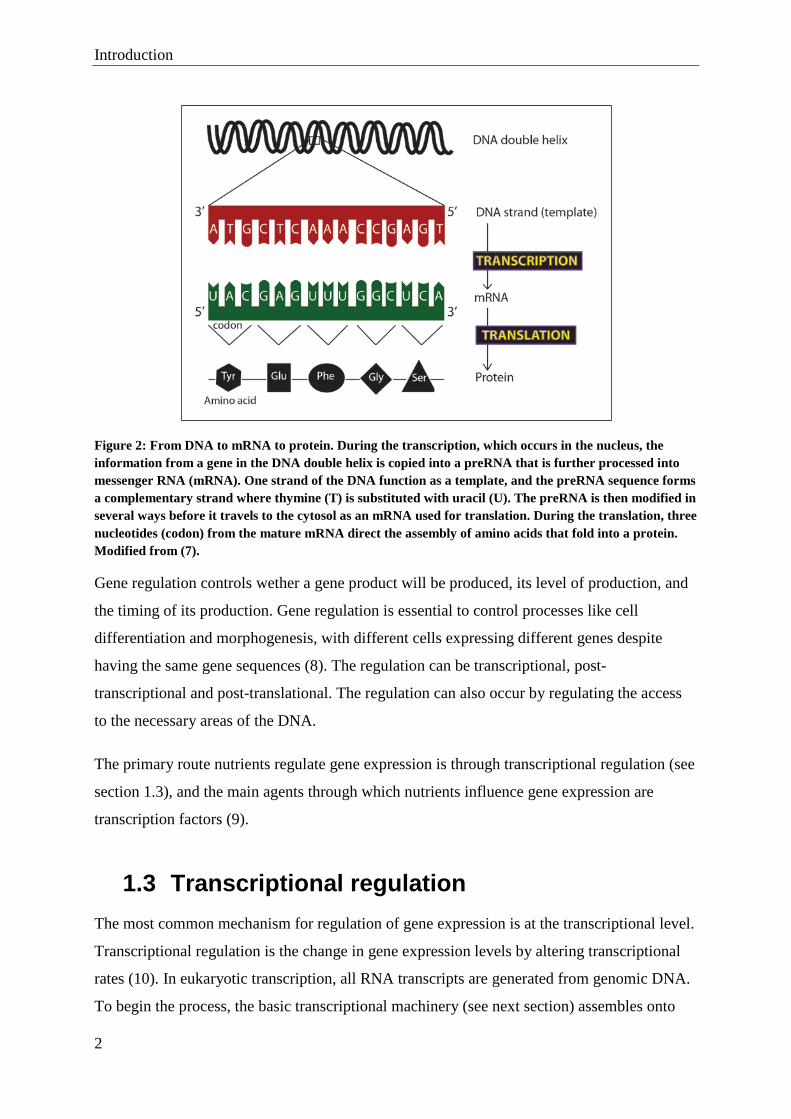
Figure 2: From DNA to mRNA to protein. During the transcription, which occurs in the nucleus, the information from a gene in the DNA double helix is copied into a preRNA that is further processed into messenger RNA (mRNA). One strand of the DNA function as a template, and the preRNA sequence forms a complementary strand where thymine (T) is substituted with uracil (U). The preRNA is then modified in several ways before it travels to the cytosol as an mRNA used for translation. During the translation, three nucleotides (codon) from the mature mRNA direct the assembly of amino acids that fold into a protein. Modified from (7).
Gene regulation controls wether a gene product will be produced, its level of production, and
the timing of its production. Gene regulation is essential to control processes like cell
differentiation and morphogenesis, with different cells expressing different genes despite
having the same gene sequences (8). The regulation can be transcriptional, post-
transcriptional and post-translational. The regulation can also occur by regulating the access
to the necessary areas of the DNA.
The primary route nutrients regulate gene expression is through transcriptional regulation (see
section 1.3), and the main agents through which nutrients influence gene expression are
transcription factors (9).
1.3 Transcriptional regulation The most common mechanism for regulation of gene expression is at the transcriptional level.
Transcriptional regulation is the change in gene expression levels by altering transcriptional
rates (10). In eukaryotic transcription, all RNA transcripts are generated from genomic DNA.
To begin the process, the basic transcriptional machinery (see next section) assembles onto

Introduction
3
DNA. This formation is under control of numerous gene-specific transcription factors and the
polymerase machinery. In addition, because eukaryotic genes are wrapped around histones,
the modification of histones also has a central part in the regulation of gene expression. Both
the time for the transcription and the amount of RNA to be produced, are subjected to
transcriptional regulation. There are three different classifications of RNAs; messengerRNA
(mRNA), transferRNA (tRNA) and ribosomalRNA (rRNA). RNA polymerase I is responsible
for generating rRNA, RNA polymerase II for mRNA, and RNA polymerase III for tRNA.
This thesis focuses on regulation of mRNAs, which are the type of RNA that encodes for
synthesis of proteins.
1.3.1 The basic transcriptional machinery
The basic transcriptional machinery contains the TATA binding protein (TBP) and general
transcription factors (GTFs) that form a complex with RNA polymerase II. These factors bind
to a DNA sequence called the TATA-box (see Figure 3), a short double-helical DNA
sequence mainly composed of T and A nucleotides typically located 25 nucleotides upstream
from the transcription start site. GTFs are proteins that assemble on all promoters transcribed
by RNA polymerase II. Additional transcription factors that are ubiquitous to all promoters
bind upstream at different sites in the promoter region, thereby increasing the transcription
frequency and being necessary for a promoter to function at an adequate level. Genes that are
regulated by these consensus elements in the promoter alone are constitutively expressed. But
there are also gene-specific DNA regulatory sequences that are used to alter the gene
transcription 1000-fold or more. Gene-specific transcription factors bind to these unique
sequences often referred to as enhancers, that can be located at some distance from the core
promoter, either upstream or downstream of the transcriptional initiation site. The binding of
gene-specific transcription factors to enhancer regions interacts with coregulator proteins,
which again interacts with the basic transcriptional machinery by forming a loop in the DNA.
Depending on the coregulator proteins bound, the enhancer complex activates or represses
assembly of GFT at the transcription start site on the promoter (11).

Introduction
4
Figure 3: The gene regulatory control region. Specific transcription factors are shown as activators, but may also be repressors. First the TATA-binding protein (TBP) and some of the basal factors (A-D) bind to the TATA-box in the promoter. When the rest of the basal factors bind, a complete transcription factor complex is formed that RNA polymerase can bind to. The basal factors are needed for the transcription, but do not influence the transcription rate. Coactivators combine the basal factors with the activators, which bind to enhancers distant located from the promoter. The interaction between activators and coactivators increases the transcription rate. If a repressor binds to a “silencer” region adjacent to or overlapping the enhancer sequence, the corresponding activator can no longer bind to the DNA. TBP: Tata binding protein. Modified from (12).
Once RNA polymerase II is bound to the promoter, the double helix of DNA is opened, and
the polymerase starts to synthesize a single-stranded RNA (premature mRNA) that is
complementary to the DNA template strand. Unlike DNA polymerase, RNA polymerase II
can start synthesizing new strands in the absence of a primer. The RNA polymerase and the
newly-made RNA strand dissociate from the DNA at a termination signal which ends the
transcription. After completed transcription, the pre-RNA is processed into mRNA and
transported out of the nucleus. The mRNA is used in the translation process, where its
information is translated from “RNA-language” to “protein-language”, in other words from
nucleotides to amino acids.

Introduction
5
1.4 Nuclear receptors Various transcription factor families alter basal transcription rate in response to change in
nutrients. One large group of nutrient sensors is the nuclear receptor superfamily (see Figure
4) of transcription factors (TFs), with 48 functional members in the human genome, and 49 in
the mouse genome (13). Nuclear receptors (NRs) function as ligand-activated transcription
factors that regulate gene-specific expression of target genes and affect processes as diverse as
nutrient metabolism, embryonic development, cell proliferation, and cellular differentiation
(14). Numerous receptors in this superfamily bind nutrients or their metabolites (9;15). The
NRs play a central role in the body’s ability to transduce steroid, retinoid, thyroid, and
lipophilic endocrine hormones (16). Together their target genes make a network with
coordinated activity that defines the physiological response.
Figure 4: The nuclear receptor superfamily. Classification of NRs according to physiological properties, and source and type of ligand. Adapted from (14).
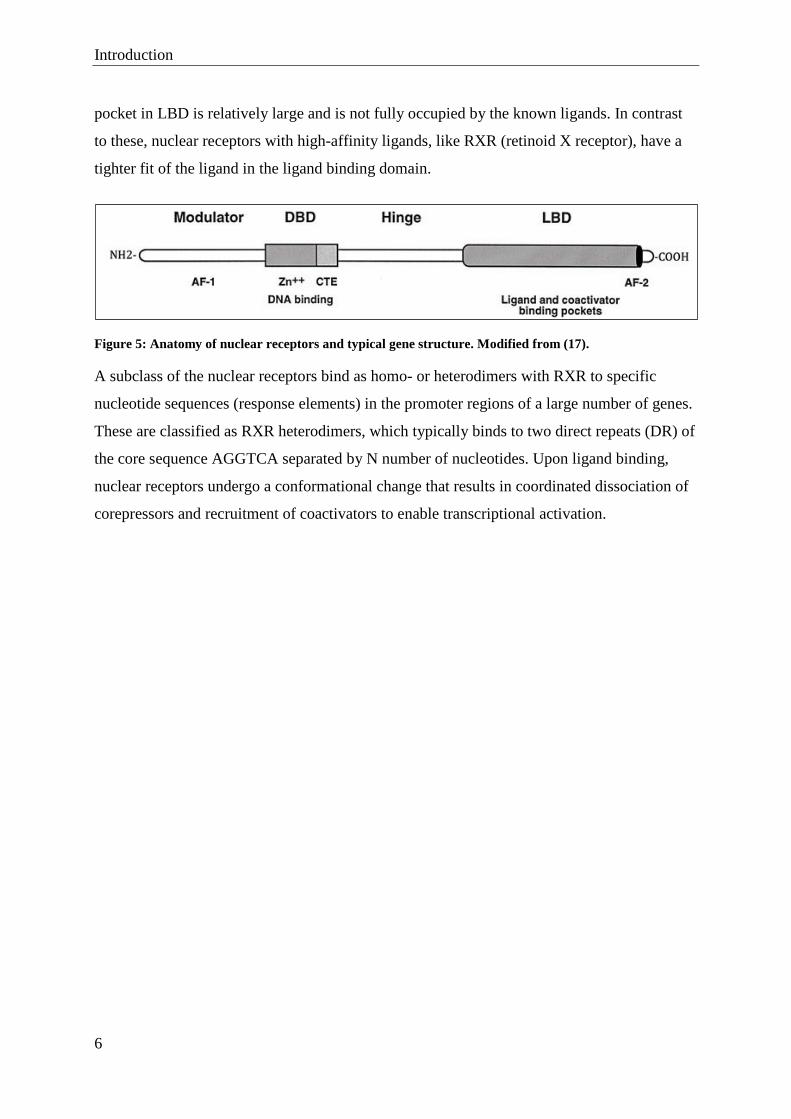
Despite having wide variation in ligand sensitivity, all NRs share a similar structural
organization, see Figure 5. Almost everyone of them contains a ligand-independent
transcriptional activation function (AF-1) in the NH2-terminal region; two highly conserved
zinc finger motifs targeting the NR to hormone response elements in a core DNA-binding
domain; a hinge region that allows for simultaneous receptor dimerization and DNA binding
through protein flexibility; and a large COOH-terminal region that contains the ligand-
binding domain (LBD), dimerization interface, and a ligand-dependent activation function
domain (AF-2) (14). In some nuclear receptors (e.g. PPAR, LXR, PXR) the ligand-binding
Introduction
6
pocket in LBD is relatively large and is not fully occupied by the known ligands. In contrast
to these, nuclear receptors with high-affinity ligands, like RXR (retinoid X receptor), have a
tighter fit of the ligand in the ligand binding domain.
Figure 5: Anatomy of nuclear receptors and typical gene structure. Modified from (17).
A subclass of the nuclear receptors bind as homo- or heterodimers with RXR to specific
nucleotide sequences (response elements) in the promoter regions of a large number of genes.
These are classified as RXR heterodimers, which typically binds to two direct repeats (DR) of
the core sequence AGGTCA separated by N number of nucleotides. Upon ligand binding,
nuclear receptors undergo a conformational change that results in coordinated dissociation of
corepressors and recruitment of coactivators to enable transcriptional activation.

Introduction
7
Figure 6: DNA binding by nuclear receptors. A: Nuclear receptors can bind DNA as monomers, homodimers, and RXR heterodimers. The latter binds to response elements consisting of direct repeats of the sequence AGGTCA separated by N number of nucleotides. B: Schematic structure of a nuclear receptor DBD. Adapted from (17).
1.4.1 Retinoid X Receptors
The retinoid X receptors (RXRs) are unique among the members of the nuclear receptor
family as they are able to form heterodimers with many other nuclear receptors (18-21).
Heterodimerization is a general and simple mechanism by which a linear signaling pathway
can be converted into a highly complex network, acting in a cell-specific manner in response
to physiological or pathological signals. Because of their heterodimerization with other NRs,
which occurs either spontaneously (22) or is stimulated upon ligand binding (23), RXRs are
often considered to reduce the specificity of the signaling pathway.

Introduction
8
RXRs were first identified as heterodimeric partners of the retinoic acid (RAR), thyroid
hormone and vitamin D nuclear receptors and are required for high affinity binding of these
and other RXR heterodimers to DNA (24). Later it was discovered that the natural molecules
docosahexanoic acid (DHA) (25) and β-apo14’-carotenal (26), which regulate the
transcriptional activity of other receptors including PPARs, were able to activate or repress
RXR transcriptional activity, yet they are not RXR-specific ligands.
There are three different RXR isotypes (RXRα, RXRβ, RXRγ) with distinct properties that
thereby modulate the transcriptional activity of RXR-containing heterodimers. The homology
of the three RXR subtypes indicates that these receptors regulate common target sequences
and respond to common ligands (27). The expression pattern of the subtypes is rather
different. RXR and RXRβ are expressed in many tissues while RXRγ expression is mainly
restricted to the muscle and brain (27).
By being essential binding partners to a number of other NRs, RXRs play critical roles in a
wide range of developmental processes, from embryo implantation to organogenesis, as well
as in the regulation of adult physiology and metabolic processes.
1.4.2 Peroxisome Proliferator Activated Receptors (PPAR)
Peroxisome proliferator-activated receptors (PPARs) are fatty acid-activated transcription
factors belonging to the nuclear hormone receptor family (28-30), thereby influencing
expression of specific genes (9). One of the main functions of PPARs is that they are able to
respond to dietary stimuli to maintain energy homeostasis. Three isoforms have been
identified in mammals, with different tissue expression, functions and ligand specificities;
PPARα, PPARβ/δ (hereafter referred to as PPARδ) and PPARγ (29-32). The PPARs were
initially described as orphan NRs, but several potential endogenous ligands were later
described, as reviewed in (33). In contrast to other NRs, which only bind a few specific
ligands at high affinity, a ligand that is able to activate one of the PPAR subtypes can often
bind to or activate the other subtypes as well. This non-strict ligand specificity is a key feature
of the PPARs, which enable these TFs to act as receptors for several ligands binding to the
receptors with relatively low affinity. A broad ligand-specificity is possible due to the
significantly large ligand-binding pocket in the PPARs, compared to other NRs (33). Several
endogenous ligands are shown to bind to PPARs, such as the polyunsaturated fatty acids
(PUFAs), α-linolenic acid and linoleic acid, and conversion products of essential fatty acids

Introduction
9
synthesized by lipoxygenases or cyclooxygenases. However, despite the demonstration that
the ligands may bind to PPARs, it’s not given that any of them are bona fide endogenous
ligands; the ligands have to be present inside the cells in concentrations high enough to
actually activate the PPARs. To study the transcriptional regulation of PPARs it’s possible to
use synthetic ligands that have been developed as drugs for different lifestyle diseases. Most
of these developed synthetic ligands have specific preference for only one of the PPAR
members.
Figure 7: Metabolic integration by PPARs. The three PPAR isoforms regulate lipid and glucose homeostasis through their coordinated activities in liver, muscle and adipose tissue. Adopted from (34).
The PPARs bind as obligate heterodimers with RXR to PPAR response elements (PPREs) in
target genes and change the dynamics between coregulators (section 1.4.4) and hence
modulate transcription of the target genes (Figure 8). Because of this heterodimerization, in
which both partners contact the DNA, two copies of the core motif are necessary to constitute
a functional hormone response element (HRE). The usual PPREs consist of a direct repeat
hexameric DNA recognition motif (AGGTCA) separated by one nucleotide (DR1) (35).
However, binding of PPARs to DR2 sequences has also been reported (36-40).

Introduction
10
Figure 8: Schematic diagram of PPAR activation. PPAR: Peroxisome proliferator-activated receptor; RXR: Retinoid X receptor; DBD: DNA binding domain; PPRE: Peroxisome proliferator-activated receptor response element; RNA POL II: RNA polymerase II. Modified from (41).
The abundance of NRs, their corepressors and coactivators, activity of the pathways that
produce PPAR and RXR ligands, and physiological and pathophysiological conditions
affecting lipid signals are examples of different levels at which the regulatory action of the
PPAR:RXR heterodimer can be exerted (42). The fact that RXR also is a NR with its own
ligand, makes it possible that a functional PPAR-RXR heterodimer can bind to DR1-elements
and activate transcription even in the absence of PPAR-ligand, if a RXR-ligand is present
(43).
PPARα
PPARα is expressed in tissues with high fatty acid catabolism, such as brown adipose tissue,
liver, heart, kidney, and intestine, where it promotes fatty acid oxidation, ketogenesis, lipid
transport, and gluconeogenesis (44;45). It is also expressed in immune cells like
macrophages, lymphocytes and granulocytes (46-50). During starvation and cold
acclimatization, the receptor is activated and stimulates expression of genes important to
provide energy from fatty acid catabolism (33), such as genes involved in stimulating fatty
acid uptake into the cell and subsequent fatty acid transport into mitochondria for oxidation.
As a consequent, the incorporation of fatty acids into plasma lipoproteins carrying

Introduction
11
triglycerides (TAGs) is reduced. PPARα also lowers TAGs by increasing lipoprotein lipase
and apolipoprotein A-V, and by repressing the expression of apoC-III which is an inhibitor of
TAG hydrolysis (51;52). This explains why fibrate drugs, which act as synthetic ligands of
PPARα, can be used in the treatment of hypertriglyceridemia by lowering triglycerides and
raising HDL (53).
Dietary fatty acids can bind to and activate PPARα, which makes our diet directly linked to
the regulation of genes. PPARα is the only subtype of PPARs that was thought to have an
endogenous bona fide fatty acid ligand (33). The work of Chakravarthy et al (54) suggests
that fatty acid synthase (FAS) is involved in generation of a PPARα-ligand, and recently the
same group found that the FAS-product phospholipid 1-palmitoyl-2oleoyl-sn-glycerol-3-
phosphocholine (16:0/18:1-GPC) activates transcription in a PPARα-dependent manner (55),
making it an endogenous ligand that is influenced by the diet (see Figure 9). A diet with high
fat content activates PPARα, while a diet with low fat and high sugar content will upregulate
FAS and produce the ligand that activate PPARα. This way the PPARα functions both as a
lipid sensor and a carbohydrate sensor. When PPARα is activated, numerous genes are
transcriptionally regulated, which contribute to maintaining energy homeostasis partly by
promoting β-oxidation of fatty acids (56).

Introduction
12
Figure 9: Routes to PPARα-activation in the liver. 1: Dietary fatty acids activate PPARα. 2: FAS and CEPT-1 control the production of 16:0/18:1-GPC when diet contains no fat. GPC activates PPARα. PPARα promotes β-oxidation of fatty acids and thereby contributes to maintaining energy balance. CEPT1: choline-ethanolamine phosphotransferase 1. DAG: diacylglycerol. FA: fatty acids. VLDL: very low density lipoprotein. Adopted from (56).
PPARβ/δ
PPARδ is expressed ubiquitously (46;57). Fatty acid metabolism, mitochondrial respiration
and programming of the muscle fiber type are examples of pathways regulated by PPARδ.
PPARδ is activated by exercise (58) and regulates fatty acid oxidation in muscle (33) by
stimulating transcription of genes that stimulate the conversion of fatty acids into energy for
working muscles. Its role in lipid metabolism is well established based on knockout and
overexpression studies in transgenic mice (59-61). The PPARδ knockout mice are smaller

Introduction
13
than wild type animals, both before and after birth. Overexpression of a constitutively active
PPARδ in WAT reduces adiposity, most likely because of enhanced level of fatty acid
oxidation. Ligand activation of PPARδ delays weight gain by increasing fatty acid catabolism
in adipose tissue and skeletal muscle (62). This process depends on both PPARδ and AMPK,
which also is activated by the PPARδ-ligand (GW501516) through decreased ATP levels and
a lower ATP:AMP ratio (63). Like PPARδ, AMPK is also activated by exercise (since this
process consumes ATP). PPARδ and AMPK seem to activate a program that increases the
coupling of glycolysis to glucose oxidation in muscle (64).
Muscle-specific overexpression of PPARδ in mice changes fiber composition to more
oxidative fibers (58), whereas muscle-specific knockdown of PPARδ results in a fiber-type
switch toward lower oxidative capacity (65), development of obesity, and diabetes type 2
(66). However, the same effects have not been shown in primates, which implies that weight
reduction caused by PPARβ/δ ligands in mice might depend on their effects on
thermogenesis, which is a minor mechanism of energy expenditure in humans and primates
(67).
PPARγ
PPARγ is activated in the fed state (postprandial), and is especially abundantly expressed in
white and brown adipose tissue where it promotes lipid storage and adipocyte differentiation
and maintenance (68-70). It is also shown to be expressed in immune cells. It is a central
regulator of fatty acid synthesis and insulin sensitivity for major glucose utilizing tissues.
PPARγ is activated by synthetic ligands, such as the thiazolidinedione (TZD) group, which is
used clinically to treat diabetes type 2.
PPARγ exists in two isoforms, transcribed from the same gene; PPARγ1 and PPARγ2. The
latter is expressed highly specifically in adipose tissue, while PPARγ1is expressed at a lower
level in a broader range of cell types (71-78). The receptors central role in adipocyte function
has been well demonstrated. PPARγ-knockout mice fail to develop adipose tissue (79-81).
Humans with different single allele dominant-negative mutations in PPARγ develop partially
lipodystrophy and insulin resistance (82-84).

Introduction
14
1.4.3 Estrogen-related receptors
The estrogen-related receptors (ERRs) are referred as “estrogen-related” as they share high
degree of sequence homology with estrogen receptor α (ERα) and can be activated by non-
hormonal signals (85). But they do apparently not bind estrogens or other known natural ERα
agonists (86), and the three family members therefore belongs to the orphan family of NR.
ERRα and ERRβ were the first orphan NRs identified during a search for genes related to the
estrogen receptors (86). ERRγ was discovered a decade later (85;87;88).
All three ERR isoforms are widely expressed in the central nervous system (89). ERRα is
widely expressed in adult tissues, especially in tissues that utilize or can utilize fatty-acid β-
oxidation (86;90-92). It is also expressed throughout the adipocyte differentiation program
(93) and in bone-derived macrophages activated by lipopolysaccharide or interferon γ (IFN-γ)
(94;95). ERRα is involved in many aspects of lipid metabolism. Some of these effects are
driven by coactivation by peroxisome proliferator-activated receptor gamma coactivator 1α
and β (PGC1α and PGC1β) (96-100). Similar to PGC1α, ERRα expression is stimulated by
physiological stimuli such as exposure to cold temperatures, exercise, and fasting (91;93;98).
Induction of PGC1α expression by physiological stimuli is believed to increase the
transcriptional activity of the ERRs, stimulating expression of ERRα and other ERR target
genes in a positive feedforward mechanism.
ERRβ and ERRγ are more restricted expressed and are generally expressed at lower levels
than those of ERRα. Little is known about the physiologic role of ERRβ. Both ERRβ and
ERRγ are present in abundance in the heart and kidneys, and their expression patterns
segregate with tissues associated with basal metabolic functions (90). ERRγ is generally
highly expressed in tissues with high metabolic activity (e.g. heart, kidney, slow-twitch
muscle, BAT and the central nervous system). Loss of ERRγ appears to prevent a perinatal
transition from carbohydrate-based fetal metabolism to a lipid-predominant adult metabolism
(101).

Introduction
15
1.4.4 Coregulators
In addition to the group of sensing transcription factors that directly interact with DNA by
binding to specific response elements, coregulator proteins (corepressors and coactivators)
direct a substantial component of gene control. Coactivators exist in multiprotein complexes
that dock on transcription factors and modify chromatin, allowing transcription to take place
(9). Nearly 300 distinct coregulators have been identified, revealing that a great variety of
enzymatic and regulatory capabilities exist for NRs to regulate transcription and other cellular
events (16).
A coactivator is a molecule that the NR directly recruits to amplify NR-mediated gene
expression. The recruitment is normally, but not always, ligand dependent. A corepressor
functions in the opposite manner to repress gene expression, mainly through its interactions
with unliganded NRs (16).
Coregulator dysfunction occurs in numerous human diseases. Coregulators are often over- or
underexpressed in a wide range of cancers. Human genetic variations are to a great degree
present in coregulatory genes causing human phenotypic variations in steroid biology, cancer,
and metabolic disorders (16).
Peroxisome proliferator-activated receptor gamma coactivator 1 (PGC1)
An important group of coactivators for this master thesis is the PGC1s. They coactivate
avariety of transcription factors, including the majority of the NR-family such as the retinoid
receptors (102;103), the ERRs (102;104;105), and not least the PPAR transcription factor
family (102;103;106;107) which they coactivate to activate the expression of genes involved
in mitochondrial fatty acid oxidation.
Introduction
16
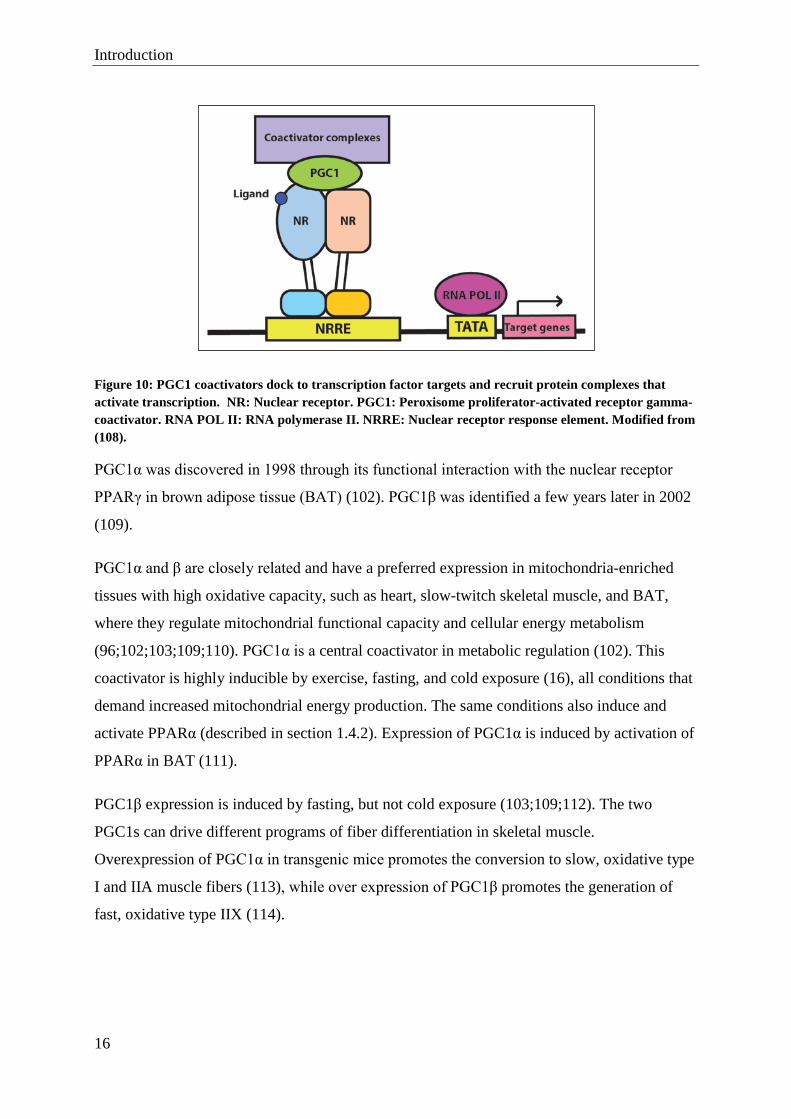
Figure 10: PGC1 coactivators dock to transcription factor targets and recruit protein complexes that activate transcription. NR: Nuclear receptor. PGC1: Peroxisome proliferator-activated receptor gamma-coactivator. RNA POL II: RNA polymerase II. NRRE: Nuclear receptor response element. Modified from (108).
PGC1α was discovered in 1998 through its functional interaction with the nuclear receptor
PPARγ in brown adipose tissue (BAT) (102). PGC1β was identified a few years later in 2002
(109).
PGC1α and β are closely related and have a preferred expression in mitochondria-enriched
tissues with high oxidative capacity, such as heart, slow-twitch skeletal muscle, and BAT,
where they regulate mitochondrial functional capacity and cellular energy metabolism
(96;102;103;109;110). PGC1α is a central coactivator in metabolic regulation (102). This
coactivator is highly inducible by exercise, fasting, and cold exposure (16), all conditions that
demand increased mitochondrial energy production. The same conditions also induce and
activate PPARα (described in section 1.4.2). Expression of PGC1α is induced by activation of
PPARα in BAT (111).
PGC1β expression is induced by fasting, but not cold exposure (103;109;112). The two
PGC1s can drive different programs of fiber differentiation in skeletal muscle.
Overexpression of PGC1α in transgenic mice promotes the conversion to slow, oxidative type
I and IIA muscle fibers (113), while over expression of PGC1β promotes the generation of
fast, oxidative type IIX (114).

Introduction
17
Figure 11: The PGC1 gene regulatory cascade, represented by PGC1α. The illustration indicates the upstream signaling events and downstream gene regulatory actions of the inducible PGC1 coactivators. The signaling pathways shown at the top of each organ system transduce extracellular physiologic and nutritional stimuli to the expression and/or activity of PGC1α. Adopted from (108).
1.5 Lipid droplets Lipid droplets (LDs) were almost neglected by scientist for ~100 years due to a simplistic
view of LDs as biological inert “bulbs of fat”. However, research on LDs the last two
decades has established LDs as a novel cellular organelle. LDs are sites of regulated release of
stored fat by lipases during cell growth and fasting, thus they are central to energy balance at
cellular and organismal levels. The stored lipid can also be used as substrate for synthesis of
other important cellular molecules, such as membrane phospholipids and eicosanoids (115).
The prevalence of life style diseases such as metabolic syndromes, obesity, steatosis and
atherosclerosis, has prompted research on LDs. Furthermore, reflecting on the multifaceted
nature of LD functions, the range of diseases that are linked to LD abnormality is extended to
neuropathy, cardiomyopathy and other diseases that do not appear to be directly related to
lipids (116).

Introduction
18
1.5.1 Lipid droplets characteristics and function
LDs are independent organelles that are composed of a lipid ester core and a surface
phospholipid monolayer coated by specific proteins (see Figure 12), including proteins of the
Perilipin PAT family (see section 1.6.1). They can be observed by microscopy as round
structures, but their size and number of droplets varies between cell types and within the same
cell type. Their diameters range from 0.1-5 µm in nonadipocytes, but in white adipocytes they
can reach more than 100 µm (117), and occupy more than 95 % of the cell volume. Most
adipocytes contain only one large LD, and the LD contour is defined by the cell periphery
(116). Non-adipocyte LDs are generally round and are located in the cytoplasm distant from
the cell surface. The core of LDs consists of neutral lipids, such as triglycerides (TAG) and
cholesteryl esters (CE) of different ratios. In white adipocytes TAG is the dominating stored
lipid.
Figure 12: Lipid droplet composition. Modified from (118).
LDs are often juxtaposed to the endoplasmic reticulum (ER) (see Figure 13), mitochondria
and peroxisomes, both in adipocytes and in non-adipocytes (119-123). These arrangements
probably reflect active lipid transport between LDs and these organelles. Enzymes that
catalyze the last step of TAG and steoryl ester synthesis, which are two isoforms of
diacylglycerol acyl-CoA acyltransferases (DGAT) and cholesterol acyl-CoA acyltransferases
(ACAT), respectively, harbor the ER membrane in mammalian cells (124-126). For
mitochondria and peroxisomes, the close physical association with LDs is necessary for the
import of fatty acids for β-oxidation (116). The molecular machinery in and around LDs
regulates synthesis, utilization and trafficking of lipids and plays a crucial role in the cellular

Introduction
19
lipid metabolism (116). Thus, in addition to being a storage organelle, LDs also function in
maintaining lipid homeostasis and metabolism (127).
Figure 13: Lipid droplet juxtaposed to endoplasmatic reticulum. TAGs are synthesized by enzymes associated with LD, ER and mitochondria. ACS: acyl-CoA synthetase. GPATs: glycerol-3-phosphate acyltransferases. AGPATs: 1-acylglycerol-3-phosphate acyltransferases, PAP: phosphatidic acid phosphohydrolase. DGAT: diacylglycerol acyltransferase. FSP27: fat-specific protein of 27 kDa (also called CIDEC). FIT: fat storage-inducing transmembrane proteins. ER: Endoplasmatic Reticulum. LD: Lipid Droplet. Modified from (128).
1.5.2 Lipid droplet formation
The formation of LDs is highly connected to the biosynthesis of TAGs (129). Unesterified
fatty acids (FA) have numerous functions, such as serving as substrates for the production of
ATP and acting as ligands for nuclear receptors and thereby regulate gene expression.
Nonetheless, because of their amphiphatic nature, which makes them capable of damage
membranes of cells and organelles, they are toxic for the cell at higher concentrations. To
avoid such toxicity, excess FAs are rapidly esterified with glycerol to form TAGs, or
cholesteryl to form CEs, and stored in LDs (130;131).
The synthesis of TAG has been reviewed in (132). The first step in the dominating pathway
for formation of triglycerides starts with the formation of lyso-phosphatidic acid in a reaction
catalyzed by glycerol-3-phosphate acyltransferase (GPAT). In the next step, 1-acylglycerol-
3phosphate O-acyltransferase (AGPAT) catalyses the formation of phosphatidic acid (PA).
PA phosphohydrolase hydrolyzes PA when associated with microsomal membranes, forming
diacylglycerol (DAG). Diacylglycerol acyltransferase (DGAT) then catalyzes the conversion
of DAG to TAG.

Introduction
20
Studies performed to determine the cellular location and the processes involved in LD
formation are inconclusive (133-137). Increasing evidence support that the ER is tightly
wrapped around LDs (138;139). Enzymes catalyzing the final steps in neutral lipid synthesis
are localized to the ER membrane (124;140-143), suggesting that LDs emerge from ER when
fatty acids are esterified to glycerol or cholesterol. The most accepted model for LD formation
(reviewed in (144-146)) proposes that lipid esters accumulate between the two leaflets of the
ER membrane, which ultimately makes the leaflets bulge in the direction to be covered by the
cytoplasmic membrane leaflet (see Figure 14). Finally the droplet is pinched off from the
membrane to become an independent LD.
A newly-formed LD has a diameter of only 0.1-0.4 µm, but grows as it fuses with other LDs,
independently of TAG-synthesis. In order for this to happen, the LDs have to move closer to
each other. This process seems facilitated by the transport of LDs on microtubuli with the
help of the motor protein dynein (147;148). Fusion of individual LDs might be assisted byα-
Soluble N-ethylmaleimide-sensitive factor Adaptor protein Receptor (SNARE)-proteins
(149), in which different SNARE-proteins on the two fusing membranes interact with each
other and form a complex that causes fusion. In this process, the LD monolayers from the two
LDs will melt together, forming a new single larger LD (132;149).

Introduction
21
Figure 14: The leading model for LD formation. See text for details. LD: Lipid droplet. ACAT: acyl-CoA acyltransferase. DGAT: diacylglycerol acyl-CoA acyltransferase. ER: Endoplasmatic reticulum. Modified from (116) and (150).
1.5.3 Fat mobilization from lipid droplets
When the demand for energy is increased, such as during fasting, the TAGs stored in the LD
can be hydrolyzed to FAs and glycerol in a process termed lipolysis. This process is best
described for adipocytes, where the process is tightly regulated by hormones. Adipose tissue
secretes FAs to provide them as systemic energy substrate. The liver takes up a large fraction
of the FAs and converts some of these to ketone bodies. Glycerol that enters the liver is used
to produce glucose through gluconeogenesis. In muscle, the majority of liberated FAs are
oxidized to produce ATP.
The first and rate-limiting step of the breakdown of TAGs is performed by the enzyme
adipose triglyceride lipase (ATGL), which hydrolyzes a fatty acyl chain to yield DAG (151).
The activity of ATGL is stimulated by comparative gene identification-58 (CGI-58) (152).
Loss of function mutations in CGI-58 severely prevents ATGL-activity and leads to massive
accumulation of TAGs in affected tissues (152). On the contrary, abundance of CGI-58
increases the activity of ATGL and hydrolysis of TAG into DAG. The second fatty acyl side
chain is then hydrolyzed by the enzyme hormone sensitive lipase (HSL) to yield MAG. MAG

Introduction
22
is finally hydrolyzed by monoglycerid lipase (MGL) to yield glycerol and FA (153). In
unstimulated adipocytes, CGI-58 is bound to unphosphorylated perilipin 1 at the LD-surface,
ATGL is present both in the cytosol and on the LD-surface, whereas HSL is located only in
the cytosol (154;155). In this basal state, re-esterification most likely also proceeds. For full
hormone-activated lipolysis in WAT, β-adrenergic stimulation and PKA-activation is
necessary. Briefly, phosphorylation of HSL and perilipin 1 initiates a cascade reaction. HSL
translocates to the LD-surface, and CGI-58 dissociates from perilipin 1 (155;156) to interact
with ATGL, mainly on the LD-surface. This process is illustrated in Figure 16 and described
in detailed in the section describing the role of perilipin 1 (section 1.6.2).
Lipolysis is not limited to adipose tissue, it also occurs in other tissue like muscle, heart, and
liver. In accordance with this, the lipolytic enzyme ATGL has been demonstrated to be
expressed in human skeletal muscles, mainly in type I oxidative fibers (157). The coactivator
of ATGL, CGI-58, is found in various tissues like adipose tissue, muscles, liver, testis,
neurons and epidermis (152;158;159). It has been suggested that CGI-58 is the principal
regulator of the TAG-metabolism in human skeletal muscles (160). CGI-58 is expressed at
high levels in oxidative muscles, where it not only coactivates ATGL to increase the lipolytic
activity, but also seems to regulate skeletal muscle gene expression through controlling the
cellular levels of FAs acting as PPARδ ligands (160).
While perilipin 1 has a major role in lipolysis in adipose tissues, the other perilipin members
of the perilipin family are anticipated to regulate lipolysis in nonadipose tissues (152;158). An
example of this is the interaction of perilipin 5 with ATGL and CGI-58 in oxidative muscles,
which will be described in section 1.6.6.
1.6 Lipid droplet associated proteins Many proteins are associated with LDs. Proteomic studies have identified LD-associated
proteins that are involved in lipid metabolism and transport, intracellular trafficking,
signaling, chaperone function, RNA metabolism, and cytoskeletal organization (161-166).
The protein coat of the LD can vary between droplets within a cell, between metabolic
conditions, and between cell types (167;168). One of the most abundant protein family
coating LDs are the perilipin family (144;169), which will be further described in the next
sections (1.6.1-1.6.6). In addition to the perilipins, there are many other types of proteins on

Introduction
23
the LD surface, such as members of the cell death-inducing DFF45-like effector (CIDE)
family of proteins, putative methyltransferases METTL7A and METTL7B, and different
enzymes required for lipid metabolism (170). The proteins that coat LDs within a specific cell
type change during LD biogenesis and metabolic state (basal vs. lipogenic vs. lipolytic) (115).
1.6.1 Perilipins
Perilipin proteins are highly promising drug targets at the surface of LDs in mammalian
tissues, as novel mechanistic targets in the treatment of obesity and secondary associated
diseases. The perilipins (also known as the PAT-family, named after the three fist discovered
members Perilipin, ADRP and Tip-47), include five members; perilipin 1 (perilipin), perilipin
2 (ADRP/adipophilin), perilipin 3 (TIP47), perilipin 4 (S3-12) and perilipin 5
(LSDP5/OxPAT/MLDP). The proteins are encoded by the Plin 1-5 genes in mice, which
share a common underlying structural organization and are acknowledged to define a novel
gene family (171;172) (Table 1). The perilipin protein family is defined by primary sequence
similarity across species and a common ability to target LDs.
Being at the LD surface, the perilipins direct the access of other proteins like lipases to the
lipid esters in the core of the LD, suggesting a significant structural and/or regulatory role in
LD maintenance. All the perilipins probably regulate the interface between LDs and their
cellular environment (171).
Table 1: A unified nomenclature for the mammalian perilipin-related PAT-family (172).
Human Mouse
Approved HumanSymbol
Approved Name
Previous Aliases Entrez GeneID
Chr. Location
Entrez GeneID
Chr. Location
PLIN1 perilipin 1 perilipin, PERI, PLIN
5346 15q26 103968 7 D3
PLIN2 perilipin 2 ADRP, ADFP, adipophilin
123 9p22.1 11520 4 38.9 cM
PLIN3 perilipin 3 TIP47, PP17, M6PRBP1
10226 19p13.3 66905 17 D
PLIN4 perilipin 4 S3-12 729359 19p13.3 57435 17 D
PLIN5 perilipin 5 PAT1, LSDP5, OXPAT, MLDP
440503 19p13.3 66968 17 D

Introduction
24
The family of perilipins is evolutionarily ancient, as members are present in several animal
species. This conservation of the family indicates the relevance of its function in regulating
intracellular lipid stores (171). All perilipins share primary sequence homology (see Figure
15), especially in the N-termini, and they bind to intracellular LDs, either constitutively or in
response to metabolic stimuli increasing the flux of lipid in or out of LDs (167). The most
highly conserved sequence called the PAT-1 domain (named after Perilipin, Adrp and Tip47),
includes ~100 amino acids located at the N-terminus of the perilipin sequence and is
conserved between perilipin 1, perilipin 2, perilipin 3, and perilipin 5, but little conserved in
perilipin 4 (169). Evidence suggests this domain might assist targeting of perilipins to LDs
(173-175) and to be a site for interaction with lipases. Other domains shared by the perilipins
are the 11-mer repeats located in the center of the proteins, which is thought to have a
function in binding of the perilipins to LDs, and a hydrophobic cleft in the C-terminus with
unknown function. The perilipins share considerable protein sequence identity in the C-
terminus, except for perilipin 1 (176). Perilipin 2 and perilipin 3 has the greatest overall
sequence homology, followed by perilipin 5. Perilipin 1 and perilipin 4 are more diverge due
to their unique C- and N- termi, respectively (171).
Despite the sequence similarity and the common ability to bind to LDs, there are also
important differences between the perilipins implying that each member has a special cellular
function. The perilipins differ in tissue expression and transcriptional regulation, the affinity
for LDs, the size of the LDs they attach to, the type of lipid filling, and protein stability when
unbound to LDs (168;171). Most of the perilipins are transcriptionally regulated by PPARs,
reflecting their role in lipid metabolism (171).
On the LD surface the perilipins regulate ATGL-binding and TAG-hydrolysis by distinct
mechanisms. Because ATGL is expressed widely while the lipolytic activity differs among
tissues, the different perilipin composition of LDs in various tissues may account for the
tissue-specific regulation of lipolysis (177). A recent study by Hsideh et al (168) demonstrates
that the different perilipins sequester to LDs with either TAG or CE, a finding that underline
the theory that each perilipin have separate and possibly unique roles associated with their
specific LD-targeting. In tissues that predominantly accumulate TAG, such as adipose tissue,
heart, and oxidative muscles, the most abundant perilipins are perilipin 1(a and b) and
perilipin 5 which specifically target TAG-LDs. In tissues that accumulate CE, such as
steroidogenic cells, these perilipins are generally less expressed, while perilipin 1c and

Introduction
25
perilipin 4 show a relatively higher expression. It appears that some of the perilipins have the
ability to direct the type of accumulated lipids. Cells overexpressing Plin1 have a higher
content of TAG-LDs and reduced content of CE-LDs compared to control cells. The opposite
is true for cells overexpressing Plin4.
Figure 15: Schematic drawing of mouse perilipins. The locations of regions with considerable sequence identity among the family members (PAT-1 domain, 11mer α-helical repeats, hydrophobic cleft) are indicated. Modified from (171).
1.6.2 Perilipin 1
Perilipin 1 is the first identified member of the perilipin family. In mice, the single Plin1 gene
gives rise to at least four protein isoforms (perilipin 1 A, B C and D) that share a common N-
terminal region but have different C-terminal tails generated through alternative mRNA
splicing (178;179). Perilipin 1A is the largest protein and the most abundant protein on
adipocyte LDs (179;180). The protein was originally identified as the major adipocyte protein
phosphorylated in response to activation of protein kinase A (PKA) associated with the LD
(181). Perilipin 1B is a less abundant protein, and found close to the plasma membrane in
primary human adipocytes (178;182). Both isoforms (perilipin 1A and 1B) protect the
triacylglycerols in the LDs in adipocytes from degradation by adipocyte lipases by function as
inhibitors of lipolysis (183). Perilipin 1C and D are even shorter isoforms that are expressed
only in steroidogenic cells (179;184). Their roles are have not been investigated.
Importantly, a unique feature of the perilipin 1 sequence that is not shared by other members
of the protein family is the presence of multiple consensus sequences for the phosphorylation
of serine residues by cAMP-dependent protein kinase (PKA) (185). This makes it an

Introduction
26
important player in the control of lipolysis in adipocytes, where TAG stored within LDs is
catabolized into free fatty acids (FFA) and glycerol during times of nutrient scarcity.
The mobilization of TAG stores is tightly regulated by hormones, and requires the activation
of lipolytic enzymes, such as adipose triglyceride lipase (ATGL) and hormone-sensitive
lipase (HSL). Perilipin 1 serves a critical role in regulating basal and stimulated lipolysis by
co-coordinating the recruitment of proteins to the LD (169). There are two main signaling
pathways that control the breakdown of fat in adipocytes. The inhibitory insulin-signaling
pathway, where activation of protein kinase B (PKB) results in inhibition of cellular cAMP
production and inhibition of lipolysis, and the stimulating pathway where catecholamines and
their interaction with β-adrenergic receptors results in increased cellular cAMP levels and
activation of lipolysis. An alternative stimulating pathway is activation of guanylyl cyclase
with natriuretic peptides, which results in increased cellular cGMP levels and a following
activation of lipolysis (186).
The classical pathway, where perilipin 1 has a crucial role, starts with catecholamines and
their interaction with β-adrenergic receptors. β-adrenergic stimulation of the G-protein
coupled receptor activates adenylate cyclase which increases cellular cAMP levels (187).
cAMP binds and activates PKA, and perilipin 1 is phosphorylated by PKA at up to six serine
residues (Ser 81, 222, 276, 433, 492, and 517 of the mouse protein). The phosphorylation of
perilipin 1 is required for stimulation of ATGL and HSL activity but not for HSL
translocation (188). In the basal state, CGI-58 resides on the surface of LDs and interacts with
perilipin 1. ATGL is localized in part to the LD and HSL mostly in the cytoplasm, leading to
incomplete or absent activation of ATGL and HSL (154;189;190). Released fatty acids are
rapidly resynthesized back into TAG (futile cycling) or directed towards oxidation in
mitochondria, making the rate of rate of released FAs extremely low under these conditions.
After β-adrenergic stimulation PKA phosphorylates both HSL and perilipin 1. HSL
translocates to the LD, and perilipin 1 releases CGI-58, which disperses into the cytoplasm
within minutes, thereby permitting binding of CGI-58 with ATGL (154;158;163;190). ATGL
initiate lipolysis and the breakdown of TAG to DAG (see Figure 16). HSL associates with the
phosphorylated perilipin 1 and degrades DAG to MAG. The final FA is cleaved by MAG
lipase (MGL) to produce glycerol (191). Lipolysis is inhibited by the anabolic hormone
insulin which stimulates a phosphodiesterase that breaks down cAMP and dephosphorylates
perilipin (192;193).

Introduction
27
To summarize, the two opposing signaling pathways converge in the regulation of TAG
hydrolyzing enzymes and the control of FA reesterification to TAG, resulting in a several
hundredfold difference in the production of FAs and glycerol between the basal and
stimulated state (191).
Perilipin 1 is used as a marker of adipocyte differentiation as the expression is tightly
correlated to the expression and activation of PPAR-γ in these cells. The Plin1 promoter
contains one evolutionary conserved PPAR response element, which makes perilipin 1 a
direct PPARγ target gene (176).
Figure 16: The emerging view of regulated lipolysis. ATGL: Adipose triglyceride lipase. HSL: Hormone sensitive lipase. CGI-58: comparative gene identification protein 58. TAG: triacylglycerol. DAG: diacylglycerol. MAG: Monoacylglycerol. FA: Fatty acids. MGL: Monoacylglycerol lipase. PKA: Protein kinase A. cAMP: cyclic adenosine monophosphate. Modified from (191). See text for details.
1.6.3 Perilipin 2 (ADRP)
Perilipin 2 was originally identified as an RNA transcript significantly induced during
differentiation of cultured adipocytes (194;195). Later it was discovered that it coats small
LDs in a variety of cell lines, including early differentiating 3T3-L1 adipocytes. Perilipin 2 is
thus ubiquitously expressed (196), but not present in mature adipocytes where the perilipin 2
protein is replaced by perilipin 1 (196).
The mouse (197) and human (198) Plin2 genes contain PPAR response elements, and
perilipin 2 is regulated by PPARα (199-201). The protein is also regulated through post-

Introduction
28
translational degradation by the proteasomal system (202-204). The amount of lipids inside
the cell thereby directly affects the level of accumulated perilipin 2 proteins, by stabilizing it
and inhibit its degradation. Perilipin 2 knock-out mice have reduced amount of TAG in the
liver, while the differentiation of adipocytes and adipose lipolysis are unchanged (205). A
likely reason for the modest phenotypic change in the perilipin 2 knock-out mouse is that in
the absent of perilipin 2, perilipin 3 is directed to the LDs and likely substitutes for most of its
functions (206). When both perilipin 2 and perilipin 3 is knocked-out in cultured liver cells,
the LDs turn larger with a higher turnover of TAGs resulting in cellular insulin resistence
(207).
1.6.4 Perilipin 3 (Tip 47)
Perilipin 3, originally named tail-interacting protein of 47kD (TIP47) is ubiquitously
expressed with tissue specific enrichment in muscle and placenta (176;208;209). It only
seems to bind to LDs under specific metabolic conditions (when the level of FAs rise), but is
stable both as a soluble cytosolic protein and when associated with LDs (208-211).
Perilipin 3 was first described in a yeast two-hybrid screen for proteins that interact with the
cytoplasmic tail of the mannose 6-phosphate receptor (MPR) (212), but it is now classified as
a LD-associated protein (208). It was identified as a cargo selection device for MPRs,
directing their transport from endosomes to the trans-Golgi network (213), but recent
knockdown studies performed by Bulankina et al (214) showed no effect on MPR distribution
or trafficking and did not affect lysosomal enzyme sorting. Instead they found that perilipin 3
is recruited to LDs by an amino-terminal sequence comprising 11-mer repeats, and that it
reorganizes liposomes into small lipid discs. They also showed that suppression of perilipin 3
blocked maturation of LD and reduced the incorporation of TAG into LDs, and concluded
that it functions in the biogenesis of LDs (214).
Unlike the other perilipins, perilipin 3 does not seem to be regulated by PPARs (176;199).
1.6.5 Perilipin 4 (S3-12)
Perilipin 4 is mainly expressed in white adipose tissue ( WAT), but it is also weakly
expressed in brown adipose tissue, heart, and skeletal muscle (215). In fact, Gjelstad et al
(216) found that skeletal muscle, in addition to WAT, was among the tissues with the highest

Introduction
29
expression of perilipin 4, together with heart, placenta, testis and liver. Perilipin 4 was
originally identified as a plasma membrane-associated protein induced during adipocyte
differentiation, containing 29 tandem repeats of a 33-residue motif that is rich in threonine
and glycine (217). The Plin4 promoter contains three evolutionarily conserved PPAR
response elements, and the protein has been identified as a direct PPAR-γ target gene (176).
1.6.6 Perilipin 5 (LDSP 5)
Perilipin 5, originally named LSDP5 (lipid storage droplet protein 5) is the last member of the
perilipin protein family, and was discovered by our group and others (171;218;219). The
tissue distribution of perilipin 5 is limited to tissues with active fatty acid oxidation, such as
the heart, striated muscle, brown adipose tissue and liver (116;171). Several studies have
demonstrated that activation of PPARα induce expression of perilipin 5, suggesting an
important role for perilipin 5 in FA utilization and lipid metabolism (171;218;219).
In accordance with this theory, perilipin 5 has an essential part in regulating LD accumulation
(171;218-220) and LD hydrolysis (171). Perilipin 5 is a scaffolding protein for key lipolytic
players, such as ATGL (177;221), HSL (222), and CGI-58 (177;223). In addition, perilipin 5
has the distinctive property of recruiting mitochondria to the LD surface (220). Evidence of a
physical and metabolic link between LDs and mitochondria was first described in the work of
Wang et al (220), where they suggest that perilipin 5 regulates LD hydrolysis and controls
local FA flux to protect mitochondria against an FA surge. Their studies suggest that perilipin
5 has a substantial part in regulating LD hydrolysis in oxidative mammalian tissues and is a
putative key player in LD function in oxidative tissues. The signal for mitochondrial
interaction reside in the last 20 amino acids of its C-terminus (220), which is a domain unique
to Plin5 (171).
Perilipin 5 is the only perilipin found to bind directly to bind ATGL, which happens even in
the absence of binding of CGI-58 (177). Wang et al (177) later found that in liver cells,
perilipin 5 reduces the ATGL-activity if PKA is not activated. By inhibiting hydrolysis and
thus stabilizing the LD, perilipin 5 helps to accumulate palmitate into triglycerides and to
decrease palmitate utilization by the mitochondria in basal state. When PKA is activated,
perilipin 5 is phosphorylated through an unknown mechanism which in turn increases the
lipolysis, but only modestly. Others suggests that perilipin 5 recruits CGI-58 to the LD (223).
Perilipin 5 seems unable of binding ATGL and CGI-58 simultaneously.

Introduction
30
A recent study by Bosma et al (224) indicates that in order for perilipin 5 to facilitate lipolysis
and fatty acids oxidation, LDs and mitochondria need to interact. Overexpression of perilipin
5 increases FA oxidation in muscle homogenates possessing both LDs and mitochondria, but
not in isolated mitochondria, which suggests that perilipin 5 targets FAs from LDs towards
mitochondrial oxidation. Also, the overexpression of Plin5 led to more frequent and intimate
interaction of perilipin 5-coated LDs with mitochondria (224).
The current knowledge of perilipin 5 suggests it protects against cellular lipotoxicity in
oxidative cells with high energy demands by transiently entrapping bioactive lipids in LDs
close to mitochondria at times of increased cellular FA influx. Also, it may facilitate the
release of FA by LDs to the mitochondria in a PKA-regulated manner when LDs and
mitochondria are interacting with each other.
The transcriptional mechanisms regulating perilipin 5 expression is unstudied, but activation
of PPARα is know to stimulate its expression in several tissues (171;218;219).

Aims of the study
31
2 Aims of the study This work is a part of a project with the overall goal to investigate the gene regulation of
perilipin 5 and the importance of lipid droplets in oxidative muscles and the heart. Expression
of the Plin5 gene encoding perilipin 5 is limited to a few tissues, including heart, brown
adipose tissue, oxidative muscle and liver. The transcription factor machinery driving this
tissue-selective expression pattern is not clear. We and others have previously demonstrated
that expression of Plin5 is stimulated by activation of PPARα (171;218;219). We hypothesize
that transcription factors stimulating oxidative capacity play a key role in the regulation of
Plin5. In support of this hypothesis, we found recently that overexpression of PGC-1 α in
cultured muscle cells stimulated expression of the Plin5 gene. In this master thesis we wanted
to test different transcriptional factors known to stimulate oxidative capacity for their ability
to induce expression of the Plin5 gene.
2.1 Objectives 1. Identify transcription factors able to stimulate expression of Plin5 in cultured muscle
cells. Preliminary data suggest that expression of PGC1α stimulates Plin5 expression.
We want to determine if this coactivator and other transcriptional factors known to
stimulate fatty acid oxidation are important for the regulation of Plin5.
a. Test the ability of the transcription factors PPARs, PGC1s, and ERRs to induce
transcription of the Plin5 gene.
b. Map the DNA binding site in the Plin5 gene.
2.2 Hypothesis Plin5 expression is induced by the transcription factors PPARs, PGC1s and ERRs. The Plin5
gene promoter contains binding sites for the above transcription factors.

Aims of the study
32

Materials
33
3 Materials
3.1 Equipment and chemicals Product Manufacturer
ABI Prism® Optical Adhesive sealing ABI
ABI Prism® 96-Well Optical Reaction Plate ABI
Aluminum Foil Caterwrap™
Ampicillin Sigma®
Bovine serum albumin BSA Sigma® #A8806
BRL-49656/Rosiglitazone Enzo Life Sciences
LB-dishes Heger AS
Coulter Clenz cleaning agent Beckman Coulter™
Culture plates, 6-, 12-, and 24-well Falcon®
Culture flasks, 25, 75, and 150 cm2 BD Falcon™
Dulbecco’s Modified Eagle’s Medium (DMEM) Sigma®
EDTA Sigma®
Electroporation cuvette BioRad
Eppendorf Tubes Axygen Scientific
Ethanol Arcus
Falcon tubes Falcon
Fetal Bovine Serum FBS Gibco
GW-501516 Enzo Life Sciences
Sterile filtrate filter and bottle Corning Inc.
HEPES Sigma®
Horse Serum Gibco
Isopropanol Arcus
Isoton II Beckman Coulter™
L-Glutamine Sigma®
Latex Gloves, SensiClean® Ansell
Lipofectamine™ 2000 Life Technologies Corporation
Nucleic Acid Purification Elution Solution ABI
OptiMEM-I® Life Technologies Corporation

Materials
34
Oleic acid Sigma®
Passive Lysis Buffer Promega
Penicillin Streptomycin Sigma®
PBS, Magnesium and Calcium free Sigma®
PCR-water Fluka
PfuTurbo® DNA Polymerase Stratagene
Pipettes Eppendorf
Pipetteboy Integra Bioscences
Pipette-tips Biotix, Inc.
RNase free water Sigma®
Trypsine Sigma®
WY-14643 Sigma, #C7081
3.2 Instruments Product Manufacturer
6100 Nucleid Acid PrepStation ABI
7900HT Fast Real-Time PCR System ABI
Centrifuge Labofuge 400e Heraeus Instruments
Centrifuge Pico 17 Thermo Scientific
Centrifuge Avanti J-26 XP Beckman Coulter
Coulter Counter® Z1™ Beckman Coulter
Freezer, -20ºC Electrolux
Freezer, -80ºC Forma Scientific
GeneAmp® PCR System 9700 ABI
Ice-machine, AF80 Scotsman®
Incubator-shaker New Brunswick Scientific
Waterbath M12 LAUDA
Micro-wave oven, Talent Whirlpool
Microscope Leica
MilliQ-synthesis Millipore
NanoDrop® ND-1000 Spectrophotometer Saveen Werner AB
Pipetteboy Comfort Integra Biosciences

Materials
35
Refrigerator Electrolux
Synergy2 BioTek
Vortexer Scientific Industries, Inc.
3.3 Kits Product Manufacturer
Dual Luciferase Reporter Assay™ Promega
High Capacity cDNA Transcription Kit ABI
JETSTAR 2.0 Plasmid Midiprep kit / 20 Genomed
Plasmid DNA Purification NucleoSpin® Plasmid
(NoLid)
MACHEREY-NAGEL
TaqMan® Universal PCR Master Mix ABI
TaqMan®Gene Expression Assay ABI
Isolation of total RNA ABI
QuikChange® II Site-Directed Mutagenesis Kit Stratagene
3.4 Software and internet resources Product Manufacturer
Adobe Illustrator CS5.1 Adobe Inc.
Adobe Photoshop CS5.1 Adobe Inc
GraphPad InStat GraphPad Software, Inc
Microsoft Office 2007 Microsoft® Incorporated
PubMed National Library of Medicine
Reference Manager 12 ISI ResearchSoft
RQ Manager ABI
SDS Software 2.3 ABI
SPSS 18 SPSS Incorporated

Materials
36
3.5 Cell-lines, plasmids and vectors Product Manufacturer
C2C12, mus musculus, mouse myoblast ATCC #CRL-1772
DH5α™ E.Coli competent cells Life Technologies Corporation #18258-
012
DH10β™ E.Coli competent cells Life Technologies Corporation
pcDNA3 Life Technologies Corporation
pcDNA3-mERRα Cloned by Knut Tomas Dalen
pcDNA3-mERRβ Cloned by Knut Tomas Dalen
pcDNA3-mERRγ Cloned by Knut Tomas Dalen
pcDNA3-mPPARα Cloned by Knut Tomas Dalen
pcDNA3-mPGC1α Cloned by Knut Tomas Dalen
pcDNA3-mPGC1β Cloned by Knut Tomas Dalen
pcDNA3-mPPARγ1 Cloned by Knut Tomas Dalen
pcDNA3-mPPARγ2 Cloned by Knut Tomas Dalen
pcDNA3-mPPARδ Cloned by Knut Tomas Dalen
pcDNA3-mRXRα Cloned by Knut Tomas Dalen
pGL3-Basic-LUC reporter vector Promega
pGL3-Basic-Plin5-LUC Cloned by Knut Tomas Dalen

Methods
37
4 Methods A number of different molecular methods were used to conduct these studies. These include
transformation, plasmid isolation, PCR, cell culturing, transfection, RNA isolation, cDNA
synthesis and quantitative real time PCR.
A mouse cell line able to differentiate into glycolytic muscle fibers (C2C12) was used as a
model system. These cultures were differentiated in vitro for 4-6 days to form multinuclear
contracting myotubes that were used in the experiments. Because Plin5 only is expressed in
oxidative and not glycolytic muscle cells, and the standard culturing conditions make the cells
utilize glucose as energy source, Plin5 will normally not be expressed in the cultured C2C12
cells. This makes it possible to use this cell-line to identify factors that increase expression of
Plin5. The same factors might drive conversion of glycolytic into oxidative muscle fibres.
4.1 Transformation In nature, bacteria can exchange DNA with each other to ease adaptations towards different
environments. The DNA they exchange is small circular DNA copies called plasmids. In
molecular biology we can use this technique, called transformation, to make more of a certain
plasmid we need for experiments. Transformation is more accurately defined as “the genetic
alteration of a cell resulting from the direct uptake, incorporation and expression of
exogenous genetic material (exogenous DNA) from its surroundings and taken up through the
cell membrane(s)” (225). In other words, introducing foreign DNA into a cell (E.coli
bacteria), which then replicates this DNA along with its own genomic DNA. Most plasmids
used in laboratories carry an antibiotic resistance gene to facilitate selection of the bacteria
containing the DNA of interest. Two methods are commonly used to transform E. coli cells
with plasmid DNA in the laboratory - heat shock transformation and electroporation. For both
methods, the bacteria must be specially pre-treated to facilitate efficient uptake of the plasmid.
Bacteria that have the ability to take up extracellular DNA from its environment is called
competent. Competent E.coli cells had already been generated and were stored at -80°C in the
laboratory.

Methods
38
Figure 17: Transformation of E.coli cells. 1: A DNA fragment can be inserted into a vector (cloning) to get the insert expressed from the vector. The resulting plasmid is called a recombinant plasmid. The plasmid also carries an antibiotic resistance gene. 2: E.coli cells are mixed with plasmids and cultured on nutrient agar containing antibiotics. 3: E.coli cells that do not take up the plasmid die on antibiotic plates. 4: Transformed E.coli cells survive on antibiotic plates. 5: Ultimately the transformed cells multiply and form colonies. Most plasmids used in laboratories are multiplied into several hundred copies whitin each bacteria.
4.1.1 Heat shock transformation of DH5α E.coli
The protocol of heat-shock transformation method is based on Hanahan’s protocol from 1983
(226), which still is one of the best transformation methods available. This method was
worked out from a series of attempts to get maximum transformation efficiency, after the first
demonstration of Ca2+-dependent DNA transfer into E.coli in 1972 (227). The heat shock
transformation technique is well suited for circular plasmid DNA, and was in this master
thesis used to amplify all plasmids containing the different transcription factors used in the
transfection experiments (pcDNA3-vectors).
Experimental procedure:
Competent cells were thawed on wet-ice. 30-50 µl competent cells were used for each
transformation, and 10-50 ng DNA was added to the cells and mixed gently before incubation
on ice for 30 minutes. The cells were transferred to 42°C waterbath for 90 seconds, and then
back on ice for 2 minutes. 450 µl of LB-medium was added, and the cells were then incubated
at 37°C for ~ 1 hour. Afterwards 50 µl cells were plated on LB-plates containing ampicillin
(100 µg/ml), to allow for selective growth of transformed bacteria containing ampicillin
resistant vectors, and incubated at 37°C over night.
The next day individual bacteria colonies were picked from the LB-plates and transferred to a
flask with LB-medium containing ampicillin for preparation of plasmids (see section 4.2 ).

Methods
39
4.1.2 Electroporation of E. Coli strains
The electroporation method was developed early in the 1980s (228), and was first described
for E.coli in 1988 (229). This is now an established method for transformation of bacteria and
is used to introduce DNA into baceteria by a brief high voltage electric discharge to render
cells permeable to DNA (230). Electroporation has higher transformation efficenency than
heat shock, and is the preferred method to use for transformation of low quantitites of DNA or
large DNA constructs (>20 kb). This transformation method was used in this master thesis to
transform the PCR products generated by site directed mutagenesis in the process where the
PPRE in the Plin5-LUC reporter vector was mutated.
Experimental procedure:
Prior to electroporation, electroporation cuvettes (0.2 cM gap) were cooled in ice-water slurry
for > 30 minutes. 50 µl bacteria suspension was pipetted to the pre-cooled electroporation
cuvette. Then 0.1-10 µg DNA was added and mixed gently into the bacteria suspension, and
the cuvette was incubated on ice for 1 minute. Electroporation was performed with a
GenePulser electrophorator (Biorad) with the following condition: 1.8 kV, 25 µF with pulse
controller set at 200 Ω. Time constant after electroporation should be ~ 4.2 - 4.6 with these
settings. Immediately after electroporation, 1.0 ml SOC was added to the cuvette by pipetting
gently up and down a few times. Afterwards the bacteria was transferred to a 15 ml tube and
incubated at 37°C for 1-2 hours. Cells were plated on LB-plates containing antibiotics (100
µg/ml ampicillin).
4.2 Plasmid isolation Bacteria can be used as factories to amplify a plasmid. After the plasmid is transformed into
the bacteria, the bacteria will multiply the plasmid along with its own genomic DNA when it
multiplies. By expanding a low number of bacteria in an over-night culture, a large number of
plasmids can be isolated from the bacteria. An often used method to isolate DNA plasmids
from bacteria is anion-columns. The midi-prep JetStar kit was used for large scale isolation of
plasmids used for transfection. The NucleoSpin® Plasmid (NoLid) kit (referred to as “mini-
prep”) was used to isolate small quantities of plasmid used to screen mutated clones. See
Appendix A protocol #1 and 2 respectively. The plasmids were stored at -20°C.

Methods
40
Over night culture and harvesting
Plasmid-containing bacterial colonies (4-10 for midi-prep, 1 for mini-prep) were transferred
into LB-medium (50 ml for midi-prep, 5 ml for mini-prep) containing 100 µg/ml ampicillin.
The LB-plates with the plasmids were stored at 4°C. Bacteria were grown overnight at 37 °C
with shaking (200 rpm). The next morning, bacteria were centrifuged at 6000 g for 5 minutes
to pellet the E.coli cells, and the supernatant discarded.
Midi-prep
Column equilibration
10 ml solution E4 was applied to the columns that were emptied by gravity flow.
Lysis of bacterial cells
Each bacterial pellet was resuspended in 4 ml cold solution E1. 4 ml of solution E2 was then
added, and the solution mixed gently and then incubated at room temperature for 5 minutes.
To stop lysis, 4 ml solution E3 was added and the solution was immediately, but gently mixed
until the solution was mixed.
Purification of plasmid DNA
The solution was centrifuged at 15.000 g for 10 minutes at 20°C, and the supernatant was
applied to the columns and allowed to enter the resin by gravity flow. The columns were then
washed twice with 10 ml solution E5, to remove unpurities from the filters, before the
plasmid was eluted with 5 ml solution E6. The plasmid was precipitated with 0.7 volumes of
isopropanol (3.5 ml) at room temperature, and centrifuged immediately at 15.000g for 30
minutes at 4°C. The supernatant was removed carefully without disturbing the plasmid pellet.
The plasmid pellet was washed twice with 1 ml 70 % ethanol and transferred to an eppendorf
tube and centrifuged at 12.000g for 2 minutes. The supernatant was removed, and the pellet
air dried in room temperature for approximately 5 minutes to let ethanol evaporate. Finally,
the plasmid pellet was dissolved in 100-150 µl Tris-EDTA (TE)-buffer.

Methods
41
Mini-prep
Lysis of bacterial cells
The bacterial pellet was resuspended in 250 µl solution A1, and 250 µl of solution A2 was
then added to the solution. This was mixed gently and incubated at room temperature for 5
minutes, before adding 300 ml solution A3 and mixing immediately.
Purification of plasmid DNA
The solutions were centrifuged at 11.000 g for 5 minutes at RT. Then the supernatant was
added to a NucleoSpin® Plasmid Column placed in a Collection Tube (2 ml), and centrifuged
at 11.000 g for 1 minute, for binding of the plasmid to the column filter. The flow-through
was discarded, and the NucleoSpin® Plasmid Column was placed back into the Collection
Tube. The column was washed by adding 600 µl buffer A4, and centrifuged at 11.000 g for 1
minute. The flow-through was discarded, and the NucleoSpin® Plasmid Column was placed
back into the empty collection tube. The column (in the collection tube) was then centrifuged
at 11.000 g for 2 minutes to dry the silica membrane. This step was repeated once. The
collection tube was then discarded, and the NucleoSpin® Plasmid Column was placed in a 1.5
ml microcentrifuge tube. To elute the plasmid, 50 µl TE-buffer was added and the column
was incubated for 1 minute at RT, and then centrifuged at 11.000 g for 1 minute.
4.3 PCR mutagenesis Polymerase Chain Reaction (PCR) is a method used to amplify segments of DNA, using the
ability of DNA polymerase. DNA polymerase needs a primer to start attaching nucleotides (it
can only add a nucleotide onto a preexisting 3’-OH group). The primers are short pieces of
single-stranded DNA that are complementary to the target sequence. Because of this need for
a primer, it is possible to amplify a desired region of a template sequence (Figure 18). The
principles in PCR technology can also be used to generate mutations in target DNA
sequences. PCR based site-directed mutagenesis can generate mutations (base substitutions,
insertions, and deletions) in double-stranded plasmids.
The protocol used in this master thesis is modified from a Stratagene protocol; The
QuikChange II site-directed mutagenesis method (Appendix A protocol #3).The method is

Methods
42
performed using PfuUltra DNA polymerase for mutagenic primer-directed replication of both
plasmid strands with the highest fidelity. The process includes several steps, starting with
denaturing and thus separating a supercoiled double stranded target-DNA with an insert of
interest into single strands through heating. Next step is cooling the DNA-strands in the
presence of a large excess of two 100% complementary oligonucleotide primers, both
containing the desired mutation (Figure 19). The primers, each almost complementary to
opposite strands of the target DNA, then anneal to the single-stranded DNA. To initiate the
synthesis of two new strands complementary to the original DNA chains, DNA polymerase
(PfuUltra HF DNA polymerase) and deoxyribonucleoside triphosphates (dNTPs) are added to
the mixture. The polymerase adds nucleotides to the 3’-hydroxyl end of the primer, extending
the strand across the target DNA by making complementary copies of the target sequence.
Extension of the oligonucleotide primers generates a mutated plasmid containing staggered
nicks. Two new double-stranded DNA molecules can now be denatured and copied by
repeating the procedure using the original starting vector as template. Typically 20 reactions
is enough to get enough produced mutated vector. The template (wild type) plasmid is dam
methylated in almost all E. coli strain and is removed following temperature cycling by
digestion with Dpn I endonuclease. The Dpn I endonuclease (target sequence: 5´-Gm6ATC-
3´) is specific for methylated and hemimethylated DNA and is used to digest the parental
DNA template to simplify selection of mutation-containing synthesized DNA. The mutated
plasmid remains intact in the reaction, and this nicked vector DNA is then transformed into
DH10β supercompetent cells.
Table 2: Steps in PCR-reaction.
Denaturation Heating of DNA (and primers) to separate it into separate strands. Annealing Primers bind to the single-stranded DNA through cooling. Elongation DNA polymerase synthesizes new DNA strands complementary to
the template.

Methods
43
Figure 18: Steps in a normal PCR-reaction. Modified from (231).
Figure 19: Overview of the QuikChange II site-directed mutagenesis method. Modified from (232).

Methods
44
PCR mutagenesis:
The DR-1 element in the pGL3-basic-Plin5 vector was mutated from the wild-type (Wt) sequence to mutated (Mut) using the oligos shown below as following:
Table 3: Oligos used in PCR mutagenesis of the mouse Plin5 reporter.
Oligo name Sequence Wt sequence (fw) AGCAGGTGGCAGGACCCTTGGCCCAGTGGGCCCGG Plin5-PPRE-Mut-fw AGCAGGTGGCAGGAGGCTTGGGGCAGTGGGCCCGG Plin5-PPRE-Mut-rev CCGGGCCCACTGCCCCAAGCCTCCTGCCACCTGCT
The mutation oligos were diluted to 10 pmol/µl, and the targeting vector to 10 ng/µl. 1 or 5 µl
template (vector containing promoter) was added in the first two PCR tubes, respectively, and
water was then added to the final volume of 5 µl in all three tubes (4, 0 and 5 ul). The third
tube functioned as a negative control. 1.5 µl primers (10 pmol/µl each of forward and reverse
mutation oligos) were added to each tube. A mixture of the components in Table 4 was made,
giving 50 ul reaction volume for each sample.
Table 4: PCR mutagenesis mixture.
Volume Component Volume x 3 31 µl dH2O 93 µl 5 µl 10x Pfu buffer (contains MgCl2) 15 µl 5 µl dNTP-mix (2 mM of each dNTP) 15 µl 1µl PfuTurbo 2.5 U/µl 3 µl
3 µl PfuTurbo was added as the last component to the mixture (otherwise the enzyme might
degrade template or primers). The mixture was mixed well, and 42 µl was pipetted to each
reaction tube. The PCR reaction (Table 5) was started as soon as possible after mixing of all
reagents. Step 2-4 was repeated 22 times.
Table 5: PCR settings for site-directed mutagenesis.
Step # Time Temperature 1 2 minutes 95 °C 2 45 sec 95 °C 3 45 sec 55-60 °C 4 X minutes 68 °C 5 10 minutes 72 °C

Methods
45
Analysis of PCR reaction
Following the PCR reaction, 5 µl PCR reaction was mixed with 5 µl dH2O and 2 µl 6x
loading buffer and separated on a small 0.5 % agarose 0.5 % Tris-borate-EDTA (TBE) gel (a
thin comb was used). 1 kb Plus DNA ladder was used as molecular weight standard.
(Standard was made by mixing 1 µl ladder with 9 µl dH2O and 2 µl loading buffer). The gel
was run at 80 V for 1.5-2 hours. A clear band of the expected molecular weight (~ 7.5 kb) was
seen, confirming that the vector had been copied.
Selection, transformation and verification of mutated plasmids
25 µl of the PCR mixture was mixed with 0.5 µl DpnI (10 U/µl and incubated at 37°C for 1
hour to digest the template vector. 2 µl of the DpnI treated samples was electroporated into
super-competent cells (DH10β) and seeded on ampicilin (100 µg/ml) agar plates. Five
independent colonies were picked for plasmid isolation to screen for a correct clone (method,
see section 4.2). All clones were tested by sequencing at the ABI-lab at University of Oslo
(Blindern), and three clones were found to be correct. One of these was selected for further
analysis.
4.4 Measuring of DNA and RNA concentration on NanoDrop-1000
The concentration of DNA or RNA in solutions was measured using NanoDrop-1000. First,
the reader was washed with MQ water. Then 1.5 μl of RNAse free water was put directly onto
the bottom pedestal to initialize apparatus. The sample type was adjusted to “RNA-40”, for
changing the factor used for calculation of RNA concentration based on the measured
absorbance. For measuring DNA the sample type was adjusted to “DNA-50”. To reset
background for all wavelengths (calibrate), 1.5 μl TE-buffer (for measuring plasmid-DNA) or
1.5 μl Nucleic Acid Purification Elution Solution (ABI) (for measuring isolated RNA), was
applied on the NanoDrop pedestal, and measured as “Blank”. The sample was mixed
thoroughly to get a homogeneous sample, and 1.5 μl of each sample was used for
measurement.

Methods
46
RNA purity is indicated by the ratio of absorption between 260 and 280 nm. A ratio below 2.0
for RNA indicates proteins and/or phenols to be present. The ratio of isolated RNA from the
C2C12 cells were ~2.1 for all the experiments performed.
4.5 Cell culturing Cell culturing is a process where cells are grown in a sterile environment without external
influences. As an extra precaution they are also most often grown in medium containing
antibiotic to minimize the risk of bacterial growth. When working with the cells, they are
kept in a sterile cell culture hood, and all equipment being used should also be sterile.
4.5.1 Counting of cells
Cells were counted using Coulter Counter ® Z1™. Cells were trypsinated and centrifuged
prior to counting. 10 ml Isoton II solution was added in two clean counting flasks, and 100 µl
or 200 µl cells were pipetted to the two flask. To prepare the counter, the flask with Coulter
Clenz Cleaning Agent was exchanged with a new flask containing Isoton II, before flushing
the apparatus. The counter was then set to measure cells between 7 and 20 µm. Samples were
mixed gently to get a homogeneous solution before counting. The number of cells counted by
the apparatus is the number of cells in 0.5 ml. To determine the number of cells per ml in the
original sample, the following calculations were performed:
100 μl cell sample = “count from machine” x 200 cells.
200 μl cell sample = “count from machine” x 100 cells.
The average was used to determine the cell concentration (cells/ml).
After measurements, the apparatus was flushed with Isoton II, and the flask containing
Coulter Clenz Cleaning Agent was put back before turning the machine off.
4.5.2 Culturing of C2C12 cells
The cultured C2C12 cell line (ATCC #CRL-1772) resembles glycolytic fast twitch, “white”
muscle cells. The cells originally derived from satellite cells isolated from a crush injured
thigh muscle of a two month old female mouse donor, and have the ability to proliferate and
differentiate into myogenic colonies under appropriate conditions. They proliferate as

Methods
47
mononucleated cells with a generation time of 24h (233). In regular growth medium they
grow as undifferentiated myoblasts, while switching to differentiation medium when reaching
confluence start myogenic differentiation.
Culturing of frozen cells
Cells frozen in liquid nitrogen was thawed, resuspended in 20 ml pre-warmed (37 ºC) growth
media, and incubated at 37ºC until cells were attached to the culture flask (~5-6 h, or until
next day). Then media was exchanged to remove DMSO.
Passage of cells (P-x)
Before the cells grew confluent they were trypsinated. Medium was removed, and the cells
washed quickly with 2 ml trypsin (75 cm2 culture flask). The fluid was removed, and 3 ml
trypsin/EDTA was added. The flask was incubated at 37°C for 1-2 minutes until the cells
were almost detached. To detach the rest of the cells the flask was knocked gently to the
wrist. 7 ml growth media was added, and the solution was centrifuged for 3 minutes at 1300
rpm. The supernatant was removed, and the cells resuspended in 10 ml growth media. The
cells were splitted 1:5-1:15 in growth media.
Seeding and differentiation of cells to myotubes
C2C12 cells were seeded at 6 x 10⁴ cells/well in 1 ml medium (12 well dish) or 3 x 10⁴
cells/well in 0.5 ml medium (24 well dish). Differentiation was started the next day by
changing to differentiation-media (2 % HS). The cells were differentiated for 4-7 days, and
medium changed each 3rd day. For transfection experiments, cells were seeded in antibiotic
free medium and transfected ~24 hours later. Cells were given differentiation medium at
transfection, and given fresh differentiation medium 6 hours later.
Media used
Basal media
Powdered DMEM (Sigma®, #5648) containing high glucose and L-Glutamine were solved in
980 ml MQ water. 20 ml sterile Stock mix was added and the solution sterile filtrated into 2 x
500 ml bottles. Media were stored at 4ºC until use.

Methods
48
Stock mix (50x)
The following were mixed to generate 200 ml (50 x stock):
HEPES (Sigma; #H4043): 5.958 g/L x (200 ml / 20 ml/L) = 59.58 g NaHCO3: 1.5 g/L x (200 ml / 20 ml/L) = 15 g Sodium pyruvat: 0.11 g/L x (200 ml / 20 ml/L) = 1.1 g
The solution was heated to 37º C and pH adjusted to 7.4. Then the solution was sterile
filtrated and aliquoted in 10 ml tubes.
Culture media
Basal media was supplemented with 20% Fetal Bovine Serum (Gibco #26140-079), 1 % P/S
and 1% L-Gln (Sigma #G7513, 100x stock).
Differentiation media
Basal media was supplemented with 2 % horse serum (Gibco #16050-122), 1 % P/S and 1%
L-Gln (Sigma #G7513, 100x stock).
4.6 Transfection of cells Similar to transformation of bacteria, it is possible to get eukaryotic cells to take up foreign
DNA. This process is called transfection. Several transfection methods exist, such as calcium-
phosphate transfection, lipid-based transfection, electroporation systems, and micro-injection
of DNA. The most effective regarding delivery combined with lowest toxicity is lipid-based
methods in which specially designed lipids are mixed with the DNA to make the cell absorb
the lipid-DNA complex. In this thesis a lipid-based method was used, with
Lipofectamine™2000 (Appendix A protocol #5) as the transfection reagent.
Lipofectamine™2000 contains lipid subunits that can form liposomes in an aqueous
environment. The plasmid to be transfected is entrapped inside the liposomes. The lipids have
a positively charged head-group, and one or two hydrocarbon chains. The cell membrane is
negatively charged, and thus attracts the positive lipid-head, making a fusion between the two
components. The transfection complex (the liposomes with the plasmid) is probably entering
the cell through endocytosis (Figure 20). Inside the cell, the complex diffuse through the

Methods
49
cytoplasm to the nucleus where the genetic codes in the the transfected DNA can be
transcribed and translated into functional gene products (234). .
Figure 20: Lipid-mediated transfection. Modified from (235).
4.6.1 Transfection of C2C12 cells
C2C12 cells were trypsinated and seeded at 6 x 10⁴ cells/well (12-well plate) in antibiotic free
growth medium (20 % FCS ÷PS). The next morning the growth medium was removed from
the cells, and 1 ml antibiotic free differentiation medium (2 % HS medium) was added. 2 µg
DNA was mixed with 100 µl Opti-MEM I. 4 µl Lipofectamine2000 reagent was mixed with
100 µl Opti-MEM I and incubated for 5 minutes at room temperature. The diluted DNA and
the diluted Lipofectamine2000 reagent were combined and mixed gently, and incubated for
20 minutes at room temperature. The DNA- Lipofectamine2000 transfection mix was spread
above the cells (200 µl for each well), the plate was mixed gently, and then placed in the
incubator. After 6 hours, the medium was replaced with differentiation medium (2% horse
serum) containing antibiotics. For other plate-sizes see Table 6 for settings.
Adding of ligands
Cells were cultured in the presence of activators of PPARs (synthetic agonists and FAs) to
determine how these agents alone or in combination altered the expression of Plin5. In all
experiments, ligands were added 24 hours prior to harvesting.

Methods
50
Table 6: Transfection settings.
Dish size (# wells)
Cells (each well)
Medium (each well)
DNA (µg)
Lipofectamine 2000 (µl)
OptiMem (µl)
6 12⋅104 2 ml 4 8 200 12 6⋅104 1 ml 2 4 100 24 3⋅104 0.5 ml 1 2 50 96
(reporter) 5⋅103 75 µl Rv: 100 ng
Ic: 10 ng Ex.p: 2x 20 ng Total: 170 ng
0.5
10
Rv: reporter vector. Ic: internal control. Ex.p: Expression plasmid.
4.7 Dual Luciferase measurement The enzyme Firefly (Photinus pyralis) luciferase catalyzes a two-step chemical reaction where
the substrate luciferin and adenosine triphosphate (ATP) generates luciferyl adenylate, which
together with oxygen results in oxyluciferin, adenosine diphosphate (ADP) and most
importantly in this context – light emission (Figure 21). This principle is taken advantage of
in biological research, where cells can be transfected with a construct containing the Firefly
luciferase gene under the control of a promoter of interest. The amount of Luciferace
produced and the measured light emitted will depend on the activity of the promoter, where
changes in the luciferase activity is correleated with transcriptional activity of the promoter of
interest.
Figure 21: Firefly luciferase reaction and Renilla luciferase reaction. Adopted from Promega (Appendix A, Protocol #6).
Dual Luciferase measurement refers to the simultaneously expression of two luciferase
enzymes in each cell sample – the main reporter Firefly and the co-reporter Renilla (Renilla
reniformis) (Figure 22). The Renilla luciferase signal is used as an internal control to correct
for experimental variance among samples (236). The use of Renilla as an internal control

Methods
51
depends on that expression of the Renilla luciferase is unaffected with the treatments used in
the experiment. This must be experimentally determined for each cell line and experimental
settings.
Figure 22: Dual luciferase principle. Adopted from Promega (Appendix A, Protocol #6).
The Dual-Luciferase® Reporter Assay System (Promega) was used in this thesis (see
Appendix A Protocol #6). The assay provides a fast and accurate method to determine the
activity of the promoter of interest. To measure the luciferase reporter activity, Luciferase
Assay Reagent II (LAR II) is added to the wells (by the Synergy2 machine) to generate a
“glow-type” luminescent signal to measure the Firefly luciferase reporter. After measuring the
Firefly luciferase reporter activity in all wells, the reaction is quenced by adding the Stop &
Glo® Reagent. At the same time the Renilla luciferase reaction is initiated, and its reporter
activity is measured.
Table 7: Reagents used for dual Luciferase measurement on Synergy 2.
Reagent LARII Stop&Glo Lysis (PLB) Volume (µl/well) 50 50 20 Extra volume 3 ml 3 ml + 10 %
Experimental procedure:
C2C12 cells were seeded in a 96-well plate and transfected, grown for 3 days, and ligands
were added an additional 24 hours prior to harvesting. Cells were washed with 80 µl PBS, and
lysed with 20 µl Passive Lysis Buffer (PLB). The culture plate was shaked for 15 minutes in
room temperature to ensure efficient lysing of cells. Luciferase assay buffer II (LAR II) and
Stop&Glo buffer was thawed, and mixed with Luciferase assay substrate and 50x Stop&Glo

Methods
52
substrate, respectively. Measurements were performed at the Synergy 2 machine (BioTek)
with the Gen5 software and reagents as described in Table 7. Pumps and connectors were
washed with ethanol and MilliQ before and after use.
4.8 Total RNA isolation of C12C12 cells To be able to quantify changes in RNA levels in the C2C12 cells after transfection or
stimulations, the RNA first have to be isolated. This is a critical step in many molecular
biology experiments, including quantitative Real-Time PCR (qRT-PCR), as the RNA must be
pure, intact and of high quality.
C2C12 cells differentiated into myotubes were harvested, and cells were lysed with 500 μl 1x
Lysis buffer (2x Nucleic Acid Purification Lysis Solution mixed 1:1 with calcium and
magnesium free PBS) per well (12-well plate). This buffer lyses the cells without physical
disruption or enzymatic digestion, and it inactivates cellular RNases and separates the total
RNA from genomic DNA and other cellular fragments. The RNA from the cell samples was
isolated using the AB 6100 machine and the preprogrammed “RNA Cell” method described
in Appendix A, protocol #4. The instrument was set up with a splashguard in the waste
compartment, a 96-well archive plate in the collection compartment, and a Total RNA
Purification tray in the carriage. The “RNA Cell” method was run as described in the
protocol, except that cells were pre-wet with 80 μl Wash buffer I. After elution, the RNA was
immediately put on ice to ensure minimal degradation. Each sample was mixed to make a
homogenous RNA solution by pipetting up and down with a ~100 µl pipette prior to
measurement of the RNA consentration.
4.9 cDNA synthesis by reverse transcription After isolation of total RNA from the C2C12 cells, the next step before qRT-PCR is to
convert this RNA to complementary DNA (cDNA). The total RNA was reverse transcribed
into single stranded cDNA using High-Capacity cDNA Reverse Transcription kit (ABI).
Experimental procedure:
Multi-scribe enzyme was placed in mini-cooler (-20 ºC). RNA samples and the other reverse
transcription (RT) Master Mix (M-Mix) components were thawed on ice. Total RNA samples

Methods
53
(250-600 ng) were diluted to 10 µl total volume using PCR water. The 2x RT master-mix
(recipe for one well/reaction) was prepared as following:
Table 8: Reagents used in each cDNA sample.
Reagent Volume (µl) RNase free H2O 4.2 10X RT-buffer 2 10X Random Primers 2 dNTP 0.8 Multiscribe™ RT enzyme 1 Total volume 10
10 µl master-Mix and 10 µl total RNA solutions were pipetted to each well (gives a total of
20 µl reaction volume). To control for DNA contaminants (RNA quality), a negative cDNA
reaction was prepared. This contained 10 µl RNA solution from a pooled sample consisting of
4 µl from each quadruplicate, and all the reagents except for the Multiscribe RT enzyme. In
addition a control sample contaning 10 µl PCR-water instead of RNA solution was made to
verify that the master-Mix was not contaminated with RNA. After pipetting, plates were
sealed with strips, vortexed, and spun down. cDNA synthesis was run on a regular PCR
machine using the settings below (Table 9).
Table 9: cDNA run setup.
Reaction Time Temperature Annealing 10 min 25ºC Reverse Transcription 120 min 37ºC Enzyme inactivation 5 sec 95ºC
After cDNA synthesis, each cDNA reaction was diluted 5 times with water to get a larger volume to pipette during setup of the qRT-PCR assay. Samples were stored at -20ºC.
4.10 Quantitative Real-Time PCR (qRT-PCR) The next step was to quantify the amount of different genes such as Plin5. With all RNAs
copied into cDNAs, an indirect measurement of mRNA levels in the cells could be performed.
Quantitative Real-Time PCR (qRT-PCR) is a technique based on PCR, used to amplify and at
the same time quantify a targeted DNA molecule. In this project TaqMan® Gene Expression
Assays were used (Appendix A, protocol #8). In addition to the standard components used in
regular PCR, an oligonucleotide probe complementary to the target sequence of interest is

Methods
54
added. The probe contains a reporter dye at the 5´ end and a non-fluorescent quencher at its 3´
end. The probe anneals during extension, and the close proximity of the quencher to the
fluorescent reporter represses fluorescence in the intact probe. The quencher and fluorescent
reporter is separated when the Taq polymerase synthesizes the new strand, as its 5′ to 3′
nuclease activity cleaves the probe. This results in reporter fluorescence, as the reporter dye
and quencher dyes are physically separated (see Figure 23).
By monitoring the increase in fluorescence of the reporter dye, accumulation of PCR products
is detected directly, as the increase in signal is directly proportional to the number of
molecules released during that cycle.
The detected fluorescence values are recorded during every cycle. The more template present
at the start of the reaction, the less number of cycles it will take to reach a point where the
signal is first recorded as statistically significant above background (237). This is the Ct-
point, which always occurs during the exponential phase of amplification.
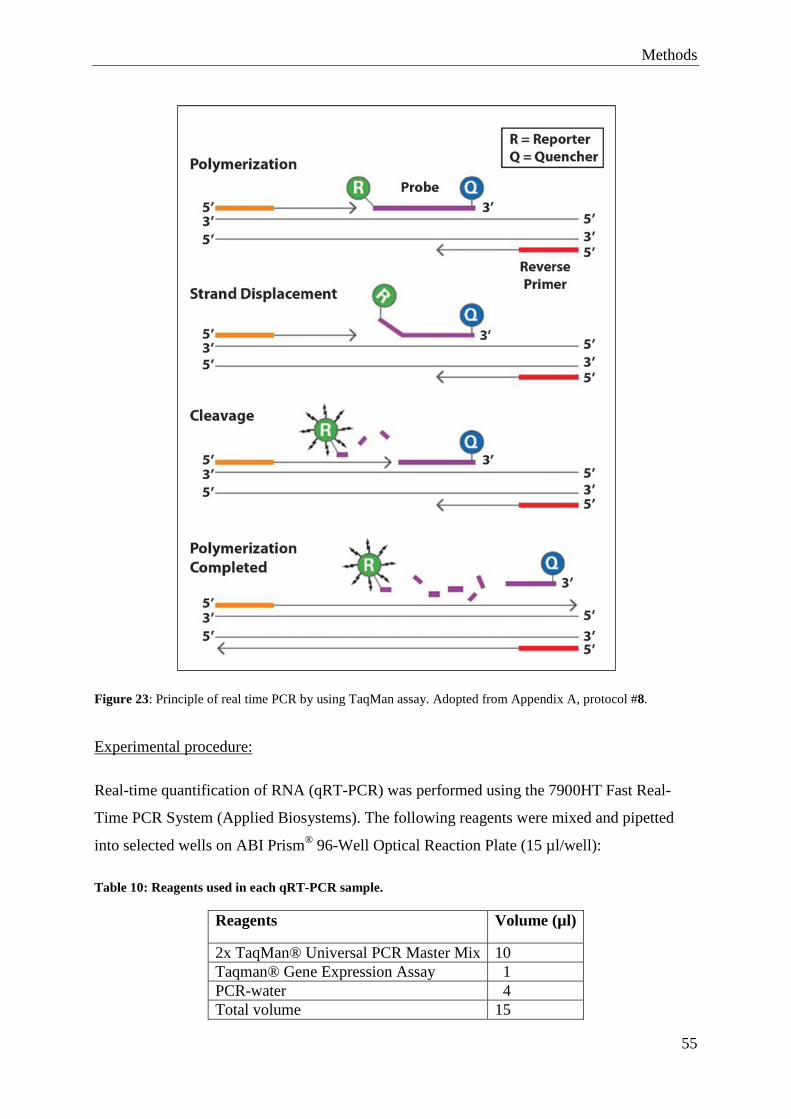
Methods
55
Figure 23: Principle of real time PCR by using TaqMan assay. Adopted from Appendix A, protocol #8.
Experimental procedure:
Real-time quantification of RNA (qRT-PCR) was performed using the 7900HT Fast Real-
Time PCR System (Applied Biosystems). The following reagents were mixed and pipetted
into selected wells on ABI Prism® 96-Well Optical Reaction Plate (15 µl/well):
Table 10: Reagents used in each qRT-PCR sample.
Reagents Volume (µl)
2x TaqMan® Universal PCR Master Mix 10 Taqman® Gene Expression Assay 1 PCR-water 4 Total volume 15

Methods
56
In addition to measuring mRNA of Plin5, 36B4 were used as a negative control in all
experiments to control for contaminants. TaqMan® Gene Expression Assays used in the
experiments were as following:
Table 11: Taqman® Gene Expression Assays.
Gene name Assay ID 36B4(Arbp) Mm00725448_s1 Plin5 Mm00508852_m1 PPARa Mm00440939_m1 PGC1a Mm01208835_m1 PGC1b Mm00504720_m1
5 µl diluted cDNA (2.5-6 ng/µl) was added to each well, and negative controls (water-
samples with regular Master-mix) without cDNA were used to control the Master-mix. To
control for DNA contaminants in the RNA samples, a negative cDNA control containing all
reagents except the RT-enzyme was used. The top of the plate was covered by firmly putting
on an ABI Prism® Optical Adhesive sealing. The plate was then vortexed and spun at 1000
rpm for 1 min and placed in the ABI 7900HT machine.
The run was set up using the SDS 2.3 Software from ABI, using standard thermal cycling
conditions (Table 12) with 20 µl reaction volume and 40 cycles. After the run the results were
analyzed in RQ Manager (ABI) and exported to Microsoft Office Excel 2007.
Table 12: Thermal cycling for qRT-PCR.
Initial step PCR step (40 cycles) AmpliTaq® Gold DNA Polymerase Activation
Melt (denature) DNA
Anneal/Elongate
10 min at 95 °C 15 sec at 95ºC 1 min at 60ºC

Methods
57
4.11 Statistical analyses Results are presented as mean ± standard deviation (SD) and are representative for one to
three individual experiments. The qRT-PCR experiments were performed in triplicates or
quadruplicates. Dual luciferase reporter experiments were performed in triplicates. To
examine statistical significant differences between samples, the parametric t-test was
performed. The Bonferroni correction for multiple comparisons was used to adjust p-values.
Statistical significance was set at the 5 % (P < 0.05) and the 1 % (P < 0.01) level. Careful
interpretation of the results is required due to the low number of samples. SPSS version 18.0
was used for statistical analysis.

Methods
58
Results
59
5 Results
5.1 PPARα is an important transcription factor regulating expression of Plin5
To search for transcription factors being important for regulating of Plin5 expression in
muscle cells, we transiently expressed different transcription factors known to stimulate
conversion of glycolytic to oxidative muscle types in vivo (58;64;238;239). C2C12 cells were
transiently transfected to ectopically express PPARs, RXRs, ERRs and PGC1s and then
subjected for myoblast to myotube differentiation for 72 hours (Figure 24). The relative levels
of Plin5 mRNA were subsequently measured by qRT-PCR analysis. A maximum 100-fold
increase in relative Plin5 mRNA was measured in cells transfected with the PPARα
expression vector (p < 0.05). A significant increase in relative Plin5 mNRA level was also
observed for PGC1α (P < 0.05) and PGC1β (P < 0.05). Transfection with other PPARs
tended to increase Plin5 mRNA levels (ranging from 1-20 fold difference), but these
inductions were evaluated as nonsignificant. Transfection with RXRs or ERRs had no affect
on the expression of Plin5 mRNA.
In addition to measure the level of Plin5 mRNA, the levels of PPARα, PGC1α and PGC1β
mRNAs were also measured to see if transfection with these transcriptional factors influenced
the expression levels of other transcriptional factors affecting Plin5 mRNA levels (Figure
24B, C and D respectively). A marginal increase in PPARα mRNA levels was observed in
cells ectopically expressing PGC1α in the C2C12 cells (Figure 24B). Ectopic expression of
ERRβ lowered the levels of PGC1β mRNA (Figure 24D).

Results
60
Figure 24: Relative mRNA expression of Plin5, PPARα, PGC1α and PGC1β in C2C12 cells ectopically expressing different NRs compared to the endogenous control 36B4. C2C12 cells were transfected with control vector (empty vector, pcDNA3) or pcDNA3-vectors expressing the indicated transcriptional factors. Myotube differentiation was initiated at start of transfections, and cells differentiated for three days before harvested. A: Plin5 mRNA. B: PPARα mRNA. C: PGC1α mRNA. D: PGC1β mRNA. Data is presented as Mean±SD (n=3, * P < 0.05 ). The experiment was run in quadruplicates, and repeated three times with similar results. One representative of three experiments is shown. PPARα; peroxisome

Results
61
proliferator-activated receptor α, PPARγ1; peroxisome proliferator-activated receptor γ1, PPARγ2; peroxisome proliferator-activated receptor γ2, PPARδ; peroxisome proliferator-activated receptor δ, RXRα;retinoid receptor x α, RXRβ1; retinoid receptor x β1, RXRβ2, retinoid receptor x β2, PGC1α; peroxisome proliferator-activated receptor gamma coactivator 1α, PGC1β; peroxisome proliferator-activated receptor gamma coactivator 1 β, ERRα; estrogen-related receptor α, ERRβ; estrogen-related receptor β, ERRγ; estrogen-related receptor γ.

Results
62
5.2 Ligand stimulation of PPARδ results in a cell-line expressing Plin5
Based on the previous results, it seems that PPARα is the most important regulator of Plin5
among the tested TFs. But we know from earlier work that PPARδ is an important regulator
of Plin5 expression (Berg et al, manuscript submitted). To compare the potency of PPARα
and PPARδ to stimulate Plin5 mRNA levels, C2C12 cells were transiently transfected to
ectopically express PPARα or PPARδ and subsequently given selective ligands activating
these PPARs. The cells were transfected, differentiated for three days, and stimulated with
selective PPARα (WY-14643; 10 µM) or PPARδ (GW501516; 0.1 µM) activators for an
additional 24 hours. The mRNA levels for Plin5 were thereafter measured by qRT-PCR
(Figure 25). The relative Plin5 mRNA level increased significantly with ectopic expression of
PPARα (30-fold; P < 0.01), ectopic expression and ligand activation of PPARα (120-fold; P
< 0.01), or ectopic-expression and ligand activation of PPARδ (70-fold; P < 0.05).
Interestingly, ectopic expression and ligand activation of either PPARα or PPARδ had
comparable stimulating effects on Plin5 mRNA levels. PPARδ is expressed at higher levels
than PPARα in C2C12 cells (Berg et al, manuscript submitted). These results suggest that
cultured C2C12 cells lack a potent ligand activating PPARδ, and that stimulating the C2C12
cells with a PPARδ-agonist results in a cell-line expressing Plin5. Similar results were also
found when performing a reporter-assay (see Appendix B figure # 1).
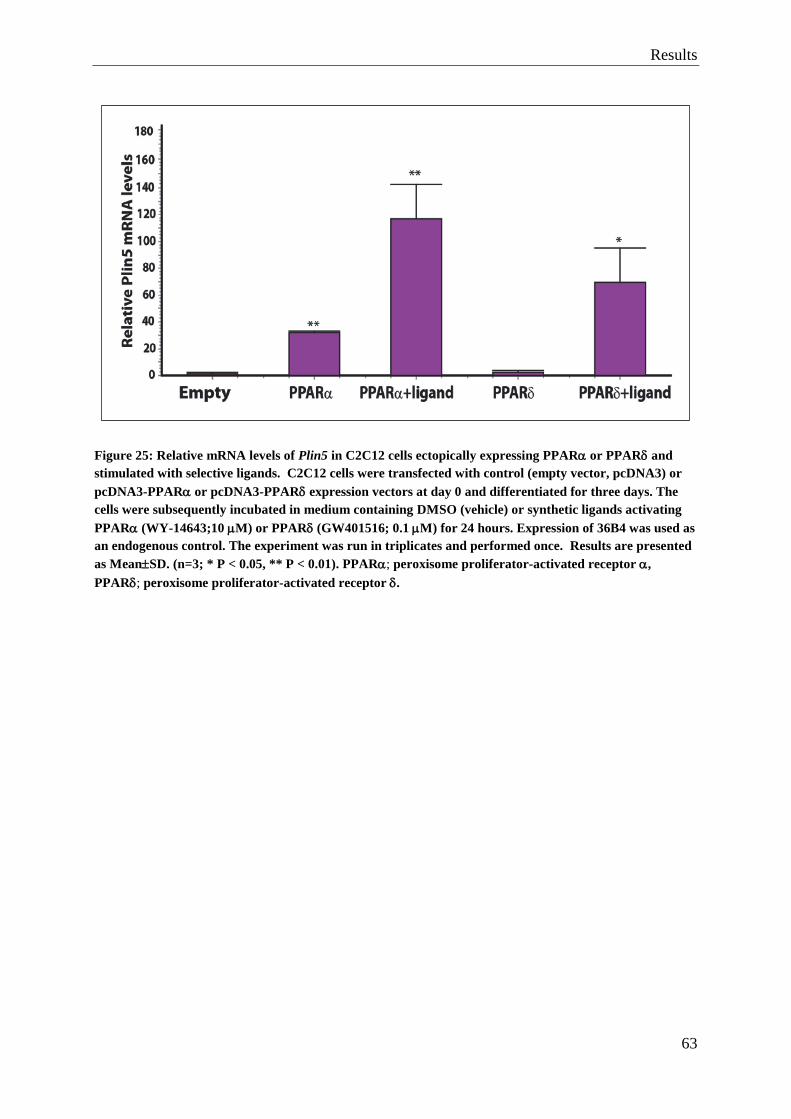
Results
63
Figure 25: Relative mRNA levels of Plin5 in C2C12 cells ectopically expressing PPARα or PPARδ and stimulated with selective ligands. C2C12 cells were transfected with control (empty vector, pcDNA3) or pcDNA3-PPARα or pcDNA3-PPARδ expression vectors at day 0 and differentiated for three days. The cells were subsequently incubated in medium containing DMSO (vehicle) or synthetic ligands activating PPARα (WY-14643;10 µM) or PPARδ (GW401516; 0.1 µM) for 24 hours. Expression of 36B4 was used as an endogenous control. The experiment was run in triplicates and performed once. Results are presented as Mean±SD. (n=3; * P < 0.05, ** P < 0.01). PPARα; peroxisome proliferator-activated receptor α, PPARδ; peroxisome proliferator-activated receptor δ.
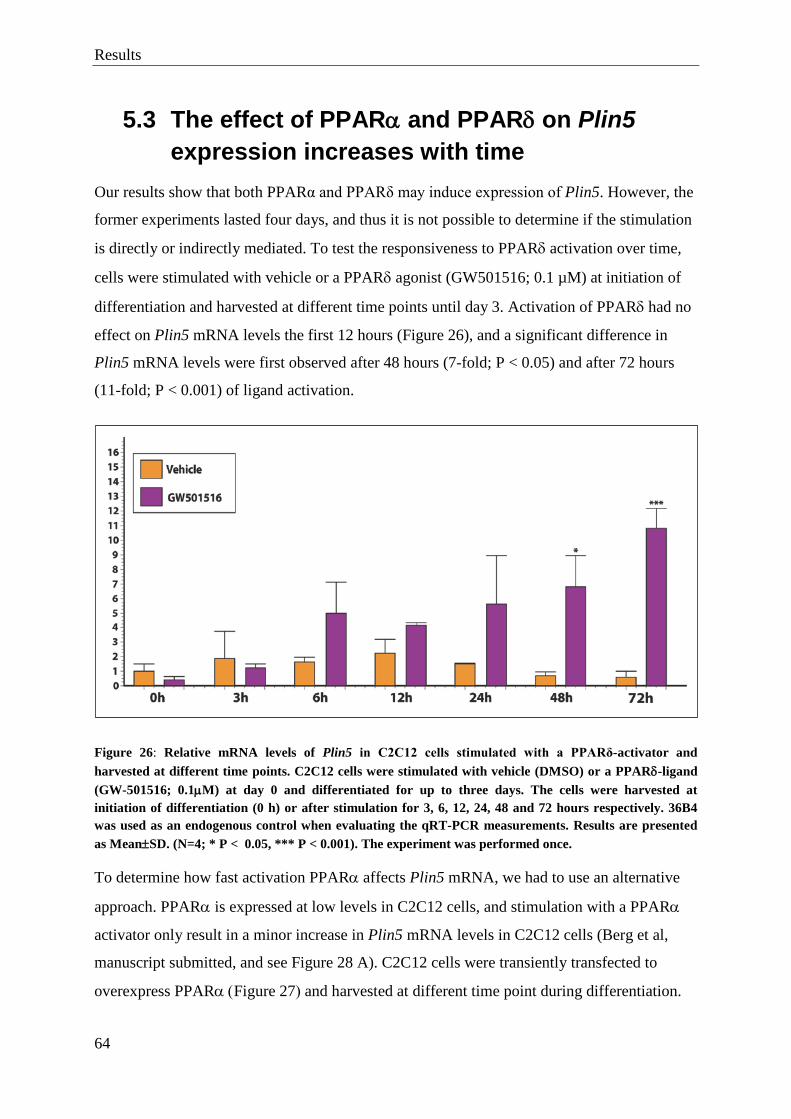
Results
64
5.3 The effect of PPARα and PPARδ on Plin5 expression increases with time
Our results show that both PPARα and PPARδ may induce expression of Plin5. However, the
former experiments lasted four days, and thus it is not possible to determine if the stimulation
is directly or indirectly mediated. To test the responsiveness to PPARδ activation over time,
cells were stimulated with vehicle or a PPARδ agonist (GW501516; 0.1 µM) at initiation of
differentiation and harvested at different time points until day 3. Activation of PPARδ had no
effect on Plin5 mRNA levels the first 12 hours (Figure 26), and a significant difference in
Plin5 mRNA levels were first observed after 48 hours (7-fold; P < 0.05) and after 72 hours
(11-fold; P < 0.001) of ligand activation.
Figure 26: Relative mRNA levels of Plin5 in C2C12 cells stimulated with a PPARδ-activator and harvested at different time points. C2C12 cells were stimulated with vehicle (DMSO) or a PPARδ-ligand (GW-501516; 0.1µM) at day 0 and differentiated for up to three days. The cells were harvested at initiation of differentiation (0 h) or after stimulation for 3, 6, 12, 24, 48 and 72 hours respectively. 36B4 was used as an endogenous control when evaluating the qRT-PCR measurements. Results are presented as Mean±SD. (N=4; * P < 0.05, *** P < 0.001). The experiment was performed once.
To determine how fast activation PPARα affects Plin5 mRNA, we had to use an alternative
approach. PPARα is expressed at low levels in C2C12 cells, and stimulation with a PPARα
activator only result in a minor increase in Plin5 mRNA levels in C2C12 cells (Berg et al,
manuscript submitted, and see Figure 28 A). C2C12 cells were transiently transfected to
overexpress PPARα (Figure 27) and harvested at different time point during differentiation.

Results
65
The relative levels of Plin5 mRNA were subsequently measured by qRT-PCR. The relative
Plin5 mRNA level in PPARα expressing cells compared to the control cells was significantly
elevated after 12 hours (3-fold; P < 0.05), 24 hours (5-fold; P < 0.05) and after 72 hours (7-
fold; P < 0.05) (Figure 27 A). The relative PPARα signals were comparable at all time points
from 3 hours after transfection, demonstrating that the transfected vector was present at equal
levels (Figure 27 Β). In cells not ectopically expressing PPARα (control cells), the relative
level of PPARα mRNA increased gradually with time, demonstrating that the level of PPARα
increase during differentiation of muscle cells. However, the level of Plin5 did not change
during differentiation. The relative level of PGC1α increased with differentiation to a
maximum ~8-fold increase after 72 hours (Figure 27 C). The expression level seemed to be
unaffected by ectopic expression of PPARα, but there was a tendency that the relative level of
PGC1α was reduced in the cells with ectopic expression of PPARα. The relative level of
PGC1β mRNA seemed less influenced by differentiation, with a 2-fold increase in control
cells after 72 hours of differentiation (Figure 27 D). Ectopic expression of PPARα did not
seem to influence the expression of PGC1β, but like the observation for PGC1α there was a
tendency of reduced expression of PGC1β in cells with ectopic expression of PPARα.

Results
66
Figure 27: Relative mRNA expression of Plin5, PPARα, PGC1α and PGC1β in C2C12 cells overexpressed with PPARα harvested at different times. C2C12 cells were transfected with control (empty vector, pcDNA3) or pcDNA3 inserted with PPARα expression vector at day 0. The cells were harvested after 3, 6, 12, 24, 48 and 72 hours. 36B4 was used as an endogenous control when evaluating the qRT-PCR measurements. The experiment was run in quadruplicates and performed once. A: Plin5 mRNA. B: PPARα mRNA C: PGC1α mRNA. D: PGC1β mRNA. Results are presented as Mean±SD. (* P < 0.05). PPARα; peroxisome proliferator-activated receptor α, PGC1α; peroxisome proliferator-activated receptor gamma coactivator 1α, PGC1β; peroxisome proliferator-activated receptor gamma coactivator 1 β.
The results suggest that the ectopic expression of PPARα or ligand activation of
PPARδ makes the relative level of Plin5 mRNA increase with time, suggesting both a direct
and a slower indirect stimulation involving other factors in the induction of Plin5 mRNA in
C2C12 cells.
Results
67
5.4 PGC1β is an important coactivator for expression of Plin5 in muscle cells
Activation of PPARδ or ectopic expression of PPARα induces Plin5 mRNA with time. A
large number of cellular processes might be altered in the cells during the four days of
incubation in the previous experiments. Theoretically, coregulators have time to be procueced
and activated and thereby participate in the induction during this timeframe. The initial
experiment (Figure 24) showed that ectopic expression of the coregulators PGC1α and
PGC1β induced the expression of Plin5 mRNA. It may be that these coactivators are recruited
to PPARs and stimulate transcription of Plin5 mRNA. In that case the level of Plin5 mRNA
will increase with time. To examine if this could be the case, C2C12 cells were transiently
transfected to ectopically express PGC1α or PGC1β (Figure 28). The cells were differentiated
for three days and then treated for 24 hours with vehicle (DMSO), PPARα activator (WY-
14643;10 µM), PPARδ activator (GW501516; 0.1 µM) PPARγ activator (Rosiglitazone
/BRL-49653; 1 µM), bovine serum albumin (BSA; 0.4 mM), or oleic acid (cis-C18:1 n-9)
complexed to BSA (BSA-OA; 0,1 µM). After harvested, mRNA levels for Plin5 were
measured by qRT-PCR.
Consistent with the previous experiments, in cells transfected with empty vector stimulation
with WY-14643 or GW-501516 increased the relative level of Plin5 mRNA 10- and 70-fold,
respectively (Figure 28 A; P < 0.05), confirming the previous shown PPARα and PPARδ
regulation of Plin5. Incubation with oleic acid, which may act as an ligand for PPARs,
induced Plin5 mRNA levels ~20-fold. In cells ectopically expressing PGC1α, expression of
Plin5 was induced ~20-fold with no stimulation (P < 0.05). The effect of WY-14643 with
ectopic expression of PGC1α was abolished, while the effect with GW persisted (P < 0.05).
In addition, stimulation of BRL-49653 increased the relative Plin5 mRNA level (P < 0.01).
Ectopic expression of PGC1α resulted in increased response when stimulating the cells with
BSA-OA (P < 0.05). The expression levels of Plin5 was most dramatically changed in cells
ectopically expressing PGC1β. Expression of Plin5 was highly induced (~80-fold) by ectopic
expression of PGC1β (P < 0.001), and addition of the various ligands had little further
stimulating effect on Plin5 mRNA expression levels. The only significant difference of
stimulation was when stimulating the cells with BSA-OA compared to BSA, where addition
of BSA-OA resulted in reduced expression of Plin5 mRNA (P <0.05). Ectopic expression of

Results
68
PGC1α or PGC1β mRNAs did not influence the mRNA levels of each other (Figure 28 B and
C). The different Ct-values for endogenous PGC1α (Ct ~32) and PGC1β (Ct ~28) indicate
that the expression level of PGC1β is higher (~16 x) than that of PGC1α in the C2C12 cells.
The lack of a strong PPAR ligand effect in cells ectopically expressing PGCβ, suggests that
this cofactor may normally be recruited to PPARs when they are stimulated with their ligands.
Figure 28: Relative mRNA expression of Plin5, PGC1α and PGC1β in C2C12 cells transfected with PGC1s and stimulated with PPAR-ligands. C2C12 cells were transfected with control (empty vector, pcDNA3) or pcDNA3 inserted with PGC1α or PGC1β expression vectors at day 0 and differentiated for three days. The cells were treated with DMSO, selective PPAR-activators, BSA, or oleic acid complexed to BSA for 24 hours. 36B4 was used as an endogenous control when evaluating the qRT-PCR measurements. The experiment was run in quadruplicates and performed once. A: Plin5 mRNA. B: PGC1α mRNA. C: PGC1β mRNA. Results are presented as Mean±SD. Statistical differences between groups stimulated versus DMSO (* P < 0.05), between groups BSA (¤ P < 0.05, ¤¤¤ P < 0.001), and between BSA-OA and BSA (# P < 0.05), for each transfected vector group (empty, PGC1α and PGC1β respectively). PGC1α; peroxisome proliferator-activated receptor gamma coactivator 1α, PGC1β; peroxisome proliferator-activated receptor gamma coactivator 1 β, N.D; Not determined. Activators of PPARα (WY-14643; 10 µM), PPARδ (GW401516; 0.1 µM), PPARγ (Rosiglitazone/BRL-49653; Rosi; 1 µM). BSA; bovine serum albumin (0,4 µM), BSA-OA; oleic acid (cis-C18:1 n-9; 0,1 µM) complexed to BSA (0,4µM.).

Results
69
5.5 PPARs bind to a conserved PPRE located in Plin5 intron 1
Earlier work by a master student suggested that the Plin5 promoter contains a DR1-type
PPAR responsive element (PPRE) located -2077 to -2064 bp upstream of the transcriptional
start site. Reporter assay experiments performed in collaboration with Christina Steppeler, as
teaching experiments, failed to validate these earlier observations. In our experiments,
different Plin5 Luciferase reporter constructs (full-length Plin5 reporter [-2344 to +244],
deletion constructs [-1329 to +244] and [-878 +244], or a construct with mutated PPRE)
(Figure 29) were transiently transfected into C2C12 cells and co-transfected with empty
vector, RXRα, or RXRα and PPARδ expression plasmids. Two days after transfection and
initiation of differentiation, the medium was replaced with fresh medium containing vehicle
(DMSO) or a PPARδ agonist (GW501516; 0.1 µM). There was essentially no difference in
the transcriptional activity of the various transfected Plin5 reporters (Figure 30). This implies
that PPARδ regulates the expression of Plin5 through a different PPRE, in a different region
of the promoter than concluded earlier. The same effect was observed when the same
experiment was performed with PPARα instead of PPARδ (Appendix B figure # 2).
Conservation of the PPAR activating effect in the shortest reporter construct [-878 +244] ,
suggests that the element is located within this region.
Figure 29: The Plin5 promoter with the hypothesized DR-1 type PPRE. Schematic drawing of the Plin5 reporter constructs with the DR-1 -2077 to -2064 bp upstream for the Plin5 promoter. The hypothesized functional DR-1 element (black rectangles), point-mutated DR-1 (white rectangles), bent arrow indicates transcription start. M12-1; full-length construct, M12-2; Sac-I deletion 1construct, M12-3; BgI II deletion construct, M12-4; mutated construct, LUC; luciferase, mut; mutated. Figure by Knut Tomas Dalen.

Results
70
Figure 30: Transient transfection with full-length (M12-1), deletion (M12-2; m-Plin5 SacI deletion and M12-3; m-Plin5 BgI II- deletion) or mutated (M12-4) Plin5 promoter constructs, co-transfected with no expression plasmid (Empty), RXR, or RXR and PPARδ expression vectors. Cells were stimulated with the vehicle (DMSO) or the PPARδ-ligand GW-501516 (0.1 µM). The experiment was run in triplicates and performed > 3 times. Results are presented as Mean±SD. Three statistical test were performed within each promoter group (M12-1 – M12-4); empty vector was compared to RXR, RXR+PPARδ, and RXR+PPARδ+ligand. (* P < 0.05, ** P < 0.01). PARδ; peroxisome proliferator-activated receptor δ, RXR;retinoid receptor x.
We therefore searched for an alternative PPRE in the [-878 +244] promoter region of the
Plin5 gene. With an online nuclear hormone receptor-search engine (NHR), a novel
promising DR-1 type PPRE was identified, located downstream of the Plin5 transcriptional
start site at position +139 to +151 (see Figure 31) in intron 1 of the Plin5 gene. Alignment of

Results
71
the mouse and human Plin5 promoter revealed that this DR1 sequence is highly conserved in
human (87 % sequence identity).
To be able to test if this element was functionally used by PPARs, the DR-1 element was
mutated by site-directed mutagenesis and positive clones sequenced to evaluate the integrity.
To determine if the PPRE recruits binding of PPARs to the Plin5 promoter, the full-length
Plin5 reporter (Plin5-Luc [-2344 to +244]) and the mutated construct (Plin5-Luc [-2344 to
+244-DR1 mut]) were transiently transfected into C2C12 cells and co-transfected with empty
(control), or RXRα, PPARα, PPARδ and PGC1 expression plasmids. After two days of
differentiation the medium was replaced with fresh medium containing vehicle (DMSO),
PPARδ agonist (GW501516; 0.1 µM) or PPARα agonist (WY-14643; 10 µM). Cells were
lysed and harvested four days after transfection.
Figure 31: The Plin5 promoter contains a conserved functional PPRE. A: A schematic presentation of the cloned mouse Plin5 reporter (nucleotides -2324 to +244), and the corresponding human PLIN5 promoter. The two alternative transcriptional start sites (TS) are indicated by arrows. The localization of the conserved intronic region and percentage identity to the human intronic segment is shown. The nucleotide position of the black boxes points out the localization of the PPREs. B: Sequence alignment and homology between nucleotides in the mouse and the human PLIN5 intronic regions. The two half sites in the conserved PPRE are encircled by boxes, and conserved nucleotides are indicated by vertical lines. C: Schematic drawing of the Plin5 reporter constructs that were transfected into C2C12 cells. Functional PPREs (black rectangles), point-mutated PPREs (white rectangles), bent arrow indicates transcription start. M12-1; full-length construct; M12-5: mutated construct; LUC; luciferase, mut; mutated. Figure by Knut Tomas Dalen (Berg et al, manuscript submitted).

Results
72
As shown earlier, Plin5-full-length reporter activity increased when cells were co-transfected
with RXRα and PPARδ (P < 0.05), and when stimulated with the PPARδ-activator GW-
501516 (P < 0.01), with a maximal 15-fold increase (Figure 32 A). The same response was
observed when cells were co-transfected with RXRα and PPARα and stimulated with the
PPARα agonist (WY-14643; 10 µM), with a maximum ~25-fold increase in the relative
transcriptional activity of the Plin5 promoter (Figure 32 B). On the contrary, the Plin5-
mutated reporter did not respond to co-transfection or ligand stimulation of the PPARs.
Ectopic expression of PGC1s stimulates Plin5 expression. To determine if this is caused by
binding of PGC1 to PPARs on the identified PPRE, Plin5 full-length reporter (M12-1) and
Plin5 full-length mutated reporter (M12-5) were transfected into C2C12 cells (Figure 33).
Cells were co-transfected with control vector (pcDNA3; empty vector), pcDNA3-PPARδ,
pcDNA3-PGC1α, or pcDNA3-PGC1β as indicated, and stimulated with vehicle or the
PPARδ-activator GW-501516. When the cells were overexpressing PPARδ and were
stimulated with GW-501516, overexpression of PGC1α resulted in increased Plin5 promoter
activity (P < 0.05) (Figure 33 A). Overexpression of PGC1β, on the other hand, resulted in
decreased Plin5 promoter activity when the cells were overexpressing PPARδ and were
stimulated with GW-501516 (P < 0.001).
Figure 33 B shows the corresponding results for when the cells were transfected with the
mutated Plin5 promoter (M12-5). This resulted in no significant differences in the relative
Plin5 reporter activity.
For both experiments (Figure 32 and Figure 33), the same basal activity was observed for the
mutated reporter and the full-length reporter, implying that the mutation did not influence
basal transcriptional activity. Overall, the mutated constructs failed to induce Plin5 reporter
activity, thereby confirming that the new identified PPRE is used by both PPARδ and
PPARα. Furthermore, the results suggest that the coactivator PGC1α has an enhancing role,
while PGC1β has an inhibitory role when it comes to PPARδ-stimulated induction of the
Plin5 promoter.

Results
73
Figure 32: Transient transfection with full-length (M12-1) or mutated (M12-5) Plin5 promoter constructs. A. C2C12 cells were co-transfected with no expression plasmid (control), RXRα, RXRα and PPARδ expression vectors. Cells were stimulated with the PPARδ-ligand GW501516 (0.1 µM; GW.) B. C2C12 cells were co-transfected with RXRα and PPARα expression vectors. Cells were stimulated with the PPARα-ligand WY- 14643 (10µM; WY). The experiment was run in triplicates and one representative of two experiments is shown. Results are presented as Mean±SD. Three statistical test were performed within each promoter group (M12-1 and M12-5); empty vector was compared to RXRα, RXRα and PPARα or PPARδ, and RXRα and PPARα or PPARδ+ligand. (* P < 0.05, ** P < 0.01). RXRα; retinoid receptor x, PARδ; peroxisome proliferator-activated receptor δ.

Results
74
Figure 33: Transient transfection with full-length (A, M12-1) or mutated (B, M12-5) Plin5 promoter constructs, co-transfected with no expression plasmid (control), PPARδ, PPARδ and PGC1α, or PPARδ and PGC1β expression vectors. Cells were stimulated with the PPARδ-ligand GW501516 (0.1 µM; GW). The experiment was run in triplicates and one representative of two experiments is shown. Results are presented as Mean±SD. Statistical differences between PPARδ+GW and PPARδ+GW+PGC1α or PPARδ+GW+PGC1β. (# P < 0.05, ### P < 0.001). PARδ; peroxisome proliferator-activated receptor δ, PGC1α; peroxisome proliferator-activated receptor gamma coactivator 1α, PGC1β; peroxisome proliferator-activated receptor gamma coactivator 1β.

Discussion
75
6 Discussion The main objective with this thesis was to investigate the transcriptional regulation of
perilipin 5, which is expressed in tissues with active fatty acid oxidation such as heart, striated
muscles, brown adipose tissue, and the liver. C2C12 cells were transfected with different
transcription factors, differentiated into myotubes, and harvested for RNA isolation. RNA was
isolated from the cell extract, and the relative amount of perilipin 5 and other relevant
mRNAs in the cell samples were measured by reverse transcribing mRNA into cDNA. The
cDNA abundance was analyzed by quantitative RT-PCR using TaqMan probes. The results
show that PPARα and PPARδ are key players in the regulation of perilipin 5. A search for a
PPRE in the Plin5 promoter resulted in identification of a potential PPRE in the Plin5
promoter. Luciferace reporter-assay comparing the full-length Plin5 reporter with a reporter
containing a mutated PPRE, confirmed that the PPRE discovered can be used by the PPARs
to regulate the Plin5 gene.
6.1 Methodology
Cell-line and cell culturing
The expression of perilipin 5 is previously found to be higher in oxidative, high-fat, type I
fibers, compared to the glycolytic, low-fat type II-fibers (171;216;218;240;241). Cultured
myotubes resemble type II fibers (242), whereas human muscles in vivo consist of both type I
and type II fibers (243;244). To study the regulation of perilipin 5 in vitro, the ideal cells
would be oxidative and express perilipin 5. The C2C12 cells (ATCC, #CRL-1772) use
glucose as energy source under standard culturing conditions, and perilipin 5 is expressed at
low levels. It might be that a transcription factor that makes the cells express perilipin 5, could
also function to switch cultured cells from glycolytic (type II) to oxidative (type I). Protocols
for culturing, passaging, differentiation and transfection of C2C12 cells were already
established in our laboratory.
Transfection
Expression vectors that were transfected (overexpressed) in this thesis were PPARs, RXRs,
PGC1s and ERRs, and also full-length and PPRE-mutated Plin5 reporters. The level of

Discussion
76
transcription factors differ among cell lines, and the C2C12 cells express the different PGC1s
and PPARs at variable levels. In my experiments, the Ct-values for PGC1α and PGC1β imply
that the cells express more PGC1β than PGC1α. Among the PPARs, PPARδ is more
abundant than PPARα (Berg et al, manuscript submitted). Transfected DNA is not genomic,
and therefore not subjected to (processes like) regulation of access to DNA by histone
modifications. Thereby an observed response after transfection is likely due to expression of
the transfected DNA.
To test if the transfected vectors regulated each other, TaqMan assays for the transfected
expression vectors were also performed. The coactivators PGC1α and PGC1β did not seem to
influence each other. PPARα was marginally increased by overexpression of PGC1α, while
the level of PGC1α and PGC1β was unaffected or slightly reduced by overexpression of
PPARα. However, the response of interest in this thesis was the amount of Plin5, which in the
C2C12 cells will only be present as a result of transcriptional regulation processes.
Generally factors affecting transfection efficiency, apart from the method itself, are cell
health, cell type, and DNA quality and quantity. The C2C12 cells used in the experiments
were grown in appropriated medium with all necessary factors, and they were incubated at
37ºC under 5 % CO2 and 100 % relative humidity. They were also maintained in exponential
growth phase, and transfected at ~70-80 % confluency. The right percentage of confluency is
important. If there are too many cells, it will be too “crowded” for the cells to divide
(mitosis). The plasmid-DNA used was isolated on columns as described in the protocol
(Appendix A Protocol # 1 and 2), and when this isolation is performed correctly, the DNA
should be free of proteins, RNA, chemicals and endotoxins.
We transfected the C2C12 cells with Lipofectamine™2000, which is a lipid-based
transfection method. For some cells, this is the most effective method regarding delivery, and
it is also associated with the lowest toxicity. In contrast to the calcium phosphate transfection
method, pH is not a problem. The method is easy to perform and involves only a few steps.
The limitation of liposome-based transfection is that it is not applicable to all cell lines.
However, for C2C12 cells it is an effective way of transfection. The quantity of DNA and
Lipofectamine™2000 used for transfection has previously been established for the C2C12
cell line (consentrations differ slightly from the standard protocol from the supplier, Appendix
A Protocol #5) .

Discussion
77
Total RNA isolation
Only a small percentage of all RNA species in an eukaryotic cell is mRNA. To obtain high-
quality RNA is a fundamental step in performing many molecular techniques such as qRT-
PCR. Common problems with isolating RNA is contamination with genomic DNA (gDNA)
and proteins such as inhibitors of reverse transcriptase, degradation of the RNA, and low
yields of RNA. To optimize the results, all equipment (tubes, trays, pipet tips and solutions)
must be RNase-free to get intact full-length RNA isolated.
The isolation of RNA was performed using ABI’s Nucleic Acid Prep Station 6100, which is
an established method in our laboratory. The method is a simple step-by-step procedure for
applying individual samples, wash solutions and an elution solution to a 96-well total RNA
purification tray placed in a vacuum carriage in the 6100 machine. The lysis solution used to
lyse cells, inactivates cellular RNases and thereby prevents degradation of the isolated nucleic
acid while keeping gDNA and protein in solution. As a result, the RNA is separated from the
other components. The method is fast, and allows simultaneously isolating of up to 96 high
quality RNA samples. Another established method for isolating high quality RNA, is the
TRIzol® method. This method provides higher yields of RNA, but has several limitations.
The most important one for this master thesis being the limitation of isolating samples one by
one. In addition, the TRIzol® method is based on phenols, which is known to inhibit the
reverse transcriptase enzyme. Inadequate removal of phenols could thereby cause less
efficient cDNA synthesis. Also, the RNA is more likely to be degraded if there are phenols
present in the sample. Based on these aspects, the 6100 machine from ABI was the preferred
choice for isolating total RNA.
qRT-PCR
Several methods for quantifying mRNA exist, such as the traditional Northern blotting, and
the more improved qRT-PCR that was used in this master thesis. Total RNA isolated from the
experiments was reverse transcribed to cDNA. The amount of cDNA is directly related to the
amount of the input RNA template, and the first strand of cDNA was used as a template in the
PCR reaction. To measure the initial amount of a mRNA transcript, and to compare the
expression levels among samples, the copy number of PCR products produced in each PCR
reaction needs to be quantified (as an indirect measure of mRNA levels in the cells).

Discussion
78
Northern blotting involves separating mRNA samples by size through gel electrophoresis, and
detection of the gene of interest with hybridization with a probe complementary to the target
sequence. The procedure normally takes at least three days to run, and it requires microgram
quantities of RNA to detect one gene of interest. Another disadvantage is the probes used,
which often are radioactively labeled. Methods to relate abundance of an individual transcript
between samples are required. Northern blotting is, however, the only method revealing the
size of the analyzed transcript, and gives a good indication of the integrity of the RNA
sample. qRT-PCR, on the other hand, has several advantages compared to Northern blotting.
An important aspect is time, as the qRT-PCR can give the results in only a couple of hours.
Also, it only needs nanogram quantities of RNA, and there is no radioactivity involved. In
contrast to the limited number of samples that can be detected on one membrane using
Northern blotting, the number of samples to be analyzed using qRT-PCR is much higher,
which makes it easy to run parallels and enable statistical analysis of changes in gene
expression. A disadvantage of qRT-PCR is that contaminants can inhibit the PCR reaction,
and high purity of the sample is therefore essential. In our studies, the purity depends on the
protocol used for isolation of total RNA with the ABI-6100 machine. Both Northern blotting
and qRT-PCR make use of control genes (house keeping genes). These genes are not affected
by the treatment and are used to normalize data and determine the fold-differences in
expression of the target gene among individual samples. The constitutively expressed
endogenous gene 36B4 was used as a control in our experiments. This gene has been
validated to have relative stable expression patterns in the cells studied and with the
treatments used in this thesis.
Dual luciferase reporter assay
To see if a newly identified PPRE in the Plin5 promoter is used by PPARs, a dual luciferase
reporter assay was performed. This is an often-used method to determine the transcriptional
activity of a specific promoter. The Luciferase-activity for two Plin5 reporters (Plin5 full-
length wild type or Plin5 mutated promoter) was normalized against Renilla Luciferase
activity produced by the internal control (pRL) in each sample. An advantage with this
method is the concept of simultaneous measuring of two different enzyme-activities in the
same pipetted sample. By normalizing these activities for each sample, the experimental
variation is minimized in contrast to using single a reporter in each well. The assay provides
no physical evidence for a direct binding of PPARs to a PPRE in the Plin5 promoter, but the

Discussion
79
results can suggest it might occur, by reflecting an alteration of the transcriptional activity of
the reporter. To prove a direct binding, chromatin immunoprecipitation (ChIP) assay or
electromobility shift assay can be used.
Statistical analysis
The parametric independent t-test is used to examine if there is a statistically significant
difference between the mean scores of two different groups. For all parametric tests, some
general assumptions apply (245): the dependent variable must be continuous rather than
categorical; each measurement must not be influenced by any other observation of
measurement; the samples must be taken from a normal distributed group; and the samples
must be obtained from groups with equal variances. Because the sample sizes in this thesis are
small, a non-parametric test is more accurate to use as it does not required normal
distribution. On the other hand, this type of test is less powerful than the parametric tests
(246), which means that genuine differences can be undetected because it can never produce
small P-values when dealing with extremely small sample size, such as comparing two groups
of samples with triplicates. The variances were often unequal in the experiments performed in
this thesis, as tested with Levene’s test for equality of variances. When the variances were
unequal, the corresponding p-value for “equal variances not assumed” was used. This way,
the assumption of equal variances was not violated. The last arguable assumption concerning
the statistics this thesis, is if the samples are in fact independent. However, because the
independent t-test is often used in similar experiments to test for statistical differences, the
test was also used in this thesis.
For each experiment, several comparisons were performed, most often between a control and
several other treatment groups. When more tests are conducted, the probability that one or
more are significant just by chance (type I errors) increases. To keep the familywise p-value
at 0.05 and 0.01, a new p-value was set by dividing the original p-value with the number of
tests performed (Bonferroni correction). Statistical significance was set at the 5 % (P < 0.05)
and the 1 % (P < 0.01) level. Due to the low number of experiments and samples, careful
interpretation of the results is required.

Discussion
80
6.2 General discussion Perilipin 5 is a member of the Perilipin-family of LD proteins (171). Evidence suggests it may
have a role in protection against cellular lipotoxicity in oxidative cells with high energy
demands, by transiently entrapping bioactive lipids in LDs close to mitochondria at times of
increased cellular FA influx. Also, it may facilitate the release of FA by LDs to the
mitochondria in a PKA-regulated manner when LDs and mitochondria are interacting with
each other (177;224).
The current understanding of the transcriptional regulation of perilipin 5 is limited. Work by
our group and others have found that it is regulated by ligand stimulation or ectopic
expression of PPARα (171;218;219). Perilipin 5 is expressed in oxidative muscle cells
(171;218;219), and based on the in vivo demonstration that factors like the PGC1s and the
ERRs stimulate the conversion of glycolytic to oxidative muscle types (101;113;114) we
wanted to test if these factors also have a role in the regulation of perilipin 5. From an
ongoing study in our group, we also know that activation of PPARδ stimulate Plin5
expression (Berg et al, manuscript submitted). However, a PPRE in the Plin5 promoter
responsible for the PPAR-effects had not yet been identified.
The main objective for this thesis was to investigate if perilipin 5 expression in cultured
muscle cells is induced by the transcription factors PPARs, PGC1s and ERRs, and to identify
response elements used by these transcription factors in the Plin5 promoter. Our results
confirmed that overexpression and activation of PPARα regulates the expression of perilipin
5 in muscle cells. However, they also demonstrated that another important PPAR in this
regulation probably is PPARδ. Furthermore, when induced by PPARs the relative level of
perilipin 5 increase with time, suggesting the involvement of other factors in the regulation of
transcriptional activity. We tested if PGC1s could be such factors, and found that when cells
were overexpressing PPARδ and stimulated with a PPARδ-agonist, the expression of perilipin
5 was enhanced by PGC1α and reduced by PGC1β. However, when not overexpressing
PPARs, it seems like the PGC1β induce the expression of perilipin 5 suggesting a role in the
basal expression of perilipin 5. ERRs did not appear to be of importance. The results also
confirmed a new-located functional PPRE in the Plin5 promoter.

Discussion
81
PPARα induces perilipin 5 in muscle cells
The mRNA level of perilipin 5 was induced by overexpression and/or stimulation of PPARα
in our cultured muscle cells. This has been demonstrated by other studies (171;218;219), both
in vitro and in vivo. In skeletal muscle cells from mice, the expression of perilipin 5 was
absent until stimulated with a PPARα-agonist, while cells from the PPARα-knockout mouse
showed no expression of perilipin 5 even when stimulated (219). Another study (218) found
the same results, with a 15-fold increase in perilipin 5 mRNA and protein levels in
gastrocnemius muscle (a mix of type I and type II fibers) from mice overexpressing PPARα
compared to littermate control mice. Also, a high-fat diet was demonstrated to increase the
expression of perilipin 5 in gastrocnemius muscle in vivo, regardless of whether or not
PPARα was overexpressed (218).
PPARα is activated when the cells need to use fat as energy source, such as starvation, cold
exposure, or a high fat diet, and its activation induces expression of genes that contribute to
maintaining energy balance (33). Also, it is activated with a low fat high sugar diet, through
upregulating FAS. Both PPARα and perilipin 5 is highly expressed in tissues with active
fatty acid oxidation (44;45;116;171), thereby a functional explanation for the PPARα-induced
expression of perilipin 5 in our experiments might be that perilipin 5 enhances the release of
FAs from LDs to provide the cell with energy.
PPARδ is an important PPAR in the transcriptional regulation of perilipin 5 in cultured muscle cells
An important result from this thesis is the demonstration that ligand stimulation of PPARδ in
glycolytic muscle cells stimulates expression of perilipin 5. Perilipin 5 is normally expressed
in oxidative tissues. Our result contrast to another study, which has investigated the role of
PPARδ in regulation of perilipin5 in mouse Leydig cells, where no induction of Plin5 mRNA
was observed after stimulating with a PPARδ-ligand (219). Work by our group has shown
that ligand stimulation of PPARδ resulted in a higher induction of perilipin 5 in muscle cells,
compared to ligand stimulation of PPARα (Berg et al, manuscript submitted). This is likely
due to the high expression of PPARδ compared to PPARα in muscle cells (247). However, it
also demonstrates that activation of a PPARδ is important in our culture model, not only the
presence of it. The present results are also in accordance with other studies demonstrating that

Discussion
82
overexpression of PPARδ in mice resulted in a change in fiber composition to more oxidative
fibers (58), which is the fiber type with the highest expression of perilipin 5.
PPARδ is ubiquitously expressed in the body, and is demonstrated to be a regulator of FA
oxidation in muscle cells to provide energy for working muscles when glucose is not available
(33). The induction of perilipin 5 in muscle by PPARδ suggests that this member of the
perilipin family has an important role in regulating the use of energy from cellular fat stores in
muscle.
Perilipin 5 is a novel direct PPAR target gene
Several experiments show a convincing increase in perilipin 5 expression after ligand
stimulation or ectopic expression of PPARα or PPARδ. To determine if this is a direct
regulation, we searched for potential PPREs in the Plin5 promoter. An earlier master student
had previously identified a PPRE located -2077 to -2064 bp upstream of the transcriptional
start site in the Plin5 promoter, but our experiments demonstrated that this sequence was not
used by the PPARs to induce the expression of perilipin 5. Instead, we identified a new
functional conserved PPRE located downstream of the Plin5 transcriptional start site at
position +139 to +151 (Figure 31) in intron 1 of the Plin5 gene. Mutation of only four
nucleotides within the PPRE in the Plin5-reporter construct abolished the induction of
perilipin 5 reporter activity by PPARs compared to the full-length promoter construct in cells
that was cotransfected with RXRα, PPARα, PPARδ, and PGC1s, and stimulated with
PPARα- and PPARδ -ligands. Only the full-length promoter construct resulted in a significant
increase in the induction of Plin5, implying that the novel PPRE is used by the PPARs.
Perilipin 5 is thus a novel direct PPAR target gene. Yamaguchi et al (219) were unable to
identify a PPRE in the 2.1-kb region upstream of the Plin5 promoter. Instead, they suggested
that the downstream region of the Plin5 gene, which corresponds to the promoter region of
the previously characterized Plin4 gene (176), could regulate Plin5 expression. The finding of
a functional PPRE in the Plin5 promoter in the present study supports a significant role for
Plin5 in the regulation of energy metabolism in muscle cells.

Discussion
83
The regulation of perilipin 5 in muscle cells also involves other transcription factors than the PPARs
The induction of perilipin 5 mRNA mediated by PPARα and PPARδ increases with time.
Because the endogenous expression levels of PPARα in the C2C12 cells are low, while the
levels of PPARδ are high (Berg et al, manuscript submitted), the experiments with the two
different PPARs were performed in different ways. When studying the time-effect of PPARα,
the cells were transfected to overexpress the receptor and not stimulated, while when studying
the time-effect of PPARδ the cells were only stimulated with a PPARδ-ligand without
overexpressing the receptor. The results imply that perilipin 5 is induced both directly (the
relative level of Plin5 increased after 48 and 12 hours respectively) and indirectly (the relative
level of Plin5 after 72 hours was further elevated) by PPARα and PPARδ. The indirect
regulation may be due to the involvement of coregulators, other PPAR target genes, or the
production of endogenous PPAR-ligands, as it would take time before these factors play out
their roles in the transcription.
The role of PGC1s
The PGC1s were tested for their ability to drive expression of Plin5, since they are known to
coactivate members of the PPAR-family (102;103;106;107). In addition, studies have
demonstrated that overexpression of PGC1α in transgenic mice increases the amount of type I
and IIa muscle fiber (slow oxidative) (113), while overexpression of PGC1β increases the
amount of type IIX muscle fiber (fast oxidative) (114). PGC1α was thus a likely candidate for
coactivating the expression of perilipin 5 together with the PPARs. The findings in my
experiments imply that ligand activation of PPARα has no effect on Plin5 expression when
the cells overexpress PGC1α (Figure 28), whereas ligand activation of PPARγ or PPARδ, or
stimulation with fatty acids (BSA-OA) (Figure 28 and Figure 33) increases Plin5 expression
also when PGC1α is overexpressed. The enhancing effect of PGC1α when stimulating
PPARδ and PPARγ may occur as PGC1α coactivates PPARδ or PPARγ which then bind to
the identified PPRE in the Plin5 promoter and induces the transcription of perilipin 5. The
effect of PGC1β was different from that of PGC1α. PGC1β was in my experiments
demonstrated to be present at higher levels than PGC1α in the C2C12 cells, and it seemed to
be more important regulatior of Plin5 as ectopic expression of PGC1β resulted in highly
increased Plin5 mRNA levels. When the cells were stimulated with PPAR-agonists or oleic

Discussion
84
acid there was no further induction of relative Plin5 mRNA, suggesting that the
overexpressed PGC1β already has bound to the PPARs and activated them. These results
imply that the PPARs prefer to bind PGC1β rather than PGC1α. The involvement of
coregulators in the transcriptional regulation of perilipin 5 has not previously been described,
but work by an earlier master student in our group investigated the role of PGC1α in this
regulation process. In contrast to my results, she found that expression of PGC1α stimulated
expression of perilipin 5 mediated by PPARα. However, her experiments were performed on
Cos-1 cells, which are a fibroblast-like cell line derived from monkey kidney, which might
explain why they are contradictory to my results in C2C12 cells.
Generation of PPAR ligands
The grade of activation of PPARs depends on several factors, as described in section 1.4.2,
including not only the abundance of the receptors, but also the level of ligands and the
dynamics of coactivators and corepressors. Another potential reason for the time-increasing
levels of perilipin 5 mRNA mediated by the PPARs, may thus be the production of PPAR
ligands. By such a mechanism, the first induction of perilipin 5 could lead to the release of
FAs from the LDs, which might be responsible for the subsequent increase of perilipin 5 by
acting as ligands for the PPARs. Alternatively, PPAR target genes could induce PPAR further
in a positive feed forward mechanism. A combination of these mechanisms could be the
production of PPAR-ligands by PPAR target genes. Interestingly, Wollins et al (218) found
that overexpression of the perilipin 5 activated the expression of other known PPAR target
genes involved in mitochondrial FA oxidation, suggesting that perilipin 5 may itself drive
import of FAs that function as PPAR ligands. If this is the case, perilipin 5 will be placed both
upstream and downstream of the PPARs, and it might be responsible for a positive feed
forward regulation of its own expression. This would be beneficial when the cells require
increased FA oxidation, under conditions such as fasting and when excess FAs need to be
degraded.
ERRs do not stimulate Plin5 expression
Another candidate group of factors which could have a role in the indirect induction of
perilipin 5 by the PPARs, was the ERRs, that have crucial roles in the regulation of energy
metabolism (248) and is coactivated by PGC1s (102;104;105). ERRα was particularly

Discussion
85
interesting because its tissue-expression correlates to that of perilipin 5 (86;90-92). Both
PGC1s and ERRα regulate genes involved in lipid metabolism, and are highly expressed in
tissues with active fatty acid oxidation. PGC1α and ERRα are furthermore activated by the
same physiologic stimuli, like exercise, fasting and exposure to cold temperatures. ERRα is a
target gene of PGC1α, and induction of PGC1α increase expression of ERRα and its target
genes in a positive feed forward mechanism (105). PGC1α is demonstrated to actually be
induced by PPARδ in muscle (111;249). This means that when the muscle is exposed to
exercise, PPARδ, PGC1α and ERRα are induced, leading to further activation and/or
increased transcription of all three proteins by a feedforward mechanism, with the ultimate
result manifested as increased oxidation of FAs in the muscle cells. Surprisingly to us,
overexpressing the ERRs resulted in no induction of perilipin 5 in the cultured muscle cells.
The role of potential corepressors
Although the PGC1β coactivator was found to stimulate Plin5 expression with highest
efficiency, the expression of Plin5 mRNA was reduced when the cells were ectopically
expressing PGC1β and stimulated with oleic acid (Figure 28). Plin5 reporter activity was also
reuced when the cells were ectopically expressing both PPARδ and PGC1β and stimulated
with a PPARδ agonist (GW501516) (Figure 33). A physiological explanation for this could be
the activation of repressing mechanisms and corepressors that repress the coactivating
function of PGC1β on PPARs with high activation. In glycolytic muscle cells the natural level
of the corepressor RIP140 is high (250), and this has been demonstrated to interact with
PGC1s to repress their activation of NRs (251). In fact, this interaction was found to regulate
the expression of another protein on the surface of LDs; the CIDEA. It is possible that RIP140
has counteracted the PGC1β and reduced the PPAR-activation and thereby lowered the level
of perilipin 5 induction observed when cells were overexpressing PGC1β and were stimulated
with oleic acid, and when the cells were overexpressing both PPARδ and PGC1β and were
stimulated with a PPARδ-agonist. However, the knowledge of what regulates RIP140 is not
fully understood. It can function both as a corepressor and a coactivator, but if environmental
stimuli such as fasting, exercise and a high fat diet have a role is unclear (252). Another
corepressor that could be of importance in the regulation of perilipin 5 is nuclear receptor
corepressor 1 (NCoR1). A muscle-specific NCoR1 knockout mouse model has been
demonstrated to have better exercise capacity, due to increased muscle mass and more

Discussion
86
oxidative muscle fibers in addition to upregulation of genes involved in mitochondrial
biogenesis and function, such as PPARδ and ERRs (253). The phenotype of these mice
resembles that of mouse overexpressing PGC1α (113;254). The level of NCoR1 in the
nucleus is upregulated by insulin, while the mRNA and protein level is reduced when the cells
are low in glucose and/or high in fat. Other conditions that demand increased FA oxidation
also reduce the NCoR1 mRNA, such as exercise, fasting, high-fat diet and aging (253). If
corepressors like RIP140 or NCoR1 repress the coactivation by PGC1s, such a mechanism
would perhaps protect the cells against an overload of FAs in the stimulated state. The
proposed mechanisms of Plin5 regulation in muscle cells are illustrated in Figure 34.

Discussion
87

Discussion
88
Figure 34: A proposed model for transcriptional regulation of Plin5 in muscle cells. A: PGC1β induces expression of Plin5 in the basal state. Corepressors like NCoR1 and RIP140 are also present and repress the transcriptional activity by disturbing the binding of PGC1β to PPAR. B: Under normal activation, the level of PPARs and PGC1s increase while the level of corepressors (might) decrease, resulting in elevated induction of Plin5 transcription. C: Under high activation conditions, like ectopic expression of PGC1β, or PGC1β+PPARδ and stimulation with GW501516, or stimulation with OA, the level of PPARs and PGC1s increase, while corepressors are abundant. NCoR1: Nuclear receptor Corepressor 1; PPAR: Peroxisome proliferator-activated receptor; RXR: retinoid x receptor; PPRE: Peroxisome proliferator-activated receptor response element; RNA POL II: RNA polymerase II; OA: oleic acid; PGC1β: Peroxisome proliferator-activated receptor gamma-coactivator beta .
A proposed role for perilipin 5 in fatty acid metabolism
The findings that both PPARα and PPARδ induce perilipin5 in muscle cells imply that it has
a major role in fatty acid metabolism. In accordance with this, perilipin 5 is previously
demonstrated to recruit mitochondria to the LD surface (220) and perhaps even be present
within the mitochondria (224). Overexpression of perilipin 5 in muscle cells results in
increased FA oxidation, and a higher interaction between perlipin 5- coated LDs and
mitochondria (224). This interaction seems reasonable in conditions when the cells need to
release fat from their storage, such as starvation and exercise. While resting skeletal muscles
use fatty acids as their primary fuel source (8), working muscles use glucose. When glucose is
depleted, the muscles must switch back to FA oxidation
By an unclear mechanism, PKA activation in cells overexpressing Plin5 increases lipolysis
(177). The current data suggests that perilipin 5 binds ATGL and inhibits lipolysis when PKA
is not activated. The catecholamine epinephrine is released from the adrenal medulla in
response to fright, exercise, cold and low levels of blood glucose, and activates adenylyl
cyclase (AC) in muscle cells. AC catalyzes the synthesis of cAMP, which results in the
activation of PKA, to produce glucose by enhancing glycogenolyse (8). Hence, the conditions
that activate PKA in muscle correlate with the conditions that induce perilipin 5 through
PPARα and PPARδ to yield energy from FA oxidation. When the cells need to use energy
stored in the LDs, perilipin 5 is induced by PPARα and/or PPARδ and phosphorylated by the
activated PKA to release ATGL and enhance lipolysis. Conversely, when energy homeostasis
is adequate, and the cells still are exposed to FA-influx (through a high fat diet, or a high
sugar diet in which fatty acid synthesis is upregulated), PKA will not be activated and thereby
perilipin 5 (induced by the activated PPARα due to high fat or high sugar) might remain
unphosphorylated and hold on to ATGL, thereby inhibiting lipolysis. However, the evidence

Discussion
89
of Plin5 phosphorylation by PKA is weak. Another kinase of interest is AMPK, which is
known to have a major role in the energy homeostasis in the body. Interestingly, this kinase is
demonstrated to phosphorylate and thereby increase the levels of PGC1α in skeletal muscle
cells (255). It is also activated by a change in the cellular AMP:ATP ratio which occurs
during exercise and fasting and with GW501516 stimulation of PPARδ. AMPK then
suppresses fatty acid synthesis and increases fatty acid oxidation (reviewed in (256)). It is
possible that the increased rate of FA oxidation partly is due to phosphorylation perilipin 5
under these conditions.
Perilipin 5 and life style diseases
By understanding the transcriptional regulation of perilipin 5, it might be possible to develop
drugs that counteract obesity by stimulating expression of perilipin 5; and thereby increase the
abundance of perilipin 5 on LDs and stimulate fatty acid oxidation and lipolysis. Obesity is
often the first step on the way to insulin resistance and type 2 diabetes mellitus (T2DM). The
energy surplus from the diet is first stored in adipose tissues, but as the storage capacity here
is reached, further fat storage will occur in other cells and tissues, like skeletal muscle and
pancreas, and thereby disturb their basic functions. It seems like perilipin 5 has an important
function in regulating the dynamics of storage and oxidation of fatty acids in oxidative tissue.
The basal expression of perilipin 5 has been demonstrated to facilitate TAG-storage, while the
stimulated state facilitates FA-oxidation in a PKA-dependent manner. This implies that if
perilipin 5 is to be upregulated through a potent drug target for life style diseases, it also has
to be activated through PKA in order to increase the fatty acid oxidation instead of storing the
fat.

Discussion
90
Conclusion
91
7 Conclusion Perilipin 5 is a member of the Perilipin family of LD proteins, which is expressed at high
levels in tissues with active fatty acid oxidation such as oxidative muscles, heart, brown
adipose tissue and liver. The protein is able to recruit mitochondria to the LD surface, and is
proposed to regulate lipolysis in a pattern analogue to that of perilipin 1 in adipose tissue by
interacting with CGI-58 and ATGL. Plin5 is suggested to protect the cell against lipotoxicity
by capturing lipids in LDs when there is a high influx of fatty acids to the cell, and facilitate
the release of fatty acids from the LDs when the cell needs to use fat as energy source.
Accumulation of body fat is the first step to development of obesity and insulin resistance.
Therefore, the knowledge of molecular processes utilizing fat stores is of great importance as
it potentially can be used to develop drugs to prevent these life style diseases. The
transcriptional regulation of perilipin 5 is little understood, but previous studies have
demonstrated that overexpression or ligand activation of PPARα induces Plin5 expression.
The work in this thesis revealed that the Plin5 promoter contains a conserved functional
PPRE, which makes it a novel PPAR target gene. Moreover, the results support the existing
evidence that PPARα induce the expression of perilipin 5, and in addition they imply that
PPARδ might play a larger role in the transcriptional regulation of perilipin 5 in muscle cells.
The induction of perilipin 5 by overexpression of PPARα or ligand activation of PPARδ
increases with time, suggesting the involvement of other factors important for Plin5
expression. The ERRs were tested, but not found to affect the expression of Plin5. Expression
of PGC1α and β, especially PGC1β, was found to induce expression of Plin5 mRNA. The
current results suggest that the PGC1s coactivte the PPARs when they stimulate transcription
of Plin5, but additional studies are required to fully determine the role of the PGC1s for Plin5
expression.

Conclusion
92

8 Suggested further work
93
8 Suggested further work To be able to address the effects of PGC1s more accurately, the transcriptional activity of the
perilipin 5 promoter should be measured when cells only overexpress the PGC1s,
independently of the PPARs. Also, the experiment illustrated in Figure 33 should be
performed with PPARα. To confirm that the PGC1β binds to PPARδ on the PPRE in the
Plin5 promoter, future studies should include a Chromatin Immunoprecipitation (ChIP) assay
that can identify PGC1β and PPARδ in the Plin5 gene, and an experiment with siRNA
PGC1β to test if the ligand-activated induction of Plin5 is reduced when PGC1β is not
present. In addition, the level of potential corepressors should be measured. Furthermore,
experiments should include more transfection studies to overexpress potential corepressors
and stimulate the cells with a PPARδ-ligand, to see if the relatie level of Plin5 mRNA is
reduced compared to when not stimulating PPARδ. If so, the corepressor likely represses the
PPARδ-activated induction of Plin5 in muscle cells.

94

References
95
References
(1) Obesity: Preventing and managing the global epidemic - Introduction. Obesity: Preventing and Managing the Global Epidemic 2000;894:1-253.
(2) WORLD HEALTH ORGANIZATION. The World Health Report 2002 - Reducing Risks, Promoting Healthy Life. 2002.
(3) Zehmer JK, Huang Y, Peng G, Pu J, Anderson RG, Liu P. A role for lipid droplets in inter-membrane lipid traffic. Proteomics 2009 Feb;9(4):914-21.
(4) Muller M, Kersten S. Nutrigenomics: goals and strategies. Nat Rev Genet 2003 Apr;4(4):315-22.
(5) Afman L, Muller M. Nutrigenomics: from molecular nutrition to prevention of disease. J Am Diet Assoc 2006 Apr;106(4):569-76.
(6) CRICK FH. On protein synthesis. Symp Soc Exp Biol 1958;12:138-63.
(7) Dept.Biol.Penn State. Transcription. 21-8-2009. 29-5-2012. Ref Type: Online Source
(8) Champe PC, Harvey RA, Ferrier DR. Biochemistry. 4th ed ed. Philadelphia: Wolters Kluwer/Lippincott Williams & Wilkins; 2008.
(9) Afman L, Muller M. Nutrigenomics: from molecular nutrition to prevention of disease. J Am Diet Assoc 2006 Apr;106(4):569-76.
(10) Carey M., Smale S.T. Transcriptional Regulation in Eukaryotes: Concepts, Strategies, and Techniques. CSHL Press; 2001.
(11) Smith C., Marks A., Lieberman M., Marks D. Marks' Basic Medical Biochemistry: a clinical approach. 2 ed. Philadelphia: Lippincott Williams & Wilkins; 2005.
(12) Nogales E. Recent structural insights into transcription preinitiation complexes. J Cell Sci 2000 Dec;113 Pt 24:4391-7.
(13) Zhang Z, Burch PE, Cooney AJ, Lanz RB, Pereira FA, Wu J, et al. Genomic analysis of the nuclear receptor family: new insights into structure, regulation, and evolution from the rat genome. Genome Res 2004 Apr;14(4):580-90.
(14) Chawla A, Repa JJ, Evans RM, Mangelsdorf DJ. Nuclear receptors and lipid physiology: opening the X-files. Science 2001 Nov 30;294(5548):1866-70.
(15) Muller M, Kersten S. Nutrigenomics: goals and strategies. Nat Rev Genet 2003 Apr;4(4):315-22.
References
96
(16) Lonard DM, Lanz RB, O'Malley BW. Nuclear receptor coregulators and human disease. Endocr Rev 2007 Aug;28(5):575-87.
(17) Giguere V. Orphan nuclear receptors: from gene to function. Endocr Rev 1999 Oct;20(5):689-725.
(18) Berrodin TJ, Marks MS, Ozato K, Linney E, Lazar MA. Heterodimerization among thyroid hormone receptor, retinoic acid receptor, retinoid X receptor, chicken ovalbumin upstream promoter transcription factor, and an endogenous liver protein. Mol Endocrinol 1992 Sep;6(9):1468-78.
(19) Bugge TH, Pohl J, Lonnoy O, Stunnenberg HG. RXR alpha, a promiscuous partner of retinoic acid and thyroid hormone receptors. EMBO J 1992 Apr;11(4):1409-18.
(20) Gearing KL, Gottlicher M, Teboul M, Widmark E, Gustafsson JA. Interaction of the peroxisome-proliferator-activated receptor and retinoid X receptor. Proc Natl Acad Sci U S A 1993 Feb 15;90(4):1440-4.
(21) Kliewer SA, Umesono K, Mangelsdorf DJ, Evans RM. Retinoid X receptor interacts with nuclear receptors in retinoic acid, thyroid hormone and vitamin D3 signalling. Nature 1992 Jan 30;355(6359):446-9.
(22) Feige JN, Gelman L, Tudor C, Engelborghs Y, Wahli W, Desvergne B. Fluorescence imaging reveals the nuclear behavior of peroxisome proliferator-activated receptor/retinoid X receptor heterodimers in the absence and presence of ligand. J Biol Chem 2005 May 6;280(18):17880-90.
(23) Depoix C, Delmotte MH, Formstecher P, Lefebvre P. Control of retinoic acid receptor heterodimerization by ligand-induced structural transitions. A novel mechanism of action for retinoid antagonists. J Biol Chem 2001 Mar 23;276(12):9452-9.
(24) Germain P, Chambon P, Eichele G, Evans RM, Lazar MA, Leid M, et al. International Union of Pharmacology. LXIII. Retinoid X receptors. Pharmacol Rev 2006 Dec;58(4):760-72.
(25) de Urquiza AM, Liu S, Sjoberg M, Zetterstrom RH, Griffiths W, Sjovall J, et al. Docosahexaenoic acid, a ligand for the retinoid X receptor in mouse brain. Science 2000 Dec 15;290(5499):2140-4.
(26) Ziouzenkova O, Orasanu G, Sukhova G, Lau E, Berger JP, Tang G, et al. Asymmetric cleavage of beta-carotene yields a transcriptional repressor of retinoid X receptor and peroxisome proliferator-activated receptor responses. Mol Endocrinol 2007 Jan;21(1):77-88.
(27) Mangelsdorf DJ, Borgmeyer U, Heyman RA, Zhou JY, Ong ES, Oro AE, et al. Characterization of three RXR genes that mediate the action of 9-cis retinoic acid. Genes Dev 1992 Mar;6(3):329-44.
(28) Desvergne B, Wahli W. Peroxisome proliferator-activated receptors: nuclear control of metabolism. Endocr Rev 1999 Oct;20(5):649-88.

References
97
(29) Dreyer C, Krey G, Keller H, Givel F, Helftenbein G, Wahli W. Control of the peroxisomal beta-oxidation pathway by a novel family of nuclear hormone receptors. Cell 1992 Mar 6;68(5):879-87.
(30) Issemann I, Green S. Activation of a member of the steroid hormone receptor superfamily by peroxisome proliferators. Nature 1990 Oct 18;347(6294):645-50.
(31) Auwerx J, Baulieu E, Beato M, Becker-Andre M, Burbach PH, Camerino G, et al. A unified nomenclature system for the nuclear receptor superfamily. Cell 1999 Apr 16;97(2):161-3.
(32) Michalik L, Auwerx J, Berger JP, Chatterjee VK, Glass CK, Gonzalez FJ, et al. International Union of Pharmacology. LXI. Peroxisome proliferator-activated receptors. Pharmacol Rev 2006 Dec;58(4):726-41.
(33) Varga T, Czimmerer Z, Nagy L. PPARs are a unique set of fatty acid regulated transcription factors controlling both lipid metabolism and inflammation. Biochim Biophys Acta 2011 Aug;1812(8):1007-22.
(34) Evans RM, Barish GD, Wang YX. PPARs and the complex journey to obesity. Nat Med 2004 Apr;10(4):355-61.
(35) Kliewer SA, Umesono K, Noonan DJ, Heyman RA, Evans RM. Convergence of 9-cis retinoic acid and peroxisome proliferator signalling pathways through heterodimer formation of their receptors. Nature 1992 Aug 27;358(6389):771-4.
(36) Fontaine C, Dubois G, Duguay Y, Helledie T, Vu-Dac N, Gervois P, et al. The orphan nuclear receptor Rev-Erbalpha is a peroxisome proliferator-activated receptor (PPAR) gamma target gene and promotes PPARgamma-induced adipocyte differentiation. J Biol Chem 2003 Sep 26;278(39):37672-80.
(37) Gervois P, Chopin-Delannoy S, Fadel A, Dubois G, Kosykh V, Fruchart JC, et al. Fibrates increase human REV-ERBalpha expression in liver via a novel peroxisome proliferator-activated receptor response element. Mol Endocrinol 1999 Mar;13(3):400-9.
(38) Kumar AP, Piedrafita FJ, Reynolds WF. Peroxisome proliferator-activated receptor gamma ligands regulate myeloperoxidase expression in macrophages by an estrogen-dependent mechanism involving the -463GA promoter polymorphism. J Biol Chem 2004 Feb 27;279(9):8300-15.
(39) Kumar AP, Quake AL, Chang MK, Zhou T, Lim KS, Singh R, et al. Repression of NHE1 expression by PPARgamma activation is a potential new approach for specific inhibition of the growth of tumor cells in vitro and in vivo. Cancer Res 2009 Nov 15;69(22):8636-44.
(40) Venkatachalam G, Kumar AP, Yue LS, Pervaiz S, Clement MV, Sakharkar MK. Computational identification and experimental validation of PPRE motifs in NHE1 and MnSOD genes of human. BMC Genomics 2009;10 Suppl 3:S5.
References
98
(41) Venkatachalam G, Clement MV, Kumar A.P, Sakharkar M.K. PPRESearch: Peroxisome Proliferator Activator Element Search Database. International Journal of Integrative Biology 2009;8(1):37-42.
(42) Montagner A, Rando G, Degueurce G, Leuenberger N, Michalik L, Wahli W. New insights into the role of PPARs. Prostaglandins Leukot Essent Fatty Acids 2011 Nov;85(5):235-43.
(43) Szeles L, Poliska S, Nagy G, Szatmari I, Szanto A, Pap A, et al. Research resource: transcriptome profiling of genes regulated by RXR and its permissive and nonpermissive partners in differentiating monocyte-derived dendritic cells. Mol Endocrinol 2010 Nov;24(11):2218-31.
(44) Bernal-Mizrachi C, Weng S, Feng C, Finck BN, Knutsen RH, Leone TC, et al. Dexamethasone induction of hypertension and diabetes is PPAR-alpha dependent in LDL receptor-null mice. Nat Med 2003 Aug;9(8):1069-75.
(45) Reddy JK, Hashimoto T. Peroxisomal beta-oxidation and peroxisome proliferator-activated receptor alpha: an adaptive metabolic system. Annu Rev Nutr 2001;21:193-230.
(46) Auboeuf D, Rieusset J, Fajas L, Vallier P, Frering V, Riou JP, et al. Tissue distribution and quantification of the expression of mRNAs of peroxisome proliferator-activated receptors and liver X receptor-alpha in humans: no alteration in adipose tissue of obese and NIDDM patients. Diabetes 1997 Aug;46(8):1319-27.
(47) Chinetti G, Griglio S, Antonucci M, Torra IP, Delerive P, Majd Z, et al. Activation of proliferator-activated receptors alpha and gamma induces apoptosis of human monocyte-derived macrophages. J Biol Chem 1998 Oct 2;273(40):25573-80.
(48) Inoue I, Shino K, Noji S, Awata T, Katayama S. Expression of peroxisome proliferator-activated receptor alpha (PPAR alpha) in primary cultures of human vascular endothelial cells. Biochem Biophys Res Commun 1998 May 19;246(2):370-4.
(49) Jones DC, Ding X, Daynes RA. Nuclear receptor peroxisome proliferator-activated receptor alpha (PPARalpha) is expressed in resting murine lymphocytes. The PPARalpha in T and B lymphocytes is both transactivation and transrepression competent. J Biol Chem 2002 Mar 1;277(9):6838-45.
(50) Kliewer SA, Forman BM, Blumberg B, Ong ES, Borgmeyer U, Mangelsdorf DJ, et al. Differential expression and activation of a family of murine peroxisome proliferator-activated receptors. Proc Natl Acad Sci U S A 1994 Jul 19;91(15):7355-9.
(51) Gervois P, Torra IP, Fruchart JC, Staels B. Regulation of lipid and lipoprotein metabolism by PPAR activators. Clin Chem Lab Med 2000 Jan;38(1):3-11.
(52) Vu-Dac N, Gervois P, Jakel H, Nowak M, Bauge E, Dehondt H, et al. Apolipoprotein A5, a crucial determinant of plasma triglyceride levels, is highly responsive to peroxisome proliferator-activated receptor alpha activators. J Biol Chem 2003 May 16;278(20):17982-5.

References
99
(53) Barter PJ, Rye KA. Is there a role for fibrates in the management of dyslipidemia in the metabolic syndrome? Arterioscler Thromb Vasc Biol 2008 Jan;28(1):39-46.
(54) Chakravarthy MV, Pan Z, Zhu Y, Tordjman K, Schneider JG, Coleman T, et al. "New" hepatic fat activates PPARalpha to maintain glucose, lipid, and cholesterol homeostasis. Cell Metab 2005 May;1(5):309-22.
(55) Chakravarthy MV, Lodhi IJ, Yin L, Malapaka RR, Xu HE, Turk J, et al. Identification of a physiologically relevant endogenous ligand for PPARalpha in liver. Cell 2009 Aug 7;138(3):476-88.
(56) Rotman N, Wahli W. Fatty acid synthesis and PPARalpha hand in hand. Chem Biol 2009 Aug 28;16(8):801-2.
(57) Mukherjee R, Jow L, Croston GE, Paterniti JR, Jr. Identification, characterization, and tissue distribution of human peroxisome proliferator-activated receptor (PPAR) isoforms PPARgamma2 versus PPARgamma1 and activation with retinoid X receptor agonists and antagonists. J Biol Chem 1997 Mar 21;272(12):8071-6.
(58) Luquet S, Lopez-Soriano J, Holst D, Fredenrich A, Melki J, Rassoulzadegan M, et al. Peroxisome proliferator-activated receptor delta controls muscle development and oxidative capability. FASEB J 2003 Dec;17(15):2299-301.
(59) Barak Y, Liao D, He W, Ong ES, Nelson MC, Olefsky JM, et al. Effects of peroxisome proliferator-activated receptor delta on placentation, adiposity, and colorectal cancer. Proc Natl Acad Sci U S A 2002 Jan 8;99(1):303-8.
(60) Michalik L, Desvergne B, Tan NS, Basu-Modak S, Escher P, Rieusset J, et al. Impaired skin wound healing in peroxisome proliferator-activated receptor (PPAR)alpha and PPARbeta mutant mice. J Cell Biol 2001 Aug 20;154(4):799-814.
(61) Peters JM, Lee SS, Li W, Ward JM, Gavrilova O, Everett C, et al. Growth, adipose, brain, and skin alterations resulting from targeted disruption of the mouse peroxisome proliferator-activated receptor beta(delta). Mol Cell Biol 2000 Jul;20(14):5119-28.
(62) Barish GD, Narkar VA, Evans RM. PPAR delta: a dagger in the heart of the metabolic syndrome. J Clin Invest 2006 Mar;116(3):590-7.
(63) Kramer DK, Al-Khalili L, Guigas B, Leng Y, Garcia-Roves PM, Krook A. Role of AMP kinase and PPARdelta in the regulation of lipid and glucose metabolism in human skeletal muscle. J Biol Chem 2007 Jul 6;282(27):19313-20.
(64) Gan Z, Burkart-Hartman EM, Han DH, Finck B, Leone TC, Smith EY, et al. The nuclear receptor PPARbeta/delta programs muscle glucose metabolism in cooperation with AMPK and MEF2. Genes Dev 2011 Dec 15;25(24):2619-30.
(65) Schuler M, Ali F, Chambon C, Duteil D, Bornert JM, Tardivel A, et al. PGC1alpha expression is controlled in skeletal muscles by PPARbeta, whose ablation results in fiber-type switching, obesity, and type 2 diabetes. Cell Metab 2006 Nov;4(5):407-14.

References
100
(66) Higashiura K, Ura N, Takada T, Agata J, Yoshida H, Miyazaki Y, et al. Alteration of muscle fiber composition linking to insulin resistance and hypertension in fructose-fed rats. Am J Hypertens 1999 Jun;12(6):596-602.
(67) Salvado L, Serrano-Marco L, Barroso E, Palomer X, Vazquez-Carrera M. Targeting PPAR beta/delta for the treatment of type 2 diabetes mellitus. Expert Opinion on Therapeutic Targets 2012 Feb;16(2):209-23.
(68) Feige JN, Gelman L, Michalik L, Desvergne B, Wahli W. From molecular action to physiological outputs: peroxisome proliferator-activated receptors are nuclear receptors at the crossroads of key cellular functions. Prog Lipid Res 2006 Mar;45(2):120-59.
(69) Imai T, Takakuwa R, Marchand S, Dentz E, Bornert JM, Messaddeq N, et al. Peroxisome proliferator-activated receptor gamma is required in mature white and brown adipocytes for their survival in the mouse. Proc Natl Acad Sci U S A 2004 Mar 30;101(13):4543-7.
(70) Tontonoz P, Hu E, Graves RA, Budavari AI, Spiegelman BM. mPPAR gamma 2: tissue-specific regulator of an adipocyte enhancer. Genes Dev 1994 May 15;8(10):1224-34.
(71) Braissant O, Wahli W. Differential expression of peroxisome proliferator-activated receptor-alpha, -beta, and -gamma during rat embryonic development. Endocrinology 1998 Jun;139(6):2748-54.
(72) Chen W, Yang CC, Sheu HM, Seltmann H, Zouboulis CC. Expression of peroxisome proliferator-activated receptor and CCAAT/enhancer binding protein transcription factors in cultured human sebocytes. J Invest Dermatol 2003 Sep;121(3):441-7.
(73) Greene ME, Blumberg B, McBride OW, Yi HF, Kronquist K, Kwan K, et al. Isolation of the human peroxisome proliferator activated receptor gamma cDNA: expression in hematopoietic cells and chromosomal mapping. Gene Expr 1995;4(4-5):281-99.
(74) Mansen A, Guardiola-Diaz H, Rafter J, Branting C, Gustafsson JA. Expression of the peroxisome proliferator-activated receptor (PPAR) in the mouse colonic mucosa. Biochem Biophys Res Commun 1996 May 24;222(3):844-51.
(75) Marx N, Bourcier T, Sukhova GK, Libby P, Plutzky J. PPARgamma activation in human endothelial cells increases plasminogen activator inhibitor type-1 expression: PPARgamma as a potential mediator in vascular disease. Arterioscler Thromb Vasc Biol 1999 Mar;19(3):546-51.
(76) Rosen ED, Kulkarni RN, Sarraf P, Ozcan U, Okada T, Hsu CH, et al. Targeted elimination of peroxisome proliferator-activated receptor gamma in beta cells leads to abnormalities in islet mass without compromising glucose homeostasis. Mol Cell Biol 2003 Oct;23(20):7222-9.
(77) Tontonoz P, Nagy L, Alvarez JG, Thomazy VA, Evans RM. PPARgamma promotes monocyte/macrophage differentiation and uptake of oxidized LDL. Cell 1998 Apr 17;93(2):241-52.

References
101
(78) Vidal-Puig AJ, Considine RV, Jimenez-Linan M, Werman A, Pories WJ, Caro JF, et al. Peroxisome proliferator-activated receptor gene expression in human tissues. Effects of obesity, weight loss, and regulation by insulin and glucocorticoids. J Clin Invest 1997 May 15;99(10):2416-22.
(79) Barak Y, Nelson MC, Ong ES, Jones YZ, Ruiz-Lozano P, Chien KR, et al. PPAR gamma is required for placental, cardiac, and adipose tissue development. Mol Cell 1999 Oct;4(4):585-95.
(80) Kubota N, Terauchi Y, Miki H, Tamemoto H, Yamauchi T, Komeda K, et al. PPAR gamma mediates high-fat diet-induced adipocyte hypertrophy and insulin resistance. Mol Cell 1999 Oct;4(4):597-609.
(81) Rosen ED, Sarraf P, Troy AE, Bradwin G, Moore K, Milstone DS, et al. PPAR gamma is required for the differentiation of adipose tissue in vivo and in vitro. Mol Cell 1999 Oct;4(4):611-7.
(82) Agarwal AK, Garg A. A novel heterozygous mutation in peroxisome proliferator-activated receptor-gamma gene in a patient with familial partial lipodystrophy. J Clin Endocrinol Metab 2002 Jan;87(1):408-11.
(83) Hegele RA, Cao H, Frankowski C, Mathews ST, Leff T. PPARG F388L, a transactivation-deficient mutant, in familial partial lipodystrophy. Diabetes 2002 Dec;51(12):3586-90.
(84) Savage DB, Tan GD, Acerini CL, Jebb SA, Agostini M, Gurnell M, et al. Human metabolic syndrome resulting from dominant-negative mutations in the nuclear receptor peroxisome proliferator-activated receptor-gamma. Diabetes 2003 Apr;52(4):910-7.
(85) Hong H, Yang L, Stallcup MR. Hormone-independent transcriptional activation and coactivator binding by novel orphan nuclear receptor ERR3. J Biol Chem 1999 Aug 6;274(32):22618-26.
(86) Giguere V, Yang N, Segui P, Evans RM. Identification of a new class of steroid hormone receptors. Nature 1988 Jan 7;331(6151):91-4.
(87) Eudy JD, Yao S, Weston MD, Ma-Edmonds M, Talmadge CB, Cheng JJ, et al. Isolation of a gene encoding a novel member of the nuclear receptor superfamily from the critical region of Usher syndrome type IIa at 1q41. Genomics 1998 Jun 15;50(3):382-4.
(88) Heard DJ, Norby PL, Holloway J, Vissing H. Human ERRgamma, a third member of the estrogen receptor-related receptor (ERR) subfamily of orphan nuclear receptors: tissue-specific isoforms are expressed during development and in the adult. Mol Endocrinol 2000 Mar;14(3):382-92.
(89) Gofflot F, Chartoire N, Vasseur L, Heikkinen S, Dembele D, Le MJ, et al. Systematic gene expression mapping clusters nuclear receptors according to their function in the brain. Cell 2007 Oct 19;131(2):405-18.

References
102
(90) Bookout AL, Jeong Y, Downes M, Yu RT, Evans RM, Mangelsdorf DJ. Anatomical profiling of nuclear receptor expression reveals a hierarchical transcriptional network. Cell 2006 Aug 25;126(4):789-99.
(91) Ichida M, Nemoto S, Finkel T. Identification of a specific molecular repressor of the peroxisome proliferator-activated receptor gamma Coactivator-1 alpha (PGC-1alpha). J Biol Chem 2002 Dec 27;277(52):50991-5.
(92) Sladek R, Bader JA, Giguere V. The orphan nuclear receptor estrogen-related receptor alpha is a transcriptional regulator of the human medium-chain acyl coenzyme A dehydrogenase gene. Mol Cell Biol 1997 Sep;17(9):5400-9.
(93) Fu M, Sun T, Bookout AL, Downes M, Yu RT, Evans RM, et al. A Nuclear Receptor Atlas: 3T3-L1 adipogenesis. Mol Endocrinol 2005 Oct;19(10):2437-50.
(94) Barish GD, Downes M, Alaynick WA, Yu RT, Ocampo CB, Bookout AL, et al. A Nuclear Receptor Atlas: macrophage activation. Mol Endocrinol 2005 Oct;19(10):2466-77.
(95) Sonoda J, Laganiere J, Mehl IR, Barish GD, Chong LW, Li X, et al. Nuclear receptor ERR alpha and coactivator PGC-1 beta are effectors of IFN-gamma-induced host defense. Genes Dev 2007 Aug 1;21(15):1909-20.
(96) Kamei Y, Ohizumi H, Fujitani Y, Nemoto T, Tanaka T, Takahashi N, et al. PPARgamma coactivator 1beta/ERR ligand 1 is an ERR protein ligand, whose expression induces a high-energy expenditure and antagonizes obesity. Proc Natl Acad Sci U S A 2003 Oct 14;100(21):12378-83.
(97) Rodriguez-Calvo R, Jove M, Coll T, Camins A, Sanchez RM, Alegret M, et al. PGC-1beta down-regulation is associated with reduced ERRalpha activity and MCAD expression in skeletal muscle of senescence-accelerated mice. J Gerontol A Biol Sci Med Sci 2006 Aug;61(8):773-80.
(98) Schreiber SN, Knutti D, Brogli K, Uhlmann T, Kralli A. The transcriptional coactivator PGC-1 regulates the expression and activity of the orphan nuclear receptor estrogen-related receptor alpha (ERRalpha). J Biol Chem 2003 Mar 14;278(11):9013-8.
(99) Schreiber SN, Emter R, Hock MB, Knutti D, Cardenas J, Podvinec M, et al. The estrogen-related receptor alpha (ERRalpha) functions in PPARgamma coactivator 1alpha (PGC-1alpha)-induced mitochondrial biogenesis. Proc Natl Acad Sci U S A 2004 Apr 27;101(17):6472-7.
(100) Sonoda J, Mehl IR, Chong LW, Nofsinger RR, Evans RM. PGC-1beta controls mitochondrial metabolism to modulate circadian activity, adaptive thermogenesis, and hepatic steatosis. Proc Natl Acad Sci U S A 2007 Mar 20;104(12):5223-8.
(101) Alaynick WA, Kondo RP, Xie W, He W, Dufour CR, Downes M, et al. ERRgamma directs and maintains the transition to oxidative metabolism in the postnatal heart. Cell Metab 2007 Jul;6(1):13-24.
References
103
(102) Puigserver P, Wu Z, Park CW, Graves R, Wright M, Spiegelman BM. A cold-inducible coactivator of nuclear receptors linked to adaptive thermogenesis. Cell 1998 Mar 20;92(6):829-39.
(103) Wu Z, Puigserver P, Andersson U, Zhang C, Adelmant G, Mootha V, et al. Mechanisms controlling mitochondrial biogenesis and respiration through the thermogenic coactivator PGC-1. Cell 1999 Jul 9;98(1):115-24.
(104) Knutti D, Kaul A, Kralli A. A tissue-specific coactivator of steroid receptors, identified in a functional genetic screen. Mol Cell Biol 2000 Apr;20(7):2411-22.
(105) Tcherepanova I, Puigserver P, Norris JD, Spiegelman BM, McDonnell DP. Modulation of estrogen receptor-alpha transcriptional activity by the coactivator PGC-1. J Biol Chem 2000 May 26;275(21):16302-8.
(106) Vega RB, Huss JM, Kelly DP. The coactivator PGC-1 cooperates with peroxisome proliferator-activated receptor alpha in transcriptional control of nuclear genes encoding mitochondrial fatty acid oxidation enzymes. Mol Cell Biol 2000 Mar;20(5):1868-76.
(107) Wang YX, Lee CH, Tiep S, Yu RT, Ham J, Kang H, et al. Peroxisome-proliferator-activated receptor delta activates fat metabolism to prevent obesity. Cell 2003 Apr 18;113(2):159-70.
(108) Finck BN, Kelly DP. PGC-1 coactivators: inducible regulators of energy metabolism in health and disease. J Clin Invest 2006 Mar;116(3):615-22.
(109) Lin J, Puigserver P, Donovan J, Tarr P, Spiegelman BM. Peroxisome proliferator-activated receptor gamma coactivator 1beta (PGC-1beta ), a novel PGC-1-related transcription coactivator associated with host cell factor. J Biol Chem 2002 Jan 18;277(3):1645-8.
(110) St-Pierre J, Lin J, Krauss S, Tarr PT, Yang R, Newgard CB, et al. Bioenergetic analysis of peroxisome proliferator-activated receptor gamma coactivators 1alpha and 1beta (PGC-1alpha and PGC-1beta) in muscle cells. J Biol Chem 2003 Jul 18;278(29):26597-603.
(111) Hondares E, Rosell M, Diaz-Delfin J, Olmos Y, Monsalve M, Iglesias R, et al. Peroxisome proliferator-activated receptor alpha (PPARalpha) induces PPARgamma coactivator 1alpha (PGC-1alpha) gene expression and contributes to thermogenic activation of brown fat: involvement of PRDM16. J Biol Chem 2011 Dec 16;286(50):43112-22.
(112) Lin J, Tarr PT, Yang R, Rhee J, Puigserver P, Newgard CB, et al. PGC-1beta in the regulation of hepatic glucose and energy metabolism. J Biol Chem 2003 Aug 15;278(33):30843-8.
(113) Lin J, Wu H, Tarr PT, Zhang CY, Wu Z, Boss O, et al. Transcriptional co-activator PGC-1 alpha drives the formation of slow-twitch muscle fibres. Nature 2002 Aug 15;418(6899):797-801.
References
104
(114) Arany Z, Lebrasseur N, Morris C, Smith E, Yang W, Ma Y, et al. The transcriptional coactivator PGC-1beta drives the formation of oxidative type IIX fibers in skeletal muscle. Cell Metab 2007 Jan;5(1):35-46.
(115) Ducharme NA, Bickel PE. Lipid droplets in lipogenesis and lipolysis. Endocrinology 2008 Mar;149(3):942-9.
(116) Suzuki M, Shinohara Y, Ohsaki Y, Fujimoto T. Lipid droplets: size matters. J Electron Microsc (Tokyo) 2011;60 Suppl 1:S101-S116.
(117) Fujimoto T, Parton RG. Not just fat: the structure and function of the lipid droplet. Cold Spring Harb Perspect Biol 2011 Mar;3(3).
(118) Guo Y, Cordes KR, Farese RV, Jr., Walther TC. Lipid droplets at a glance. J Cell Sci 2009 Mar 15;122(Pt 6):749-52.
(119) Stemberger BH, Walsh RM, Patton S. Morphometric evaluation of lipid droplet associations with secretory vesicles, mitochondria and other components in the lactating cell. Cell Tissue Res 1984;236(2):471-5.
(120) Blanchette-Mackie EJ, Scow RO. Movement of lipolytic products to mitochondria in brown adipose tissue of young rats: an electron microscope study. J Lipid Res 1983 Mar;24(3):229-44.
(121) Kalashnikova MM, Fadeeva EO. [Ultrastructural study of liver cells from rooks living in ecologically unfavorable areas]. Izv Akad Nauk Ser Biol 2006 Mar;(2):133-41.
(122) Novikoff AB, Novikoff PM, Rosen OM, Rubin CS. Organelle relationships in cultured 3T3-L1 preadipocytes. J Cell Biol 1980;87:180-96.
(123) Szymanski KM, Binns D, Bartz R, Grishin NV, Li WP, Agarwal AK, et al. The lipodystrophy protein seipin is found at endoplasmic reticulum lipid droplet junctions and is important for droplet morphology. Proc Natl Acad Sci U S A 2007 Dec 26;104(52):20890-5.
(124) Chang TY, Li BL, Chang CC, Urano Y. Acyl-coenzyme A:cholesterol acyltransferases. Am J Physiol Endocrinol Metab 2009 Jul;297(1):E1-E9.
(125) Smith SJ, Cases S, Jensen DR, Chen HC, Sande E, Tow B, et al. Obesity resistance and multiple mechanisms of triglyceride synthesis in mice lacking Dgat. Nat Genet 2000 May;25(1):87-90.
(126) Stone SJ, Levin MC, Farese RV, Jr. Membrane topology and identification of key functional amino acid residues of murine acyl-CoA:diacylglycerol acyltransferase-2. J Biol Chem 2006 Dec 29;281(52):40273-82.
(127) Wang H, Sztalryd C. Oxidative tissue: perilipin 5 links storage with the furnace. Trends Endocrinol Metab 2011 Jun;22(6):197-203.
(128) Brasaemle DL, Wolins NE. Packaging of fat: an evolving model of lipid droplet assembly and expansion. J Biol Chem 2012 Jan 20;287(4):2273-9.

References
105
(129) Marchesan D, Rutberg M, Andersson L, Asp L, Larsson T, Boren J, et al. A phospholipase D-dependent process forms lipid droplets containing caveolin, adipocyte differentiation-related protein, and vimentin in a cell-free system. J Biol Chem 2003 Jul 18;278(29):27293-300.
(130) Unger RH. Lipotoxic diseases. Annu Rev Med 2002;53:319-36.
(131) Schaffer JE. Lipotoxicity: when tissues overeat. Curr Opin Lipidol 2003 Jun;14(3):281-7.
(132) Olofsson SO, Bostrom P, Andersson L, Rutberg M, Perman J, Boren J. Lipid droplets as dynamic organelles connecting storage and efflux of lipids. Biochim Biophys Acta 2009 Jun;1791(6):448-58.
(133) Murphy DJ, Vance J. Mechanisms of lipid-body formation. Trends Biochem Sci 1999 Mar;24(3):109-15.
(134) Ploegh HL. A lipid-based model for the creation of an escape hatch from the endoplasmic reticulum. Nature 2007 Jul 26;448(7152):435-8.
(135) Waltermann M, Hinz A, Robenek H, Troyer D, Reichelt R, Malkus U, et al. Mechanism of lipid-body formation in prokaryotes: how bacteria fatten up. Mol Microbiol 2005 Feb;55(3):750-63.
(136) Wanner G, Formanek H, Theimer R R. The ontogeny of lipid bodies (spherosomes) in plant cells: ultrastructural evidence. Planta 1981;151:109-23.
(137) Zweytick D, Athenstaedt K, Daum G. Intracellular lipid particles of eukaryotic cells. Biochim Biophys Acta 2000 Sep 18;1469(2):101-20.
(138) Blanchette-Mackie EJ, Dwyer NK, Barber T, Coxey RA, Takeda T, Rondinone CM, et al. Perilipin is located on the surface layer of intracellular lipid droplets in adipocytes. J Lipid Res 1995 Jun;36(6):1211-26.
(139) Cushman SW. Structure-function relationships in the adipose cell. I. Ultrastructure of the isolated adipose cell. J Cell Biol 1970 Aug;46(2):326-41.
(140) Carman GM, Han GS. Phosphatidic acid phosphatase, a key enzyme in the regulation of lipid synthesis. J Biol Chem 2009 Jan 30;284(5):2593-7.
(141) Krisans SK, Mortensen RM, Lazarow PB. Acyl-CoA synthetase in rat liver peroxisomes. Computer-assisted analysis of cell fractionation experiments. J Biol Chem 1980 Oct 25;255(20):9599-607.
(142) Takeuchi K, Reue K. Biochemistry, physiology, and genetics of GPAT, AGPAT, and lipin enzymes in triglyceride synthesis. Am J Physiol Endocrinol Metab 2009 Jun;296(6):E1195-E1209.
(143) Yen CL, Stone SJ, Koliwad S, Harris C, Farese RV, Jr. Thematic review series: glycerolipids. DGAT enzymes and triacylglycerol biosynthesis. J Lipid Res 2008 Nov;49(11):2283-301.

References
106
(144) Wolins NE, Brasaemle DL, Bickel PE. A proposed model of fat packaging by exchangeable lipid droplet proteins. FEBS Lett 2006 Oct 9;580(23):5484-91.
(145) Brasaemle DL. Thematic review series: adipocyte biology. The perilipin family of structural lipid droplet proteins: stabilization of lipid droplets and control of lipolysis. J Lipid Res 2007 Dec;48(12):2547-59.
(146) Brown DA. Lipid droplets: proteins floating on a pool of fat. Curr Biol 2001 Jun 5;11(11):R446-R449.
(147) Welte MA, Gross SP, Postner M, Block SM, Wieschaus EF. Developmental regulation of vesicle transport in Drosophila embryos: forces and kinetics. Cell 1998 Feb 20;92(4):547-57.
(148) Bostrom P, Rutberg M, Ericsson J, Holmdahl P, Andersson L, Frohman MA, et al. Cytosolic lipid droplets increase in size by microtubule-dependent complex formation. Arterioscler Thromb Vasc Biol 2005 Sep;25(9):1945-51.
(149) Bostrom P, Andersson L, Rutberg M, Perman J, Lidberg U, Johansson BR, et al. SNARE proteins mediate fusion between cytosolic lipid droplets and are implicated in insulin sensitivity. Nat Cell Biol 2007 Nov;9(11):1286-93.
(150) Ohsaki Y, Cheng J, Suzuki M, Shinohara Y, Fujita A, Fujimoto T. Biogenesis of cytoplasmic lipid droplets: from the lipid ester globule in the membrane to the visible structure. Biochim Biophys Acta 2009 Jun;1791(6):399-407.
(151) Zimmermann R, Strauss JG, Haemmerle G, Schoiswohl G, Birner-Gruenberger R, Riederer M, et al. Fat mobilization in adipose tissue is promoted by adipose triglyceride lipase. Science 2004 Nov 19;306(5700):1383-6.
(152) Lass A, Zimmermann R, Haemmerle G, Riederer M, Schoiswohl G, Schweiger M, et al. Adipose triglyceride lipase-mediated lipolysis of cellular fat stores is activated by CGI-58 and defective in Chanarin-Dorfman Syndrome. Cell Metab 2006 May;3(5):309-19.
(153) Fredrikson G, Tornqvist H, Belfrage P. Hormone-sensitive lipase and monoacylglycerol lipase are both required for complete degradation of adipocyte triacylglycerol. Biochim Biophys Acta 1986 Apr 15;876(2):288-93.
(154) Granneman JG, Moore HP, Granneman RL, Greenberg AS, Obin MS, Zhu Z. Analysis of lipolytic protein trafficking and interactions in adipocytes. J Biol Chem 2007 Feb 23;282(8):5726-35.
(155) Granneman JG, Moore HP. Location, location: protein trafficking and lipolysis in adipocytes. Trends Endocrinol Metab 2008 Jan;19(1):3-9.
(156) Brasaemle DL, Subramanian V, Garcia A, Marcinkiewicz A, Rothenberg A. Perilipin A and the control of triacylglycerol metabolism. Mol Cell Biochem 2009 Jun;326(1-2):15-21.

References
107
(157) Jocken JW, Smit E, Goossens GH, Essers YP, van Baak MA, Mensink M, et al. Adipose triglyceride lipase (ATGL) expression in human skeletal muscle is type I (oxidative) fiber specific. Histochem Cell Biol 2008 Apr;129(4):535-8.
(158) Subramanian V, Rothenberg A, Gomez C, Cohen AW, Garcia A, Bhattacharyya S, et al. Perilipin A mediates the reversible binding of CGI-58 to lipid droplets in 3T3-L1 adipocytes. J Biol Chem 2004 Oct 1;279(40):42062-71.
(159) Akiyama M, Sakai K, Takayama C, Yanagi T, Yamanaka Y, McMillan JR, et al. CGI-58 is an alpha/beta-hydrolase within lipid transporting lamellar granules of differentiated keratinocytes. Am J Pathol 2008 Nov;173(5):1349-60.
(160) Badin PM, Loubiere C, Coonen M, Louche K, Tavernier G, Bourlier V, et al. Regulation of skeletal muscle lipolysis and oxidative metabolism by the co-lipase CGI-58. J Lipid Res 2012 May;53(5):839-48.
(161) Bartz R, Zehmer JK, Zhu M, Chen Y, Serrero G, Zhao Y, et al. Dynamic activity of lipid droplets: protein phosphorylation and GTP-mediated protein translocation. J Proteome Res 2007 Aug;6(8):3256-65.
(162) Beller M, Riedel D, Jansch L, Dieterich G, Wehland J, Jackle H, et al. Characterization of the Drosophila lipid droplet subproteome. Mol Cell Proteomics 2006 Jun;5(6):1082-94.
(163) Brasaemle DL, Dolios G, Shapiro L, Wang R. Proteomic analysis of proteins associated with lipid droplets of basal and lipolytically stimulated 3T3-L1 adipocytes. J Biol Chem 2004 Nov 5;279(45):46835-42.
(164) Liu P, Ying Y, Zhao Y, Mundy DI, Zhu M, Anderson RG. Chinese hamster ovary K2 cell lipid droplets appear to be metabolic organelles involved in membrane traffic. J Biol Chem 2004 Jan 30;279(5):3787-92.
(165) Sato S, Fukasawa M, Yamakawa Y, Natsume T, Suzuki T, Shoji I, et al. Proteomic profiling of lipid droplet proteins in hepatoma cell lines expressing hepatitis C virus core protein. J Biochem 2006 May;139(5):921-30.
(166) Wan HC, Melo RC, Jin Z, Dvorak AM, Weller PF. Roles and origins of leukocyte lipid bodies: proteomic and ultrastructural studies. FASEB J 2007 Jan;21(1):167-78.
(167) Bickel PE, Tansey JT, Welte MA. PAT proteins, an ancient family of lipid droplet proteins that regulate cellular lipid stores. Biochim Biophys Acta 2009 Jun;1791(6):419-40.
(168) Hsieh K, Lee YK, Londos C, Raaka BM, Dalen KT, Kimmel AR. Perilipin family members preferentially sequester to either triacylglycerol- or cholesteryl ester-specific intracellular lipid storage droplets. J Cell Sci 2012 Jun 8.
(169) Brasaemle DL. Thematic review series: adipocyte biology. The perilipin family of structural lipid droplet proteins: stabilization of lipid droplets and control of lipolysis. J Lipid Res 2007 Dec;48(12):2547-59.

References
108
(170) Hodges BD, Wu CC. Proteomic insights into an expanded cellular role for cytoplasmic lipid droplets. J Lipid Res 2010 Feb;51(2):262-73.
(171) Dalen KT, Dahl T, Holter E, Arntsen B, Londos C, Sztalryd C, et al. LSDP5 is a PAT protein specifically expressed in fatty acid oxidizing tissues. Biochim Biophys Acta 2007 Feb;1771(2):210-27.
(172) Kimmel AR, Brasaemle DL, McAndrews-Hill M, Sztalryd C, Londos C. Adoption of PERILIPIN as a unifying nomenclature for the mammalian PAT-family of intracellular lipid storage droplet proteins. J Lipid Res 2010 Mar;51(3):468-71.
(173) Garcia A, Sekowski A, Subramanian V, Brasaemle DL. The central domain is required to target and anchor perilipin A to lipid droplets. J Biol Chem 2003 Jan 3;278(1):625-35.
(174) Subramanian V, Garcia A, Sekowski A, Brasaemle DL. Hydrophobic sequences target and anchor perilipin A to lipid droplets. J Lipid Res 2004 Nov;45(11):1983-91.
(175) Zhang HH, Souza SC, Muliro KV, Kraemer FB, Obin MS, Greenberg AS. Lipase-selective functional domains of perilipin A differentially regulate constitutive and protein kinase A-stimulated lipolysis. J Biol Chem 2003 Dec 19;278(51):51535-42.
(176) Dalen KT, Schoonjans K, Ulven SM, Weedon-Fekjaer MS, Bentzen TG, Koutnikova H, et al. Adipose tissue expression of the lipid droplet-associating proteins S3-12 and perilipin is controlled by peroxisome proliferator-activated receptor-gamma. Diabetes 2004 May;53(5):1243-52.
(177) Wang H, Bell M, Sreenevasan U, Hu H, Liu J, Dalen K, et al. Unique regulation of adipose triglyceride lipase (ATGL) by perilipin 5, a lipid droplet-associated protein. J Biol Chem 2011 May 6;286(18):15707-15.
(178) Greenberg AS, Egan JJ, Wek SA, Moos MC, Jr., Londos C, Kimmel AR. Isolation of cDNAs for perilipins A and B: sequence and expression of lipid droplet-associated proteins of adipocytes. Proc Natl Acad Sci U S A 1993 Dec 15;90(24):12035-9.
(179) Lu X, Gruia-Gray J, Copeland NG, Gilbert DJ, Jenkins NA, Londos C, et al. The murine perilipin gene: the lipid droplet-associated perilipins derive from tissue-specific, mRNA splice variants and define a gene family of ancient origin. Mamm Genome 2001 Sep;12(9):741-9.
(180) Greenberg AS, Egan JJ, Wek SA, Garty NB, Blanchette-Mackie EJ, Londos C. Perilipin, a major hormonally regulated adipocyte-specific phosphoprotein associated with the periphery of lipid storage droplets. J Biol Chem 1991 Jun 15;266(17):11341-6.
(181) Egan JJ, Greenberg AS, Chang MK, Londos C. Control of endogenous phosphorylation of the major cAMP-dependent protein kinase substrate in adipocytes by insulin and beta-adrenergic stimulation. J Biol Chem 1990 Nov 5;265(31):18769-75.

References
109
(182) Aboulaich N, Vener AV, Stralfors P. Hormonal control of reversible translocation of perilipin B to the plasma membrane in primary human adipocytes. J Biol Chem 2006 Apr 28;281(17):11446-9.
(183) Brasaemle DL, Rubin B, Harten IA, Gruia-Gray J, Kimmel AR, Londos C. Perilipin A increases triacylglycerol storage by decreasing the rate of triacylglycerol hydrolysis. J Biol Chem 2000 Dec 8;275(49):38486-93.
(184) Servetnick DA, Brasaemle DL, Gruia-Gray J, Kimmel AR, Wolff J, Londos C. Perilipins are associated with cholesteryl ester droplets in steroidogenic adrenal cortical and Leydig cells. J Biol Chem 1995 Jul 14;270(28):16970-3.
(185) Nishiu J, Tanaka T, Nakamura Y. Isolation and chromosomal mapping of the human homolog of perilipin (PLIN), a rat adipose tissue-specific gene, by differential display method. Genomics 1998 Mar 1;48(2):254-7.
(186) Lafontan M. Advances in adipose tissue metabolism. Int J Obes (Lond) 2008 Dec;32 Suppl 7:S39-S51.
(187) Steinberg D, Huttunen JK. The role of cyclic AMP in activation of hormone-sensitive lipase of adipose tissue. Adv Cyclic Nucleotide Res 1972;1:47-62.
(188) Miyoshi H, Perfield JW, Souza SC, Shen WJ, Zhang HH, Stancheva ZS, et al. Control of adipose triglyceride lipase action by serine 517 of perilipin A globally regulates protein kinase A-stimulated lipolysis in adipocytes. J Biol Chem 2007 Jan 12;282(2):996-1002.
(189) Yamaguchi T, Omatsu N, Matsushita S, Osumi T. CGI-58 interacts with perilipin and is localized to lipid droplets. Possible involvement of CGI-58 mislocalization in Chanarin-Dorfman syndrome. J Biol Chem 2004 Jul 16;279(29):30490-7.
(190) Yamaguchi T, Omatsu N, Morimoto E, Nakashima H, Ueno K, Tanaka T, et al. CGI-58 facilitates lipolysis on lipid droplets but is not involved in the vesiculation of lipid droplets caused by hormonal stimulation. J Lipid Res 2007 May;48(5):1078-89.
(191) Watt MJ, Steinberg GR. Regulation and function of triacylglycerol lipases in cellular metabolism. Biochem J 2008 Sep 15;414(3):313-25.
(192) Degerman E, Smith CJ, Tornqvist H, Vasta V, Belfrage P, Manganiello VC. Evidence that insulin and isoprenaline activate the cGMP-inhibited low-Km cAMP phosphodiesterase in rat fat cells by phosphorylation. Proc Natl Acad Sci U S A 1990 Jan;87(2):533-7.
(193) Smith CJ, Vasta V, Degerman E, Belfrage P, Manganiello VC. Hormone-sensitive cyclic GMP-inhibited cyclic AMP phosphodiesterase in rat adipocytes. Regulation of insulin- and cAMP-dependent activation by phosphorylation. J Biol Chem 1991 Jul 15;266(20):13385-90.
(194) Jiang HP, Harris SE, Serrero G. Molecular cloning of a differentiation-related mRNA in the adipogenic cell line 1246. Cell Growth Differ 1992 Jan;3(1):21-30.

References
110
(195) Jiang HP, Serrero G. Isolation and characterization of a full-length cDNA coding for an adipose differentiation-related protein. Proc Natl Acad Sci U S A 1992 Sep 1;89(17):7856-60.
(196) Brasaemle DL, Barber T, Wolins NE, Serrero G, Blanchette-Mackie EJ, Londos C. Adipose differentiation-related protein is an ubiquitously expressed lipid storage droplet-associated protein. J Lipid Res 1997 Nov;38(11):2249-63.
(197) Chawla A, Lee CH, Barak Y, He W, Rosenfeld J, Liao D, et al. PPARdelta is a very low-density lipoprotein sensor in macrophages. Proc Natl Acad Sci U S A 2003 Feb 4;100(3):1268-73.
(198) Targett-Adams P, McElwee MJ, Ehrenborg E, Gustafsson MC, Palmer CN, McLauchlan J. A PPAR response element regulates transcription of the gene for human adipose differentiation-related protein. Biochim Biophys Acta 2005 Apr 5;1728(1-2):95-104.
(199) Dalen KT, Ulven SM, Arntsen BM, Solaas K, Nebb HI. PPARalpha activators and fasting induce the expression of adipose differentiation-related protein in liver. J Lipid Res 2006 May;47(5):931-43.
(200) Edvardsson U, Ljungberg A, Linden D, William-Olsson L, Peilot-Sjogren H, Ahnmark A, et al. PPARalpha activation increases triglyceride mass and adipose differentiation-related protein in hepatocytes. J Lipid Res 2006 Feb;47(2):329-40.
(201) Targett-Adams P, Chambers D, Gledhill S, Hope RG, Coy JF, Girod A, et al. Live cell analysis and targeting of the lipid droplet-binding adipocyte differentiation-related protein. J Biol Chem 2003 May 2;278(18):15998-6007.
(202) Gross DN, Miyoshi H, Hosaka T, Zhang HH, Pino EC, Souza S, et al. Dynamics of lipid droplet-associated proteins during hormonally stimulated lipolysis in engineered adipocytes: stabilization and lipid droplet binding of adipocyte differentiation-related protein/adipophilin. Mol Endocrinol 2006 Feb;20(2):459-66.
(203) Masuda Y, Itabe H, Odaki M, Hama K, Fujimoto Y, Mori M, et al. ADRP/adipophilin is degraded through the proteasome-dependent pathway during regression of lipid-storing cells. J Lipid Res 2006 Jan;47(1):87-98.
(204) Xu G, Sztalryd C, Lu X, Tansey JT, Gan J, Dorward H, et al. Post-translational regulation of adipose differentiation-related protein by the ubiquitin/proteasome pathway. J Biol Chem 2005 Dec 30;280(52):42841-7.
(205) Chang BH, Li L, Paul A, Taniguchi S, Nannegari V, Heird WC, et al. Protection against fatty liver but normal adipogenesis in mice lacking adipose differentiation-related protein. Mol Cell Biol 2006 Feb;26(3):1063-76.
(206) Sztalryd C, Bell M, Lu X, Mertz P, Hickenbottom S, Chang BH, et al. Functional compensation for adipose differentiation-related protein (ADFP) by Tip47 in an ADFP null embryonic cell line. J Biol Chem 2006 Nov 10;281(45):34341-8.

References
111
(207) Bell M, Fried SK, Londos C, Sztalryd C. ADRP and Tip-47 down-regulation results in abnormal lipid droplet morphology, lipid metabolism and insulin-stimulated Akt phosphorylation in cultured liver cells. Diabetes 2006 Jun;55:A326.
(208) Wolins NE, Rubin B, Brasaemle DL. TIP47 associates with lipid droplets. J Biol Chem 2001 Feb 16;276(7):5101-8.
(209) Wolins NE, Quaynor BK, Skinner JR, Schoenfish MJ, Tzekov A, Bickel PE. S3-12, Adipophilin, and TIP47 package lipid in adipocytes. J Biol Chem 2005 May 13;280(19):19146-55.
(210) Miura S, Gan JW, Brzostowski J, Parisi MJ, Schultz CJ, Londos C, et al. Functional conservation for lipid storage droplet association among Perilipin, ADRP, and TIP47 (PAT)-related proteins in mammals, Drosophila, and Dictyostelium. J Biol Chem 2002 Aug 30;277(35):32253-7.
(211) Than NG, Sumegi B, Bellyei S, Berki T, Szekeres G, Janaky T, et al. Lipid droplet and milk lipid globule membrane associated placental protein 17b (PP17b) is involved in apoptotic and differentiation processes of human epithelial cervical carcinoma cells. Eur J Biochem 2003 Mar;270(6):1176-88.
(212) Diaz E, Pfeffer SR. TIP47: a cargo selection device for mannose 6-phosphate receptor trafficking. Cell 1998 May 1;93(3):433-43.
(213) Carroll KS, Hanna J, Simon I, Krise J, Barbero P, Pfeffer SR. Role of Rab9 GTPase in facilitating receptor recruitment by TIP47. Science 2001 May 18;292(5520):1373-6.
(214) Bulankina AV, Deggerich A, Wenzel D, Mutenda K, Wittmann JG, Rudolph MG, et al. TIP47 functions in the biogenesis of lipid droplets. J Cell Biol 2009 May 18;185(4):641-55.
(215) Wolins NE, Skinner JR, Schoenfish MJ, Tzekov A, Bensch KG, Bickel PE. Adipocyte protein S3-12 coats nascent lipid droplets. J Biol Chem 2003 Sep 26;278(39):37713-21.
(216) Gjelstad IM, Haugen F, Gulseth HL, Norheim F, Jans A, Bakke SS, et al. Expression of perilipins in human skeletal muscle in vitro and in vivo in relation to diet, exercise and energy balance. Arch Physiol Biochem 2011 Nov 25.
(217) Scherer PE, Bickel PE, Kotler M, Lodish HF. Cloning of cell-specific secreted and surface proteins by subtractive antibody screening. Nat Biotechnol 1998 Jun;16(6):581-6.
(218) Wolins NE, Quaynor BK, Skinner JR, Tzekov A, Croce MA, Gropler MC, et al. OXPAT/PAT-1 is a PPAR-induced lipid droplet protein that promotes fatty acid utilization. Diabetes 2006 Dec;55(12):3418-28.
(219) Yamaguchi T, Matsushita S, Motojima K, Hirose F, Osumi T. MLDP, a novel PAT family protein localized to lipid droplets and enriched in the heart, is regulated by peroxisome proliferator-activated receptor alpha. J Biol Chem 2006 May 19;281(20):14232-40.
References
112
(220) Wang H, Sreenevasan U, Hu H, Saladino A, Polster BM, Lund LM, et al. Perilipin 5, a lipid droplet-associated protein, provides physical and metabolic linkage to mitochondria. J Lipid Res 2011 Dec;52(12):2159-68.
(221) Granneman JG, Moore HP, Mottillo EP, Zhu Z, Zhou L. Interactions of perilipin-5 (Plin5) with adipose triglyceride lipase. J Biol Chem 2011 Feb 18;286(7):5126-35.
(222) Wang H, Hu L, Dalen K, Dorward H, Marcinkiewicz A, Russell D, et al. Activation of hormone-sensitive lipase requires two steps, protein phosphorylation and binding to the PAT-1 domain of lipid droplet coat proteins. J Biol Chem 2009 Nov 13;284(46):32116-25.
(223) Granneman JG, Moore HP, Mottillo EP, Zhu Z. Functional interactions between Mldp (LSDP5) and Abhd5 in the control of intracellular lipid accumulation. J Biol Chem 2009 Jan 30;284(5):3049-57.
(224) Bosma M, Minnaard R, Sparks LM, Schaart G, Losen M, de Baets MH, et al. The lipid droplet coat protein perilipin 5 also localizes to muscle mitochondria. Histochem Cell Biol 2012 Feb;137(2):205-16.
(225) Wikipedia Tfe. Transformation (genetics). 1-1-2012. 5-1-2012. Ref Type: Online Source
(226) Hanahan D. Studies on Transformation of Escherichia-Coli with Plasmids. Journal of Molecular Biology 1983;166(4):557-80.
(227) Cohen SN, Chang AC, Hsu L. Nonchromosomal antibiotic resistance in bacteria: genetic transformation of Escherichia coli by R-factor DNA. Proc Natl Acad Sci U S A 1972 Aug;69(8):2110-4.
(228) Wong TK, Neumann E. Electric field mediated gene transfer. Biochem Biophys Res Commun 1982 Jul 30;107(2):584-7.
(229) Fiedler S, Wirth R. Transformation of bacteria with plasmid DNA by electroporation. Anal Biochem 1988 Apr;170(1):38-44.
(230) Chassy BM, Mercenier A, Flickinger J. Transformation of Bacteria by Electroporation. Trends in Biotechnology 1988 Dec;6(12):303-9.
(231) Pierce BA. Genetics a conceptual approach. Second ed ed. New York: W.H. Freeman; 2005.
(232) Agilent Technologies - Stratagene Products Division. QuikChange II Site-Directed Mutagenesis Kit. 2012.
Ref Type: Online Source
(233) Yaffe D, Saxel O. Serial passaging and differentiation of myogenic cells isolated from dystrophic mouse muscle. Nature 1977 Dec 22;270(5639):725-7.
(234) A Guide to Plasmid DNA Transfection. 2012. 26-3-2012. Ref Type: Online Source

References
113
(235) Introduction to Fluorescent Proteins. 2012. 26-3-2012. Ref Type: Online Source
(236) Fan F, Wood KV. Bioluminescent assays for high-throughput screening. Assay Drug Dev Technol 2007 Feb;5(1):127-36.
(237) Gibson UE, Heid CA, Williams PM. A novel method for real time quantitative RT-PCR. Genome Res 1996 Oct;6(10):995-1001.
(238) Narkar VA, Fan W, Downes M, Yu RT, Jonker JW, Alaynick WA, et al. Exercise and PGC-1alpha-independent synchronization of type I muscle metabolism and vasculature by ERRgamma. Cell Metab 2011 Mar 2;13(3):283-93.
(239) Rangwala SM, Wang X, Calvo JA, Lindsley L, Zhang Y, Deyneko G, et al. Estrogen-related receptor gamma is a key regulator of muscle mitochondrial activity and oxidative capacity. J Biol Chem 2010 Jul 16;285(29):22619-29.
(240) Minnaard R, Schrauwen P, Schaart G, Jorgensen JA, Lenaers E, Mensink M, et al. Adipocyte differentiation-related protein and OXPAT in rat and human skeletal muscle: involvement in lipid accumulation and type 2 diabetes mellitus. J Clin Endocrinol Metab 2009 Oct;94(10):4077-85.
(241) Shaw CS, Sherlock M, Stewart PM, Wagenmakers AJ. Adipophilin distribution and colocalization with lipid droplets in skeletal muscle. Histochem Cell Biol 2009 May;131(5):575-81.
(242) Gaster M, Kristensen SR, Beck-Nielsen H, Schroder HD. A cellular model system of differentiated human myotubes. APMIS 2001 Nov;109(11):735-44.
(243) Johnson MA, Polgar J, Weightman D, Appleton D. Data on the distribution of fibre types in thirty-six human muscles. An autopsy study. J Neurol Sci 1973 Jan;18(1):111-29.
(244) van Loon LJ, Koopman R, Manders R, van der Weegen W, van Kranenburg GP, Keizer HA. Intramyocellular lipid content in type 2 diabetes patients compared with overweight sedentary men and highly trained endurance athletes. Am J Physiol Endocrinol Metab 2004 Sep;287(3):E558-E565.
(245) Pallant J. SPSS survival manual - a step by step guide to data analysing using SPSS for Windows. 3rd ed ed. Maidenhead: McGraw-Hill ; Open University Press; 2007.
(246) Kirkwood BR, Sterne JAC. Essential medical statistics. 2nd ed ed. Malden: Blackwell; 2003.
(247) Braissant O, Foufelle F, Scotto C, Dauca M, Wahli W. Differential expression of peroxisome proliferator-activated receptors (PPARs): tissue distribution of PPAR-alpha, -beta, and -gamma in the adult rat. Endocrinology 1996 Jan;137(1):354-66.
(248) Giguere V. Transcriptional control of energy homeostasis by the estrogen-related receptors. Endocr Rev 2008 Oct;29(6):677-96.

References
114
(249) Hondares E, Pineda-Torra I, Iglesias R, Staels B, Villarroya F, Giralt M. PPARdelta, but not PPARalpha, activates PGC-1alpha gene transcription in muscle. Biochem Biophys Res Commun 2007 Mar 23;354(4):1021-7.
(250) Seth A, Steel JH, Nichol D, Pocock V, Kumaran MK, Fritah A, et al. The transcriptional corepressor RIP140 regulates oxidative metabolism in skeletal muscle. Cell Metab 2007 Sep;6(3):236-45.
(251) Hallberg M, Morganstein DL, Kiskinis E, Shah K, Kralli A, Dilworth SM, et al. A functional interaction between RIP140 and PGC-1alpha regulates the expression of the lipid droplet protein CIDEA. Mol Cell Biol 2008 Nov;28(22):6785-95.
(252) Fritah A, Christian M, Parker MG. The metabolic coregulator RIP140: an update. Am J Physiol Endocrinol Metab 2010 Sep;299(3):E335-E340.
(253) Yamamoto H, Williams EG, Mouchiroud L, Canto C, Fan W, Downes M, et al. NCoR1 is a conserved physiological modulator of muscle mass and oxidative function. Cell 2011 Nov 11;147(4):827-39.
(254) Arany Z, Foo SY, Ma Y, Ruas JL, Bommi-Reddy A, Girnun G, et al. HIF-independent regulation of VEGF and angiogenesis by the transcriptional coactivator PGC-1alpha. Nature 2008 Feb 21;451(7181):1008-12.
(255) Jager S, Handschin C, St-Pierre J, Spiegelman BM. AMP-activated protein kinase (AMPK) action in skeletal muscle via direct phosphorylation of PGC-1alpha. Proc Natl Acad Sci U S A 2007 Jul 17;104(29):12017-22.
(256) Steinberg GR, Kemp BE. AMPK in Health and Disease. Physiol Rev 2009 Jul;89(3):1025-78.

Appendix A
115
Appendix A Table 13: Protocols used.
# Kit Cat.No Link to protocol 1
JETSTAR 2.0 Plasmid Midiprep Kit
210050 http://www.genomed-dna.com/pdf/Star-PDFs/JETSTAR-Protocol.PDF
2
NucleoSpin® Plasmid (NoLid)
740499.50 http://www.mn-net.com/Portals/8/attachments/Redakteure_Bio/Protocols/Plasmid%20DNA%20Purification/UM_pDNA_NS.pdf
3
QuikChange® II Site-Directed Mutagenesis Kit
200524 http://www.chem.uky.edu/courses/che554/quikchange.pdf
4
Isolation of Total RNA
4330254 http://www3.appliedbiosystems.com/cms/groups/mcb_support/documents/generaldocuments/cms_041237.pdf
5
Lipofectamine™ 2000
11668-027 http://tools.invitrogen.com/content/sfs/manuals/lipofectamine2000_man.pdf
6
Dual Luciferase
E1960 http://www.promega.com/resources/protocols/technical-manuals/0/dual-luciferase-reporter-assay-system-protocol/
7
High cap. cDNA transcription kit
4368813 http://www3.appliedbiosystems.com/cms/groups/mcb_support/documents/generaldocuments/cms_042557.pdf
8
qRT-PCR TaqMan Assay
4333458 http://www3.appliedbiosystems.com/cms/groups/mcb_support/documents/generaldocuments/cms_041280.pdf

Appendix B
116
Appendix B
Figure #1:
The full-length Plin5 reporter (pcDNA3-Plin5-Luc [-2344 to +244]) was transiently
transfected into C2C12 cells and co-transfected with empty vector (control), PPARα or
PPARδ (Appendix B figure # 1). After two days of differentiation the medium was replaced
with fresh medium containing vehicle (DMSO) or a PPAR-agonists (GW501516; 0.1 µM or
WY-14643;10 µM). Cells were lysed and harvested four days after transfection. The
transcriptional activity of the Plin5 promoter was elevated when ligands were added.
However, the effects of PPARδ overexpression and stimulation did not turn out to be
significant in this experiment. The transcriptional activity of the Plin5 promoter was
significantly increased when overexpressing PPARα or PPARδ.
Appendix B figure # 1: Transient transfection with full-length Plin5 promoter, co-transfected with no expression plasmid (empty), PPARα, or PPARδ expression vectors. After two days of differentiation cells were stimulated with the PPARα-ligand WY- 14643 (10µM; WY) or the PPARδ-ligand GW501516 (0.1 µM; GW) for 24 hours. The experiment was run in triplicates and performed once. PPARα; peroxisome proliferator-activated receptor α, PPARδ; peroxisome proliferator-activated receptor δ. Results are presented as Mean±SD. (** P < 0.01).

Appendix B
117
Figure # 2:
Different constructs of the Plin5 promoter sequence (the full-length wild-type Plin5 reporter
pcDNA3-Plin5-Luc [-2344 to +244], deletion constructs or a mutated construct ) (Figure 29)
was transiently transfected into C2C12 cells and co-transfected with empty vector, RXR, or
RXR+PPARα expression plasmids. Two days after start of differentiation, the medium was
replaced with fresh medium containing vehicle (DMSO) or a PPAR agonist (WY-14643; 10
µM). There was no difference in the transcriptional activity of the Plin5 promoter between the
full-length wild-type promoter and the other promoter constructs (Appendix B figure # 2).
Two statistical tests were performed within each promoter group, comparing empty vector
with RXR+PPARα and empty vector with RXR+PPARα+ligand, and the significant 0.05-
level was adjusted to 0.025, and the 0.01-level to 0.005 after Bonferroni-correction.
This implies that the PPARs regulate the expression of Plin5 through a different PPRE in a
different region of the promoter than the deleted and mutated areas tested in these
experiments.

Appendix B
118
Appendix B figure # 2: Transient transfection with full-length (M12-1), deletion (M12-2; m-Plin5 SacI deletion and M12-3; m-Plin5 BgI II- deletion) or mutated (M12-4) Plin5 promoter constructs, co-transfected with no expression plasmid (Empty), RXR, or RXR and PPARδ expression vectors. Cells were stimulated with the vehicle (DMSO) or the PPARδ-ligand GW501516 (0.1 µM). The experiment was run in triplicates and performed once. Results are presented as Mean±SD. Within each promoter group three statistical tests were performed (empty versus the three different vector groups) with subsequent Bonferroni correction. (* P < 0.05, ** P < 0.01, *** P < 0.001). The P-value for the statistical difference between RXR+PPARα and empty vector for the M12-3 promoter construct, and between RXR+PPARα+ligand and empty vector for the M12-4 promoter construct, was 0.026 and 0.027 respectively. This is at the 0.05 border-line after Bonferroni-correction (p < 0.025 corresponds to P< 0.05).