Identification of the critical residues responsible for...
17
rsob.royalsocietypublishing.org Research Cite this article: Rodrı ´guez-Bolan ˜os M, Cabrera N, Perez-Montfort R. 2016 Identification of the critical residues responsible for differential reactivation of the triosephosphate isomerases of two trypanosomes. Open Biol. 6: 160161. http://dx.doi.org/10.1098/rsob.160161 Received: 1 June 2016 Accepted: 20 September 2016 Subject Area: biochemistry/biophysics Keywords: triosephosphate isomerase, critical residues, reactivation, protein folding, guanidine hydrochloride, site-directed mutagenesis Author for correspondence: Ruy Perez-Montfort e-mail: [email protected] † This paper is dedicated to the memory of Dr Armando Go ´mez-Puyou. Identification of the critical residues responsible for differential reactivation of the triosephosphate isomerases of two trypanosomes Monica Rodrı ´guez-Bolan ˜os, Nallely Cabrera and Ruy Perez-Montfort † Departamento de Bioquı ´mica y Biologı ´a Estructural, Instituto de Fisiologı ´a Celular, Universidad Nacional Auto ´noma de Me ´xico, Av. Universidad 3000, Coyoaca ´n, 04510 Me ´xico DF, Me ´xico RP-M, 0000-0003-0810-1159 The reactivation of triosephosphate isomerase (TIM) from unfolded mono- mers induced by guanidine hydrochloride involves different amino acids of its sequence in different stages of protein refolding. We describe a systematic mutagenesis method to find critical residues for certain physico-chemical properties of a protein. The two similar TIMs of Trypanosoma brucei and Trypanosoma cruzi have different reactivation velocities and efficiencies. We used a small number of chimeric enzymes, additive mutants and planned site-directed mutants to produce an enzyme from T. brucei with 13 mutations in its sequence, which reactivates fast and efficiently like wild-type (WT) TIM from T. cruzi, and another enzyme from T. cruzi, with 13 slightly altered mutations, which reactivated slowly and inefficiently like the WT TIM of T. brucei. Our method is a shorter alternative to random mutagenesis, satur- ation mutagenesis or directed evolution to find multiple amino acids critical for certain properties of proteins. 1. Introduction It is generally anticipated that proteins with very similar sequences will also exhibit similar functional and physico-chemical properties. Although this is commonly true, some proteins that have a high sequence identity and great functional and structural similarity can have important quantitative differences in some phy- sico-chemical properties such as protein folding or protein reactivation. Such is the case for the triosephosphate isomerases (TIMs) from Trypanosoma brucei and T. cruzi. These two trypanosomes diverged around 100 million years before the pre- sent [1] and thus many of their proteins have high similarity in their sequences. In the case of their TIMs, they have 73.9% identity and a sequence similarity of 92.4%. The three-dimensional structures for both enzymes have been determined and they superpose with an RMSD of 0.96 A ˚ . TIM is the prototype of the (b/a) 8 barrel fold family of proteins. It is a homodimer and, even though each monomer contains the three amino acids of the catalytic site—K13, H95 and E167, using the numbering of the sequence of TIM from T. brucei (TbTIM)—it is active only in the dimeric form. TbTIM has a sequence of 250 amino acids, and TIM from T. cruzi has a sequence of 251 amino acids. For simplification purposes, the numbering of the sequence of TbTIM is used in this work. We have previously reported that TbTIM and TcTIM show quantitative and qualitative differences in their susceptibility to diges- tion with subtilisin [2] and quantitative differences in their susceptibility to several low molecular weight agents [3], and in particular to sulfhydryl reagents [4–8]. Another quantitative difference has been reported in their velocity and extent of reactivation from guanidine chloride (GdnHCl) unfolded monomers [9]. The denaturation pathway of TIM from several species has been widely studied [10–13]. Several papers describe it as a three-state process [11,13] in & 2016 The Authors. Published by the Royal Society under the terms of the Creative Commons Attribution License http://creativecommons.org/licenses/by/4.0/, which permits unrestricted use, provided the original author and source are credited. on November 8, 2018 http://rsob.royalsocietypublishing.org/ Downloaded from on November 8, 2018 http://rsob.royalsocietypublishing.org/ Downloaded from on November 8, 2018 http://rsob.royalsocietypublishing.org/ Downloaded from
Transcript of Identification of the critical residues responsible for...

on November 8, 2018http://rsob.royalsocietypublishing.org/Downloaded from on November 8, 2018http://rsob.royalsocietypublishing.org/Downloaded from on November 8, 2018http://rsob.royalsocietypublishing.org/Downloaded from
rsob.royalsocietypublishing.org
ResearchCite this article: Rodrıguez-Bolanos M,
Cabrera N, Perez-Montfort R. 2016
Identification of the critical residues
responsible for differential reactivation
of the triosephosphate isomerases of
two trypanosomes. Open Biol. 6: 160161.
http://dx.doi.org/10.1098/rsob.160161
Received: 1 June 2016
Accepted: 20 September 2016
Subject Area:biochemistry/biophysics
Keywords:triosephosphate isomerase, critical residues,
reactivation, protein folding, guanidine
hydrochloride, site-directed mutagenesis
Author for correspondence:Ruy Perez-Montfort
e-mail: [email protected]
†This paper is dedicated to the memory
of Dr Armando Gomez-Puyou.
& 2016 The Authors. Published by the Royal Society under the terms of the Creative Commons AttributionLicense http://creativecommons.org/licenses/by/4.0/, which permits unrestricted use, provided the originalauthor and source are credited.
Identification of the critical residuesresponsible for differential reactivationof the triosephosphate isomerases oftwo trypanosomes
Monica Rodrıguez-Bolanos, Nallely Cabrera and Ruy Perez-Montfort†
Departamento de Bioquımica y Biologıa Estructural, Instituto de Fisiologıa Celular, Universidad NacionalAutonoma de Mexico, Av. Universidad 3000, Coyoacan, 04510 Mexico DF, Mexico
RP-M, 0000-0003-0810-1159
The reactivation of triosephosphate isomerase (TIM) from unfolded mono-
mers induced by guanidine hydrochloride involves different amino acids of
its sequence in different stages of protein refolding. We describe a systematic
mutagenesis method to find critical residues for certain physico-chemical
properties of a protein. The two similar TIMs of Trypanosoma brucei and
Trypanosoma cruzi have different reactivation velocities and efficiencies. We
used a small number of chimeric enzymes, additive mutants and planned
site-directed mutants to produce an enzyme from T. brucei with 13 mutations
in its sequence, which reactivates fast and efficiently like wild-type (WT) TIM
from T. cruzi, and another enzyme from T. cruzi, with 13 slightly altered
mutations, which reactivated slowly and inefficiently like the WT TIM of
T. brucei. Our method is a shorter alternative to random mutagenesis, satur-
ation mutagenesis or directed evolution to find multiple amino acids critical
for certain properties of proteins.
1. IntroductionIt is generally anticipated that proteins with very similar sequences will also exhibit
similar functional and physico-chemical properties. Although this is commonly
true, some proteins that have a high sequence identity and great functional and
structural similarity can have important quantitative differences in some phy-
sico-chemical properties such as protein folding or protein reactivation. Such is
the case for the triosephosphate isomerases (TIMs) from Trypanosoma brucei and
T. cruzi. These two trypanosomes diverged around 100 million years before the pre-
sent [1] and thus many of their proteins have high similarity in their sequences. In
the case of their TIMs, they have 73.9% identity and a sequence similarity of 92.4%.
The three-dimensional structures for both enzymes have been determined and they
superpose with an RMSD of 0.96 A. TIM is the prototype of the (b/a)8 barrel fold
family of proteins. It is a homodimer and, even though each monomer contains the
three amino acids of the catalytic site—K13, H95 and E167, using the numbering of
the sequence of TIM from T. brucei (TbTIM)—it is active only in the dimeric form.
TbTIM has a sequence of 250 amino acids, and TIM from T. cruzi has a sequence of
251 amino acids. For simplification purposes, the numbering of the sequence of
TbTIM is used in this work. We have previously reported that TbTIM and
TcTIM show quantitative and qualitative differences in their susceptibility to diges-
tion with subtilisin [2] and quantitative differences in their susceptibility to several
low molecular weight agents [3], and in particular to sulfhydryl reagents [4–8].
Another quantitative difference has been reported in their velocity and extent of
reactivation from guanidine chloride (GdnHCl) unfolded monomers [9].
The denaturation pathway of TIM from several species has been widely
studied [10–13]. Several papers describe it as a three-state process [11,13] in

rsob.royalsocietypublishing.orgOpen
Biol.6:160161
2
on November 8, 2018http://rsob.royalsocietypublishing.org/Downloaded from
which first the dimers dissociate into monomers that have no
catalytic activity but retain considerable tertiary structure,
and afterwards the monomers unfold completely. The reacti-
vation of TIM from GdnHCl unfolded monomers has also
been studied [9,14–16]. In this case, and in particular for
TbTIM and TcTIM, the monomers refold upon the removal
of the denaturant and subsequently form an intermediate
dimer that undergoes internal rearrangements to yield the
native and active dimer. This three-state process occurs in
both enzymes and despite their great sequence similarity,
the reactivation of TcTIM is two to three times faster and
approximately 30% more efficient than for TbTIM [9].
In this work, we used a new method, based on the one pre-
viously described by Garcıa-Torres et al. [17], of progressive
grafting of different portions of one of these two homologous
proteins to the equivalent region of the other protein, to ident-
ify the parts of the TIMs that participate in the quantitative
differences observed in the reactivation of both proteins. The
strategy also used ‘additive’ and systematic site-directed muta-
genesis to identify the role of individual amino acids involved
in the occurrence, control, extent and speed of the differences
in reactivation shown by these two proteins. In the end, we
were able to produce an enzyme with 95% of the sequence
of TbTIM that had 13 mutations within the first 60 amino
acids of that sequence, which had a reactivation behaviour
comparable with (and even slightly more efficient than) that
of wild-type (WT) TcTIM. We were also able to produce
another enzyme with 95% of the sequence of TcTIM with
slightly different mutations, also in the first 60 amino acids
of its sequence, which had a slow and inefficient reactivation
pattern comparable to that of WT TbTIM. Our experiments
allowed us to pinpoint all the amino acids that are critical
for this quantifiable physico-chemical behaviour.
2. Material and methods2.1. Design of the genes of chimeric proteins and
production of ‘additive’ mutantsThe design of the genes for the chimeric proteins was
described in detail by Garcıa-Torres et al. [17]. Briefly, the
DNA sequences X03921 for TbTIM and U53867 for TcTIM
were used to construct the chimeric proteins. The sequences
of TbTIM and TcTIM were divided into eight regions,
roughly encompassing one beta sheet one loop and one
alpha helix (for the exact distribution, see figure 1 in [17]).
Thus, initially, six chimeric enzymes were constructed. The
nomenclature used in this work for the chimeric proteins is
as follows: TcTIM1–6;TbTIM7,8 has the sequence of regions
1–6 of TcTIM, and the sequence of regions 7 and 8 of
TbTIM; or TcTIM1,2;TbTIM3–8 has the sequence of regions
1 and 2 of TcTIM and the sequence of regions 3–8 of
TbTIM, etc. (table 1a). The genes, for chimeras TcTIM1–
6;TbTIM7,8, TcTIM1–5;TbTIM6–8, TcTIM1–4;TbTIM5–8,
TcTIM2–8;TbTIM1, TcTIM1,3–8;TbTIM2 and TcTIM2;Tb-
TIM1,3–8, were synthesized by GENSCRIPT (Piscataway, NJ).
Other chimeras used in this work, which include TcTIM1–
3;TbTIM4–8, TcTIM1,2;TbTIM3–8 and TcTIM1;TbTIM2–8,
were made as described by Garcıa-Torres et al. [17]. The
gene of chimeric protein TcTIM3–8;TbTIM1,2 was made
with three PCRs using Accuzyme DNA polymerase (Bioline,
Taunton, MA). In the first reaction, regions 1 and 2 of the
sequence of TbTIM were amplified, using the DNA of WT
TbTIM and the sequences of the T7 promoter and the
sequence 50TGC GGC AAT CTG GAA CTT GGG GTG
TGA AAG ACG30 (Rv Tc3–8;Tb1,2) as internal initiator. In
the second reaction, the sequences of T7 terminator and
50TCA CAC CCC AAG TTC CAG ATT GCC GCA30 (Fw
Tc3–8;Tb1,2) were used with the DNA of WT TcTIM as tem-
plate. Finally, in the third reaction, the products of PCR1 and
PCR2 were combined, using the sequences of T7 promoter
and T7 terminator as external oligonucleotides.
The DNA of two of these chimeras (TcTIM1;TbTIM2–8
and TcTIM1,3–8;TbTIM2) were used as templates for the pro-
duction of ‘additive’ mutants of regions 1 and 2, respectively
(table 1b,c). These mutants were produced by site-directed
mutagenesis using Vent DNA polymerase (Stratagene, CA)
and the oligonucleotides listed in table 2.
The nomenclature used for these additive mutants has the
general form RXMX, where R is the region in which the
mutant occurs and M is the number of additive mutants it
has. Thus, mutant R1M1 has one mutation in region 1 and
mutant R2M5 has five additive mutations in region 2.
2.2. Expression and purification of the chimeric proteinsand the mutants
All the genes of the chimeric enzymes and the mutants were
cloned into the pET-3a vector (Novagen, WI) with NdeI and
BamH1 restriction sites, and subsequently sequenced. Each
gene was transformed into Escherichia coli Bl21-Codon Plus
(DE3) RIL cells (Novagen, WI).
Bacteria containing the plasmids with each of the mutant
genes were grown in Luria–Bertani medium supplemented
with 30mg ml21 chloramphenicol and 100 mg ml21 ampicillin
and were incubated at 378C until the cell cultures reached an
A600 nm¼ 0.6. The bacteria were induced with a final concen-
tration of 0.4 mM isopropyl-b-D-thiogalactopyranoside (IPTG),
and the cells were incubated 12 h longer at 308C before har-
vesting them.
Harvested bacteria were centrifuged for 15 min at 6400gand resuspended in 30 ml of lysis buffer (100 mM MES,
1 mM DTT, 0.5 mM EDTA, 0.2 mM PMSF, 300 mM NaCl, pH
6.3). Each suspension was sonicated at a potency of 5 W for
10 times 1 min with 2 min rest between each cycle. The soni-
cated suspensions were centrifuged at 203 500g for 60 min.
The supernatant of each chimeric enzyme or mutant was
diluted until the final concentration of NaCl was 20 mM and
was then applied to a SP Sepharose Fastflow column that
had been previously equilibrated with buffer A (50 mM MES
pH 6.3). The protein was eluted using a NaCl linear gradient
with buffer B (50 mM MES, NaCl 500 mM pH 6.3). Crystalline
ammonium sulfate was gradually added up to 70% (w/v)
saturation under agitation to the fractions containing TIM.
This suspension was further agitated for 16 h and then centri-
fuged for 15 min at 35 000g. The precipitate was resuspended
into 3 ml of buffer C (100 mM triethanolamine (TEA), 10 mM
EDTA, pH 7.4), and enough ammonium sulfate was added
to have a final concentration of 2.2 M. The protein was
then applied to a hydrophobic interaction column of butyl
toyopearl that had been previously been equilibrated with
buffer D (100 mM TEA, 10 mM EDTA and 2 M ammonium
sulfate). The protein was eluted with a linear gradient of 2 to
0 M of ammonium sulfate. The fractions containing TIM

Table 1. (a) Diagram of the composition of the chimeric enzymes of TbTIM and TcTIM. The name and the corresponding regions of TbTIM and TcTIM areindicated. In the bar diagram at the right, blue bars show TbTIM regions, and orange bars show TcTIM regions. (b) Diagram of the composition of the additivemutants of TbTIM and TcTIM. Additive mutants of region 1 were made using chimera TcTIM 1;TbTIM2 – 8 as a template. Different amino acids in region 1 weremutated in an additive manner. The dot diagram at the right depicts the 13 different amino acids in region 1; blue dots correspond to TbTIM residues and orangedots correspond to TcTIM residues. For the two site-directed mutants at the bottom of the table chimera TbTIM 1,3 – 8; TcTIM2 was used as template and theindividual mutations of the different amino acids of region 1 are shown. The asterisks indicate that the mutations for the two site-directed mutants are notadditive. Blue dots correspond to TbTIM residues and orange dots correspond to TcTIM residues. (c) Diagram of the composition of the additive mutants of TbTIMand TcTIM for region 2. Chimera TcTIM 1,3 – 8;TbTIM2 was used as a template and the seven different amino acids were mutated in an additive manner. The dotdiagram at the right depicts the seven different amino acids in region 2; blue dots correspond to TbTIM residues and orange dots correspond to TcTIM residues.
(a) chimera regions of TcTIMregions ofTbTIM scheme
TcTIM 1 – 6;TbTIM7 – 8 1 – 6 7 – 8
TcTIM 1 – 5;TbTIM6 – 8 1 – 5 6 – 8
TcTIM1 – 4;TbTIM5 – 8 1 – 4 5 – 8
TcTIM1 – 3;TbTIM4 – 8 1 – 3 4 – 8
TcTIM1,2;TbTIM3 – 8 1 – 2 3 – 8
TcTIM1;TbTIM2 – 8 1 2 – 8
TcTIM2 – 8;TbTIM1 2 – 8 1
TcTIM2;TbTIM1,3 – 8 2 1,3 – 8
TcTIM1,3 – 8;TbTIM2 1,3 – 8 2
TcTIM3 – 8;TbTIM1,2 3 – 8 1,2
(b) mutant no. additive mutationsin region 1
regions ofTbTIM
scheme of different aminoacids in region 1
R1M1 1 2 – 8
R1M2 2 2 – 8
R1M3 3 2 – 8
R1M4 4 2 – 8
R1M5 5 2 – 8
R1M6 6 2 – 8
R1M7 7 2 – 8
R1M8 8 2 – 8
R1M9 9 2 – 8
R1M10 10 2 – 8
R1M11 11 2 – 8
R1M12 12 2 – 8
R1M13 13 2 – 8
TcTIM 2;TbTIM1,3 – 8 R1 Q18E, S32T,I33F, N34D 4* 1,3 – 8
TcTIM 2;TbTIM1,3 – 8 R1Q18E,E23P,D26E,S32T,I33F,
N34D
6* 1,3 – 8
(c) mutant no. additive mutationsin region 2
regions ofTcTIM
scheme of different aminoacids in region 2
R1M1 1 1,3 – 8
R1M2 2 1,3 – 8
R1M3 3 1,3 – 8
R1M4 4 1,3 – 8
R1M5 5 1,3 – 8
R1M6 6 1,3 – 8
R1M7 7 1,3 – 8
rsob.royalsocietypublishing.orgOpen
Biol.6:160161
3
on November 8, 2018http://rsob.royalsocietypublishing.org/Downloaded from

Table 2. Oligonucleotides used for the additive mutagenesis and the site-directed mutagenesis of regions 1 and 2. For additive mutations, the DNA template ofthe additive mutant immediately preceding it was used.
mutant FW primer RV primer
R1M1 50 TGC AAC GGC TCC CAG AGT TTG CTT GTA 30 50 TAC AAG CAA ACT CTG GGA GCC GTT GCA 30
R1M2 50 TGC AAC GGC TCC CAG CAG TTG CTT
GTA CCA 3050 TGG TAC AAG CAA CTG CTG GGA GCC
GTT GCA 30
R1M3 50 TGC AAC GGC TCC CAG CAG TCT CTT GTA CCA 30 50 TGG TAC AAG AGA CTG CTG GGA GCC
GTT GCA 30
R1M4 50 TGC AAC GGC TCC CAG CAG TCT TTG TCT GAG
CTC ATC GAT ACG CTC 3050 GAG CGT ATC GAT GAG CTC AGA CAA AGA CTG
CTG GGA GCC GTT GCA 30
R1M5 50 GAG CGT ATC GAT GAG CTC AGA CAA AGA CTG
CTG GGA GCC GTT GCA 3050 GAG CGT ATC GAT GAG CTC AGA CAA AGACTG
CTG GGA GCC GTT GCA 30
R1M6 50 TCT TTG TCT GAG CTC ATT GAT
ACG CTC 3050 GAG CGT ATC AAT GAG CTC AGA CAA
AGA 30
R1M7 50 GAG CTC ATT GAT CTG CTC AAT
GCA GCG 3050 CGC TGC ATT GAG CAG ATC AAT
GAG CTC 30
R1M8 50 CTC ATT GAT CTG TTT AAT GCA GCG
ACT 3050 AGT CGC TGC ATT AAA CAG ATC AAT
GAG 30
R1M9 50 GAT CTG TTT AAT TCC GCG ACT TTT
GAT 3050 ATC AAA AGT CGC GGA ATT AAA
CAG ATC 30
R1M10 50 GAT CTG TTT AAC TCC ACA ACT TTT GAT CAC
GAT GTG CAA 3050 TTG CAC ATC GTG ATC AAA AGT TGT GGA GTT
AAA CAG ATC 30
R1M11 50 GAT CTG TTT AAC TCC ACC AGC TTT GAT CAC
GAT GTG CAA 3050 TTG CAC ATC GTG ATC AAA GCT GGT GGA GTT
AAA CAG ATC 30
R1M12 50 AAC TCC ACA AGC ATC GAT CAC GAT
GTG CAA 3050TTG CAC ATC GTG ATC GAT GCT TGT
GGA GTT 30
R1M13 50 AAC TCC ACA AGC ATC AAC CAC GAT
GTG CAA 3050TTG CAC ATC GTG GTT GAT GCT TGT
GGA GTT 30
R1M13DALA2 50 CTT TAA GAA GGA GAT ATA CAT ATG TCC AAG
CCA CAA CCC ATC GC 3050 GCG ATG GGT TGT GGC TTG GAC ATA TGT ATA
TCT CCT TCT TAA AG 30
TcTIM2;TbTIM1,3 – 8 R1Q18E,
E23P,D26E,S32T,I33F,N34D
50 TTT AAC TCC ACA ACC TTT GAT CAC GAC GTG
CAA 3050 TTG CAC GTC GTG ATC AAA GGT TGT GGA GTT
AAA 30
TcTIM 2;TbTIM1,3 – 8 R1Q18E,
S32T,I33F,N34D
50 TTT AAC TCC ACA ACC TTT GAT CAC GAC GTG
CAA 3050 TTG CAC GTC GTG ATC AAA GGT TGT GGA GTT
AAA 30
R2M1 50 GTG CAA TGC GTA GTG GCC CCG ACC TTT GTT
CAC CTT GCC ATG 3050 CAT GGC AAG GTG AAC AAA GGT CGG GGC CAC
TAC GCA TTG CAC 30
R2M2 50 CAA TGC GTA GTG GCC CCG ACC TTT CTG CAC
CTT GCC ATG ACC 3050 GGT CAT GGC AAG GTG CAG AAA GGT CGG GGC
CAC TAC GCA TTG 30
R2M3 50 TGC GTA GTG GCC CCG ACC TTT CTG CAC ATC
GCC ATG ACC AAG 3050 CTT GGT CAT GGC GAT GTG CAG AAA GGT CGG
GGC CAC TAC GCA 30
R2M4 50 GTA GTG GCC CCG ACC TTT CTG CAC ATC CCG
ATG ACC AAG GAG 3050 CTC CTT GGT CAT CGG GAT GTG CAG AAA GGT
CGG GGC CAC TAC 30
R2M5 50 CAC ATC CCA ATG ACG AAG GCG CGT CTT TCA
CAC CCC AAA 3050 TTT GGG GTG TGA AAG ACG CGC CTT CGT CAT
TGG GAT GTG 30
R2M6 50 ACG AAG GCG AGG CTC ACC CAC CCC AAA TTT
GTG 3050 CAC AAA TTT GGG GTG GGT GAG CCT CGC CTT
CGT 30
R2M7 50 ACG AAG GAG CGT CTT ACC AAC CCC AAA TTT
GTG ATT GCG 3050 AAT CAC AAA TTT GGG GTT GGT AAG ACG CGC
CTT CGT 30
rsob.royalsocietypublishing.orgOpen
Biol.6:160161
4
on November 8, 2018http://rsob.royalsocietypublishing.org/Downloaded from

Mf Mf
Dint
Dact
aggregate
k2+
k–2
k3 k4
Figure 1. Model of protein folding used to calculate the velocity constants usingthe program DYNAFIT. M represents the monomer, Dint represents the intermediatedimer, Dact represents the active dimer and aggregate represents aggregates.
rsob.royalsocietypublishing.orgOpen
Biol.6:160161
5
on November 8, 2018http://rsob.royalsocietypublishing.org/Downloaded from
were pooled and concentrated. Protein concentration was
determined at 280 nm, using an extinction coefficient 1 ¼ 34
950 M21 cm21.
There were some differences in the expression and purifi-
cation of chimeric enzyme TcTIM1,3–8;TbTIM2 and a
mutant derived from it: TcTIM1,3–8;TbTIM2(S43P). They
were transformed into E. coli Origami B (DE3) and were also
grown in Luria–Bertani medium supplemented with 100 mg
ml21 ampicillin, 34 mg ml21 chloramphenicol, 12.5 mg ml21
tetracycline and 15 mg ml21 kanamycin. These cells were
incubated at 378C until they reached an A600 nm ¼ 0.6 and
then induced with 0.5 mM IPTG. They were further incubated
for 24 h at 158C before harvesting them.
Their purification followed the same steps as those of the
other chimeric proteins and mutants until after the cationic
exchange column. These proteins were then concentrated and
applied to a Superdex 75 gel filtration column previously equi-
librated with 100 mM TEA, 10 mM EDTA pH 7.4. The fractions
containing protein from this column were concentrated and
kept until further use.
2.3. Activity assaysEnzyme activity was measured following the conversion
of DL-glyceraldehyde 3-phosphate (D,L-GAP) to dihydroxya-
cetone phosphate using a-glycerolphosphate dehydrogenase
(a-GDH) as coupling enzyme at 258C [17]. The oxidation of
NADH was monitored at 340 nm, and the reaction mixture
had 10 mM TEA, 10 mM EDTA, 1 mM GAP, 0.2 mM
NADH and 20 mg ml21 a-GDH. The reaction was started
by adding 5 ng ml21 of the corresponding protein. To calcu-
late kinetic parameters, GAP concentration was varied
between 0.05 and 2 mM, and the data were adjusted to the
Michaelis–Menten model.
2.4. Denaturation and reactivationThe enzymes were denatured by incubation of 0.5 mg of
protein ml21 at 258C for 1 h in 100 mM TEA, 10 mM EDTA,
1 mM DTT and 6 M GdnHCl pH 7.4. For reactivation, aliquots
of the latter mixture were diluted 100-fold into a buffer that
contained 100 mM TEA, 10 mM EDTA and 1 mM DTT pH
7.4. At this point, the concentration of protein was 5 mg ml21
(183–186 nM). After diluting the proteins, aliquots were
removed at different times, and activity was measured in a
final volume of 1 ml of reaction mixture. In all cases, the
residual concentration of GdnHCl after dilution was 60 mM
in the activity assay and 60 mM in the assay mixture. Control
experiments in which all enzymes were incubated with
60 mM GdnHCl for the duration of the experiment showed
that their activity was not affected. As stated above, activity
measurements were performed at 258C. In cases where reacti-
vation was performed at different concentrations, a range of
10–500 nM monomer was used.
2.5. Determination of the rate constants in thereactivation
The rate constants of the reactivation of different chimeras
and mutant TIMs were calculated from assays performed at
different protein concentrations. Rate constants were calcu-
lated in two ways: the first is like the one reported in
Zomosa-Signoret et al. [9] considering the sequence of
reactivation as follows:
2Mu�! �1,k1
k�1
2Mf�! �2,k2
k�2
Dint�!3,k3 Dact,
where Mu represents the unfolded monomer, Mf the folded
monomer, Dint the intermediate dimer and Dact the active dimer.
We performed an exponential fit from the plots of reacti-
vation at different concentrations against time, to obtain the
pseudo-first-order constants (equation (2.1)) that describe
the formation of dimers at different enzyme concentrations
Y ¼ y0 þ A1ekt: ð2:1Þ
In this equation, t represents time, k the observed or pseudo-first-
order constant, Y the catalytic activity, y0 a value of activity at
infinite time and A1 represents the amplitude of the curve
(activity) at time t. The values obtained for the observed con-
stants were plotted against the protein concentration to get
the second-order constants or the constants associated with
the formation of the active dimer. In these cases, monomer
concentrations varied between 10 and 500 nM (data not shown).
Additionally, for the calculation of the velocity constants,
in particular the mutants of region 2, we used DYNAFIT
software (from BioKin [18]). For this purpose, different
models were tested to calculate the velocity constants associ-
ated with refolding. The model we chose finally is described
in figure 1. This model omits the information regarding the
folding of the monomers. This was because in the work of
Zomosa-Signoret et al. [9] no differences were found in this
first step between TbTIM and TcTIM. The new model also
proposes an additional step in the folding process, which is
aggregation, introducing a new constant k4. Thus, the defi-
nitions of the constants are: k2 is the association constant of
folded monomers, k22 is the dissociation constant of folded
monomers, k3 is the constant for the rearrangement from inter-
mediate dimer to active dimer and k4 is the constant for the
formation of aggregates from intermediate dimers.
The value of the constants was obtained from the best fit
of the data of reactivation at different concentrations for each
one of the enzymes.
2.6. Circular dichroismCircular dichroism spectra were obtained with an AVIV 62
HDS spectropolarimeter (Lakewood, NJ) in a 0.1 mm quartz
cell at 258C. The scanned wavelengths were 190–260 nm.
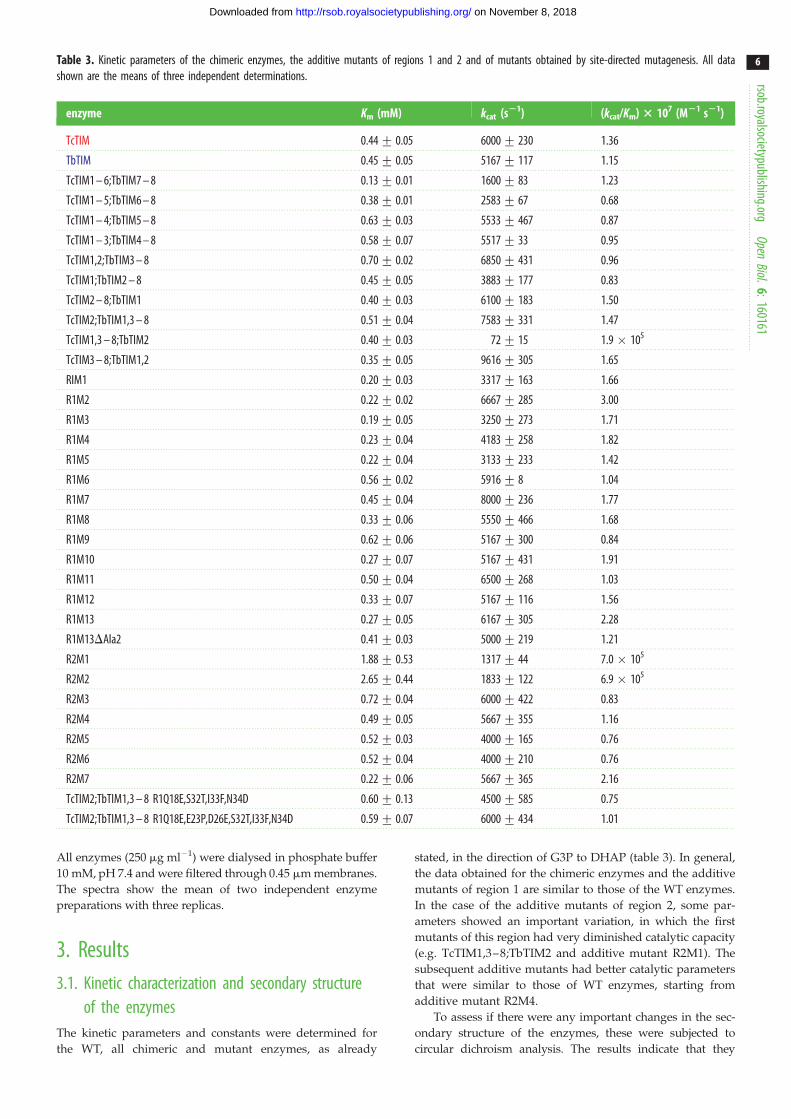
Table 3. Kinetic parameters of the chimeric enzymes, the additive mutants of regions 1 and 2 and of mutants obtained by site-directed mutagenesis. All datashown are the means of three independent determinations.
enzyme Km (mM) kcat (s21) (kcat/Km) 3 107 (M21 s21)
TcTIM 0.44+ 0.05 6000+ 230 1.36
TbTIM 0.45+ 0.05 5167+ 117 1.15
TcTIM1 – 6;TbTIM7 – 8 0.13+ 0.01 1600+ 83 1.23
TcTIM1 – 5;TbTIM6 – 8 0.38+ 0.01 2583+ 67 0.68
TcTIM1 – 4;TbTIM5 – 8 0.63+ 0.03 5533+ 467 0.87
TcTIM1 – 3;TbTIM4 – 8 0.58+ 0.07 5517+ 33 0.95
TcTIM1,2;TbTIM3 – 8 0.70+ 0.02 6850+ 431 0.96
TcTIM1;TbTIM2 – 8 0.45+ 0.05 3883+ 177 0.83
TcTIM2 – 8;TbTIM1 0.40+ 0.03 6100+ 183 1.50
TcTIM2;TbTIM1,3 – 8 0.51+ 0.04 7583+ 331 1.47
TcTIM1,3 – 8;TbTIM2 0.40+ 0.03 72+ 15 1.9 � 105
TcTIM3 – 8;TbTIM1,2 0.35+ 0.05 9616+ 305 1.65
RIM1 0.20+ 0.03 3317+ 163 1.66
R1M2 0.22+ 0.02 6667+ 285 3.00
R1M3 0.19+ 0.05 3250+ 273 1.71
R1M4 0.23+ 0.04 4183+ 258 1.82
R1M5 0.22+ 0.04 3133+ 233 1.42
R1M6 0.56+ 0.02 5916+ 8 1.04
R1M7 0.45+ 0.04 8000+ 236 1.77
R1M8 0.33+ 0.06 5550+ 466 1.68
R1M9 0.62+ 0.06 5167+ 300 0.84
R1M10 0.27+ 0.07 5167+ 431 1.91
R1M11 0.50+ 0.04 6500+ 268 1.03
R1M12 0.33+ 0.07 5167+ 116 1.56
R1M13 0.27+ 0.05 6167+ 305 2.28
R1M13DAla2 0.41+ 0.03 5000+ 219 1.21
R2M1 1.88+ 0.53 1317+ 44 7.0 � 105
R2M2 2.65+ 0.44 1833+ 122 6.9 � 105
R2M3 0.72+ 0.04 6000+ 422 0.83
R2M4 0.49+ 0.05 5667+ 355 1.16
R2M5 0.52+ 0.03 4000+ 165 0.76
R2M6 0.52+ 0.04 4000+ 210 0.76
R2M7 0.22+ 0.06 5667+ 365 2.16
TcTIM2;TbTIM1,3 – 8 R1Q18E,S32T,I33F,N34D 0.60+ 0.13 4500+ 585 0.75
TcTIM2;TbTIM1,3 – 8 R1Q18E,E23P,D26E,S32T,I33F,N34D 0.59+ 0.07 6000+ 434 1.01
rsob.royalsocietypublishing.orgOpen
Biol.6:160161
6
on November 8, 2018http://rsob.royalsocietypublishing.org/Downloaded from
All enzymes (250 mg ml21) were dialysed in phosphate buffer
10 mM, pH 7.4 and were filtered through 0.45 mm membranes.
The spectra show the mean of two independent enzyme
preparations with three replicas.
3. Results3.1. Kinetic characterization and secondary structure
of the enzymesThe kinetic parameters and constants were determined for
the WT, all chimeric and mutant enzymes, as already
stated, in the direction of G3P to DHAP (table 3). In general,
the data obtained for the chimeric enzymes and the additive
mutants of region 1 are similar to those of the WT enzymes.
In the case of the additive mutants of region 2, some par-
ameters showed an important variation, in which the first
mutants of this region had very diminished catalytic capacity
(e.g. TcTIM1,3–8;TbTIM2 and additive mutant R2M1). The
subsequent additive mutants had better catalytic parameters
that were similar to those of WT enzymes, starting from
additive mutant R2M4.
To assess if there were any important changes in the sec-
ondary structure of the enzymes, these were subjected to
circular dichroism analysis. The results indicate that they

TcTIMTbTIMTcTIM1; TbTIM2–8R1M1R1M2R1M3R1M4R1M5R1M6R1M7R1M8R1M9R1M10R1M11R1M12R1M13R1M13D ala 2
TcTIM
TbTIM
R2M2
R2M3
R2M4
R2M5
R2M6
R2M7
10 000
0
–10 000
–20 000
–30 000
mol
ar e
llipt
icity
(deg
cm
2 dm
ol–1
)
190 200 210
wavelength (nm)
220 230 240
TcTIM1,3–8;TbTIM2
TcTIM
TbTIM
R2M2
R2M1
R2M3
R2M4
R2M5
R2M6
R2M7
20 000
0
–20 000
–40 000
–60 000
mol
ar e
llipt
icity
(deg
cm
2 dm
ol–1
)
190 200 210wavelength (nm)
220 230 240
10 000
0
–10 000
–20 000
–30 000190 200 210
wavelength (nm)220 230 240
(b)(a)
(c)
Figure 2. Circular dichroism spectra of chimeric enzymes, additive mutants and mutant enzymes. Proteins were dialysed against phosphate buffer pH 7.4, andspectra were made with 250 mg ml21 of each enzyme in the cell. (a) Spectra of additive mutants of region 1. (b) Spectra of additive mutants of region 2.(c) Comparison of spectra of chimeric enzyme TcTIM1,3 – 8;TbTIM2 with those of the WT enzymes and additive mutants of region 2.
0
20
40
reac
tivat
ion
(%)
60
80
100
0 10 20 30
TcTIM
TcTIM1–6;TbTIM7,8TcTIM1–5;TbTIM6–8TcTIM1–4;TbTIM5–8TcTIM1–3;TbTIM4–8TcTIM1, 2;TbTIM3–8TcTIM1;TbTIM2–8
TbTIM
time (min)40 50 60
Figure 3. Reactivation of WT TbTIM, WT TcTIM and six chimeric enzymes.Proteins (500 mg ml21) were treated with 6 M GdnHCl for 1 h at 258C.
rsob.royalsocietypublishing.orgOpen
Biol.6:160161
7
on November 8, 2018http://rsob.royalsocietypublishing.org/Downloaded from
correspond to a structure of a b/a barrel with two negative
signals at 222 nm and another between 208 and 201 nm, and
a positive signal between 190 and 195 nm. Most mutants also
show that their structural profile corresponds to the TIM
barrel motif, but they have slight variations in the intensity or
form of the signal owing to changes in the mutagenesis [19],
which generate small changes in the folding of the enzyme
(figure 2). The structures with greatest variation were chimers
TcTIM1;TbTIM2–8 and TcTIM1,3–8;TbTIM2. In the case of
chimer TcTIM1;TbTIM2–8, the intensity of the signal is dimin-
ished for the a-helixes, which could indicate a difference in the
folding of this enzyme. Catalytically, it has slightly lower
values than the WT enzymes showing it has a perturbation
in the catalytic site. In addition, the great majority of the addi-
tive mutants in region 1 show a Km of about one-half of the Km
for the WT enzymes indicating that the catalytic site is also
affected (table 3). In the case of the chimeric enzyme
TcTIM1,3–8;TbTIM 2 and additive mutant R2M1, for which
the signals of molar ellipticity are more intense than for
the rest of the enzymes (figure 2c), the results are discussed
below (§4.2).
The enzymes were then diluted 100-fold, and reactivation was measured.Results are expressed as percentage of recovered activity, where 100% isthe activity of the native enzymes incubated with the residual concentrationof GdnHCl (60 mM).3.2. Regions 1 and 2 are responsible for differencesin the reactivation of monomers unfoldedwith GdnHCl
When the reactivation assays were performed with the chi-
meric enzymes produced from TbTIM and TcTIM, almost all
showed an intermediate behaviour to the one seen with the
WT enzymes (figure 3). However, when chimeric enzyme
TcTIM1;TbTIM2–8 was tested, the reactivation was extremely
poor (figure 3, green triangles) and very slow (approx. only 5%
of the reactivation) when compared with chimeric enzyme
TcTIM1,2;TbTIM2–8, whose reactivation was as fast and
efficient as that of WT TcTIM (figure 3, black squares). These
results meant that the different amino acids in regions 1 and
2 between the sequences of WT TbTIM and WT TcTIM were
responsible for the changes observed in reactivation. These
two regions have 13 and 7 differences, respectively (from a
total of 20; figure 4). To ascertain that these two regions
were indeed implicated in some aspect of the process of reac-
tivation, we made a new set of chimeric enzymes with all
possible combinations of regions 1 and 2.

region 1 (amino acids 1–35)
region 2 (amino acids 36–60)
region 2 (7, 4, 2, 1)
TcTIM
TbTIM
TcTIM
TbTIM
region 1 (13, 8, 1, 4)
additive mutant
amino acid number
M1 M2 M3 M4 M5 M6 M7 M8 M9 M10M11M12M13
additive mutant M1 M2 M3 M4 M5 M6 M7
18 19 20 22 23 26 27 28 30 31 32 33 34
amino acid number 43 46 48 49 53 56 57
Figure 4. Aligned sequences of regions 1 and 2 of WT TbTIM and WT TcTIM. The differences in the amino acids are highlighted as conservative (similar size andpolarity) in yellow, semiconservative (similar polarity) in cyan, and without similarity in red. Secondary structure elements are shown below in blue as lines (loops),arrows (beta sheets) and barrels (alpha helixes).
0
20
40
reac
tivat
ion
(%)
60
80
100
0 10 20 30time (min)
40 50 60
TcTIM
TbTIM
TcTIM2–8;TbTIM1
TcTIM1,2;TbTIM3–8
TcTIM2;TbTIM1,3–8
TcTIM3–8;TbTIM1,2
TcTIM1;TbTIM2–8
TcTIM1,3–8;TbTIM2
Figure 5. Reactivation of WT TbTIM, WT TcTIM and all the chimeric enzymes of regions 1 and 2. The cartoons with bars at the right represent the regions of TbTIM(blue) and TcTIM (orange) for each enzyme. Proteins (500 mg ml21) were treated with 6 M GdnHCl for 1 h at 258C. The enzymes were then diluted 100-fold andreactivation was measured. Results are expressed as percentage of recovered activity, where 100% is the activity of the native enzymes incubated with the residualconcentration of GdnHCl (60 mM).
rsob.royalsocietypublishing.orgOpen
Biol.6:160161
8
on November 8, 2018http://rsob.royalsocietypublishing.org/Downloaded from
3.3. Reactivation of chimeric enzymes of regions 1and 2
The six chimeric enzymes with all possible combinations
of regions 1 and 2 were assayed and the results are shown
in figure 5. To test region 1, we constructed chimeric enzy-
mes TcTIM1;TbTIM2–8 and TcTIM2–8;TbTIM1. Chimeric
enzyme TcTIM1;TbTIM2–8 reactivated minimally and very
slowly, whereas chimeric enzyme TcTIM2–8;TbTIM1 was
100% efficient (even better than WT TcTIM) and also very
fast. On the other hand, to test region 2, we constructed chimeric
enzymes TcTIM2;TbTIM1,3–8 and TcTIM1,3–8;TbTIM2.
These enzymes showed two distinct behaviours, the first was
shown by chimeric enzyme TcTIM2;TbTIM1,3–8, which reacti-
vated just as fast as WT TcTIM but only partially, to the extent
that TbTIM does (40%); the second was that chimeric enzyme
TcTIM1,3–8;TbTIM2 did not reactivate at all.
When the remaining combinations of both regions were
assayed, chimeric enzyme TcTIM1,2;TbTIM3–8 reactivated in
a similar manner to WT TcTIM (90%), whereas chimeric
enzyme TcTIM3–8;TbTIM1,2 reactivated somewhat less than
WT TbTIM and also, like this last enzyme, did it slowly.
It should be pointed out that chimeric enzyme TcTIM3–
8;TbTIM1,2 was unstable and tended to dissociate at the concen-
tration and the times used in the assays, which is why, to make
its results comparable to the other proteins, the results shown for
this enzyme in figure 5 are normalized against a control that did
not receive the usual incubation of 1 h at 258C.
3.4. Synergistic and antagonistic combinationsof regions 1 and 2
As can be seen in figure 5, there are combinations of regions 1 and
2 that favour or hinder reactivation. The combination that

Table 4. Calculated velocity constants for additive mutants of region 2 and for some chimeric enzymes.
mutant k2 (M21 s21) k22 (s21) k3 (s21) k4 (s21)
TcTIM 4.3 � 105 1.6 � 1027 1 � 1023 7.2 � 1024
TbTIM 0.75 � 105 1.4 � 1027 1.3 � 1023 6.4 � 1024
R2M1 1.4 � 107 0.9 � 1027 2.5 � 1024 2.3 � 1023
R2M2 1.0 � 107 1.1 � 1027 3.1 � 1024 1.3 � 1023
R2M3 3.5 � 105 1.0 � 1027 8.4 � 1024 5.6 � 1024
R2M4 4.8 � 105 1 � 1027 9.6 � 1024 7.6 � 1024
R2M5 1.6 � 105 1 � 1027 1.0 � 1023 8.8 � 1024
R2M6 2.5 � 105 1.0 � 1027 2.1 � 1023 3.2 � 1024
R2M7 4.7 � 105 1 � 1027 1.4 � 1023 5.2 � 1024
TcTIM1;TbTIM2 – 8 1.5 � 105 1 � 1027 1.2 � 1023 1.2 � 1023
TcTIM2 – 8;TbTIM1 1.5 � 107 9.1 � 1027 3.1 � 1024 2.3 � 1024
TcTIM1,2;TbTIM3 – 8 3.8 � 105 1.9 � 1027 1.0 � 1024 2.3 � 1024
TcTIM2;TbTIM1,3 – 8 8.3 � 105 1.3 � 1027 1.0 � 1024 1.3 � 1024
rsob.royalsocietypublishing.orgOpen
Biol.6:160161
9
on November 8, 2018http://rsob.royalsocietypublishing.org/Downloaded from
produces an extremely inefficient or null reactivation is region 1
of TcTIM and region 2 of TbTIM; this combination is present in
chimeric enzymes TcTIM1;TbTIM2–8 (which only reaches 5%
reactivation) and TcTIM 1,3–8;TbTIM2 (which does not reacti-
vate). The combination that favours reactivation is region 1 of
TbTIM and region 2 of TcTIM; in this case, reactivation occurs
in a fast and efficient manner such as with chimeric enzymes
TcTIM2–8;TbTIM1 (100%) and TcTIM2;TbTIM1,3–8 (90%).
3.5. Velocity constants of chimeric enzymes of regions 1and 2
The limiting steps in reactivation of TIM are the association
of the monomers and the inner rearrangement that transforms
the intermediate dimer into the active dimer [9]. To obtain the
velocity constants of these two steps, we reactivated chimeric
enzymes of regions 1 and 2 at different concentrations that
varied from 10 to 500 nM of monomer. In all cases, excepting
chimeric enzyme TcTIM3–8;TbTIM1,2, the plot of absorbance
versus time was linear, indicating that the reactivation was
not affected by the dissociation of the enzyme during the
measurement of the activity (data not shown). Table 4 shows
the values of the velocity constants determined for the chi-
meric enzymes of regions 1 and 2, except for chimeric
enzymes TcTIM1,3–8;TbTIM2 and TcTIM3–8;TbTIM1,2, for
which no data could be obtained. It should be noted that the
velocity constants that are related to the association of mono-
mers were always equal to or larger than that obtained for
WT TcTIM in those proteins that have region 2 of TcTIM. On
the contrary, when the proteins have region 2 of TbTIM, the
constants are lower, even by one order of magnitude, than
those reported for the WT enzymes.
3.6. Reactivation of the additive mutants of region 1To continue locating the amino acids that are important for
reactivation in these two regions, a group of additive mutants
was prepared with each, and all the residues that are different
in region 1 between WT TcTIM and WT TbTIM, by the pro-
gressive and cumulative site-directed mutagenesis converting
chimeric enzyme TcTIM;TbTIM2–8 into WT TbTIM. This
involved the production of 13 additive mutants.
In the reactivation kinetics of these additive mutants of
region 1 (figure 6), we observed that when the first mutation
was introduced (R1M1) the reactivation was about 50% as
efficient as that of WT TbTIM. Two further additive
mutations R1M2 and R1M3 had the effect of reducing acti-
vation efficiency by approximately 10%. The fourth additive
mutant R1M4 showed an important diminishment in its reac-
tivation capacity with a behaviour similar to chimeric
enzyme TcTIM1;TbTM2–8. However, when the fifth additive
mutant R1M5 was assayed, the reactivation of this enzyme
was approximately 10% more efficient than WT TbTIM.
The sixth additive mutant R1M6 returned the reactivation
pattern to one like that of WT TbTIM and the seventh addi-
tive mutant R1M7 has no apparent effect on the
reactivation. It is important to point out here that an additive
mutation may have either positive (R1M1, R1M5), negative
(R1M2, R1M4, R1M6) or neutral (R1M3, R1M7) effect on
the reactivation pattern when compared with the additive
mutant that preceded it. The eighth additive mutant
showed a decrease in reactivation capacity of approximately
10% with respect to R1M7. However, the ninth additive
mutant R1M9 not only increased the velocity of reactivation,
improving WT TbTIM, but also did it with a greater effi-
ciency, at least for the first 10 min of the kinetic analysis.
The 10th additive mutant R1M10 returns to a reactivation
pattern like that of WT TbTIM, but the 11th additive
mutant R1M11 again increases the efficiency of the reactiva-
tion by approximately 20% over that of WT TbTIM. Both
the 12th and 13th additive mutants, R1M12 and R1M13,
respectively, return the reactivation pattern to that of WT
TbTIM. Because the sequence of WT TcTIM has an additional
Ala in position 2, when compared with the sequence of
WT TbTIM, we constructed an additive mutant that lacked
this Ala in its sequence to test the possibility that this
additional amino acid might have some influence on the

0
20
40
60
80
100
0 10 20 30 40 50 600
20
40
60
80TcTIMTbTIMR1M1R1M2R1M3R1M4
TcTIMTbTIMR1M5R1M6R1M7
100
0 10 20 30 40 50 60
reac
tivat
ion
(%)
TcTIMTbTIMR1M13R1M13D ala 2
reac
tivat
ion
(%)
0
20
40
60
80
100
0 10 20 30time (min)
40 50 60
(e)
(b)(a)
TcTIMTbTIMR1M8R1M9R1M10
TcTIMTbTIMR1M11R1M12
0
20
40
reac
tivat
ion
(%)
60
80
100
0 10 20 30 40 50 60time (min) time (min)
0
20
40
60
80
100
0 10 20 30 40 50 60
(c) (d )
Figure 6. (a – e) Reactivation of WT TbTIM (blue), WT TcTIM (red) and all the additive mutants of region 1. Proteins (500 mg ml21) were treated with 6 M GdnHCl for 1 hat 258C. The enzymes were then diluted 100-fold, and reactivation was measured. Results are expressed as percentage of recovered activity, where 100% is the activity of thenative enzymes incubated with the residual concentration of GdnHCl (60 mM). The data shown are the mean of three separate and independent experiments.
rsob.royalsocietypublishing.orgOpen
Biol.6:160161
10
on November 8, 2018http://rsob.royalsocietypublishing.org/Downloaded from
reactivation pattern. Additive mutant R1M13DAla2 had an
equal reactivation pattern to R1M13 (figure 6).
3.7. Structural analysis of the relevant amino acidsin region 1
Trying to understand why these mutations had the
observed effect on the reactivation patterns observed, we
performed a search of the contacts with other residues at
a distance of 4 A from the mutated amino acids, as well
as of the mutated amino acids themselves in the structures
with PDB identifiers: 5TIM (TbTIM) and 1TCD (TcTIM).
All changes in region 1 are in helix 1 and the beginning
of the loop that connects region 1 with region 2. The exter-
nal face of helix 1 is exposed to the solvent and interacts
with helices 2 and 8 on both sides, whereas the internal
face interacts with beta sheet 1. It was observed in previous
studies that TcTIM has a looser conformation than TbTIM at
this site, with fewer interactions between these regions [5].
One of the amino acids that produce this structural
difference is Pro 23, which is in the middle of the helix
and exposed to solvent, generating a wider gap in the
turns of the helix (approx. 1.2 A). This opening not only
decreases the contacts of the residues in this helix, but
also modifies the spatial orientation of other amino acids
such as Glu 18 (which corresponds to Gln 18 in TbTIM).
In our results of the mutagenesis of region 1, the change of
the amino acid in position 18 (Glu for Gln) has one of the stron-
gest effects even though it is quite conservative in both the size
and the form of the residue. The important changes in the reac-
tivation of chimeric enzyme TcTIM1;TbTIM2–8 generated by
mutating this amino acid are probably caused by the change
in orientation of this residue owing to the presence or absence
of Pro 23. The structure of TbTIM (without Pro 23) shows
a helix 1 that is more compact and with more interactions,
allowing Gln 18 to have an orientation that permits the for-
mation of a hydrogen bond with Asp 85 of region 3,
monomer B. The native Glu 18 of TcTIM has an orientation
that does not permit this interaction (see figure 3 in [5]).
Thus, these observations point to the importance of the inter-
actions between the amino acids in positions 18 and 23 in
a1
a2
monomer B
Figure 7. Superposition of the three-dimensional structures of regions 1 ofWT TbTIM (green) and WT TcTIM (cyan). In TcTIM, the presence of P23 in themiddle of helix 1 produces an aperture of 1.2 A in the turns of this helix thatresults in additional interactions with neighbouring residues, which TbTIMdoes not have. This results in the different conformation of Q18 and E18in TbTIM and TcTIM, respectively, preventing the latter from forming a contactwith monomer B. In alpha-helix 2 (a2) R54 in the structure of TbTIM is ableto form a contact with D26, which is not the case for TcTIM.
rsob.royalsocietypublishing.orgOpen
Biol.6:160161
11
on November 8, 2018http://rsob.royalsocietypublishing.org/Downloaded from
the sequences of TbTIM and TcTIM, and provide a structural
explanation for our experimental results.
One question that arose was why additive mutant R1M1
had such a drastic change in reactivation behaviour given that,
even though amino acid 18 was mutated, Pro 23 was still present.
Because chimeric enzyme TcTIM1;TbTIM2–8 has mainly
the sequence of TbTIM, which structurally has more contacts
between regions 1 and 2 than TcTIM, it could be possible
that the mutation produced a rearrangement of the amino
acid in position 18, in which perhaps one of the two contacts
with region 3 of monomer B was restored. Because no crystal
structure of additive mutant R1M1 is available, we performed
homology modelling, using the Swiss Model server and the
coordinates of both WT TIMs [20–22]. The server produced
two models in which the amino acid in position 18 is in an
intermediate position from the ones observed in WT TbTIM
and TcTIM. In this case, one of the two hydrogen bonds was
restored, and this should explain the big change in the reactiva-
tion behaviour of additive mutant R1M1. This suggests that
this amino acid is related to the association between subunits.
When Pro 23 was mutated, we saw that the reactivation
increased greatly in efficiency; it was even better than
TbTIM. This is due to the rearrangement of the helix (changing
the residue stabilizes the helix and restores the interactions
with other amino acids), yet it is not until the mutagenesis of
the amino acid at position 26 (R1M6) when the reactivation be-
haviour is again like that of WT TbTIM. This is a conservative
change again in size and form of the amino acid, but, like the
change of the amino acid in position 18, it modifies the
charge. Observing the close contacts of amino acids in pos-
itions 23 and 26, these interact both with Arg 54 of region 2,
which is the same residue in both TbTIM and TcTIM, but
which has a different orientation in the crystal structures of
the WT enzymes (figure 7). Arg 54 in TbTIM is oriented in a
manner that permits the formation of a hydrogen bond with
Asp26, whereas this interaction is absent in TcTIM.
We do not know how these amino acids interact in the
early stages of folding during reactivation, but it is clear
that they are important to guide the process of determining
the accessible conformational space for these enzymes.
Even though our statements regarding the changes in
position of the amino acids mentioned previously were
made comparing some available crystallographic structures
of TIMs, the lack of the structures of the enzymes we studied,
in particular, makes the movements we propose speculative.
However, there are previous works in which the mutation of
some residues result in important changes for a certain func-
tion [19]. As we could observe in solution (figure 2), these
mutants show differences in their secondary structure,
indicating that mutagenesis changes the number of contacts
in the enzyme, so that it is possible that the variation of the
reactivation and folding patterns could be due to the correct
or incorrect positioning of one or more key residues.
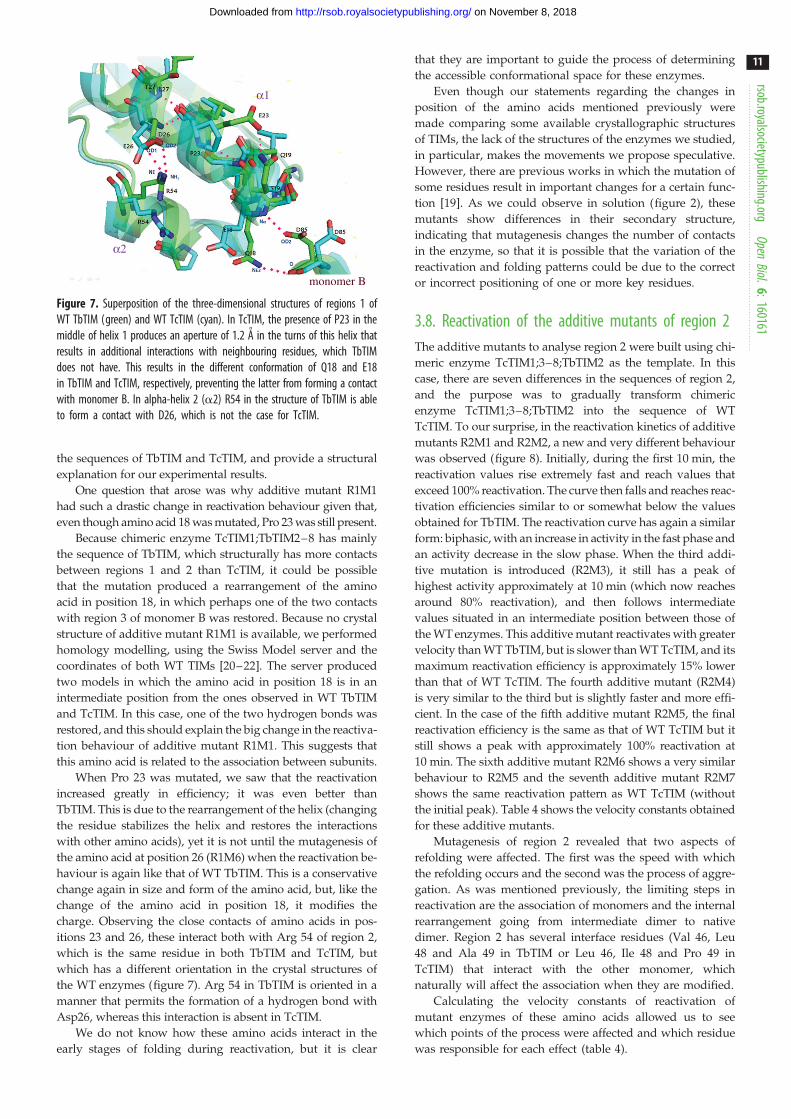
3.8. Reactivation of the additive mutants of region 2The additive mutants to analyse region 2 were built using chi-
meric enzyme TcTIM1;3–8;TbTIM2 as the template. In this
case, there are seven differences in the sequences of region 2,
and the purpose was to gradually transform chimeric
enzyme TcTIM1;3–8;TbTIM2 into the sequence of WT
TcTIM. To our surprise, in the reactivation kinetics of additive
mutants R2M1 and R2M2, a new and very different behaviour
was observed (figure 8). Initially, during the first 10 min, the
reactivation values rise extremely fast and reach values that
exceed 100% reactivation. The curve then falls and reaches reac-
tivation efficiencies similar to or somewhat below the values
obtained for TbTIM. The reactivation curve has again a similar
form: biphasic, with an increase in activity in the fast phase and
an activity decrease in the slow phase. When the third addi-
tive mutation is introduced (R2M3), it still has a peak of
highest activity approximately at 10 min (which now reaches
around 80% reactivation), and then follows intermediate
values situated in an intermediate position between those of
the WT enzymes. This additive mutant reactivates with greater
velocity than WT TbTIM, but is slower than WT TcTIM, and its
maximum reactivation efficiency is approximately 15% lower
than that of WT TcTIM. The fourth additive mutant (R2M4)
is very similar to the third but is slightly faster and more effi-
cient. In the case of the fifth additive mutant R2M5, the final
reactivation efficiency is the same as that of WT TcTIM but it
still shows a peak with approximately 100% reactivation at
10 min. The sixth additive mutant R2M6 shows a very similar
behaviour to R2M5 and the seventh additive mutant R2M7
shows the same reactivation pattern as WT TcTIM (without
the initial peak). Table 4 shows the velocity constants obtained
for these additive mutants.
Mutagenesis of region 2 revealed that two aspects of
refolding were affected. The first was the speed with which
the refolding occurs and the second was the process of aggre-
gation. As was mentioned previously, the limiting steps in
reactivation are the association of monomers and the internal
rearrangement going from intermediate dimer to native
dimer. Region 2 has several interface residues (Val 46, Leu
48 and Ala 49 in TbTIM or Leu 46, Ile 48 and Pro 49 in
TcTIM) that interact with the other monomer, which
naturally will affect the association when they are modified.
Calculating the velocity constants of reactivation of
mutant enzymes of these amino acids allowed us to see
which points of the process were affected and which residue
was responsible for each effect (table 4).
0
20
40
60
80
100
reac
tivat
ion
(%)
reac
tivat
ion
(%)
120
140
0 10 20 30 40 50 600
20
40
60
80
100
120
140TcTIMTbTIMR2M1R2M2
TcTIMTbTIMR2M3R2M4
TcTIMTbTIMR2M5R2M6
TcTIMTbTIMR2M7
0 10 20 30 40 50 60
0
20
40
60
80
100
120
140
0 10 20 30 40 50 600
20
40
60
80
100
120
140
0 10 20 30time (min) time (min)
40 50 60
(b)(a)
(c) (d)
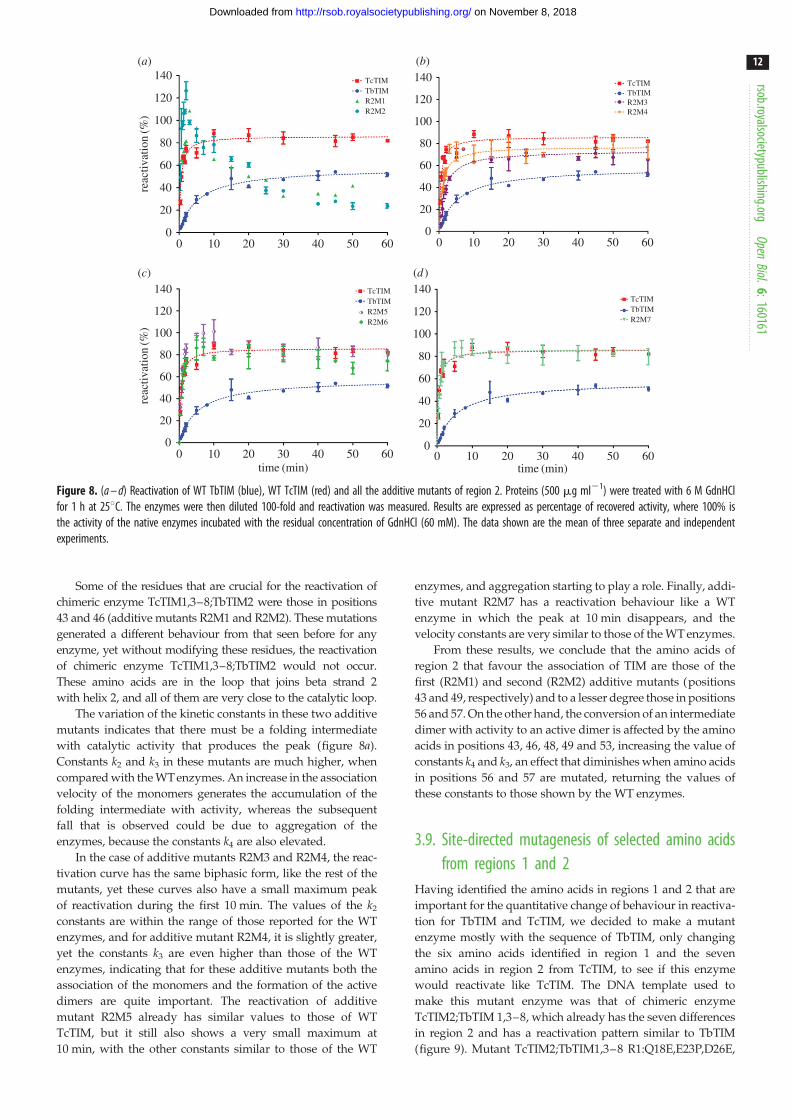
Figure 8. (a – d) Reactivation of WT TbTIM (blue), WT TcTIM (red) and all the additive mutants of region 2. Proteins (500 mg ml21) were treated with 6 M GdnHClfor 1 h at 258C. The enzymes were then diluted 100-fold and reactivation was measured. Results are expressed as percentage of recovered activity, where 100% isthe activity of the native enzymes incubated with the residual concentration of GdnHCl (60 mM). The data shown are the mean of three separate and independentexperiments.
rsob.royalsocietypublishing.orgOpen
Biol.6:160161
12
on November 8, 2018http://rsob.royalsocietypublishing.org/Downloaded from
Some of the residues that are crucial for the reactivation of
chimeric enzyme TcTIM1,3–8;TbTIM2 were those in positions
43 and 46 (additive mutants R2M1 and R2M2). These mutations
generated a different behaviour from that seen before for any
enzyme, yet without modifying these residues, the reactivation
of chimeric enzyme TcTIM1,3–8;TbTIM2 would not occur.
These amino acids are in the loop that joins beta strand 2
with helix 2, and all of them are very close to the catalytic loop.
The variation of the kinetic constants in these two additive
mutants indicates that there must be a folding intermediate
with catalytic activity that produces the peak (figure 8a).
Constants k2 and k3 in these mutants are much higher, when
compared with the WT enzymes. An increase in the association
velocity of the monomers generates the accumulation of the
folding intermediate with activity, whereas the subsequent
fall that is observed could be due to aggregation of the
enzymes, because the constants k4 are also elevated.
In the case of additive mutants R2M3 and R2M4, the reac-
tivation curve has the same biphasic form, like the rest of the
mutants, yet these curves also have a small maximum peak
of reactivation during the first 10 min. The values of the k2
constants are within the range of those reported for the WT
enzymes, and for additive mutant R2M4, it is slightly greater,
yet the constants k3 are even higher than those of the WT
enzymes, indicating that for these additive mutants both the
association of the monomers and the formation of the active
dimers are quite important. The reactivation of additive
mutant R2M5 already has similar values to those of WT
TcTIM, but it still also shows a very small maximum at
10 min, with the other constants similar to those of the WT
enzymes, and aggregation starting to play a role. Finally, addi-
tive mutant R2M7 has a reactivation behaviour like a WT
enzyme in which the peak at 10 min disappears, and the
velocity constants are very similar to those of the WT enzymes.
From these results, we conclude that the amino acids of
region 2 that favour the association of TIM are those of the
first (R2M1) and second (R2M2) additive mutants (positions
43 and 49, respectively) and to a lesser degree those in positions
56 and 57. On the other hand, the conversion of an intermediate
dimer with activity to an active dimer is affected by the amino
acids in positions 43, 46, 48, 49 and 53, increasing the value of
constants k4 and k3, an effect that diminishes when amino acids
in positions 56 and 57 are mutated, returning the values of
these constants to those shown by the WT enzymes.
3.9. Site-directed mutagenesis of selected amino acidsfrom regions 1 and 2
Having identified the amino acids in regions 1 and 2 that are
important for the quantitative change of behaviour in reactiva-
tion for TbTIM and TcTIM, we decided to make a mutant
enzyme mostly with the sequence of TbTIM, only changing
the six amino acids identified in region 1 and the seven
amino acids in region 2 from TcTIM, to see if this enzyme
would reactivate like TcTIM. The DNA template used to
make this mutant enzyme was that of chimeric enzyme
TcTIM2;TbTIM 1,3–8, which already has the seven differences
in region 2 and has a reactivation pattern similar to TbTIM
(figure 9). Mutant TcTIM2;TbTIM1,3–8 R1:Q18E,E23P,D26E,

00 10 20 30
time (min)40 50 60
20
40
60
reac
tivat
ion
(%) 80
100
120
TcTIM
TbTIMTcTIM2; TbTIM1,3–8
TcTIM2; TbTIM1,3–8 R1Q18E, S32T, I33F,N34D
TcTIM2; TbTIM1,3–8 R1Q18E, E23P,D26E,S32T, I33F,N34D
Figure 9. Reactivation of WT TbTIM, WT TcTIM, a chimeric enzyme and twomutants obtained by site-directed mutagenesis. Proteins (500 mg ml21)were treated with 6 M GdnHCl for 1 h at 258C. The enzymes were thendiluted 100-fold and reactivation was measured. Results are expressed aspercentage of recovered activity, where 100% is the activity of the nativeenzymes incubated with the residual concentration of GdnHCl (60 mM).The data shown are the means of three separate and independentexperiments.
rsob.royalsocietypublishing.orgOpen
Biol.6:160161
13
on November 8, 2018http://rsob.royalsocietypublishing.org/Downloaded from
S32T,I33F,N34D was constructed, and, as expected, it had a
reactivation pattern just like WT TcTIM (figure 9). The kinetic
parameters turned out to be slightly different, because they
have a greater affinity for its substrate, but their values are
within the range of the WT enzymes (table 3).
As seen with the reactivation of the additive mutants of
region 2, all seven amino acids are important, but in the case
of the reactivation of the additive mutants of region 1, there
were three amino acids that had a greater effect. Two additio-
nal mutants were made to study the effects of these amino
acids. The mutants were TcTIM2;TbTIM1,3–8 R1:Q18E,
S32T,I33F,N34D and TcTIM 2;TbTIM1,3–8 R1:Q18E,E23P,-
D26E,S32T,I33F,N34D. The first mutant was constructed to
explore amino acids at positions 18 and 32. Amino acids at pos-
itions 33 and 34 were also changed, because the contact map of
these residues show hydrogen bonds in the structure of WT
TbTIM, which is absent for residue 32 in the structure of
WT TcTIM. The second mutant explored the combination
of amino acids at positions 18, 23 and 32, and amino acid at
position 26 was added, because it is important for recovering
the reactivation pattern of the WT enzyme (see reactivation
of the additive mutants of region 1).
As mentioned earlier, chimeric enzyme TcTIM2;Tb-
TIM1,3–8 reactivates rapidly and with an efficiency like that
of WT TbTIM (figure 9), but changing amino acids at positions
18, 32, 33 and 34 increased the efficiency of reactivation greatly,
making it even better than that of WT TcTIM. This mutant also
showed a peak of increased activation at 10 min (like that of the
additive mutants of region 2), but at the end of the time in
which reactivation was followed (40–80 min) it had lower
values, by approximately 10%, when compared with WT
TcTIM at the same times (figure 9). This fall at the end of the
reactivation period for this mutant can be explained by the
interaction that amino acids at positions 32, 33 and 34 have
with those at positions 56 and 57 (which are in region 2).
In WT TbTIM and WT TcTIM, exactly all of these amino
acids are different, so, when they are changed, all interactions,
hydrogen bonds, etc., are also altered. Additionally, as already
seen in the reactivation of additive mutant of region 2, amino
acids at positions 56 and 57 recover the reactivation patterns
to that of the WT enzymes and affect the internal rearrange-
ment of the active intermediate and the aggregation. Thus, a
perturbation in these sites could produce this behaviour. As
in the additive mutants of region 2, the reactivation curve
shows a peak of higher reactivation at 10 min, and it appears
when the amino acids in positions 43 and 46 are mutated
(Ser for Pro and Val for Leu, respectively). The Pro in position
43 changes the contacts between several amino acids in region 1
and region 2, modifying the stability of the enzyme.
4. Discussion4.1. The role of the loops in reactivation: region 1The amino acid sequences of WT TbTIM and WT TcTIM are
very similar as are their three-dimensional structures, both
have a quantitatively different behaviour in the reactivation of
their monomers that have been unfolded with GdnHCl. In
this work, we investigated which regions and which amino
acids are responsible for these differences. This investigation
was based on previous observations that have shown that in
TIM only native dimers have catalytic activity and this is con-
sidered to be evidence that the quaternary structure of the
enzyme is correct [8,9,23,24]. Even though there are also reports
of activities in monomeric TIMs, these activities are very much
lower than those reported for TbTIM and TcTIM [25,26].
Our results with the additive mutants of region 1 indicate
that the amino acids in positions 18, 19, 20, 22, 23 and 26 of
the sequence are those that influence reactivation positively
to produce the folding pattern of TbTIM, whereas in region
2, all seven amino acids are important for reactivation. In
the three-dimensional structure of the enzymes, most of
these residues are exposed to the solvent or belong to one
of the loops of the TIM barrel. The first, at position 18, is at
the beginning of helix 1, just after interfacial loop 1 (which
joins beta sheet 1 with helix 1), whereas the amino acids at
positions 32, 33 and 34 are in external loop 1, which connects
helix 1 with beta sheet 2. In the cases of region 2, residues at
positions 43 and 46 (which affect monomer association) are in
interfacial loop 2 and amino acids at positions 56 and 57 are
in external loop 2. Several studies have shown that loops play
an important role in protein folding, because the contacts that
they form with the rest of the polypeptide chain limit the
available conformational space, accelerating or slowing
down the process [27–30]. Thus, the position of these
amino acids in the loops could be a factor that guides the
folding in these proteins and the difference in their reactiva-
tion could be due to the interactions formed in the initial
points of folding or to the dihedral angles formed by the
side chains of these amino acids. TcTIM has different dihe-
dral angles from TbTIM, because in both enzymes, helix 1
and helix 2 have a Pro in the middle of the sequence,
which alters their structure. In contrast with other studies
in which the isomerization of Pro is a factor that slows the
folding process of proteins [31,32], this does not happen

rsob.royalsocietypublishing.orgOpen
Biol.6:160161
14
on November 8, 2018http://rsob.royalsocietypublishing.org/Downloaded from
with TcTIM, whose reactivation is faster and more efficient
and shows less aggregation than TbTIM.
The interface of TIM is made mainly by some of its loops.
In advanced stages of folding, the movement of these loops is
a factor that influences the process because they are related to
the dimerization of the monomers, one of the crucial steps of
folding. The association of the monomers in TIM permits the
recovery of optimal catalytic activity [9].
The loops that are involved in dimerization are inter-
facial loops 1–4 (those that join the beta sheet with the
subsequent alpha helix). Loop 3 is the longest loop in the
enzyme and it is positioned over loop 2 of the other mono-
mer, allowing the interaction between the residues of
interfacial loops 1 and 4. When dimerization takes place the
mobility of these loops, together with that of loop 8, is
restricted to keep the correct position of the catalytic amino
acids. Meanwhile, loops 6 and 7 increase their mobility, so
they can continue to protect the catalytic site and allow the
entrance of substrates and the liberation of products [28].
Modifying the contacts of loops 1–4 and 8 by mutating
amino acids in regions 1 and 2 can increase the mobility of
these loops altering the reactivation pattern and the catalytic
parameters of the mutant enzymes; the results shown in
table 3 and figure 6 are consistent with this.
The Km values for the additive mutants from region 1
(R1M1, R1M2, R1M3, R1M4, R1M5, R1M8, R1M9, R1M11
and R1M13) were close to half of the value for the WT enzymes
(table 3). This could be due the fact that region 1 contains two of
the four catalytic residues of TIM. These are Asn 11 and Lys 13,
whose role in catalysis is the recognition of the substrate and
the stabilization of the negative charges of the intermediates
during the enzymatic reaction [33]. The changes in the amino
acid sequence in this region can result in the modification of
some contacts of the residues that affect catalysis. Both
Asn 11 and Lys 13 are in interfacial loop 1. Several changes
in region 1 can modify the interactions and positioning of the
rest of the amino acids. The most important residues are in pos-
itions 18, 19, 20, 22, 23 and 26, because their changes induce the
recovery of the catalytic parameters.
After the association of the monomers, small adjustments
in the loops of TIM may follow. That is why in additive
mutants of region 1 the change of Km to values comparable
with those of the WT enzymes occurs when the structure of
helix 1 and interfacial loop 1 acquire a conformation like
WT TbTIM when Pro 23 and Glu 26 are changed, and the tor-
sion angles of the helix become like those of WT TbTIM
(figure 7). This allows the reestablishment of contacts with
region 2, reducing mobility and stabilizing this area.
4.2. The role of the loops in reactivation: region 2Region 2 controls the speed of reactivation, possibly because
of the close connection it has with region 1 of the same mono-
mer and regions 2 and 3 of the adjacent monomer. Mutants of
region 2 had important variations in their kinetic properties
because they affect the association of both monomers prob-
ably increasing the mobility of the interfacial loops (thus
also increasing the catalytic capacity and destabilizing the
active site in the enzymes).
Catalysis in chimeric enzyme TcTIM1,3–8;TbTIM2 was
strongly affected (table 3). The analysis of its secondary struc-
ture by circular dichroism showed the characteristic pattern
of a (b/a)8 barrel but with a signal considerably more intense
than the WT enzymes (figure 2). This has also been previously
observed by circular dichroism in equilibrium denaturing
studies of TcTIM, where an intermediate with similar charac-
teristics (increase of secondary structure and intensity of
fluorescence) was reported [13]. The chimeric enzyme was
also analysed by size exclusion chromatography [11] to ascer-
tain that the very low activity was due to the dimer. It had
values that were similar to a monoTIM [25,26,34], indicating
that the association of the monomers was affected.
Amino acids in positions 43 and 46 in region 2 were found
to be critical for the velocity of reactivation (association of the
enzyme) and the velocity of aggregation, and they are loca-
ted at the end of interfacial loop 2 that joins beta strand 2 and
helix 2. In additive mutants R2M1 and R2M2, the reactivation
curve has a peak with great activity caused by the accumu-
lation of an intermediary species with good activity, which
subsequently falls because of the aggregation of this dimeric
species during the internal rearrangement to form the native
dimer. There are great changes in the velocity constants that
affect these phenomena; for example, the association constants
for these additive mutants are two orders of magnitude higher
than those of the WT enzymes and the aggregation constants
are also increased by one order of magnitude, favouring the
appearance of the reactive intermediary and its accumulation.
On the one hand, the mutation of these two amino acids allows
the reactivation of the enzymes, when compared with chimeric
enzyme TcTIM1,3–8;TbTIM2, but both the catalytic properties
and the kinetic constants of reactivation are affected. These
additive mutants also showed a fourfold to sevenfold increase
in the value of Km over those of the WT enzymes, which means
that the mutations favour the association of the monomers,
stabilizing the active site. On the other hand, their dissociation
constants were slightly smaller than those of the WT enzymes,
indicating that the fall in the reactivation pattern after 10 min is
not owing to dissociation of the enzyme, but to aggregation
during the internal rearrangement to form the native dimer.
The fourth mutation of region 2 (Ala to Pro), just like when
a Pro was introduced into a helix when mutating region 1,
caused the modification of the dihedral angles with the neigh-
bouring amino acids and the change of contacts with other
residues like Arg 54, which has a different conformation in
WT TbTIM and WT TcTIM. In this last enzyme, Pro can have
more interactions with amino acids in helix 1 (figure 7). The
Km value of R2M4 is almost equal to that of the WT enzyme.
The amplitude and maximal percentage reached by the
reactivation curves and their tendency to remain at stable
values (around 60 min) is related to the propensity of each
mutant enzyme to aggregate. In region 2, this tendency is
associated with amino acids in positions 56 and 57, which
are located in external loop 2 near amino acids in positions
32, 33 and 34 of external loop 1. When amino acids in positions
56 and 57 are mutated, the amplitude of the reactivation curve
is recovered, and the values at longer times are stabilized,
because aggregation is minimal or does not occur. Amino
acid in position 57, particularly, makes the initial peak at
10 min disappear (figure 8d); it also returns the value of the vel-
ocity constant for association to that shown by WT TcTIM,
indicating that it affects the association of the enzyme.
In the case of mutant TcTIM2;TbTIM1,3–8 R1:Q18E,
S32T,I33F,N34D, the reactivation peak at 10 min appeared
again. In this mutant, two of the points (the amino acid in
position 18 and the amino acids in positions 32, 33 and 34
together) with greatest effect on the reactivation patterns

rsob.royalsocietypublishing.orgOpen
Biol.6:160161
15
on November 8, 2018http://rsob.royalsocietypublishing.org/Downloaded from
were changed. Residue 18 is located in internal loop 1, and
residues 32, 33 and 34 are located in external loop 1, and,
as was previously seen, changes in this external loop have
effects on the amplitude of the reactivation curve and the ten-
dency to aggregate, because interactions between loops 1 and
2 are affected. This mutant showed an increase in the ampli-
tude of the reactivation pattern, but it has also a tendency to
aggregate, indicating problems in the association between
dimers and generating an accumulation of molecular species
that is seen as the peak at 10 min (like the one observed for
region 2) that eventually leads to aggregation.
Another critical point is the amino acid at position 23. As
already mentioned, the introduction of a Pro in the middle of
helix 1 produces important changes that affect several
contacts all along the helix. In mutant TcTIM2;TbTIM1,3–8
R1:Q18E,E23P,D26E,S32T,I33F,N34D, this residue and the
one in position 26 were changed, which allowed a restructur-
ing of helix 1, internal loop 1 and external loop 1, which also
allowed a better interaction between helix 1 and helix 2
(figure 7) and a better association of monomers, yielding a
reactivation pattern comparable with WT TcTIM.
4.3. Aggregation of these enzymesChanez-Cardenas et al. [13] reported two critical points where
aggregation can occur along the reactivation route for WT
TbTIM. The first occurs during the association of the
dimers, and results from this work indicate that amino
acids in positions 18, 43, 46, 48 and 57 have an effect on
this process, because modifying these residues leads to an
inefficient reactivation. The second critical point for aggrega-
tion is during the restructuring of the dimeric intermediate to
the active dimer. Here, amino acids in positions 32, 33, 34, 56
and 57 are those that have an influence, because modifying
their interactions influences the amplitude of the reactivation
curves, and this is very evident at times near 60 min.
5. ConclusionOne of the differences between WT TbTIM and WT TcTIM is
the rigidity of their structure. In the case of WT TcTIM, the
structure is laxer, which permits a greater degree of confor-
mational freedom and, in the case of reactivation, the
environment around regions 1 and 2, favours refolding. From
this study, it is clear that the contacts established between
these two regions is essential for reactivation to take place.
Our studies have established the critical residues involved
in the renaturation/reactivation of two TIMs from two
trypanosomatids. The important positions of amino acids in
region 1 are 18, 23, 26, 32, 33 and 34, whereas for region 2,
they are 43, 46, 48, 49, 53, 56 and 57. To make a TcTIM reac-
tivate with a TbTIM-like behaviour you need to mutate the
following amino acids: R1: 18, 19, 20, 22, 23 and 26, and
R2: 43, 46, 48, 49, 53, 56 and 57. To make a TbTIM reactivate
with a TcTIM-like behaviour you need to mutate amino acids
R1: 18, 23, 26, 32, 33 and 34, and R2: 43, 46, 48, 49, 53, 56 and
57. Thus, 13 residues, or 5% of the protein sequence, are criti-
cal in determining a specific physico-chemical property of the
enzyme.
The amino acids in the internal loops control the process
of dimerization, whereas those in the external loops control
the stability of the dimer during the transition of intermediate
dimer to native dimer, avoiding aggregation.
In this work, we developed a strategy to search systemati-
cally multiple amino acids from quite similar proteins that
are involved in quantitative differences of their biochemical
and/or biophysical properties. We favour this method over a
random mutagenesis approach; it is able to find the residues
involved in controlling the corresponding properties, with a
relatively small and restricted number of chimeric enzymes,
additive mutants and planned site-directed mutant proteins,
continuously monitored by experimental results (see [17]).
Additive mutagenesis provided insights into the process and
mechanism of the reactivation of TbTIM and TcTIM. We
believe that this experimental approach can be of more general
value in studies of protein–function relationships.
Data accessibility. The data supporting this article have been includedin the main text, tables and figures.
Authors’ contributions. M.R.-B. and R.P.-M. conceived and designed theexperiments; M.R.-B. and N.C. performed the experiments; M.R.-B.and R.P.-M. analysed the data; M.R.-B. and R.P.-M. wrote the manu-script. All authors gave final approval for publication.
Competing interests. The authors declare they have no competing interest.
Funding. This work was supported by grant no. 167823 from the ConsejoNacional de Ciencia y Tecnologıa (to R.P.-M.) and grant no. IN221812from the Direccion General de Asuntos del Personal AcademicoUniversidad Nacional Autonoma de Mexico (to R.P.-M.). M.R.-B.was the recipient of a fellowship from CONACyT (no. 262118).
Acknowledgements. The authors thank Ms Guadalupe Vigueras-Menesesfor performing the initial experiments of reactivation with six chi-meric enzymes. The authors also thank Dr Juan Pablo Pardo forsuggesting and help with the use of the DYNAFIT program, andDr Diego Gonzalez-Halphen for helpful discussions and careful revi-sion of the manuscript. The authors also acknowledge Dr ArmandoGomez-Puyou for the helpful discussions during the initial stagesof the research. This work was performed by M.R.-B. as part of thefulfilment of her doctoral dissertation in the Posgrado en CienciasBioquımicas of the Universidad Nacional Autonoma de Mexico.
References
1. Stevens JR, Noyes HA, Dover GA, Gibson WC. 1999The ancient and divergent origins of the humanpathogenic trypanosomes, Trypanosoma brucei andT. cruzi. Parasitology 118, 107 – 116. (doi:10.1017/S0031182098003473)
2. Reyes-Vivas H, Martınez-Martınez E, Mendoza-Hernandez G, Lopez-Velazquez G, Perez-Montfort R,Tuena de Gomez-Puyou M, Gomez-Puyou A. 2002Susceptibility to proteolysis of triosephosphate
isomerase from two pathogenic parasites:characterization of an enzyme with an intact and anicked monomer. Proteins 48, 580 – 590. (doi:10.1002/prot.10179)
3. Tellez-Valencia A, Olivares-Illana V, Hernandez-Santoyo A, Perez-Montfort R, Costas M, Rodrıguez-Romero A, Lopez-Calahorra F, Tuena de Gomez-Puyou M, Gomez-Puyou A. 2004 Inactivation oftriosephosphate isomerase from Trypanosoma cruzi
by an agent that perturbs its dimer interface.J. Mol. Biol. 341, 1355 – 1365. (doi:10.1016/j.jmb.2004.06.056)
4. Maldonado E, Moreno A, Panneerselvam K, Ostoa-Saloma P, Garza-Ramos G, Soriano-Garcıa M, Perez-Montfort R, Tuena de Gomez-Puyou M, Gomez-Puyou A. 1997 Crystallization and preliminary X-Rayanalysis of triosephosphate isomerase fromTrypanosoma cruzi. Prot. Pept. Lett. 4, 139 – 144.

rsob.royalsocietypublishing.orgOpen
Biol.6:160161
16
on November 8, 2018http://rsob.royalsocietypublishing.org/Downloaded from
5. Maldonado E, Soriano-Garcıa M, Moreno A, CabreraN, Garza-Ramos G, de Gomez-Puyou M, Gomez-Puyou A, Perez-Montfort R. 1998 Differences in theintersubunit contacts in triosephosphate isomerasefrom two closely related pathogenic trypanosomes.J. Mol. Biol. 283, 193 – 203. (doi:10.1006/jmbi.1998.2094)
6. Ostoa-Saloma P, Garza-Ramos G, Ramırez J, BeckerI, Berzunza M, Landa A, Gomez-Puyou A, Tuena deGomez-Puyou M, Perez-Montfort R. 1997 Cloning,expression, purification and characterization oftriosephosphate isomerase from Trypanosoma cruzi.Eur. J. Biochem. 244, 700 – 705. (doi:10.1111/j.1432-1033.1997.00700.x)
7. Garza-Ramos G, Cabrera N, Saavedra-Lira E, Tuenade Gomez-Puyou M, Ostoa-Saloma P, Perez-Montfort R, Gomez-Puyou A. 1998 Sulfhydrylreagent susceptibility in proteins with highsequence similarity: triosephosphate isomerase fromTrypanosoma brucei, Trypanosoma cruzi andLeishmania mexicana. Eur. J. Biochem. 253, 684 –691. (doi:10.1046/j.1432-1327.1998.2530684.x)
8. Perez-Montfort R, Garza-Ramos G, Alcantara GH,Reyes-Vivas H, Gao XG, Maldonado E, de Gomez-Puyou MT, Gomez-Puyou A. 1999 Derivatization ofthe interface cysteine of triosephosphate isomerasefrom Trypanosoma brucei and Trypanosoma cruzi asprobe of the interrelationship between the catalyticsites and the dimer interface. Biochemistry 38,4114 – 4120. (doi:10.1021/bi982425s)
9. Zomosa-Signoret V, Hernandez-Alcantara G, Reyes-Vivas H, Martınez-Martınez E, Garza-Ramos G,Perez-Montfort R, Tuena de Gomez-Puyou M,Gomez-Puyou A. 2003 Control of the reactivationkinetics of homodimeric triosephosphate isomerasefrom unfolded monomers. Biochemistry 42, 3311 –3318. (doi:10.1021/bi0206560)
10. Benıtez-Cardoza CG, Rojo-Domınguez A, Hernandez-Arana A. 2001 Temperature-induced denaturationand renaturation of triosephosphate isomerase fromSaccharomyces cerevisiae: evidence of dimerizationcoupled to refolding of the thermally unfoldedprotein. Biochemistry 40, 9049 – 9058. (doi:10.1021/bi010528w)
11. Chanez-Cardenas ME, Fernandez-Velasco DA,Vazquez-Contreras E, Coria R, Saab-Rincon G, Perez-Montfort R. 2002 Unfolding of triosephosphateisomerase from Trypanosoma brucei: identificationof intermediates and insight into the denaturationpathway using tryptophan mutants. Arch. Biochem.Biophys. 399, 117 – 129. (doi:10.1006/abbi.2001.2749)
12. Gokhale RS, Ray SS, Balaram H, Balaram P. 1999Unfolding of Plasmodium falciparumtriosephosphate isomerase in urea and guanidiniumchloride: evidence for a novel disulfide exchange
reaction in a covalently cross-linked mutant.Biochemistry 38, 423 – 431. (doi:10.1021/bi981087s)
13. Chanez-Cardenas ME, Perez-Hernandez G, Sanchez-Rebollar BG, Costas M, Vazquez-Contreras E. 2005Reversible equilibrium unfolding of triosephosphateisomerase from Trypanosoma cruzi in guanidiniumhydrochloride involves stable dimeric andmonomeric intermediates. Biochemistry 44, 10883 – 10 892. (doi:10.1021/bi047687a)
14. Waley SG. 1973 Refolding of triose phosphateisomerase. Biochemistry 135, 165 – 172. (doi:10.1042/bj1350165)
15. Sun AQ, Yuksel KU, Gracy RW. 1993 Interactionsbetween the catalytic centers and subunit interfaceof triosephosphate isomerase probed by refolding,active site modification, and subunit exchange.J. Biol. Chem. 268, 26 872 – 26 878.
16. Rietveld AW, Ferreira ST. 1998 Kinetics and energeticof subunit dissociation/unfolding of TIM: Theimportance of oligomerization for conformationalpersistence and chemical stability of proteins.Biochemistry 37, 933 – 937. (doi:10.1021/bi9721593)
17. Garcıa-Torres I, Cabrera N, Torres-Larios A,Rodrıguez-Bolanos M, Dıaz-Mazariegos S, Gomez-Puyou A, Perez-Montfort R. 2011 Identification ofamino acids that account for long-range interactionsin two triosephosphate isomerases from pathogenictrypanosomes. PLoS ONE 6, e18791. (doi:10.1371/journal.pone.0018791)
18. Kuzmic P. 1996 Program DYNAFIT for the analysis ofenzyme kinetic data: application to HIV proteinase.Anal. Biochem. 237, 260 – 273. (doi:10.1006/abio.1996.0238)
19. Kishan R, Zeelen JP, Noble ME, Borchert TV,Mainfroid V, Goraj K, Martial JA, Wierenga RK. 1994Modular mutagenesis of a TIM-barrel enzyme: thecrystal structure of a chimeric E. coli TIM having theeighth beta alpha-unit replaced by the equivalentunit of chicken TIM. Protein Eng. 7, 945 – 951.(doi:10.1093/protein/7.8.945)
20. Arnold K, Bordoli L, Kopp J, Schwede T. 2006 TheSWISS-MODEL workspace: a web-basedenvironment for protein structure homologymodelling. Bioinformatics 22, 195 – 201. (doi:10.1093/bioinformatics/bti770)
21. Biasini M et al. 2014 SWISS-MODEL: modellingprotein tertiary and quaternary structure usingevolutionary information. Nucleic Acids Res. 42,W252 – W258. (doi:10.1093/nar/gku340)
22. Guex N, Peitsch MC, Schwede T. 2009 Automatedcomparative protein structure modelling with swiss-model and swiss-Pdb viewer: a historicalperspective. Electrophoresis 30(Suppl. 1),s162 – s173. (doi:10.1002/elps.200900140)
23. Garza-Ramos G, Perez-Montfort R, Rojo-DomınguezA, de Gomez-Puyou MT, Gomez-Puyou A. 1996
Species-specific inhibition of homologous enzymesby modification of nonconserved amino acidsresidues. The cysteine residues of triosephosphateisomerase. Eur. J. Biochem. 241, 114 – 120. (doi:10.1111/j.1432-1033.1996.0114t.x)
24. Reyes-Vivas H, Hernandez-Alcantara G, Cabrera N,Perez-Montfort R, Tuena de Gomez-Puyou M,Gomez-Puyou A. 2001 Factors that control thereactivity of the interface cysteine oftriosephosphate isomerase from Trypanosomabrucei and Trypanosoma cruzi. Biochemistry 40,3134 – 3140. (doi:10.1021/bi002619j)
25. Schliebs W, Thanki N, Jaenicke R, Wierenga RK.1997 A double mutation at the tip of the dimerinterface loop of triosephosphate isomerasegenerates active monomers with reduced stability.Biochemistry 36, 9655 – 9662. (doi:10.1021/bi963086a)
26. Thanki N, Zeelen JP, Mathieu M, Jaenicke R,Abagyan RA, Wierenga RK, Schliebs W. 1997 Proteinengineering with monomeric triosephosphateisomerase (monoTIM): the modelling and structureverification of seven-residue loop. Protein Eng. 10,159 – 167. (doi:10.1093/protein/10.2.159)
27. Gavrilov Y, Dagan S, Levy Y. 2015 Shortening a loopcan increase protein native state entropy. Proteins83, 2137 – 2146. (doi:10.1002/prot.24926)
28. Katebi AR, Jernigan RL. 2014 The critical role of theloops of triosephosphate isomerase for itsoligomerization, dynamics, and functionality.Protein Sci. 23, 213 – 228. (doi:10.1002/pro.2407)
29. Viguera AR, Serrano L. 1997 Loop length,intramolecular diffusion and protein folding.Nat. Struct. Biol. 4, 939 – 946. (doi:10.1038/nsb1197-939)
30. Krieger F, Fierz B, Bieri O, Drewello M, Kiefhaber T.2003 Dynamics of unfolded polypeptide chains asmodel for the earliest steps in protein folding.J. Mol. Biol. 332, 265 – 274. (doi:10.1016/S0022-2836(03)00892-1)
31. Feige MJ, Hendershot LM, Buchner J. 2010 Howantibodies fold. Trends Biochem. Sci. 35, 189 – 198.(doi:10.1016/j.tibs.2009.11.005)
32. Gruber T, Balbach J. 2015 Protein foldingmechanism of the dimeric amphiphysin II/Bin 1 N-BAR domain. PLoS ONE 10, e0136922. (doi:10.1371/journal.pone.0136922)
33. Wierenga RK, Kapetaniou EG, Venkatesan R. 2010Triosephosphate isomerase: a highly evolvedbiocatalyst. Cell. Mol. Life Sci. 67, 3961 – 3982.(doi:10.1007/s00018-010-0473-9)
34. Saab-Rincon G, Juarez VR, Osuna J, Sanchez F,Soberon X. 2001 Different strategies to recover theactivity of monomeric triosephosphate isomeraseby directed evolution. Protein Eng. 14, 149 – 155.(doi:10.1093/protein/14.3.149)

rsob.royalsocietypublishing.org
CorrectionCite this article: Rodrıguez-Bolanos M,
Cabrera N, Perez-Montfort R. 2016 Correction
to ‘Identification of the critical residues
responsible for differential reactivation of
the triosephosphate isomerases of two
trypanosomes’. Open Biol. 6: 160294.
http://dx.doi.org/10.1098/rsob.160294
Correction to ‘Identification of the criticalresidues responsible for differentialreactivation of the triosephosphateisomerases of two trypanosomes’
Monica Rodrıguez-Bolanos, Nallely Cabrera and Ruy Perez-Montfort
Open Biol. 6, 160161. (Published online 12 October 2016). (doi:10.1098/rsob.
160161)
In table 1c, in the left column, the seven additive mutants of TbTIM and TcTIM
for region 2 named R1M1, R1M2, R1M3, R1M4, R1M5, R1M6 and R1M7,
should be named R2M1, R2M2, R2M3, R2M4, R2M5, R2M6 and R2M7,
respectively.
The correct table appears below
(c)mutant
no. additive mutationsin region 2
regions ofTcTIM
scheme ofdifferent aminoacids in region 2
R2M1 1 1,3 – 8
R2M2 2 1,3 – 8
R2M3 3 1,3 – 8
R2M4 4 1,3 – 8
R2M5 5 1,3 – 8
R2M6 6 1,3 – 8
R2M7 7 1,3 – 8
& 2016 The Authors. Published by the Royal Society under the terms of the Creative Commons AttributionLicense http://creativecommons.org/licenses/by/4.0/, which permits unrestricted use, provided the originalauthor and source are credited.