Identification of scatter sources and significant...
43
© Fraunhofer SCAI Identification of scatter sources and significant reduction of scatter occurrence with DIFFCRASH Marian Bulla (Altair Germany) Dominik Borsotto (Fraunhofer SCAI) Clemens A. Thole (Fraunhofer SCAI) Innovation Intelligence ®
Transcript of Identification of scatter sources and significant...
© Fraunhofer SCAI
Identification of scatter sources and significant
reduction of scatter occurrence with
DIFFCRASH
Marian Bulla (Altair Germany) Dominik Borsotto (Fraunhofer SCAI)
Clemens A. Thole (Fraunhofer SCAI)
Innovation Intelligence®
© Fraunhofer SCAI
Agenda
Introduction
Reasons for scatter
Analysis methods
Basic analysis methods
Correlation based methods
PCA based methods
Example Case
Analysis of a Chrysler NEON model (RADIOSS)
© Fraunhofer SCAI
Introduction: Reasons for scatter
Potential scatter of simulation results is still a challenging issue
For the design and optimization of car models it is very helpful to deal
with a simulation model, which generates similar results even if slight
changes of the model are performed.
Keyword: Predictability
Reasons for scatter are various.
© Fraunhofer SCAI
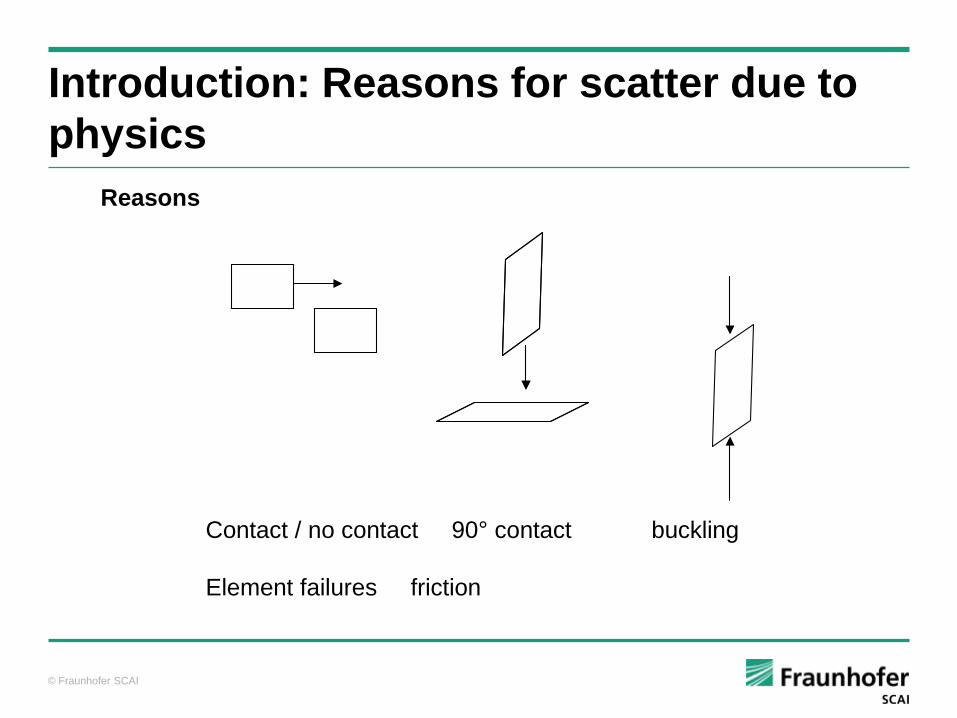
Introduction: Reasons for scatter due to
physics
Reasons
Contact / no contact 90° contact buckling
Element failures friction
© Fraunhofer SCAI
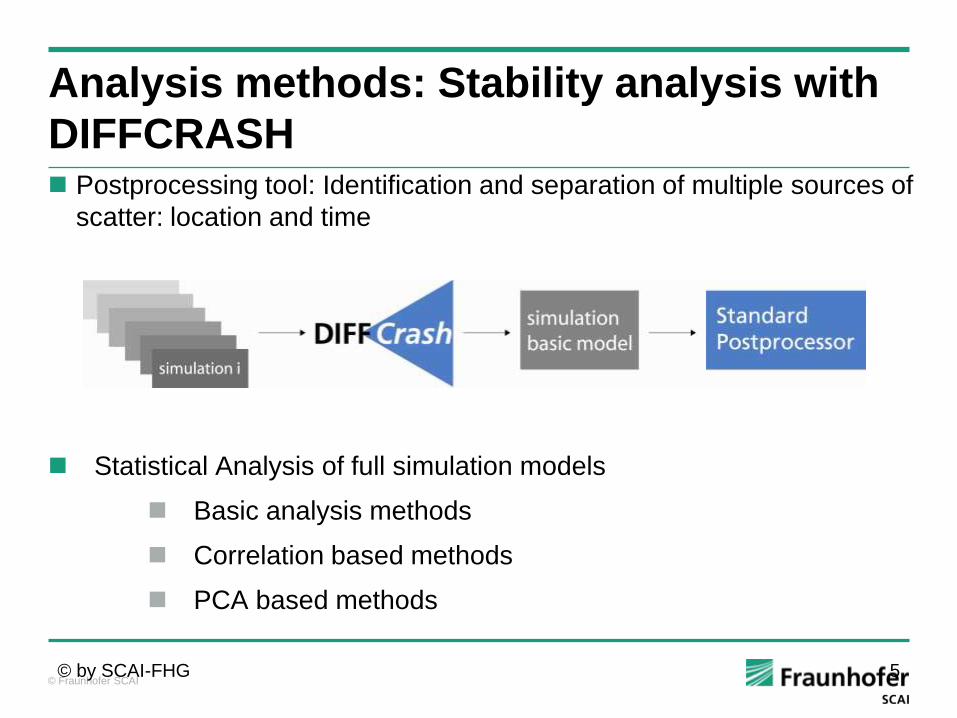
Analysis methods: Stability analysis with
DIFFCRASH Postprocessing tool: Identification and separation of multiple sources of
scatter: location and time
Statistical Analysis of full simulation models
Basic analysis methods
Correlation based methods
PCA based methods
© by SCAI-FHG 5
© Fraunhofer SCAI
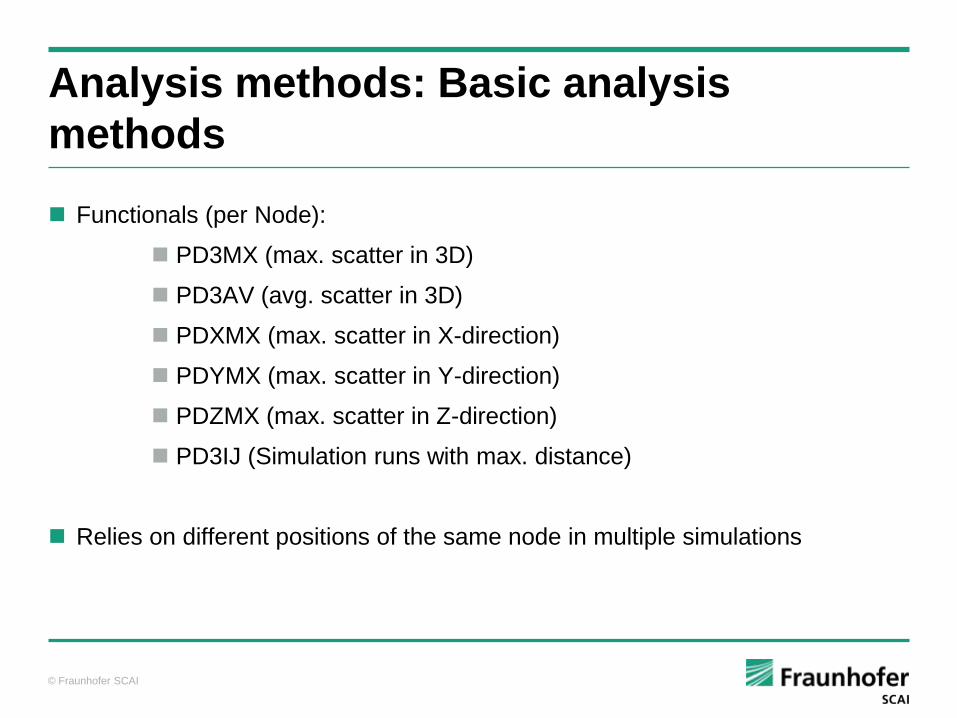
Analysis methods: Basic analysis
methods
Functionals (per Node):
PD3MX (max. scatter in 3D)
PD3AV (avg. scatter in 3D)
PDXMX (max. scatter in X-direction)
PDYMX (max. scatter in Y-direction)
PDZMX (max. scatter in Z-direction)
PD3IJ (Simulation runs with max. distance)
Relies on different positions of the same node in multiple simulations
© Fraunhofer SCAI
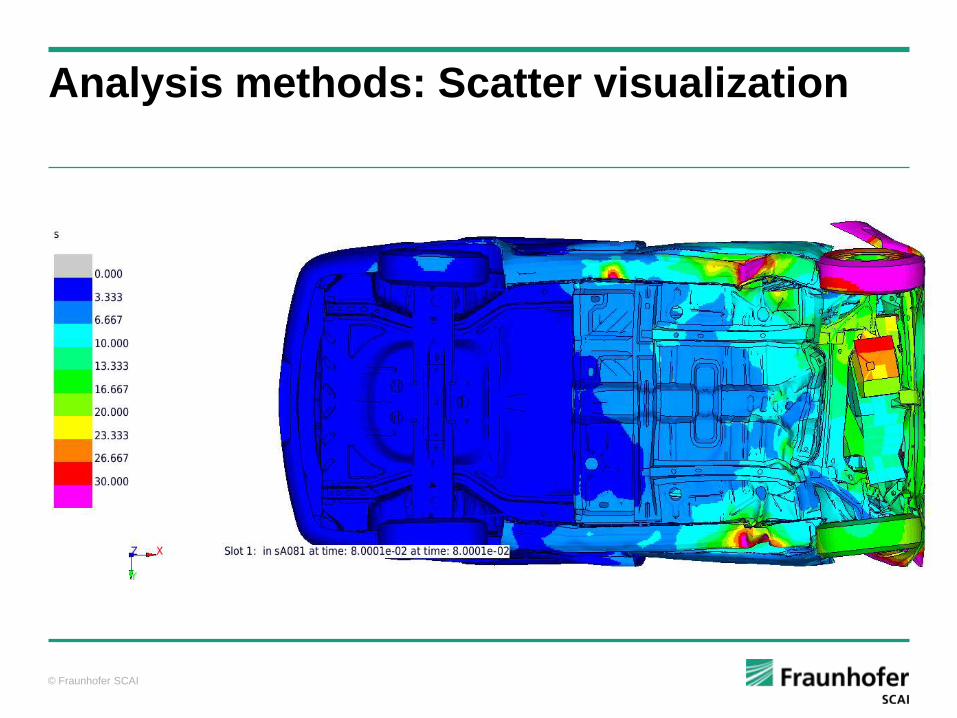
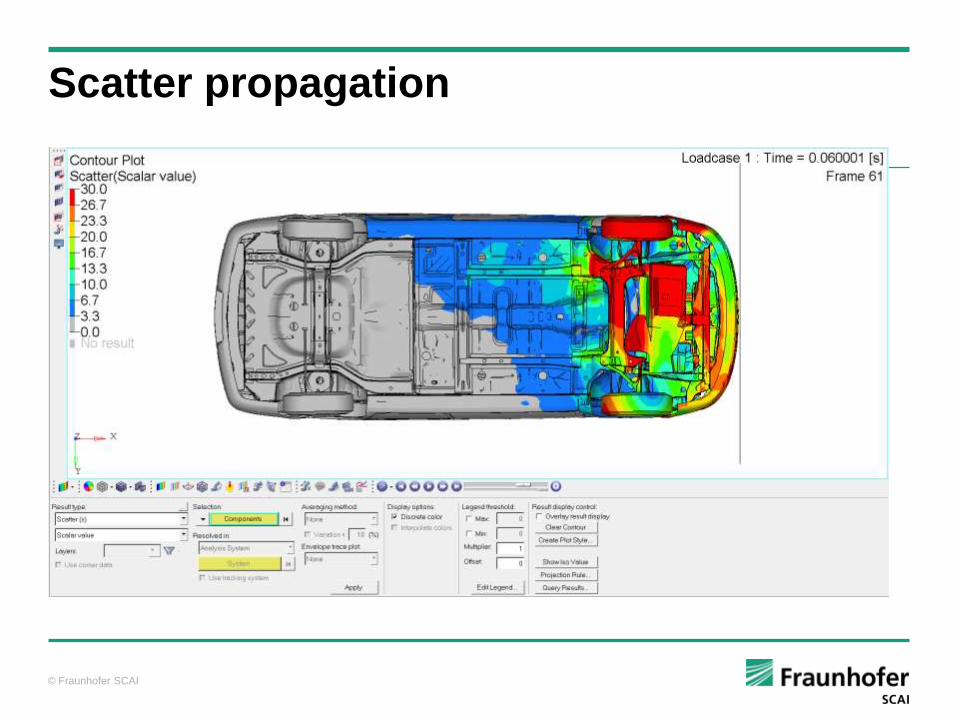
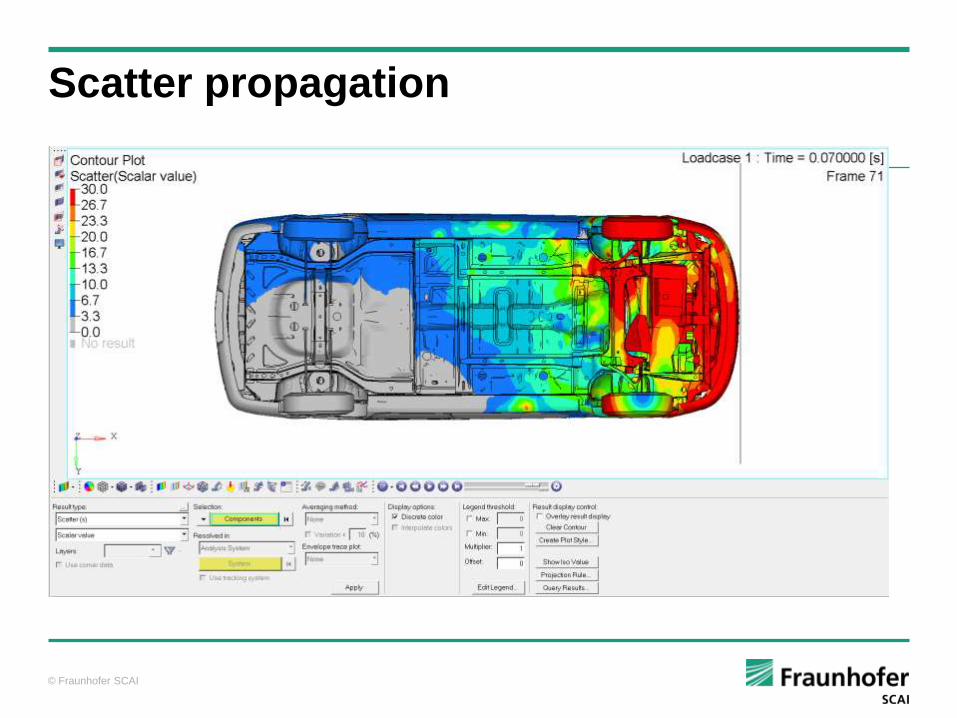
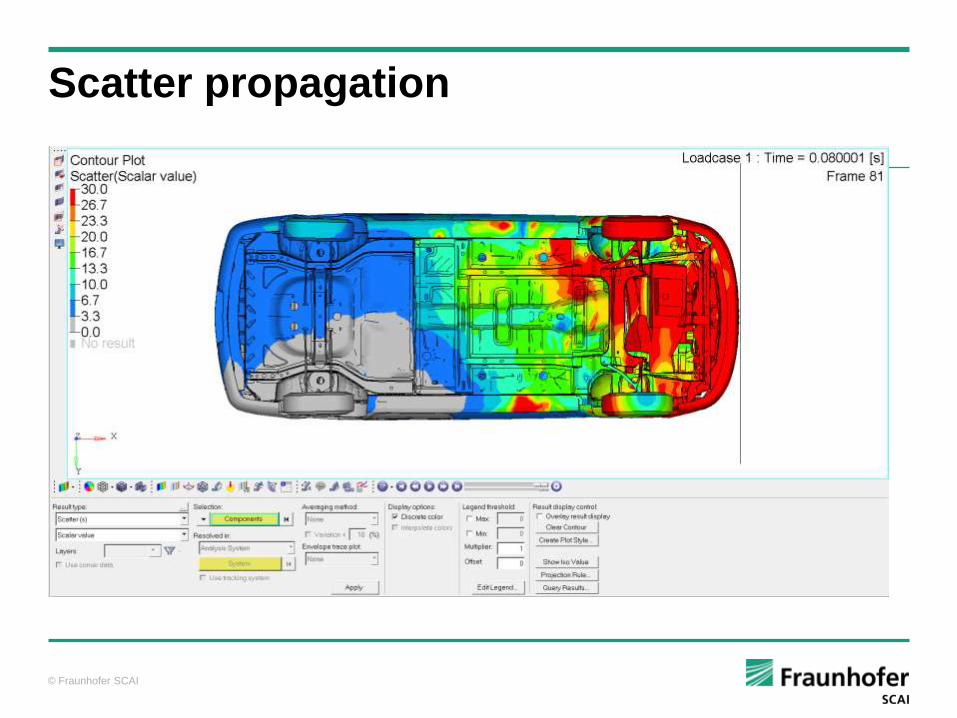
Analysis methods: Scatter visualization
© Fraunhofer SCAI
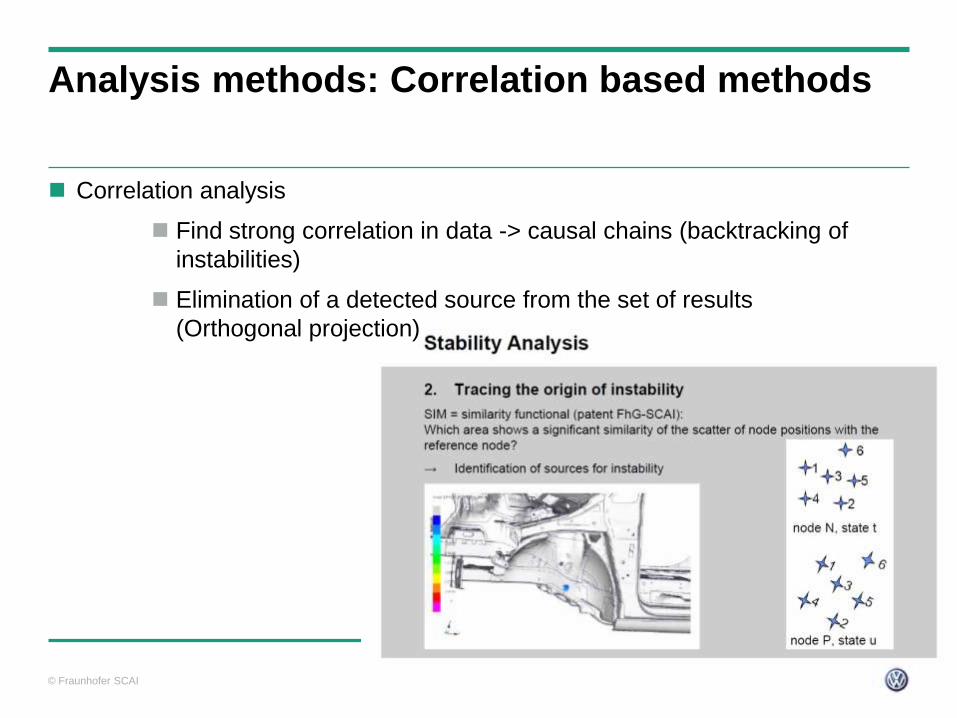
Analysis methods: Correlation based methods
Correlation analysis
Find strong correlation in data -> causal chains (backtracking of
instabilities)
Elimination of a detected source from the set of results
(Orthogonal projection)
© Fraunhofer SCAI
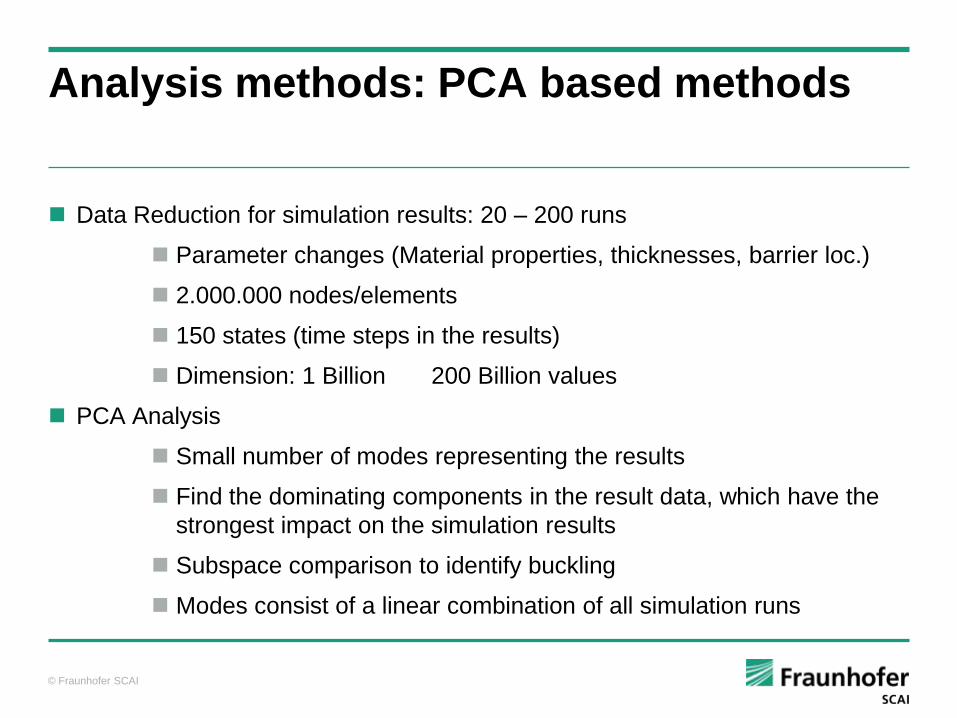
Analysis methods: PCA based methods
Data Reduction for simulation results: 20 – 200 runs
Parameter changes (Material properties, thicknesses, barrier loc.)
2.000.000 nodes/elements
150 states (time steps in the results)
Dimension: 1 Billion 200 Billion values
PCA Analysis
Small number of modes representing the results
Find the dominating components in the result data, which have the
strongest impact on the simulation results
Subspace comparison to identify buckling
Modes consist of a linear combination of all simulation runs
© Fraunhofer SCAI
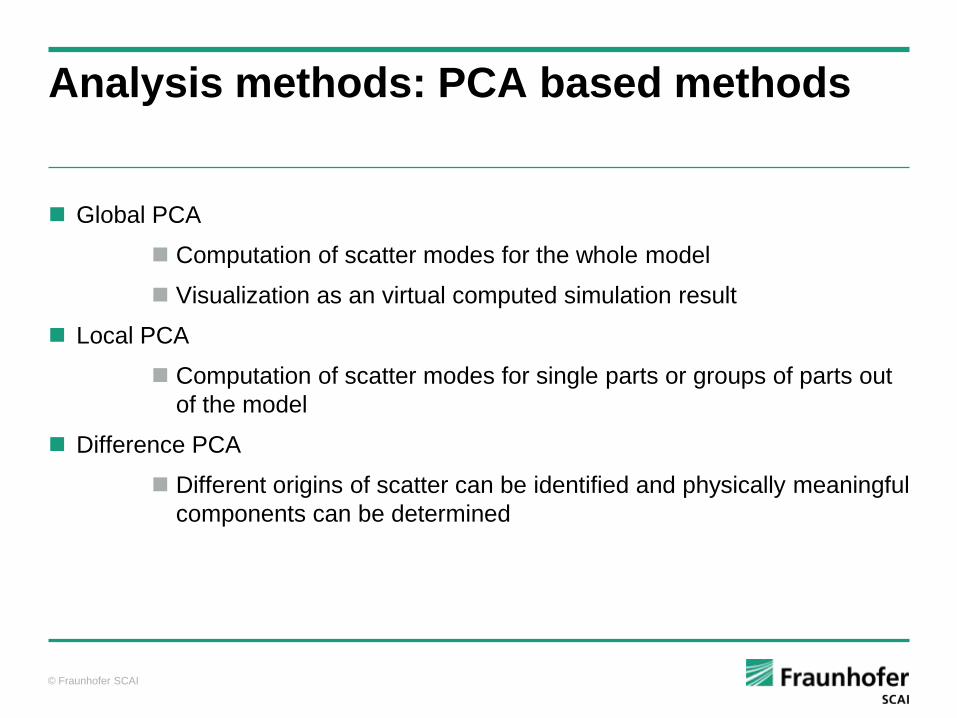
Analysis methods: PCA based methods
Global PCA
Computation of scatter modes for the whole model
Visualization as an virtual computed simulation result
Local PCA
Computation of scatter modes for single parts or groups of parts out
of the model
Difference PCA
Different origins of scatter can be identified and physically meaningful
components can be determined
© Fraunhofer SCAI
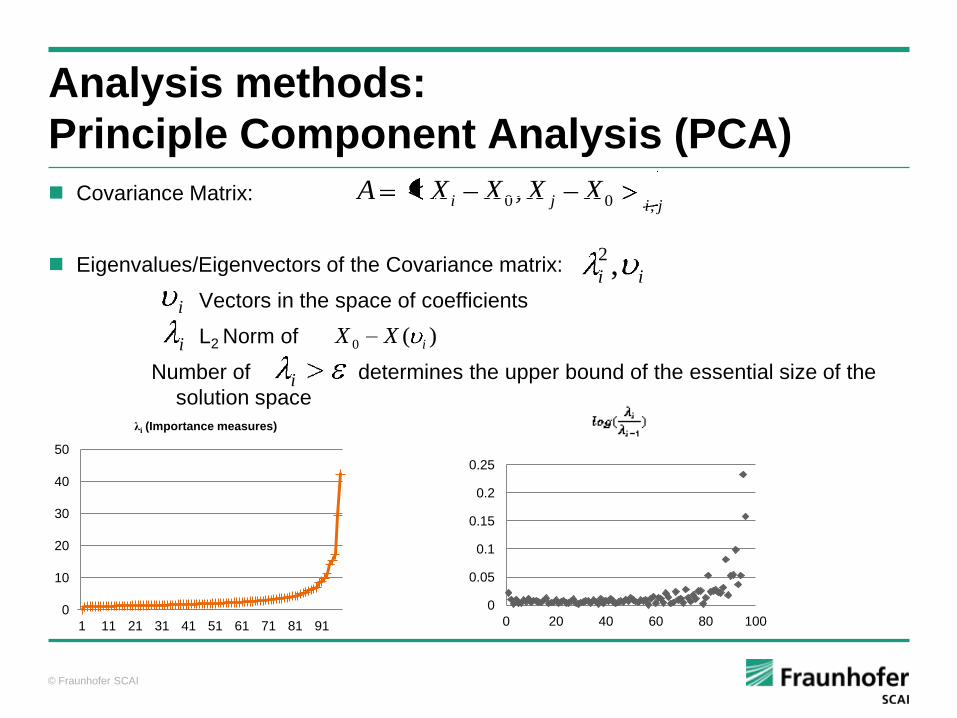
Analysis methods:
Principle Component Analysis (PCA)
Covariance Matrix:
Eigenvalues/Eigenvectors of the Covariance matrix:
Vectors in the space of coefficients
L2 Norm of
Number of determines the upper bound of the essential size of the
solution space
jiji XXXXA,00 ,
ii ,2
i )(0 iXX
i
i
0
10
20
30
40
50
1 11 21 31 41 51 61 71 81 91
λi (Importance measures)
0
0.05
0.1
0.15
0.2
0.25
0 20 40 60 80 100
© Fraunhofer SCAI
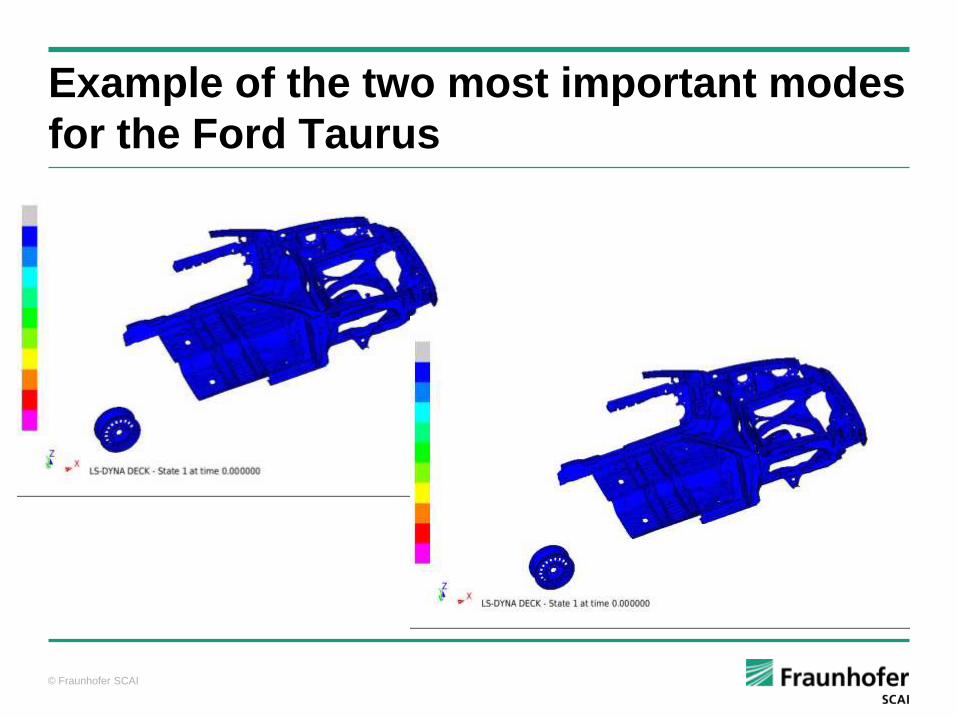
Example of the two most important modes
for the Ford Taurus
© Fraunhofer SCAI
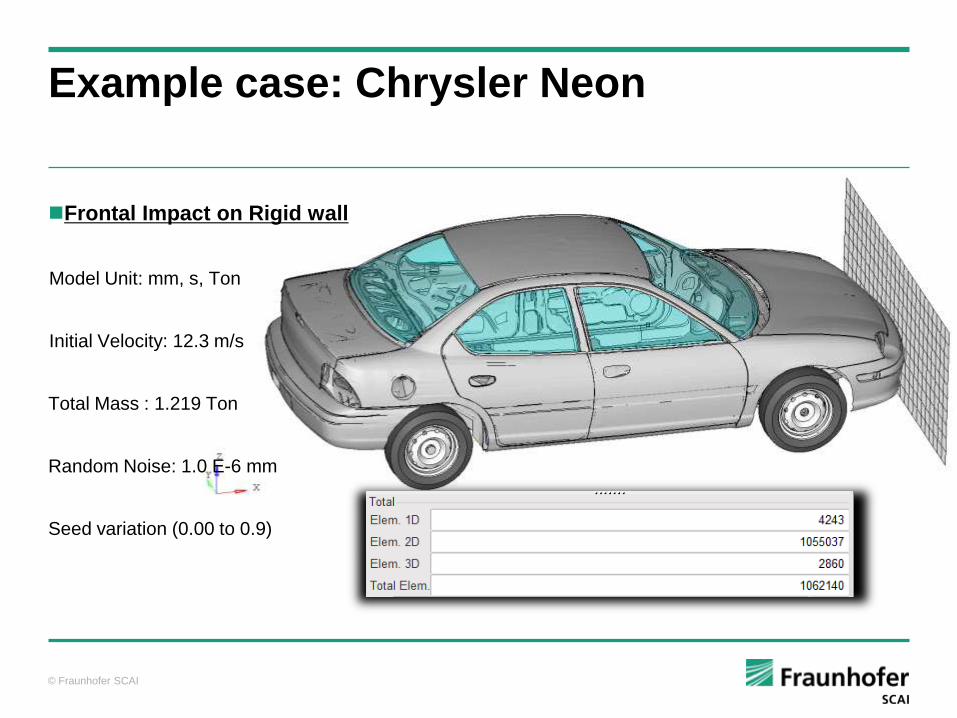
Example case: Chrysler Neon
Frontal Impact on Rigid wall
Model Unit: mm, s, Ton
Initial Velocity: 12.3 m/s
Total Mass : 1.219 Ton
Random Noise: 1.0 E-6 mm
Seed variation (0.00 to 0.9)
© Fraunhofer SCAI
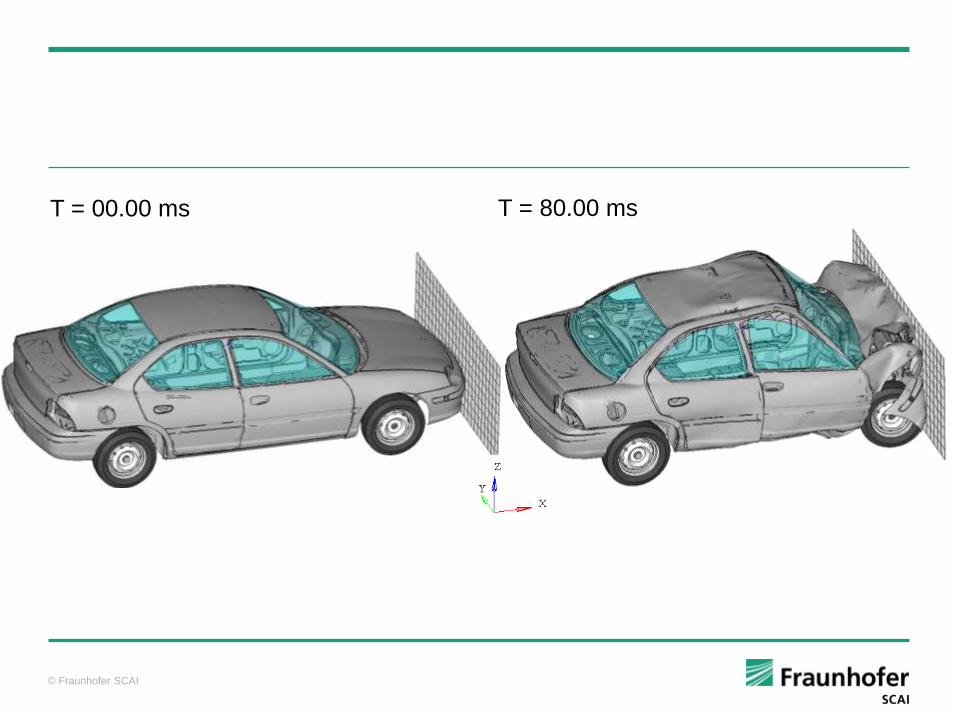
T = 00.00 ms T = 80.00 ms
© Fraunhofer SCAI
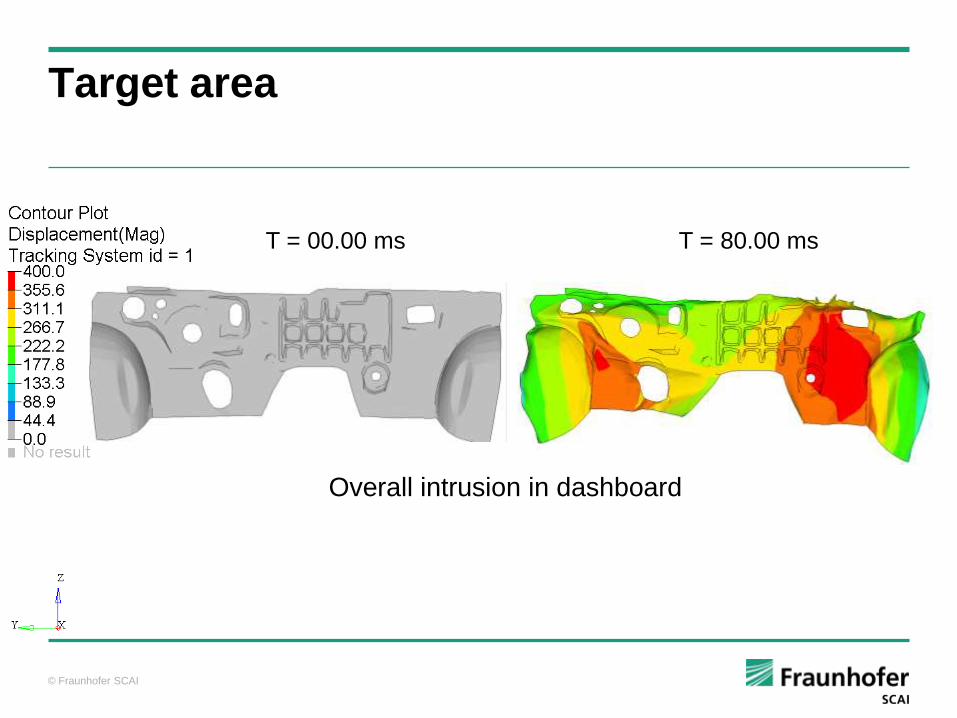
Target area
T = 00.00 ms T = 80.00 ms
Overall intrusion in dashboard
© Fraunhofer SCAI
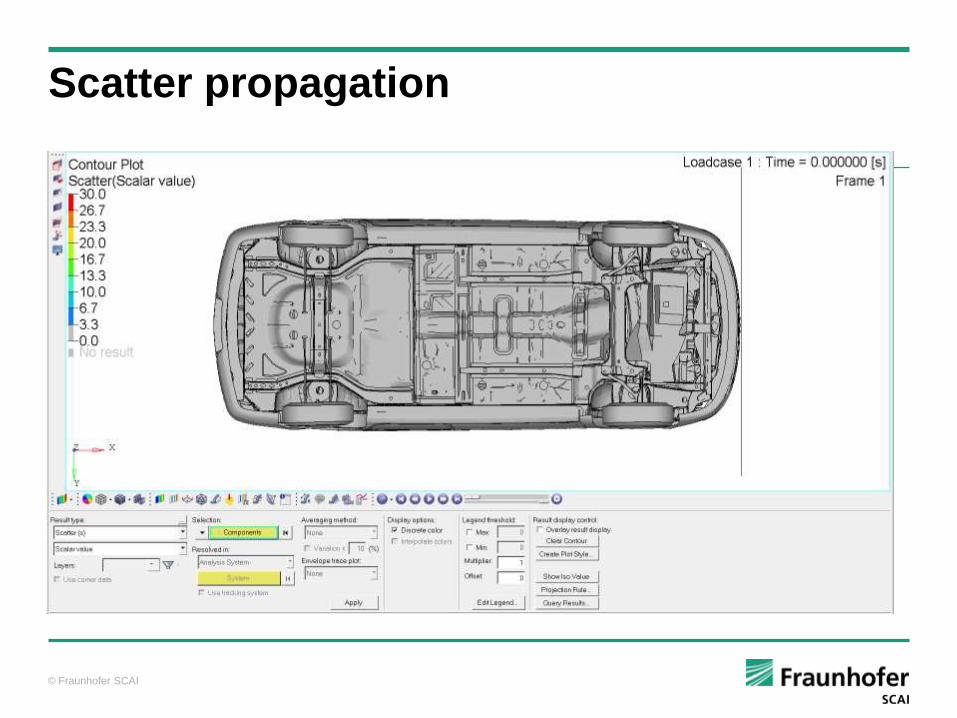
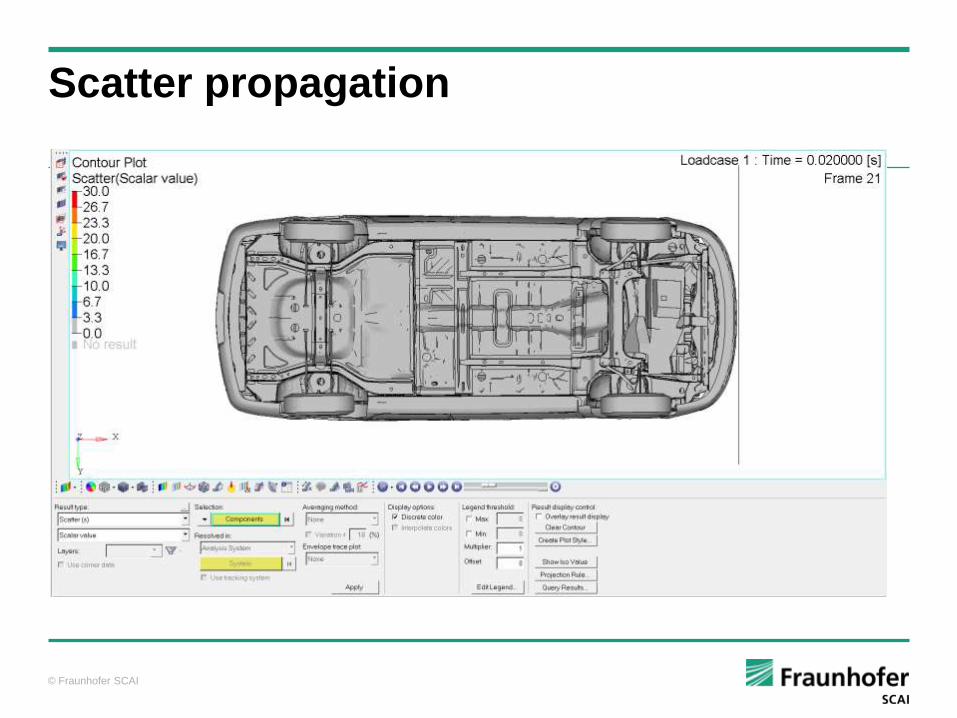
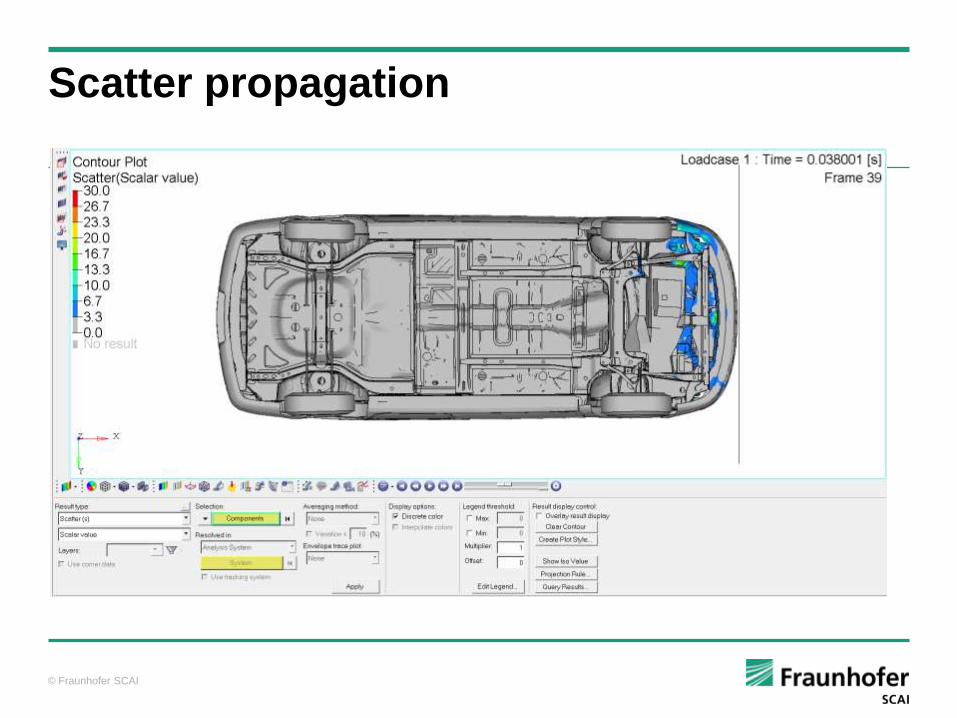
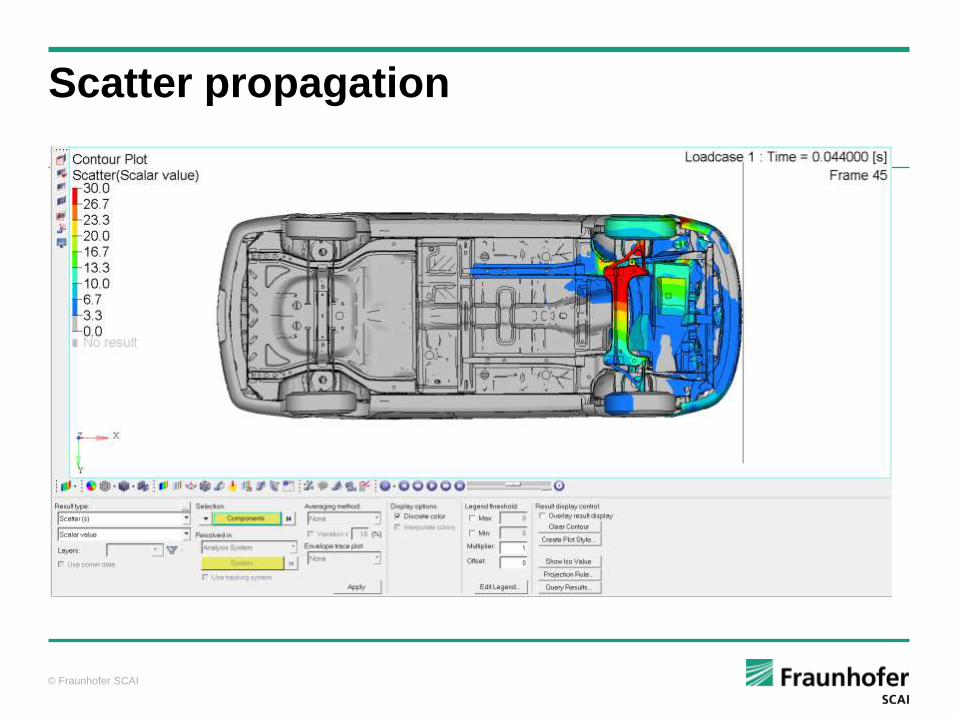
Scatter propagation

© Fraunhofer SCAI
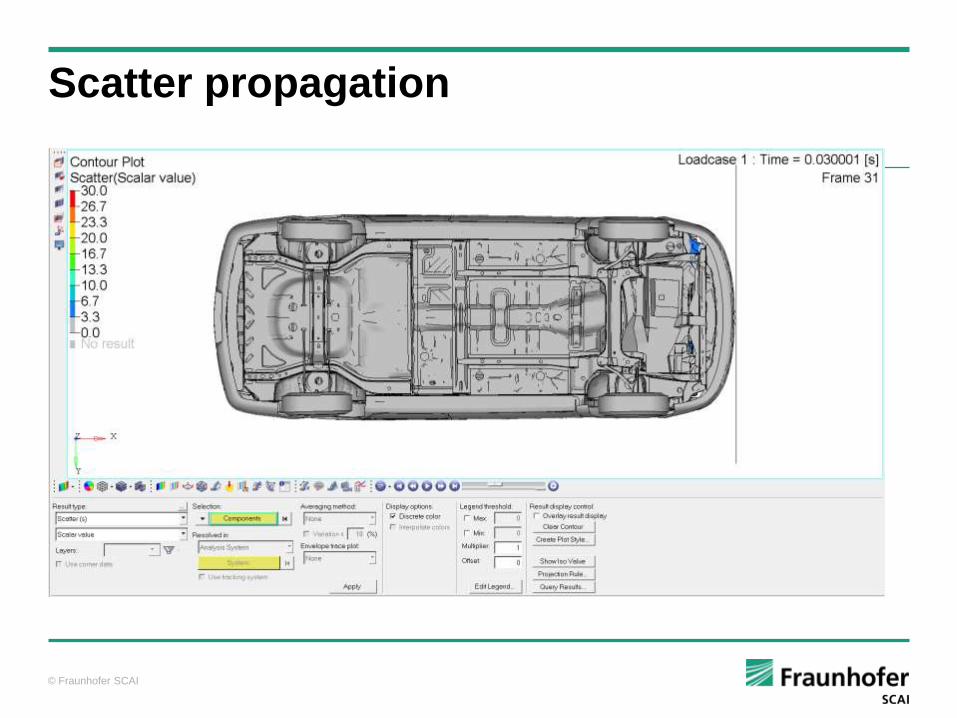
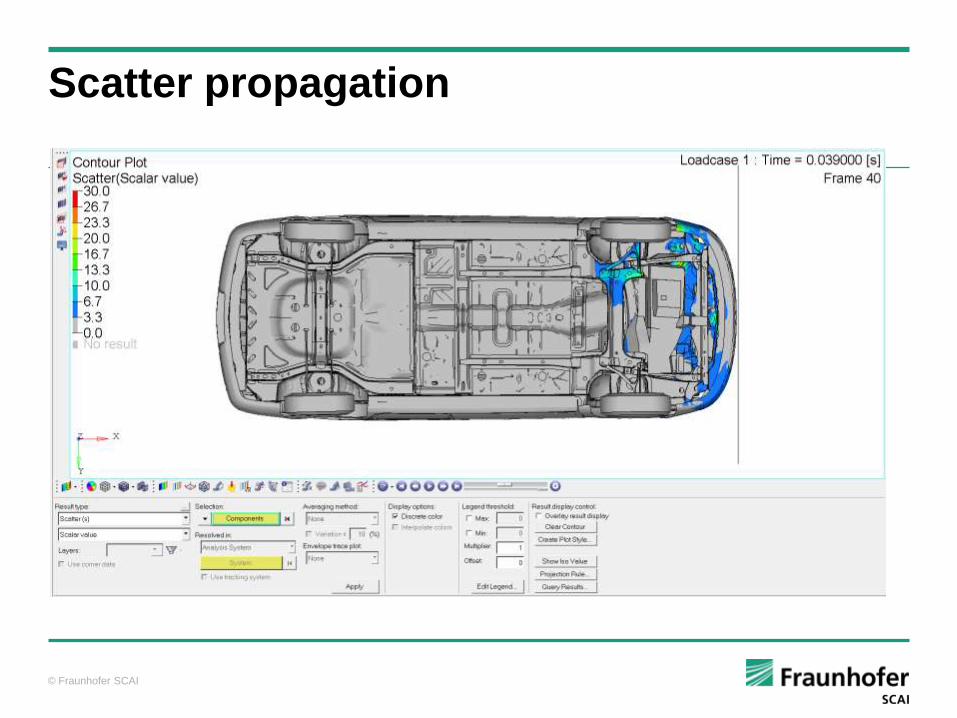
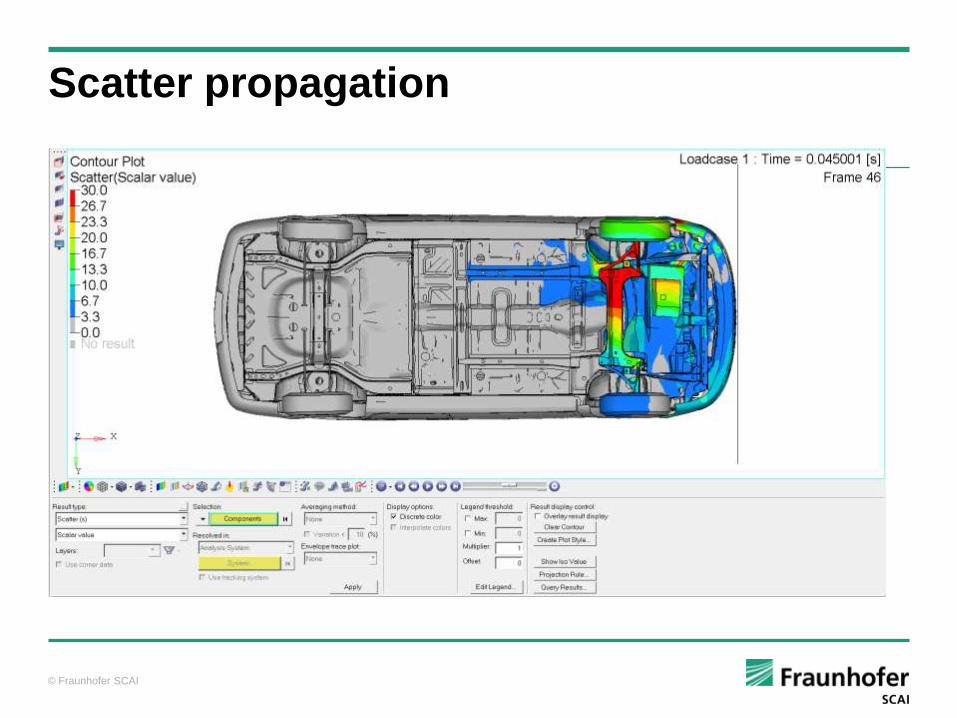
Scatter propagation
© Fraunhofer SCAI
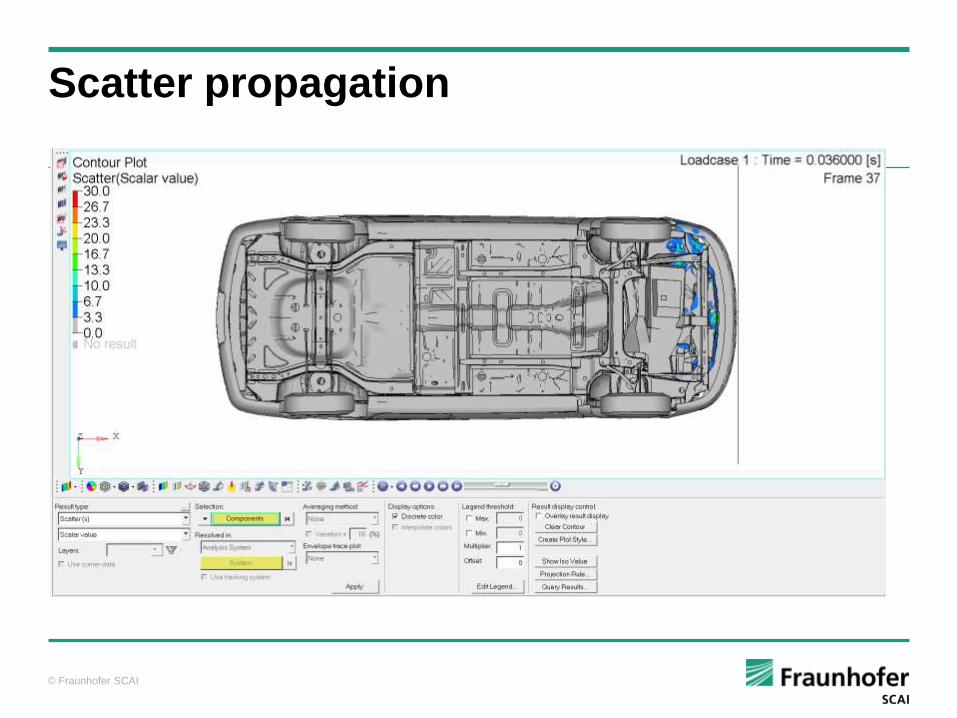
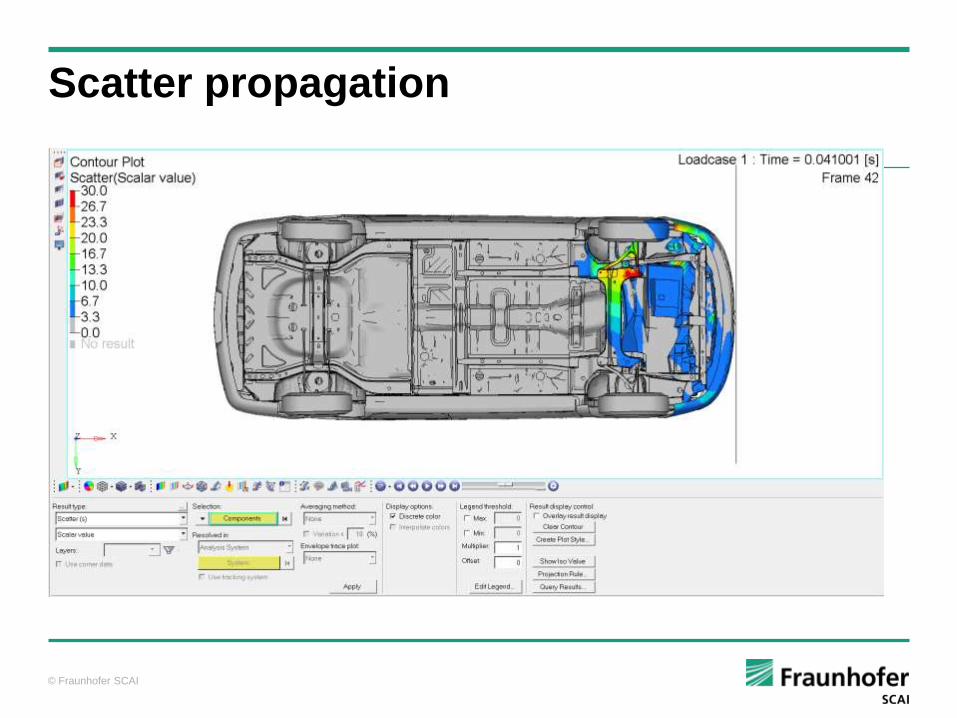
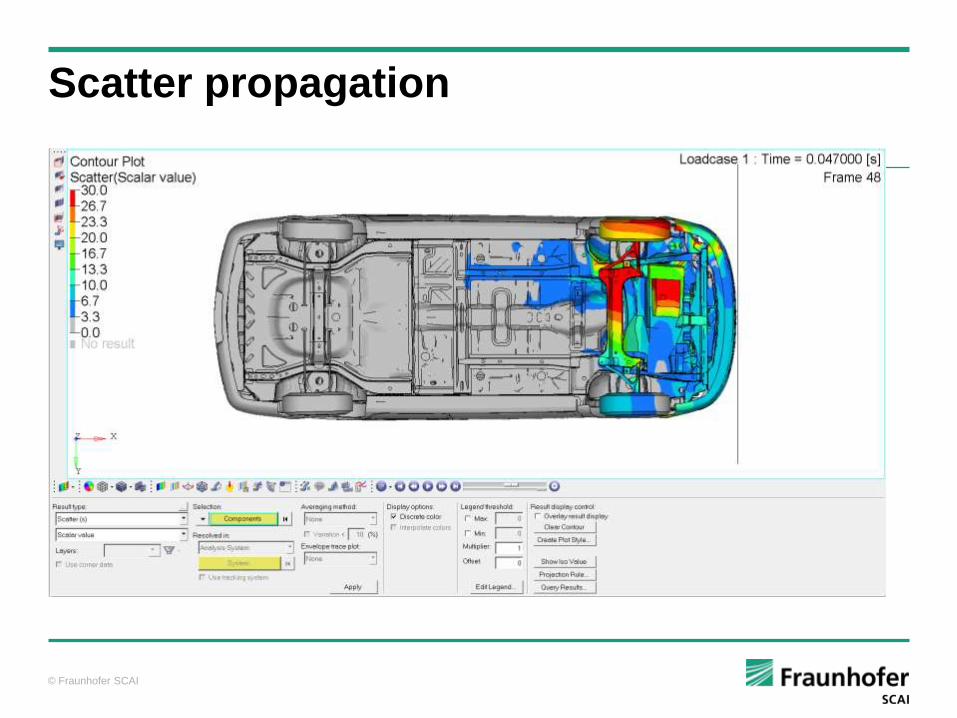
Scatter propagation
© Fraunhofer SCAI
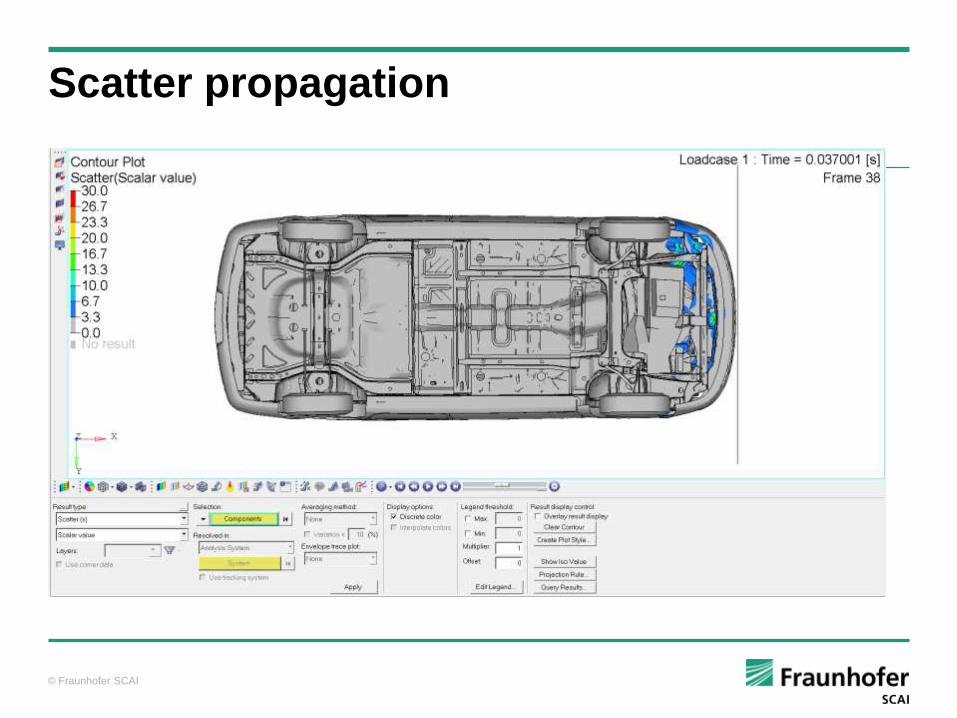
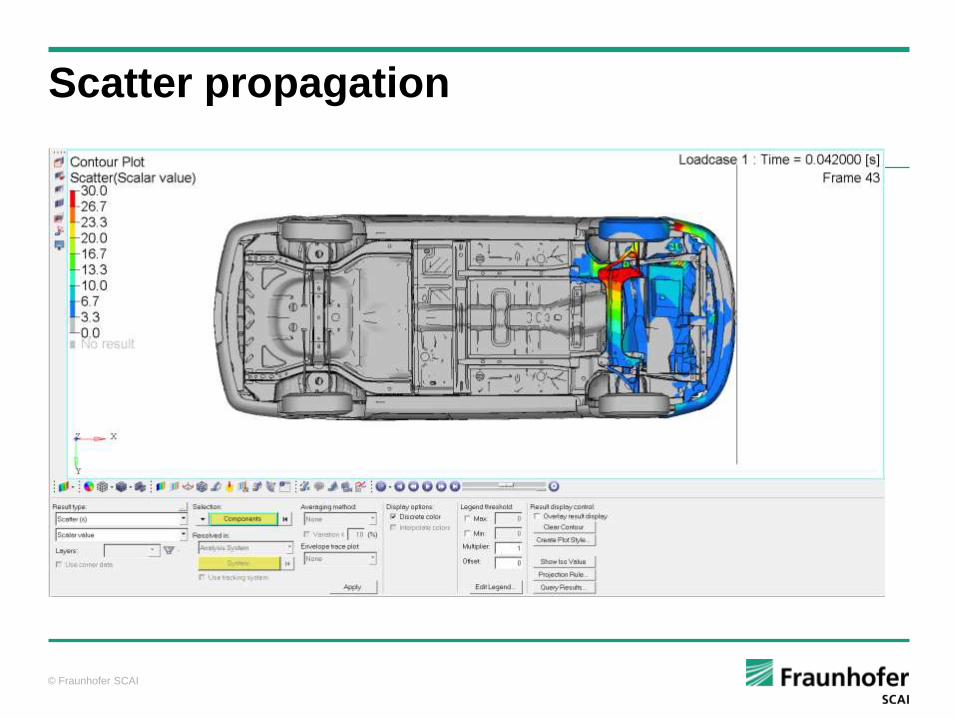
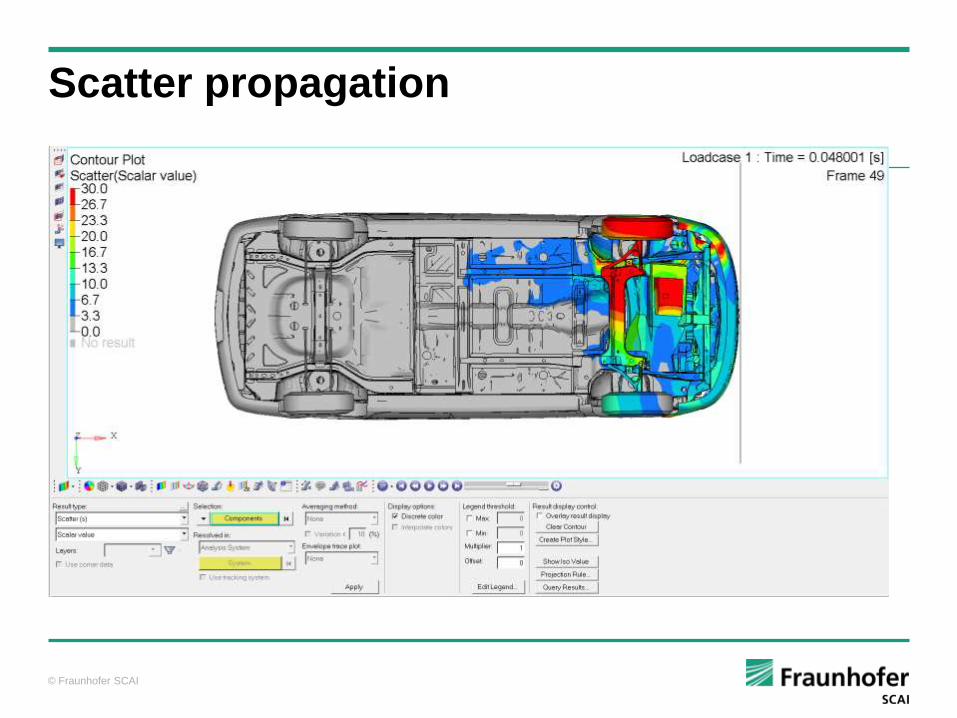
Scatter propagation
© Fraunhofer SCAI
Scatter propagation
© Fraunhofer SCAI
Scatter propagation
© Fraunhofer SCAI
Scatter propagation
© Fraunhofer SCAI
Scatter propagation
© Fraunhofer SCAI
Scatter propagation
© Fraunhofer SCAI
Scatter propagation

© Fraunhofer SCAI
Scatter propagation
© Fraunhofer SCAI
Scatter propagation
© Fraunhofer SCAI
Scatter propagation

© Fraunhofer SCAI
Scatter propagation
© Fraunhofer SCAI
Scatter propagation
© Fraunhofer SCAI
Scatter propagation

© Fraunhofer SCAI
Scatter propagation

© Fraunhofer SCAI
Scatter propagation
© Fraunhofer SCAI
Scatter propagation
© Fraunhofer SCAI
Scatter propagation
© Fraunhofer SCAI
Scatter propagation
© Fraunhofer SCAI
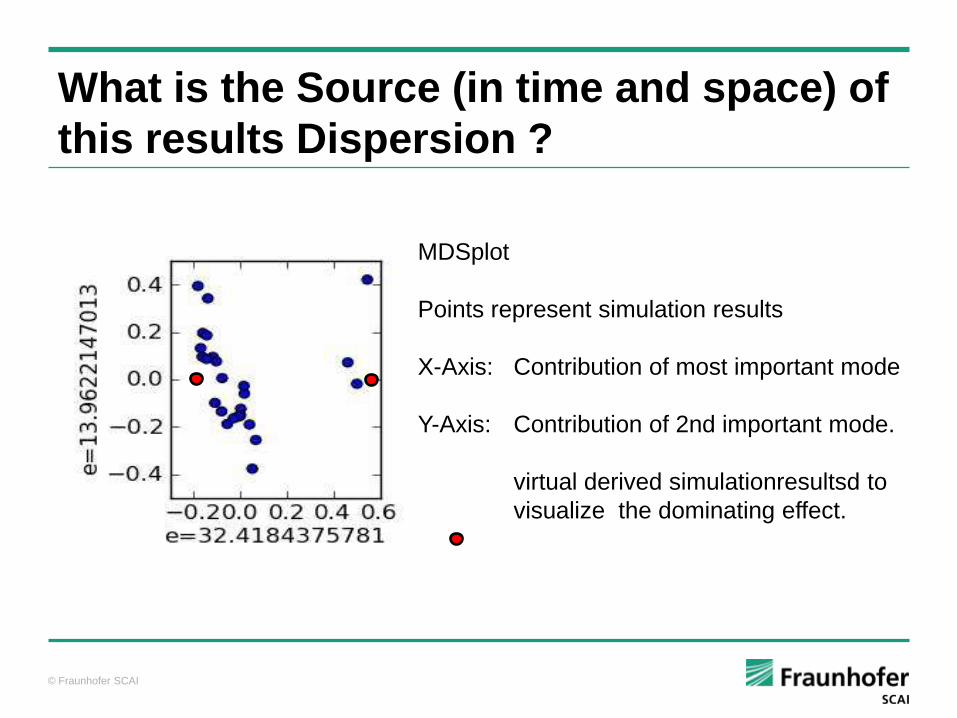
MDSplot
Points represent simulation results
X-Axis: Contribution of most important mode
Y-Axis: Contribution of 2nd important mode.
virtual derived simulationresultsd to
visualize the dominating effect.
What is the Source (in time and space) of
this results Dispersion ?
© Fraunhofer SCAI
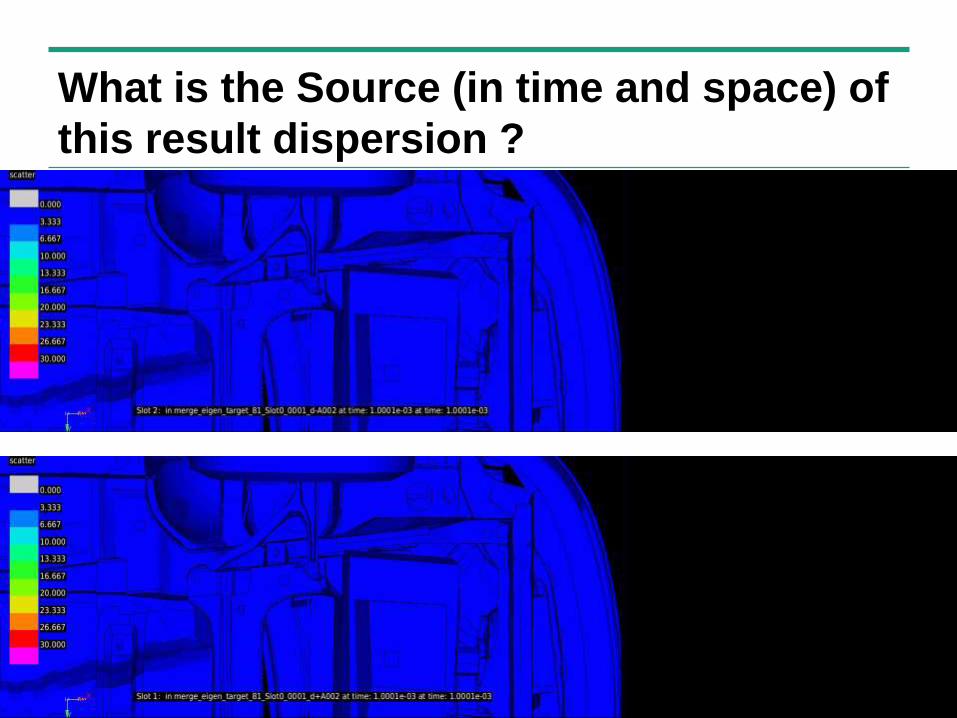
What is the Source (in time and space) of
this result dispersion ?
© Fraunhofer SCAI
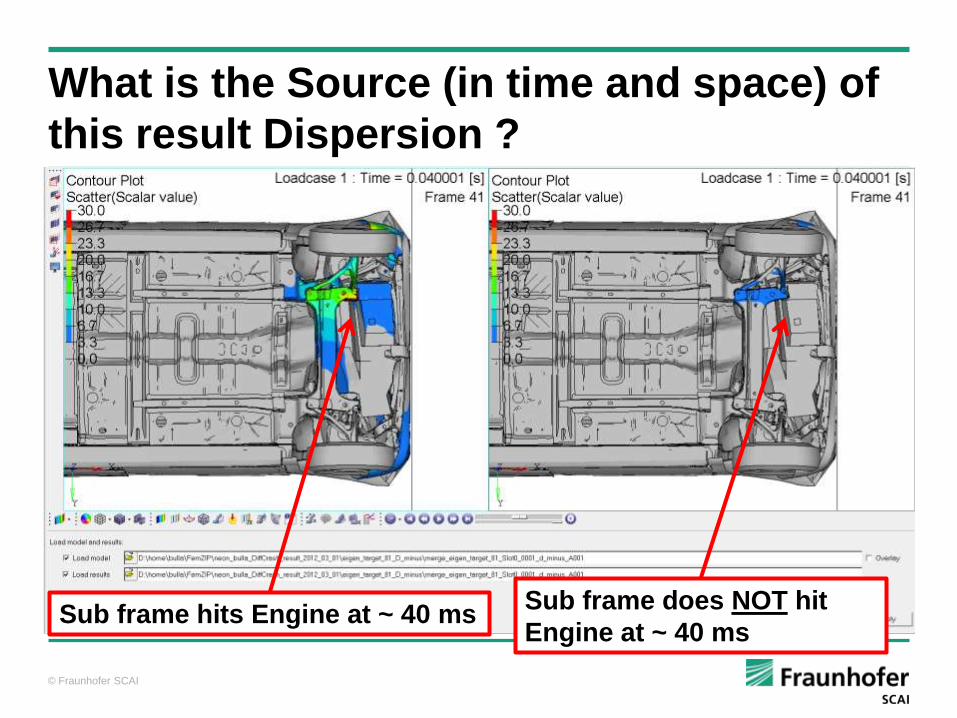
What is the Source (in time and space) of
this result Dispersion ?
Sub frame hits Engine at ~ 40 ms Sub frame does NOT hit
Engine at ~ 40 ms
© Fraunhofer SCAI
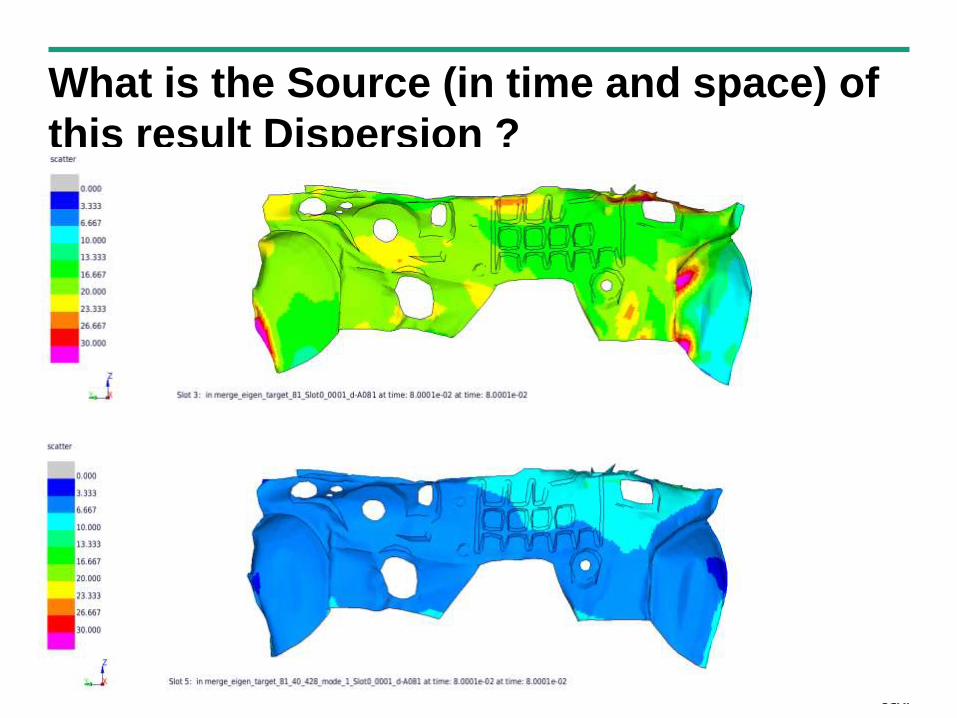
What is the Source (in time and space) of
this result Dispersion ?
© Fraunhofer SCAI
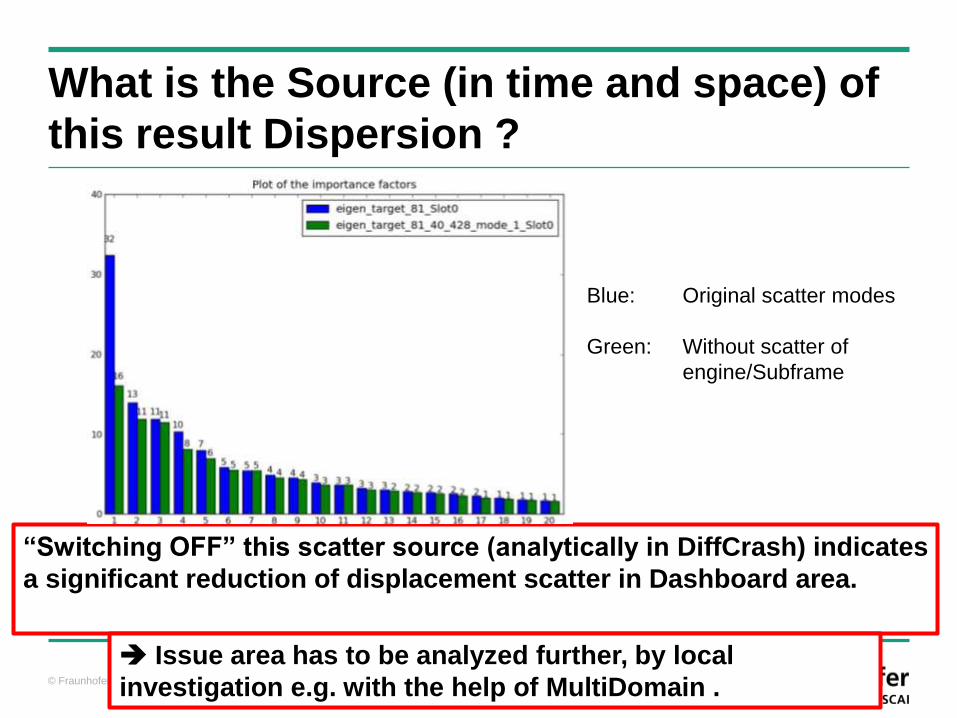
What is the Source (in time and space) of
this result Dispersion ?
“Switching OFF” this scatter source (analytically in DiffCrash) indicates
a significant reduction of displacement scatter in Dashboard area.
Issue area has to be analyzed further, by local
investigation e.g. with the help of MultiDomain .
Blue: Original scatter modes
Green: Without scatter of
engine/Subframe
© Fraunhofer SCAI
Summary
DIFFCRASH allows us to identify and quantify major sources of scatter
The methods allow to devise design and modeling suggestions to reduce
scatter of simulation results
Next steps e.g.:
Applying the multidomain - technique to get a modeling of the critical
region in more detail.
Geometrical changes can force a deterministic behavior in a next
step.
First results of an adapted Chrysler NEON model look very promising
regarding the reduction of scatter at the front wall
OUTLOOK:
Postprocessor interface for GNS Animator (1st prototype ) and
others.
© Fraunhofer SCAI
Thank you very much for your attention...!
Innovation Intelligence®