Identification of hydrated silicate minerals on Mars using ... · Identification of hydrated...
33
Identification of hydrated silicate minerals on Mars using MRO-CRISM: Geologic context near Nili Fossae and implications for aqueous alteration Bethany L. Ehlmann, 1 John F. Mustard, 1 Gregg A. Swayze, 2 Roger N. Clark, 2 Janice L. Bishop, 3,4 Francois Poulet, 5 David J. Des Marais, 4 Leah H. Roach, 1 Ralph E. Milliken, 6 James J. Wray, 7 Olivier Barnouin-Jha, 8 and Scott L. Murchie 8 Received 23 January 2009; revised 8 May 2009; accepted 11 June 2009; published 23 October 2009. [1] The Noachian terrain west of the Isidis basin hosts a diverse collection of alteration minerals in rocks comprising varied geomorphic units within a 100,000 km 2 region in and near the Nili Fossae. Prior investigations in this region by the Observatoire pour l’Mine ´ralogie, l’Eau, les Glaces, et l’Activite ´ (OMEGA) instrument on Mars Express revealed large exposures of both mafic minerals and iron magnesium phyllosilicates in stratigraphic context. Expanding on the discoveries of OMEGA, the Compact Reconnaissance Imaging Spectrometer for Mars (CRISM) aboard the Mars Reconnaissance Orbiter (MRO) has found more spatially widespread and mineralogically diverse alteration minerals than previously realized, which represent multiple aqueous environments. Using CRISM near-infrared spectral data, we detail the basis for identification of iron and magnesium smectites (including both nontronite and more Mg-rich varieties), chlorite, prehnite, serpentine, kaolinite, potassium mica (illite or muscovite), hydrated (opaline) silica, the sodium zeolite analcime, and magnesium carbonate. The detection of serpentine and analcime on Mars is reported here for the first time. We detail the geomorphic context of these minerals using data from high-resolution imagers onboard MRO in conjunction with CRISM. We find that the distribution of alteration minerals is not homogeneous; rather, they occur in provinces with distinctive assemblages of alteration minerals. Key findings are (1) a distinctive stratigraphy, in and around the Nili Fossae, of kaolinite and magnesium carbonate in bedrock units always overlying Fe/Mg smectites and (2) evidence for mineral phases and assemblages indicative of low-grade metamorphic or hydrothermal aqueous alteration in cratered terrains. The alteration minerals around the Nili Fossae are more typical of those resulting from neutral to alkaline conditions rather than acidic conditions, which appear to have dominated much of Mars. Moreover, the mineralogic diversity and geologic context of alteration minerals found in the region around the Nili Fossae indicates several episodes of aqueous activity in multiple distinct environments. Citation: Ehlmann, B. L., et al. (2009), Identification of hydrated silicate minerals on Mars using MRO-CRISM: Geologic context near Nili Fossae and implications for aqueous alteration, J. Geophys. Res., 114, E00D08, doi:10.1029/2009JE003339. 1. Introduction [2] Landed measurements by the Mars Exploration Rovers (MER) and orbital visible and near-infrared data from the Observatoire pour l’Mine ´ralogie, l’Eau, les Glaces, et l’Activite ´ (OMEGA) and the Compact Reconnaissance Imaging Spectrometer for Mars (CRISM) have revealed a rich mineralogic record of aqueous alteration on Mars that complements preexisting geomorphic data recording the past presence of liquid water [Squyres et al., 2004; Bibring et al., 2005; Murchie et al., 2009a]. Sulfate minerals found in northern circumpolar deposits, Vallis Marineris, the plains of Terra Meridiani, and soils around Columbia Hills in Gusev crater probably indicate precipitation of salts from JOURNAL OF GEOPHYSICAL RESEARCH, VOL. 114, E00D08, doi:10.1029/2009JE003339, 2009 Click Here for Full Article 1 Department of Geological Sciences, Brown University, Providence, Rhode Island, USA. 2 U.S. Geological Survey, Denver, Colorado, USA. 3 SETI Institute, Mountain View, California, USA. 4 NASA Ames Research Center, Mountain View, California, USA. Copyright 2009 by the American Geophysical Union. 0148-0227/09/2009JE003339$09.00 E00D08 5 Institut d’Astrophysique Spatiale, Universite ´ Paris Sud, CNRS, Orsay, France. 6 Jet Propulsion Laboratory, California Institute of Technology, Pasadena, California, USA. 7 Department of Astronomy, Cornell University, Ithaca, New York, USA. 8 Johns Hopkins University Applied Physics Laboratory, Laurel, Mary- land, USA. 1 of 33
Transcript of Identification of hydrated silicate minerals on Mars using ... · Identification of hydrated...
Identification of hydrated silicate minerals on Mars using
MRO-CRISM: Geologic context near Nili Fossae and implications
for aqueous alteration
Bethany L. Ehlmann,1 John F. Mustard,1 Gregg A. Swayze,2 Roger N. Clark,2
Janice L. Bishop,3,4 Francois Poulet,5 David J. Des Marais,4 Leah H. Roach,1
Ralph E. Milliken,6 James J. Wray,7 Olivier Barnouin-Jha,8 and Scott L. Murchie8
Received 23 January 2009; revised 8 May 2009; accepted 11 June 2009; published 23 October 2009.
[1] The Noachian terrain west of the Isidis basin hosts a diverse collection of alterationminerals in rocks comprising varied geomorphic units within a 100,000 km2 region in andnear the Nili Fossae. Prior investigations in this region by the Observatoire pourl’Mineralogie, l’Eau, les Glaces, et l’Activite (OMEGA) instrument on Mars Expressrevealed large exposures of both mafic minerals and iron magnesium phyllosilicates instratigraphic context. Expanding on the discoveries of OMEGA, the CompactReconnaissance Imaging Spectrometer for Mars (CRISM) aboard the MarsReconnaissance Orbiter (MRO) has found more spatially widespread and mineralogicallydiverse alteration minerals than previously realized, which represent multiple aqueousenvironments. Using CRISM near-infrared spectral data, we detail the basis foridentification of iron and magnesium smectites (including both nontronite and moreMg-rich varieties), chlorite, prehnite, serpentine, kaolinite, potassium mica (illite ormuscovite), hydrated (opaline) silica, the sodium zeolite analcime, and magnesiumcarbonate. The detection of serpentine and analcime on Mars is reported here for the firsttime. We detail the geomorphic context of these minerals using data from high-resolutionimagers onboard MRO in conjunction with CRISM. We find that the distribution ofalteration minerals is not homogeneous; rather, they occur in provinces with distinctiveassemblages of alteration minerals. Key findings are (1) a distinctive stratigraphy, in andaround the Nili Fossae, of kaolinite and magnesium carbonate in bedrock units alwaysoverlying Fe/Mg smectites and (2) evidence for mineral phases and assemblagesindicative of low-grade metamorphic or hydrothermal aqueous alteration in crateredterrains. The alteration minerals around the Nili Fossae are more typical of those resultingfrom neutral to alkaline conditions rather than acidic conditions, which appear to havedominated much of Mars. Moreover, the mineralogic diversity and geologic context ofalteration minerals found in the region around the Nili Fossae indicates several episodes ofaqueous activity in multiple distinct environments.
Citation: Ehlmann, B. L., et al. (2009), Identification of hydrated silicate minerals on Mars using MRO-CRISM: Geologic context
near Nili Fossae and implications for aqueous alteration, J. Geophys. Res., 114, E00D08, doi:10.1029/2009JE003339.
1. Introduction
[2] Landed measurements by the Mars ExplorationRovers (MER) and orbital visible and near-infrared datafrom the Observatoire pour l’Mineralogie, l’Eau, les Glaces,et l’Activite (OMEGA) and the Compact ReconnaissanceImaging Spectrometer for Mars (CRISM) have revealed a
rich mineralogic record of aqueous alteration on Mars thatcomplements preexisting geomorphic data recording thepast presence of liquid water [Squyres et al., 2004; Bibringet al., 2005; Murchie et al., 2009a]. Sulfate minerals foundin northern circumpolar deposits, Vallis Marineris, theplains of Terra Meridiani, and soils around Columbia Hillsin Gusev crater probably indicate precipitation of salts from
JOURNAL OF GEOPHYSICAL RESEARCH, VOL. 114, E00D08, doi:10.1029/2009JE003339, 2009ClickHere
for
FullArticle
1Department of Geological Sciences, Brown University, Providence,Rhode Island, USA.
2U.S. Geological Survey, Denver, Colorado, USA.3SETI Institute, Mountain View, California, USA.4NASA Ames Research Center, Mountain View, California, USA.
Copyright 2009 by the American Geophysical Union.0148-0227/09/2009JE003339$09.00
E00D08
5Institut d’Astrophysique Spatiale, Universite Paris Sud, CNRS, Orsay,France.
6Jet Propulsion Laboratory, California Institute of Technology,Pasadena, California, USA.
7Department of Astronomy, Cornell University, Ithaca, New York,USA.
8Johns Hopkins University Applied Physics Laboratory, Laurel, Mary-land, USA.
1 of 33
acidic surface and near surface waters in the Hesperianepoch [Gendrin et al., 2005; Bibring et al., 2006; Squyres etal., 2004; Arvidson et al., 2006; Haskin et al., 2005]. Duringthe earlier Noachian epoch on the other hand, a differentprocess of longer-lived water-rock interaction at neutral toalkaline pH is indicated by the presence of phyllosilicateminerals, mostly iron magnesium smectite clays [Bibring etal., 2006; Chevrier et al., 2007]. OMEGA revealed largephyllosilicate exposures in the well-exposed Noachian ter-rains around Mawrth Vallis and Nili Fossae as well as inscattered outcrops in the southern highlands [Poulet et al.,2005]. Subsequent investigations at smaller spatial scales byCRISM reveal that phyllosilicates are a relatively commonfeature of the southern highlands occurring, apparentlywithout geographic restrictions, in association withhundreds of impact craters [Mustard et al., 2008]. Addi-tionally, CRISM data have allowed discovery of the diver-sity of hydrated minerals present. In addition to previouslydetected smectites and chlorite [Poulet et al., 2005], CRISMnear-infrared (NIR) spectral data have been used to identifykaolinite, potassiummicas such as illite ormuscovite, hydratedsilica, magnesium carbonate, and prehnite [Mustard et al.,2008; Milliken et al., 2008; Ehlmann et al., 2008a; D.Buczkowski et al., manuscript in preparation, 2009]. Alongwith the detections of zeolite and serpentine reported in thisstudy, these minerals indicate that a variety of aqueousalteration processes were probably at work on Noachian Marsto generate such mineralogic diversity.[3] The Noachian epoch spans the period from the first
appearance of a solid crust to approximately 3.6 Ga[Hartmann and Neukum, 2001], and the environment(s) inwhich aqueous alteration occurred are not yet well defined.In comparison to the precipitation of salts from solution,phyllosilicates require a more extended period of time toform, either from topotactic alteration of mafic mineralgrains or by neoformation from solution [Eberl, 1984].Common terrestrial processes for phyllosilicate formationinclude leaching and pedogenic alteration, subaqueousalteration in basins, precipitation in hydrothermal systems,and metamorphism and diagenesis. Mineral assemblage,alteration mineral abundance, and stratigraphic setting areconstraints that are at least partially ascertainable from orbitand that allow distinguishing among phyllosilicate forma-tion mechanisms.[4] On Mars, alteration of parent materials to phyllosili-
cates may have been associated with precipitation, runoffand soil formation as in the modern terrestrial hydrologicalcycle. Indeed, the Mawrth Vallis region shows well-developed stratigraphy of Al phyllosilicates overlying Fe/Mgsmectites [Wray et al., 2008; Bishop et al., 2008a;McKeownet al., 2009; E. Z. Noe Dobrea et al., Clay bearing units inthe region aroundMawrth Vallis: Stratigraphy, extent, and geo-logic origin, submitted to Journal of Geophysical Research,2009] such as might be expected to be produced by a top-down leaching process. However, elsewhere, source regionsfor valley networks are not especially enhanced in phyllo-silicate minerals [Bibring et al., 2006], and phyllosilicatesassociated with fluvial lacustrine deposits discovered so farare most likely transported, not precipitated in situ [e.g.,Mustard et al., 2008; Grant et al., 2008; Ehlmann et al.,2008b]. An alternative hypothesis to surface formation of
phyllosilicates by weathering is that the formation ofphyllosilicates occurred primarily in the subsurface, possi-bly driven by hydrothermally mediated crustal cooling [e.g.,Parmentier et al., 2008]. The intense meteoric bombard-ment of early Mars may also have played a role in phyllo-silicate formation, perhaps in serving as a heat sourcegenerating liquid water from a cryosphere [e.g., Newsom,1980]; impact craters on Earth commonly host hydro-thermal deposits with phyllosilicates [Allen et al., 1982;Naumov, 2005; Nelson et al., 2005]. Key questions foraddressing the timing, nature, and extent of aqueous alter-ation include: Which phyllosilicates are present? What otheraltered and unaltered minerals are present? What is the geo-morphic setting and distribution of these diverse phases?And, how much phyllosilicate is present?[5] The question of abundance is difficult to address
owing to multiple scattering of photons in the visible andnear-infrared wavelengths leading to nonlinearities in therelative contributions of components in mixtures, althoughinitial efforts with OMEGA data have begun to address thisquestion [Poulet et al., 2008]. This paper focuses on themethodology for identification of diverse hydrated silicates,along with associated silicate hydroxides and carbonates,and mapping of their occurrences using CRISM NIR data.With the exception of the aluminum smectite montmoril-lonite, all nonsulfate hydrated minerals detected to datefrom orbit can be found in the region west of the Isidisbasin, in and around the Nili Fossae. The remarkablemineralogic diversity of this region is probably due to acombination of factors: (1) a geologic history involvingapparently multiple instances of alteration by liquid water,(2) the availability of starting materials of distinct maficcompositions, and (3) the action of erosion in producingexcellent bedrock exposures.[6] After briefly reviewing the history and geologic
setting of the study area west of Isidis (section 2) andmethods of data analysis (section 3), we detail in section 4the spectral data used as the basis for the detection of eachhydrated mineral phase: Fe and Mg smectites, chlorite,prehnite, serpentine, kaolinite, K mica, the Na zeoliteanalcime, hydrated silica, and carbonate. We then describein section 5 the distribution and geomorphic setting of themineral phases found in the region around the Nili Fossae.By studying the geologic setting and associations of min-erals, the nature of the formation environment can bepartially constrained. We discuss the aqueous environmentsindicated, constraints on timing, and key outstanding ques-tions from our study in section 6. A companion paperprovides an updated, comprehensive geologic history ofthe circum-Isidis region, examining the detailed stratigraphyof various mineral-bearing units, including mafic minerals[Mustard et al., 2009]. We focus here specifically on theidentification of alteration minerals and on the variousenvironments of aqueous alteration that can be ascertained,including evidence for low-temperature metamorphic orhydrothermal alteration in the subsurface.
2. Geologic Setting and Study Area
[7] West of the 1900 km Isidis basin, the cratered,Noachian-aged crust is cut by a series of concentric frac-
E00D08 EHLMANN ET AL.: AQUEOUS ALTERATION NEAR NILI FOSSAE
2 of 33
E00D08
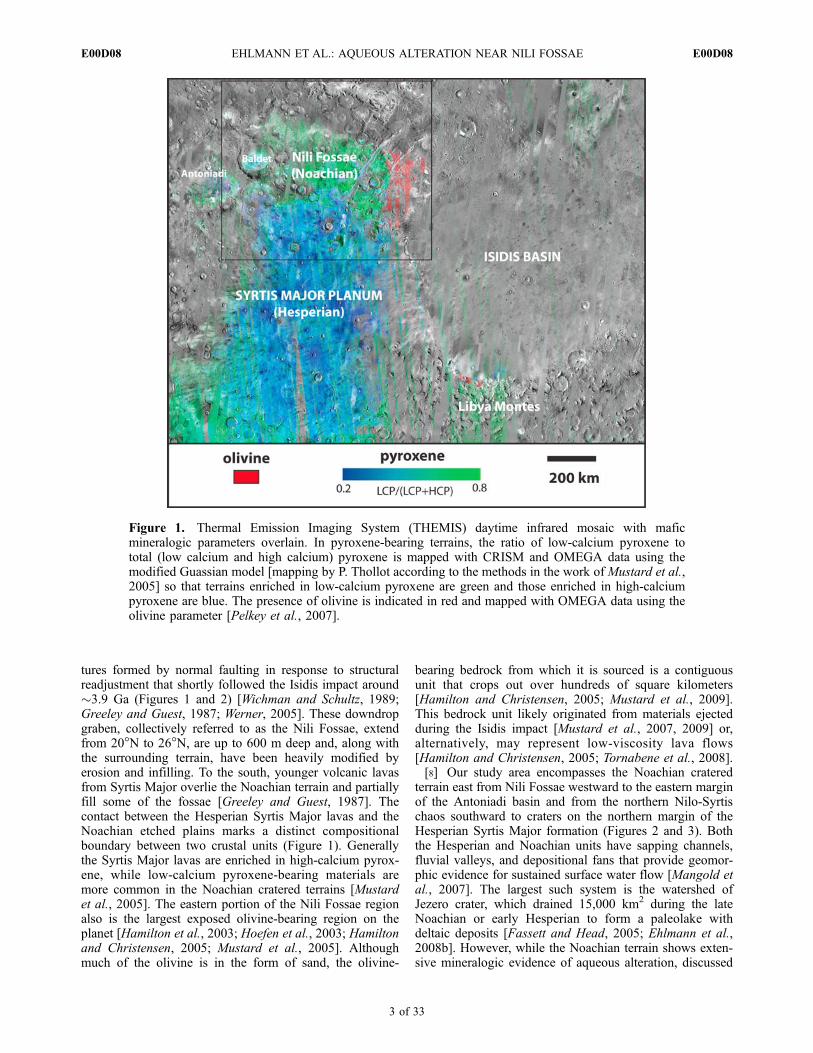
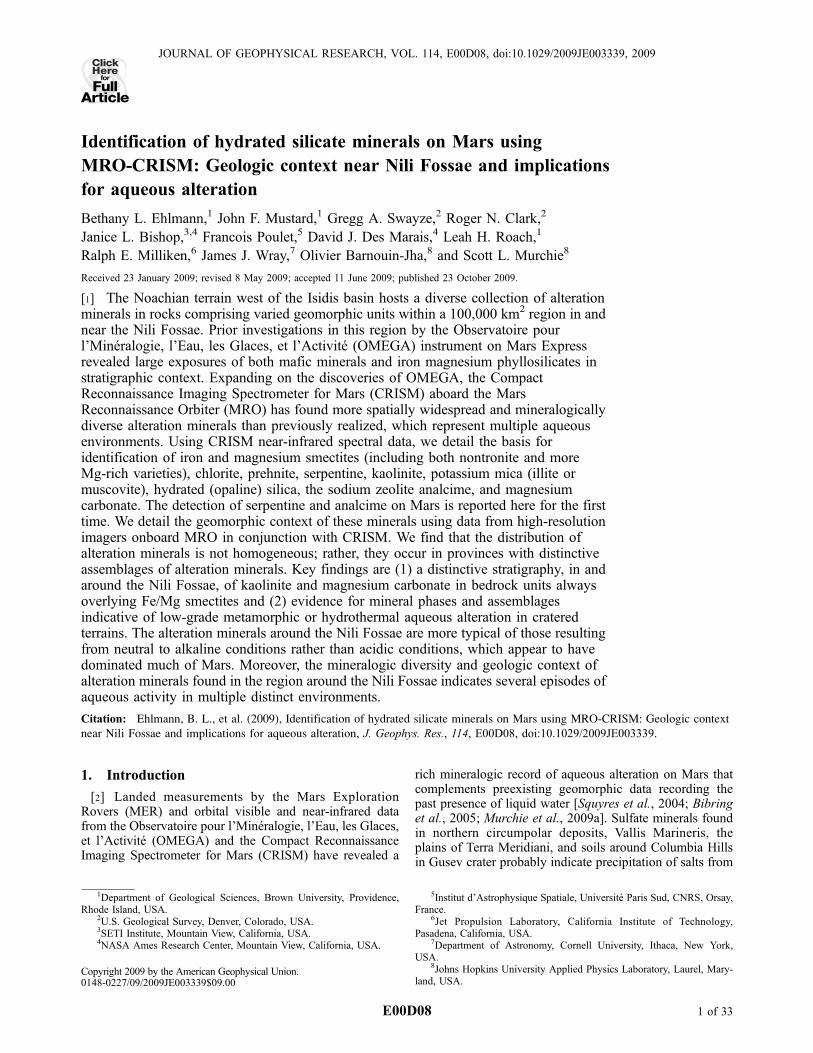
tures formed by normal faulting in response to structuralreadjustment that shortly followed the Isidis impact around�3.9 Ga (Figures 1 and 2) [Wichman and Schultz, 1989;Greeley and Guest, 1987; Werner, 2005]. These downdropgraben, collectively referred to as the Nili Fossae, extendfrom 20�N to 26�N, are up to 600 m deep and, along withthe surrounding terrain, have been heavily modified byerosion and infilling. To the south, younger volcanic lavasfrom Syrtis Major overlie the Noachian terrain and partiallyfill some of the fossae [Greeley and Guest, 1987]. Thecontact between the Hesperian Syrtis Major lavas and theNoachian etched plains marks a distinct compositionalboundary between two crustal units (Figure 1). Generallythe Syrtis Major lavas are enriched in high-calcium pyrox-ene, while low-calcium pyroxene-bearing materials aremore common in the Noachian cratered terrains [Mustardet al., 2005]. The eastern portion of the Nili Fossae regionalso is the largest exposed olivine-bearing region on theplanet [Hamilton et al., 2003; Hoefen et al., 2003; Hamiltonand Christensen, 2005; Mustard et al., 2005]. Althoughmuch of the olivine is in the form of sand, the olivine-
bearing bedrock from which it is sourced is a contiguousunit that crops out over hundreds of square kilometers[Hamilton and Christensen, 2005; Mustard et al., 2009].This bedrock unit likely originated from materials ejectedduring the Isidis impact [Mustard et al., 2007, 2009] or,alternatively, may represent low-viscosity lava flows[Hamilton and Christensen, 2005; Tornabene et al., 2008].[8] Our study area encompasses the Noachian cratered
terrain east from Nili Fossae westward to the eastern marginof the Antoniadi basin and from the northern Nilo-Syrtischaos southward to craters on the northern margin of theHesperian Syrtis Major formation (Figures 2 and 3). Boththe Hesperian and Noachian units have sapping channels,fluvial valleys, and depositional fans that provide geomor-phic evidence for sustained surface water flow [Mangold etal., 2007]. The largest such system is the watershed ofJezero crater, which drained 15,000 km2 during the lateNoachian or early Hesperian to form a paleolake withdeltaic deposits [Fassett and Head, 2005; Ehlmann et al.,2008b]. However, while the Noachian terrain shows exten-sive mineralogic evidence of aqueous alteration, discussed
Figure 1. Thermal Emission Imaging System (THEMIS) daytime infrared mosaic with maficmineralogic parameters overlain. In pyroxene-bearing terrains, the ratio of low-calcium pyroxene tototal (low calcium and high calcium) pyroxene is mapped with CRISM and OMEGA data using themodified Guassian model [mapping by P. Thollot according to the methods in the work of Mustard et al.,2005] so that terrains enriched in low-calcium pyroxene are green and those enriched in high-calciumpyroxene are blue. The presence of olivine is indicated in red and mapped with OMEGA data using theolivine parameter [Pelkey et al., 2007].
E00D08 EHLMANN ET AL.: AQUEOUS ALTERATION NEAR NILI FOSSAE
3 of 33
E00D08
further in this paper, the Hesperian Syrtis Major lavas do notshow evidence in orbital data of hydrated minerals [Mangoldet al., 2007].
3. Data Sets and Methods
3.1. Data Processing and Selection of Spectra
[9] CRISM is a hyperspectral imaging spectrometer onthe Mars Reconnaissance Orbiter (MRO) with 544 channelsthat sample the visible to near-infrared spectral region from0.4 to 4.0 mm using two detectors [Murchie et al., 2007a].The S detector samples wavelengths 0.4–1.0 mm, and theL detector samples wavelengths 1.0–4.0 mm. CRISMoperates in two modes: (1) a 72-channel mapping modethat will provide global coverage at 200 m/pixel and (2) afull 544-channel targeted mode that provides 10 � 10–20 km images at a resolution of 15–38 m/pixel. Results
from the L detector data of the latter, high-resolution modeare the focus of this paper and allow mapping of maficminerals and hydrated or hydroxylated alteration minerals.[10] Spacecraft data were converted to I/F as described by
Murchie et al. [2007a, 2009b]. Prior to spectral analysis,simple atmospheric and photometric corrections were ap-plied to CRISM data cubes to correct for viewing geometryand separate out the contribution of reflected light from thesurface from that of the atmosphere. Cubes were photomet-rically corrected by dividing by the cosine of the incidenceangle, assuming that to first order the surface behaves as aLambertian scatterer. The contribution of the atmospherewas removed using the volcano scan correction method,also successfully employed by the OMEGA mission[Mustard et al., 2005]. In the volcano scan method, anatmospheric transmission spectrum is derived from obser-vations at the base and top of Olympus Mons. For a given
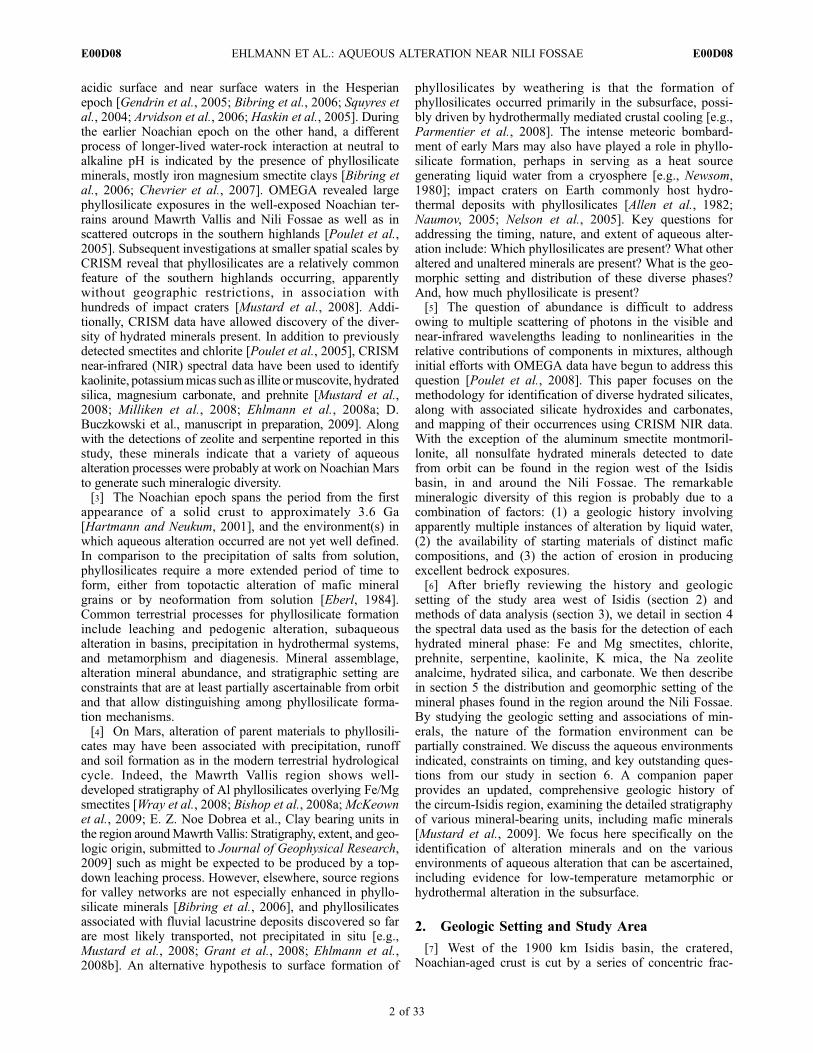
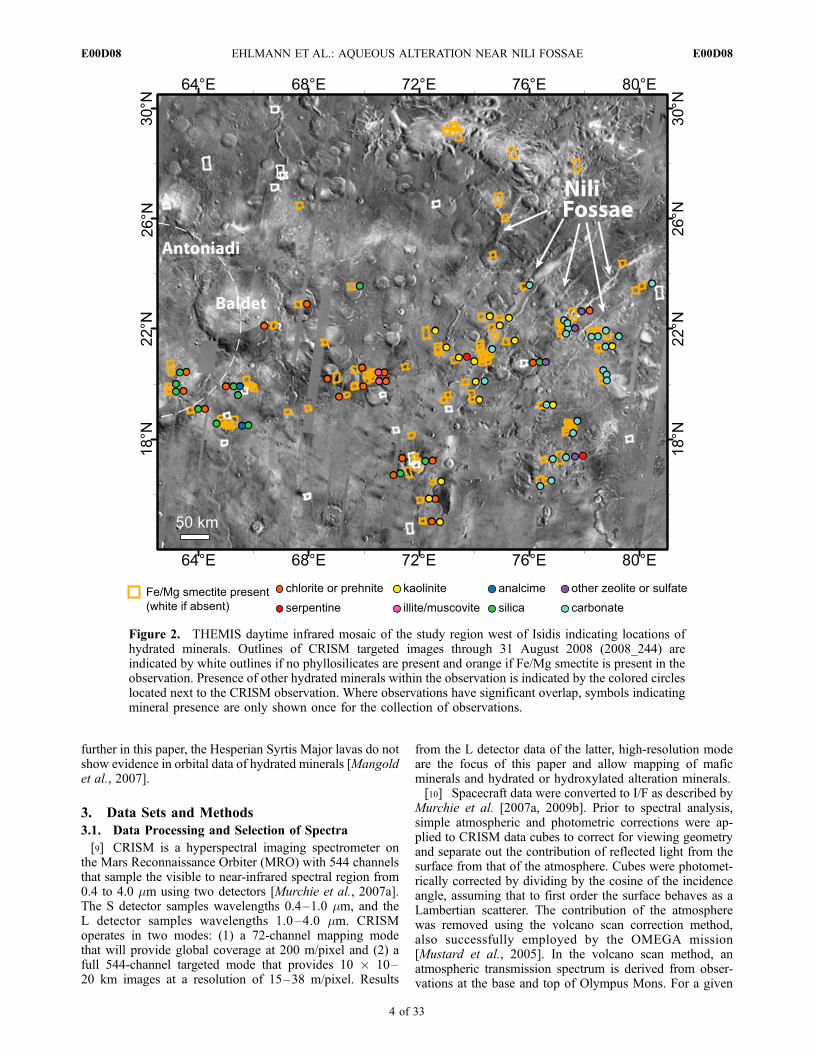
Figure 2. THEMIS daytime infrared mosaic of the study region west of Isidis indicating locations ofhydrated minerals. Outlines of CRISM targeted images through 31 August 2008 (2008_244) areindicated by white outlines if no phyllosilicates are present and orange if Fe/Mg smectite is present in theobservation. Presence of other hydrated minerals within the observation is indicated by the colored circleslocated next to the CRISM observation. Where observations have significant overlap, symbols indicatingmineral presence are only shown once for the collection of observations.
E00D08 EHLMANN ET AL.: AQUEOUS ALTERATION NEAR NILI FOSSAE
4 of 33
E00D08
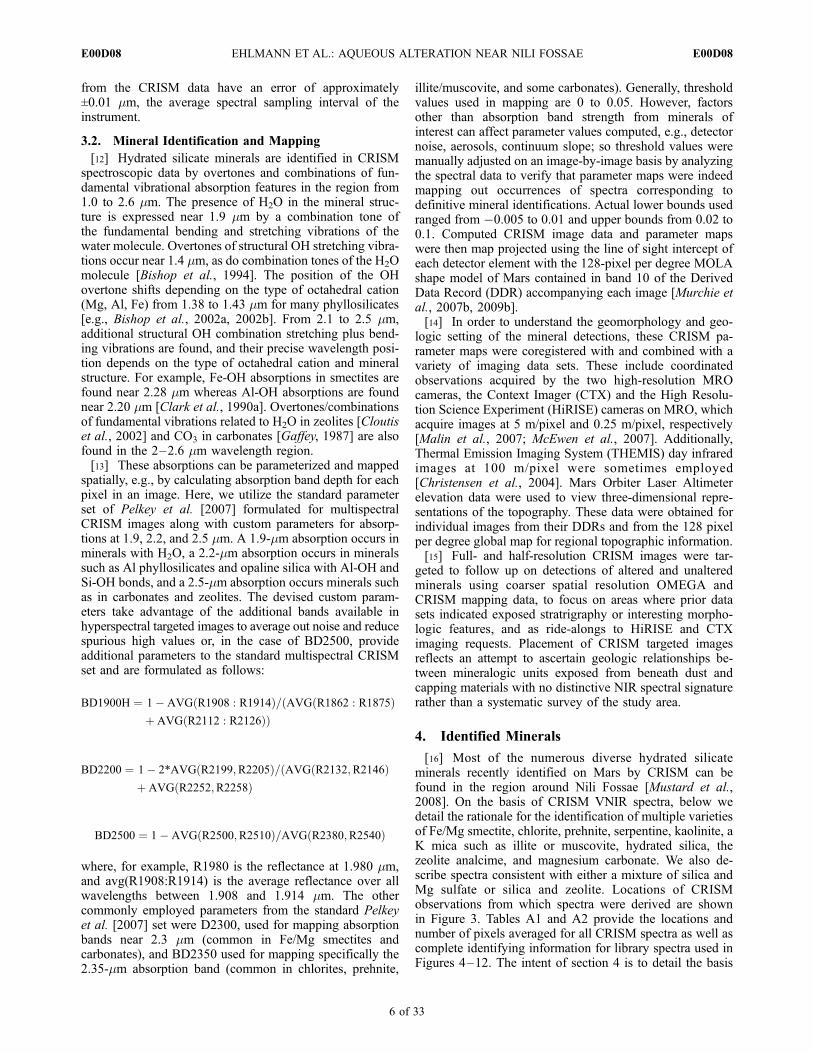
CRISM observation the atmospheric transmission spectrumis scaled to match the band depth of the 2-mm CO2 featurein each pixel, and then the observed spectrum is divided bythis scaled spectrum. The technique, which assumes amultiplicative atmospheric contribution to surface spectra,removes absorption features resulting from atmosphericgases with few residual artifacts, but aerosols and ices arenot accounted for and may lead to spectral slopes or residualabsorptions. Overall, the volcano scan technique is simpleand efficient for correcting large numbers of CRISM scenes.Results compare favorably with the more rigorous, but time-intensive scene-specific radiative transfer modelingemployed using DISORT [Arvidson et al., 2006] providedthat aerosol abundances at the time of imaging are notappreciably different from those present at the time of thevolcano scan observation. Nevertheless, small positive fea-tures or residual absorptions near 2 mm are still commonlypresent even in atmospherically corrected CRISM data (as isapparent in some CRISM spectra from Figures 4–12).These are artifacts of the atmospheric calibration methodsrather than features of use in mineral identification.[11] Following atmospheric correction, a noise removal
algorithm that removes data spikes in both the spectral andspatial domains but does not affect broader absorptions ofmineralogic interest was implemented [Parente, 2008]. In
addition, to highlight spectral differences between areas andreduce residual atmospheric and instrumental artifacts inspectra, average spectra from regions of interest weredivided by spectra from a dusty or spectrally unremarkableregion in the same scene. When possible, an n � n pixelspectrum of similar albedo to the n � n pixel spectrum ofinterest and from the same column of the unprojected imagewas used as the denominator. Sampling in the same columnreduces detector-dependent noise. Alternatively, larger,more irregularly shaped regions of interest for the numeratorand denominator were identified, not necessarily from thesame column. In both cases, tens to thousands of pixelswere averaged to minimize spurious absorptions due tonoise (Table A1). Even with these steps, some artifactspersist. After removing CRISM known bad spectral chan-nels, some known residual artifacts are common near2.0 mm owing to errors in atmospheric calibration and at1.65 mm owing to a detector filter boundary [Murchie et al.,2009b]. Single channel spikes in spectra that are too narrowfor absorptions related to mineralogy are also removed orignored. Spectra used in the detailed analysis of section 4are either from the central portion of the scene or have beencorrected for column-dependent wavelength shifts due tothe CRISM spectral smile by using the CDR WA file[Murchie et al., 2007a, 2007b]. Band centers reported here
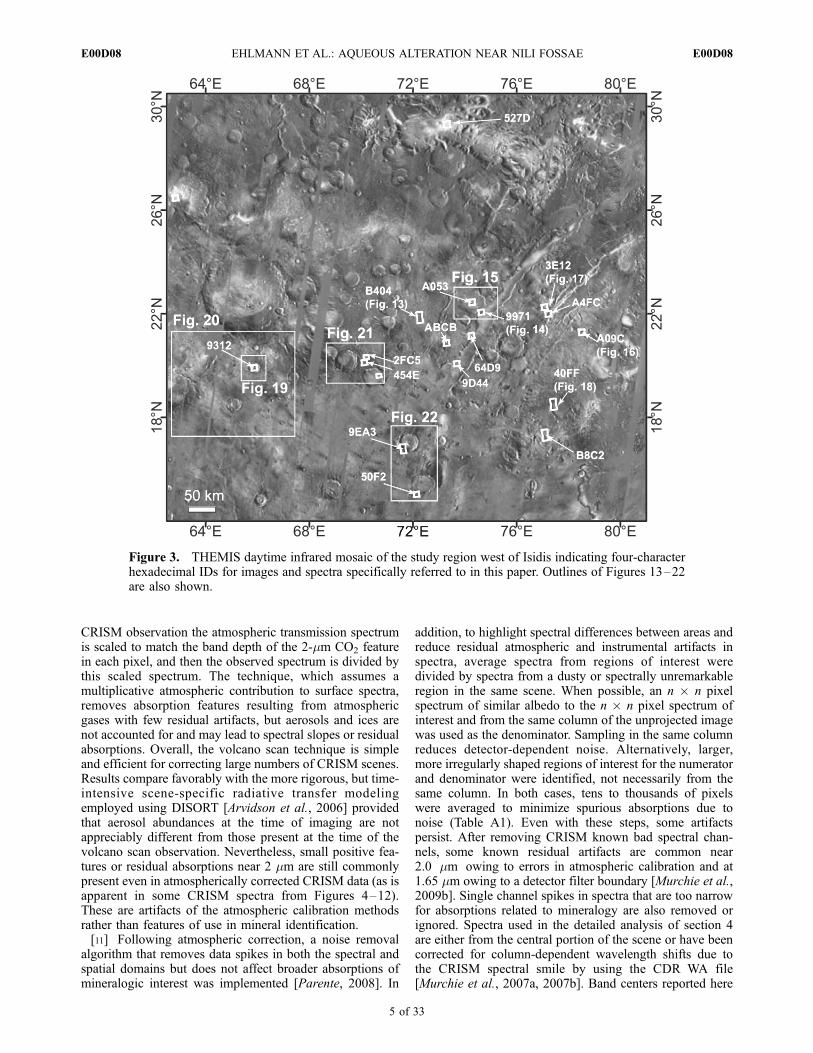
Figure 3. THEMIS daytime infrared mosaic of the study region west of Isidis indicating four-characterhexadecimal IDs for images and spectra specifically referred to in this paper. Outlines of Figures 13–22are also shown.
E00D08 EHLMANN ET AL.: AQUEOUS ALTERATION NEAR NILI FOSSAE
5 of 33
E00D08
from the CRISM data have an error of approximately±0.01 mm, the average spectral sampling interval of theinstrument.
3.2. Mineral Identification and Mapping
[12] Hydrated silicate minerals are identified in CRISMspectroscopic data by overtones and combinations of fun-damental vibrational absorption features in the region from1.0 to 2.6 mm. The presence of H2O in the mineral struc-ture is expressed near 1.9 mm by a combination tone ofthe fundamental bending and stretching vibrations of thewater molecule. Overtones of structural OH stretching vibra-tions occur near 1.4 mm, as do combination tones of the H2Omolecule [Bishop et al., 1994]. The position of the OHovertone shifts depending on the type of octahedral cation(Mg, Al, Fe) from 1.38 to 1.43 mm for many phyllosilicates[e.g., Bishop et al., 2002a, 2002b]. From 2.1 to 2.5 mm,additional structural OH combination stretching plus bend-ing vibrations are found, and their precise wavelength posi-tion depends on the type of octahedral cation and mineralstructure. For example, Fe-OH absorptions in smectites arefound near 2.28 mm whereas Al-OH absorptions are foundnear 2.20 mm [Clark et al., 1990a]. Overtones/combinationsof fundamental vibrations related to H2O in zeolites [Cloutiset al., 2002] and CO3 in carbonates [Gaffey, 1987] are alsofound in the 2–2.6 mm wavelength region.[13] These absorptions can be parameterized and mapped
spatially, e.g., by calculating absorption band depth for eachpixel in an image. Here, we utilize the standard parameterset of Pelkey et al. [2007] formulated for multispectralCRISM images along with custom parameters for absorp-tions at 1.9, 2.2, and 2.5 mm. A 1.9-mm absorption occurs inminerals with H2O, a 2.2-mm absorption occurs in mineralssuch as Al phyllosilicates and opaline silica with Al-OH andSi-OH bonds, and a 2.5-mm absorption occurs minerals suchas in carbonates and zeolites. The devised custom param-eters take advantage of the additional bands available inhyperspectral targeted images to average out noise and reducespurious high values or, in the case of BD2500, provideadditional parameters to the standard multispectral CRISMset and are formulated as follows:
BD1900H ¼ 1� AVG R1908 : R1914ð Þ= AVG R1862 : R1875ð Þðþ AVG R2112 : R2126ð ÞÞ
BD2200 ¼ 1� 2*AVG R2199;R2205ð Þ= AVG R2132;R2146ð Þðþ AVG R2252;R2258ð Þ
BD2500 ¼ 1� AVG R2500;R2510ð Þ=AVG R2380;R2540ð Þ
where, for example, R1980 is the reflectance at 1.980 mm,and avg(R1908:R1914) is the average reflectance over allwavelengths between 1.908 and 1.914 mm. The othercommonly employed parameters from the standard Pelkeyet al. [2007] set were D2300, used for mapping absorptionbands near 2.3 mm (common in Fe/Mg smectites andcarbonates), and BD2350 used for mapping specifically the2.35-mm absorption band (common in chlorites, prehnite,
illite/muscovite, and some carbonates). Generally, thresholdvalues used in mapping are 0 to 0.05. However, factorsother than absorption band strength from minerals ofinterest can affect parameter values computed, e.g., detectornoise, aerosols, continuum slope; so threshold values weremanually adjusted on an image-by-image basis by analyzingthe spectral data to verify that parameter maps were indeedmapping out occurrences of spectra corresponding todefinitive mineral identifications. Actual lower bounds usedranged from �0.005 to 0.01 and upper bounds from 0.02 to0.1. Computed CRISM image data and parameter mapswere then map projected using the line of sight intercept ofeach detector element with the 128-pixel per degree MOLAshape model of Mars contained in band 10 of the DerivedData Record (DDR) accompanying each image [Murchie etal., 2007b, 2009b].[14] In order to understand the geomorphology and geo-
logic setting of the mineral detections, these CRISM pa-rameter maps were coregistered with and combined with avariety of imaging data sets. These include coordinatedobservations acquired by the two high-resolution MROcameras, the Context Imager (CTX) and the High Resolu-tion Science Experiment (HiRISE) cameras on MRO, whichacquire images at 5 m/pixel and 0.25 m/pixel, respectively[Malin et al., 2007; McEwen et al., 2007]. Additionally,Thermal Emission Imaging System (THEMIS) day infraredimages at 100 m/pixel were sometimes employed[Christensen et al., 2004]. Mars Orbiter Laser Altimeterelevation data were used to view three-dimensional repre-sentations of the topography. These data were obtained forindividual images from their DDRs and from the 128 pixelper degree global map for regional topographic information.[15] Full- and half-resolution CRISM images were tar-
geted to follow up on detections of altered and unalteredminerals using coarser spatial resolution OMEGA andCRISM mapping data, to focus on areas where prior datasets indicated exposed stratrigraphy or interesting morpho-logic features, and as ride-alongs to HiRISE and CTXimaging requests. Placement of CRISM targeted imagesreflects an attempt to ascertain geologic relationships be-tween mineralogic units exposed from beneath dust andcapping materials with no distinctive NIR spectral signaturerather than a systematic survey of the study area.
4. Identified Minerals
[16] Most of the numerous diverse hydrated silicateminerals recently identified on Mars by CRISM can befound in the region around Nili Fossae [Mustard et al.,2008]. On the basis of CRISM VNIR spectra, below wedetail the rationale for the identification of multiple varietiesof Fe/Mg smectite, chlorite, prehnite, serpentine, kaolinite, aK mica such as illite or muscovite, hydrated silica, thezeolite analcime, and magnesium carbonate. We also de-scribe spectra consistent with either a mixture of silica andMg sulfate or silica and zeolite. Locations of CRISMobservations from which spectra were derived are shownin Figure 3. Tables A1 and A2 provide the locations andnumber of pixels averaged for all CRISM spectra as well ascomplete identifying information for library spectra used inFigures 4–12. The intent of section 4 is to detail the basis
E00D08 EHLMANN ET AL.: AQUEOUS ALTERATION NEAR NILI FOSSAE
6 of 33
E00D08
for these phases’ unique identification so that they may bereplicated by future users of CRISM data and also toprovide detailed discussions of mineral phases and uncer-tainties of interest for geochemical modeling. The discus-sion of the geologic context of these minerals begins insection 5. Three guiding principles used in our mineralidentifications were that (1) absorption features in theCRISM spectra should be consistent with the same featuresin laboratory spectra of the mineral, (2) these featuresshould not be consistent with those of other minerals (foruniqueness), and (3) no strong absorptions should be leftunexplained.
4.1. Fe/Mg Smectites
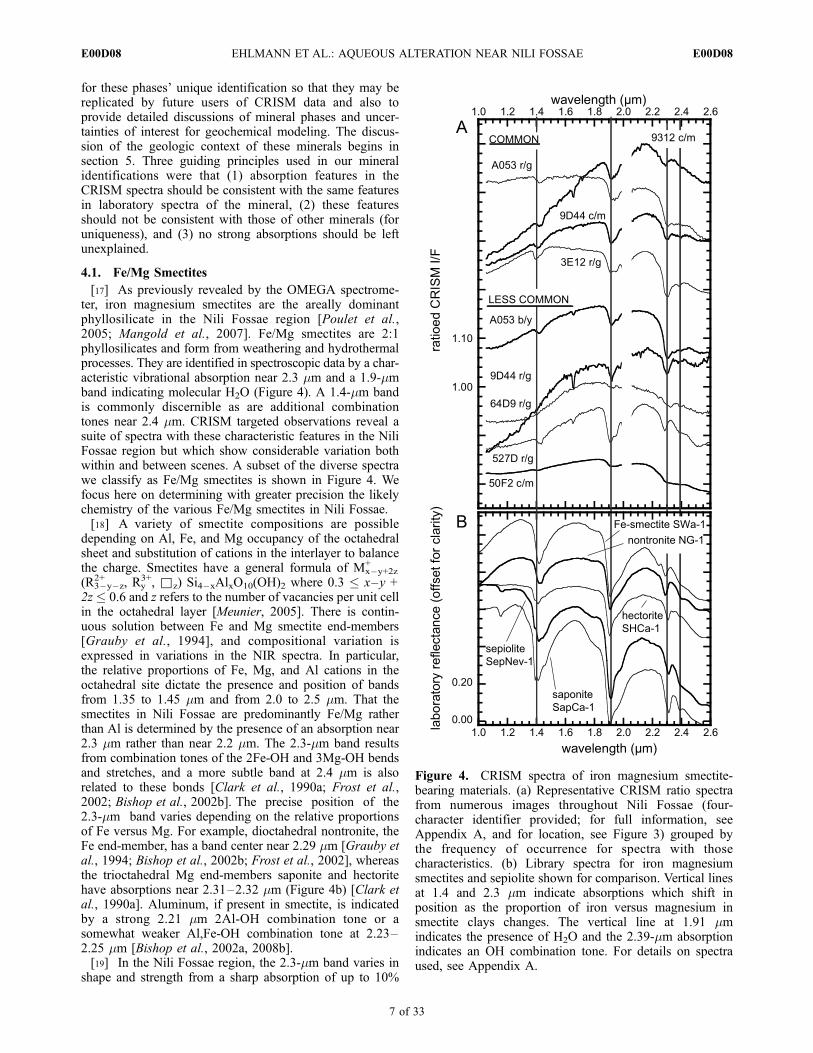
[17] As previously revealed by the OMEGA spectrome-ter, iron magnesium smectites are the areally dominantphyllosilicate in the Nili Fossae region [Poulet et al.,2005; Mangold et al., 2007]. Fe/Mg smectites are 2:1phyllosilicates and form from weathering and hydrothermalprocesses. They are identified in spectroscopic data by a char-acteristic vibrational absorption near 2.3 mm and a 1.9-mmband indicating molecular H2O (Figure 4). A 1.4-mm bandis commonly discernible as are additional combinationtones near 2.4 mm. CRISM targeted observations reveal asuite of spectra with these characteristic features in the NiliFossae region but which show considerable variation bothwithin and between scenes. A subset of the diverse spectrawe classify as Fe/Mg smectites is shown in Figure 4. Wefocus here on determining with greater precision the likelychemistry of the various Fe/Mg smectites in Nili Fossae.[18] A variety of smectite compositions are possible
depending on Al, Fe, and Mg occupancy of the octahedralsheet and substitution of cations in the interlayer to balancethe charge. Smectites have a general formula of Mx–y+2z
+
(R3–y–z2+ , Ry
3+, &z) Si4–xAlxO10(OH)2 where 0.3 � x–y +2z � 0.6 and z refers to the number of vacancies per unit cellin the octahedral layer [Meunier, 2005]. There is contin-uous solution between Fe and Mg smectite end-members[Grauby et al., 1994], and compositional variation isexpressed in variations in the NIR spectra. In particular,the relative proportions of Fe, Mg, and Al cations in theoctahedral site dictate the presence and position of bandsfrom 1.35 to 1.45 mm and from 2.0 to 2.5 mm. That thesmectites in Nili Fossae are predominantly Fe/Mg ratherthan Al is determined by the presence of an absorption near2.3 mm rather than near 2.2 mm. The 2.3-mm band resultsfrom combination tones of the 2Fe-OH and 3Mg-OH bendsand stretches, and a more subtle band at 2.4 mm is alsorelated to these bonds [Clark et al., 1990a; Frost et al.,2002; Bishop et al., 2002b]. The precise position of the2.3-mm band varies depending on the relative proportionsof Fe versus Mg. For example, dioctahedral nontronite, theFe end-member, has a band center near 2.29 mm [Grauby etal., 1994; Bishop et al., 2002b; Frost et al., 2002], whereasthe trioctahedral Mg end-members saponite and hectoritehave absorptions near 2.31–2.32 mm (Figure 4b) [Clark etal., 1990a]. Aluminum, if present in smectite, is indicatedby a strong 2.21 mm 2Al-OH combination tone or asomewhat weaker Al,Fe-OH combination tone at 2.23–2.25 mm [Bishop et al., 2002a, 2008b].[19] In the Nili Fossae region, the 2.3-mm band varies in
shape and strength from a sharp absorption of up to 10%
Figure 4. CRISM spectra of iron magnesium smectite-bearing materials. (a) Representative CRISM ratio spectrafrom numerous images throughout Nili Fossae (four-character identifier provided; for full information, seeAppendix A, and for location, see Figure 3) grouped bythe frequency of occurrence for spectra with thosecharacteristics. (b) Library spectra for iron magnesiumsmectites and sepiolite shown for comparison. Vertical linesat 1.4 and 2.3 mm indicate absorptions which shift inposition as the proportion of iron versus magnesium insmectite clays changes. The vertical line at 1.91 mmindicates the presence of H2O and the 2.39-mm absorptionindicates an OH combination tone. For details on spectraused, see Appendix A.
E00D08 EHLMANN ET AL.: AQUEOUS ALTERATION NEAR NILI FOSSAE
7 of 33
E00D08
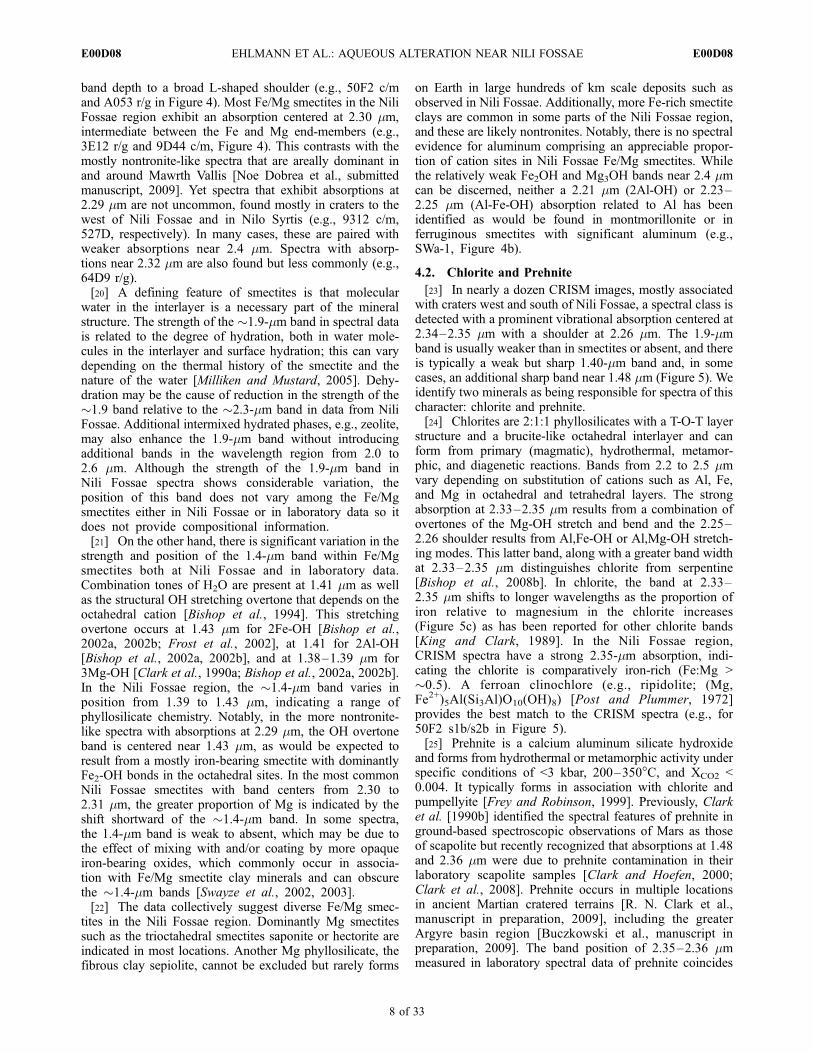
band depth to a broad L-shaped shoulder (e.g., 50F2 c/mand A053 r/g in Figure 4). Most Fe/Mg smectites in the NiliFossae region exhibit an absorption centered at 2.30 mm,intermediate between the Fe and Mg end-members (e.g.,3E12 r/g and 9D44 c/m, Figure 4). This contrasts with themostly nontronite-like spectra that are areally dominant inand around Mawrth Vallis [Noe Dobrea et al., submittedmanuscript, 2009]. Yet spectra that exhibit absorptions at2.29 mm are not uncommon, found mostly in craters to thewest of Nili Fossae and in Nilo Syrtis (e.g., 9312 c/m,527D, respectively). In many cases, these are paired withweaker absorptions near 2.4 mm. Spectra with absorp-tions near 2.32 mm are also found but less commonly (e.g.,64D9 r/g).[20] A defining feature of smectites is that molecular
water in the interlayer is a necessary part of the mineralstructure. The strength of the �1.9-mm band in spectral datais related to the degree of hydration, both in water mole-cules in the interlayer and surface hydration; this can varydepending on the thermal history of the smectite and thenature of the water [Milliken and Mustard, 2005]. Dehy-dration may be the cause of reduction in the strength of the�1.9 band relative to the �2.3-mm band in data from NiliFossae. Additional intermixed hydrated phases, e.g., zeolite,may also enhance the 1.9-mm band without introducingadditional bands in the wavelength region from 2.0 to2.6 mm. Although the strength of the 1.9-mm band inNili Fossae spectra shows considerable variation, theposition of this band does not vary among the Fe/Mgsmectites either in Nili Fossae or in laboratory data so itdoes not provide compositional information.[21] On the other hand, there is significant variation in the
strength and position of the 1.4-mm band within Fe/Mgsmectites both at Nili Fossae and in laboratory data.Combination tones of H2O are present at 1.41 mm as wellas the structural OH stretching overtone that depends on theoctahedral cation [Bishop et al., 1994]. This stretchingovertone occurs at 1.43 mm for 2Fe-OH [Bishop et al.,2002a, 2002b; Frost et al., 2002], at 1.41 for 2Al-OH[Bishop et al., 2002a, 2002b], and at 1.38–1.39 mm for3Mg-OH [Clark et al., 1990a; Bishop et al., 2002a, 2002b].In the Nili Fossae region, the �1.4-mm band varies inposition from 1.39 to 1.43 mm, indicating a range ofphyllosilicate chemistry. Notably, in the more nontronite-like spectra with absorptions at 2.29 mm, the OH overtoneband is centered near 1.43 mm, as would be expected toresult from a mostly iron-bearing smectite with dominantlyFe2-OH bonds in the octahedral sites. In the most commonNili Fossae smectites with band centers from 2.30 to2.31 mm, the greater proportion of Mg is indicated by theshift shortward of the �1.4-mm band. In some spectra,the 1.4-mm band is weak to absent, which may be due tothe effect of mixing with and/or coating by more opaqueiron-bearing oxides, which commonly occur in associa-tion with Fe/Mg smectite clay minerals and can obscurethe �1.4-mm bands [Swayze et al., 2002, 2003].[22] The data collectively suggest diverse Fe/Mg smec-
tites in the Nili Fossae region. Dominantly Mg smectitessuch as the trioctahedral smectites saponite or hectorite areindicated in most locations. Another Mg phyllosilicate, thefibrous clay sepiolite, cannot be excluded but rarely forms
on Earth in large hundreds of km scale deposits such asobserved in Nili Fossae. Additionally, more Fe-rich smectiteclays are common in some parts of the Nili Fossae region,and these are likely nontronites. Notably, there is no spectralevidence for aluminum comprising an appreciable propor-tion of cation sites in Nili Fossae Fe/Mg smectites. Whilethe relatively weak Fe2OH and Mg3OH bands near 2.4 mmcan be discerned, neither a 2.21 mm (2Al-OH) or 2.23–2.25 mm (Al-Fe-OH) absorption related to Al has beenidentified as would be found in montmorillonite or inferruginous smectites with significant aluminum (e.g.,SWa-1, Figure 4b).
4.2. Chlorite and Prehnite
[23] In nearly a dozen CRISM images, mostly associatedwith craters west and south of Nili Fossae, a spectral class isdetected with a prominent vibrational absorption centered at2.34–2.35 mm with a shoulder at 2.26 mm. The 1.9-mmband is usually weaker than in smectites or absent, and thereis typically a weak but sharp 1.40-mm band and, in somecases, an additional sharp band near 1.48 mm (Figure 5). Weidentify two minerals as being responsible for spectra of thischaracter: chlorite and prehnite.[24] Chlorites are 2:1:1 phyllosilicates with a T-O-T layer
structure and a brucite-like octahedral interlayer and canform from primary (magmatic), hydrothermal, metamor-phic, and diagenetic reactions. Bands from 2.2 to 2.5 mmvary depending on substitution of cations such as Al, Fe,and Mg in octahedral and tetrahedral layers. The strongabsorption at 2.33–2.35 mm results from a combination ofovertones of the Mg-OH stretch and bend and the 2.25–2.26 shoulder results from Al,Fe-OH or Al,Mg-OH stretch-ing modes. This latter band, along with a greater band widthat 2.33–2.35 mm distinguishes chlorite from serpentine[Bishop et al., 2008b]. In chlorite, the band at 2.33–2.35 mm shifts to longer wavelengths as the proportion ofiron relative to magnesium in the chlorite increases(Figure 5c) as has been reported for other chlorite bands[King and Clark, 1989]. In the Nili Fossae region,CRISM spectra have a strong 2.35-mm absorption, indi-cating the chlorite is comparatively iron-rich (Fe:Mg >�0.5). A ferroan clinochlore (e.g., ripidolite; (Mg,Fe2+)5Al(Si3Al)O10(OH)8) [Post and Plummer, 1972]provides the best match to the CRISM spectra (e.g., for50F2 s1b/s2b in Figure 5).[25] Prehnite is a calcium aluminum silicate hydroxide
and forms from hydrothermal or metamorphic activity underspecific conditions of <3 kbar, 200–350�C, and XCO2 <0.004. It typically forms in association with chlorite andpumpellyite [Frey and Robinson, 1999]. Previously, Clarket al. [1990b] identified the spectral features of prehnite inground-based spectroscopic observations of Mars as thoseof scapolite but recently recognized that absorptions at 1.48and 2.36 mm were due to prehnite contamination in theirlaboratory scapolite samples [Clark and Hoefen, 2000;Clark et al., 2008]. Prehnite occurs in multiple locationsin ancient Martian cratered terrains [R. N. Clark et al.,manuscript in preparation, 2009], including the greaterArgyre basin region [Buczkowski et al., manuscript inpreparation, 2009]. The band position of 2.35–2.36 mmmeasured in laboratory spectral data of prehnite coincides
8 of 33
E00D08 EHLMANN ET AL.: AQUEOUS ALTERATION NEAR NILI FOSSAE E00D08
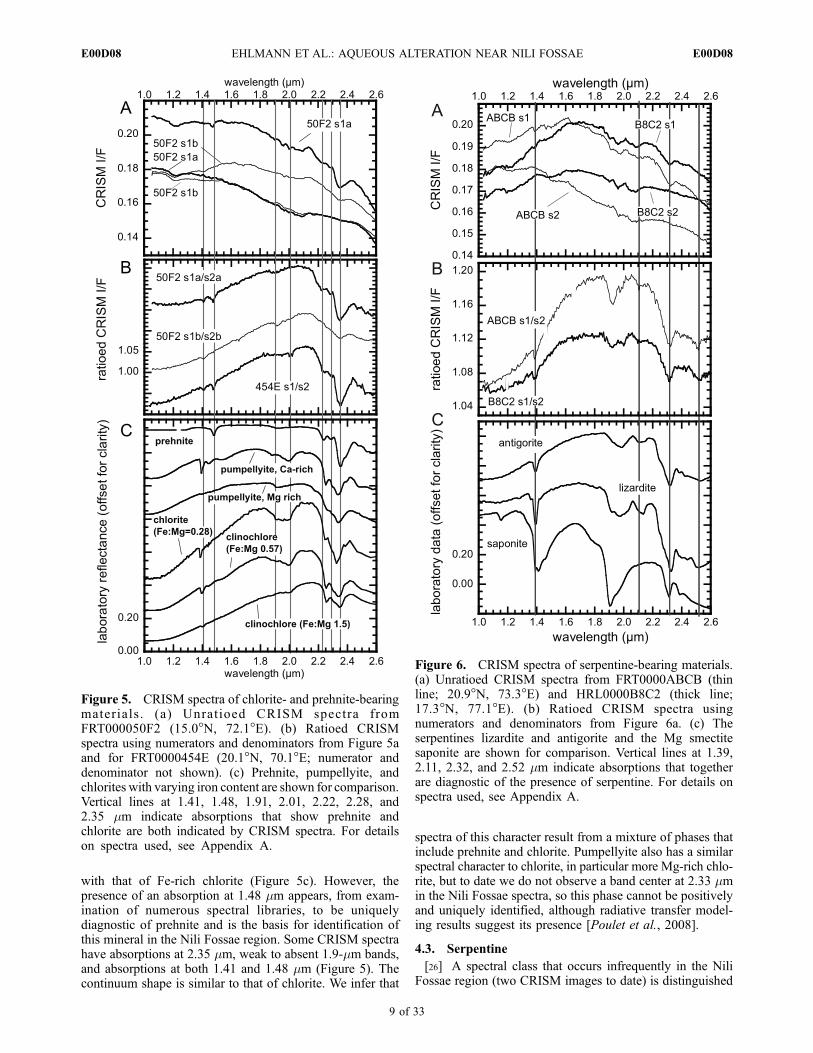
with that of Fe-rich chlorite (Figure 5c). However, thepresence of an absorption at 1.48 mm appears, from exam-ination of numerous spectral libraries, to be uniquelydiagnostic of prehnite and is the basis for identification ofthis mineral in the Nili Fossae region. Some CRISM spectrahave absorptions at 2.35 mm, weak to absent 1.9-mm bands,and absorptions at both 1.41 and 1.48 mm (Figure 5). Thecontinuum shape is similar to that of chlorite. We infer that
spectra of this character result from a mixture of phases thatinclude prehnite and chlorite. Pumpellyite also has a similarspectral character to chlorite, in particular more Mg-rich chlo-rite, but to date we do not observe a band center at 2.33 mmin the Nili Fossae spectra, so this phase cannot be positivelyand uniquely identified, although radiative transfer model-ing results suggest its presence [Poulet et al., 2008].
4.3. Serpentine
[26] A spectral class that occurs infrequently in the NiliFossae region (two CRISM images to date) is distinguished
Figure 5. CRISM spectra of chlorite- and prehnite-bearingmaterials . (a) Unrat ioed CRISM spectra fromFRT000050F2 (15.0�N, 72.1�E). (b) Ratioed CRISMspectra using numerators and denominators from Figure 5aand for FRT0000454E (20.1�N, 70.1�E; numerator anddenominator not shown). (c) Prehnite, pumpellyite, andchlorites with varying iron content are shown for comparison.Vertical lines at 1.41, 1.48, 1.91, 2.01, 2.22, 2.28, and2.35 mm indicate absorptions that show prehnite andchlorite are both indicated by CRISM spectra. For detailson spectra used, see Appendix A.
Figure 6. CRISM spectra of serpentine-bearing materials.(a) Unratioed CRISM spectra from FRT0000ABCB (thinline; 20.9�N, 73.3�E) and HRL0000B8C2 (thick line;17.3�N, 77.1�E). (b) Ratioed CRISM spectra usingnumerators and denominators from Figure 6a. (c) Theserpentines lizardite and antigorite and the Mg smectitesaponite are shown for comparison. Vertical lines at 1.39,2.11, 2.32, and 2.52 mm indicate absorptions that togetherare diagnostic of the presence of serpentine. For details onspectra used, see Appendix A.
E00D08 EHLMANN ET AL.: AQUEOUS ALTERATION NEAR NILI FOSSAE
9 of 33
E00D08
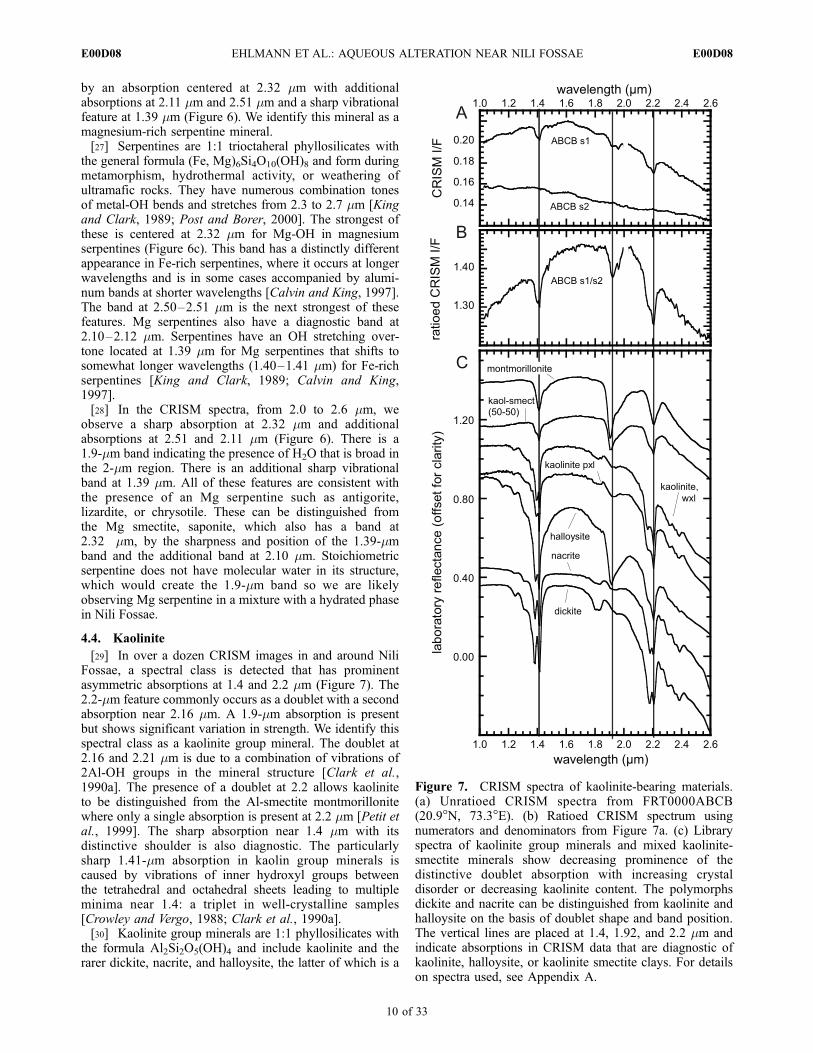
by an absorption centered at 2.32 mm with additionalabsorptions at 2.11 mm and 2.51 mm and a sharp vibrationalfeature at 1.39 mm (Figure 6). We identify this mineral as amagnesium-rich serpentine mineral.[27] Serpentines are 1:1 trioctaheral phyllosilicates with
the general formula (Fe, Mg)6Si4O10(OH)8 and form duringmetamorphism, hydrothermal activity, or weathering ofultramafic rocks. They have numerous combination tonesof metal-OH bends and stretches from 2.3 to 2.7 mm [Kingand Clark, 1989; Post and Borer, 2000]. The strongest ofthese is centered at 2.32 mm for Mg-OH in magnesiumserpentines (Figure 6c). This band has a distinctly differentappearance in Fe-rich serpentines, where it occurs at longerwavelengths and is in some cases accompanied by alumi-num bands at shorter wavelengths [Calvin and King, 1997].The band at 2.50–2.51 mm is the next strongest of thesefeatures. Mg serpentines also have a diagnostic band at2.10–2.12 mm. Serpentines have an OH stretching over-tone located at 1.39 mm for Mg serpentines that shifts tosomewhat longer wavelengths (1.40–1.41 mm) for Fe-richserpentines [King and Clark, 1989; Calvin and King,1997].[28] In the CRISM spectra, from 2.0 to 2.6 mm, we
observe a sharp absorption at 2.32 mm and additionalabsorptions at 2.51 and 2.11 mm (Figure 6). There is a1.9-mm band indicating the presence of H2O that is broad inthe 2-mm region. There is an additional sharp vibrationalband at 1.39 mm. All of these features are consistent withthe presence of an Mg serpentine such as antigorite,lizardite, or chrysotile. These can be distinguished fromthe Mg smectite, saponite, which also has a band at2.32 mm, by the sharpness and position of the 1.39-mmband and the additional band at 2.10 mm. Stoichiometricserpentine does not have molecular water in its structure,which would create the 1.9-mm band so we are likelyobserving Mg serpentine in a mixture with a hydrated phasein Nili Fossae.
4.4. Kaolinite
[29] In over a dozen CRISM images in and around NiliFossae, a spectral class is detected that has prominentasymmetric absorptions at 1.4 and 2.2 mm (Figure 7). The2.2-mm feature commonly occurs as a doublet with a secondabsorption near 2.16 mm. A 1.9-mm absorption is presentbut shows significant variation in strength. We identify thisspectral class as a kaolinite group mineral. The doublet at2.16 and 2.21 mm is due to a combination of vibrations of2Al-OH groups in the mineral structure [Clark et al.,1990a]. The presence of a doublet at 2.2 allows kaoliniteto be distinguished from the Al-smectite montmorillonitewhere only a single absorption is present at 2.2 mm [Petit etal., 1999]. The sharp absorption near 1.4 mm with itsdistinctive shoulder is also diagnostic. The particularlysharp 1.41-mm absorption in kaolin group minerals iscaused by vibrations of inner hydroxyl groups betweenthe tetrahedral and octahedral sheets leading to multipleminima near 1.4: a triplet in well-crystalline samples[Crowley and Vergo, 1988; Clark et al., 1990a].[30] Kaolinite group minerals are 1:1 phyllosilicates with
the formula Al2Si2O5(OH)4 and include kaolinite and therarer dickite, nacrite, and halloysite, the latter of which is a
Figure 7. CRISM spectra of kaolinite-bearing materials.(a) Unratioed CRISM spectra from FRT0000ABCB(20.9�N, 73.3�E). (b) Ratioed CRISM spectrum usingnumerators and denominators from Figure 7a. (c) Libraryspectra of kaolinite group minerals and mixed kaolinite-smectite minerals show decreasing prominence of thedistinctive doublet absorption with increasing crystaldisorder or decreasing kaolinite content. The polymorphsdickite and nacrite can be distinguished from kaolinite andhalloysite on the basis of doublet shape and band position.The vertical lines are placed at 1.4, 1.92, and 2.2 mm andindicate absorptions in CRISM data that are diagnostic ofkaolinite, halloysite, or kaolinite smectite clays. For detailson spectra used, see Appendix A.
E00D08 EHLMANN ET AL.: AQUEOUS ALTERATION NEAR NILI FOSSAE
10 of 33
E00D08
hydrated form [Giese, 1988]. Some features in IR spectracan be used to differentiate between these similar minerals.In particular, dickite and nacrite have a prominent shortwavelength absorption in the doublet at 2.17–2.18 mmwhereas kaolinite and halloysite have a weaker absorption
at 2.16 mm as is observed in the CRISM data from NiliFossae (Figure 7). Kaolinite forms as a weathering product,via hydrothermal alteration, or as an authigenic sedimentarymineral [Murray, 1988]. The hydrated form, halloysite,usually forms under weathering or hydrothermal processesthat favor a more disordered structure, such as alternatingwet and dry conditions or rapid growth [Giese, 1988]. Well-crystalline kaolinite has a very sharp, defined doublet withtwo distinct absorptions at CRISM spectral resolution.Disordered kaolinite, halloysite, and kaolinite-smectitemixed layer phyllosilicates have less well-defined doubletsas can be seen in Figure 7c [Crowley and Vergo, 1988].CRISM spectra are generally more similar to these forms ofless well-crystalline kaolinite and have a 1.9-mm bandindicating structural water as is typical for halloysite andkaolinite-smectite mixed phyllosilicates. However, the sep-aration of the doublet absorptions is near the level of noisein the CRISM data and spatial averaging to reduce noisetends to decrease the prominence of the doublet. It is alsolikely that a pixel might include other hydrated minerals,spatially mixed at a subpixel scale, which might contributeto the 1.9-mm band. The detection of a kaolinite groupmineral is definitive, and a poorly crystalline kaolinite,halloysite or a mixed layer kaolinite-smectite (with kaolinite> smectite) are the likely specific mineral candidates.
4.5. Illite/Muscovite
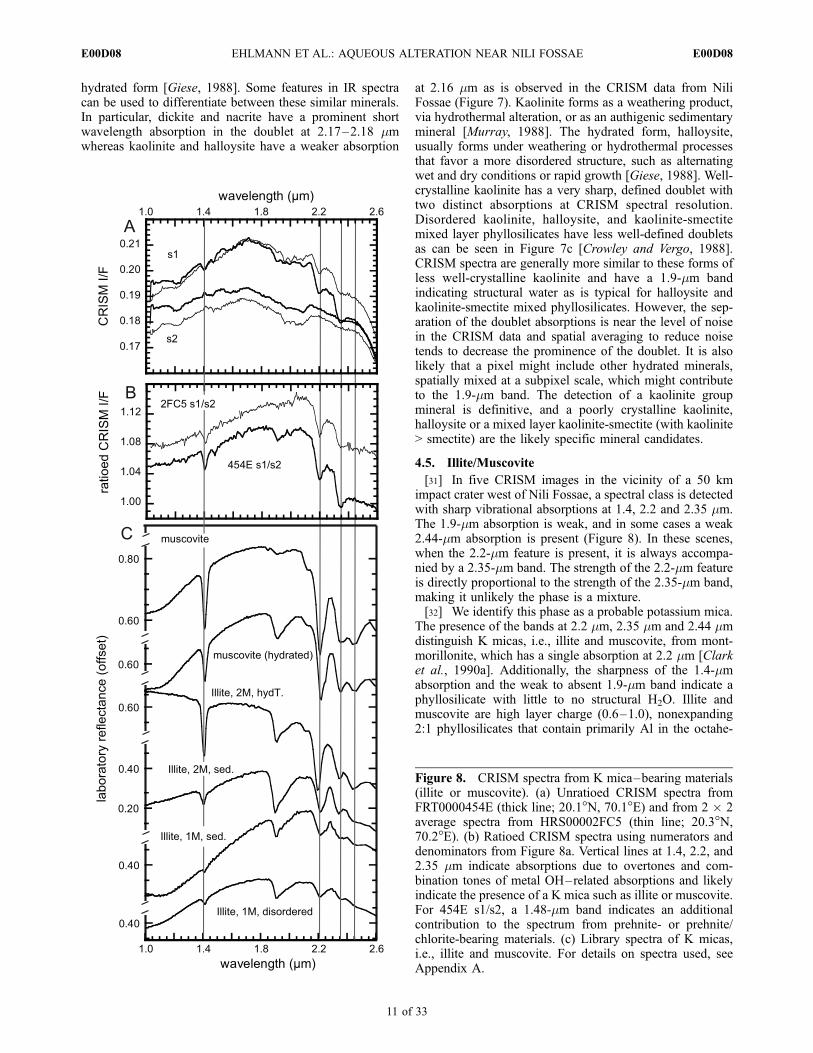
[31] In five CRISM images in the vicinity of a 50 kmimpact crater west of Nili Fossae, a spectral class is detectedwith sharp vibrational absorptions at 1.4, 2.2 and 2.35 mm.The 1.9-mm absorption is weak, and in some cases a weak2.44-mm absorption is present (Figure 8). In these scenes,when the 2.2-mm feature is present, it is always accompa-nied by a 2.35-mm band. The strength of the 2.2-mm featureis directly proportional to the strength of the 2.35-mm band,making it unlikely the phase is a mixture.[32] We identify this phase as a probable potassium mica.
The presence of the bands at 2.2 mm, 2.35 mm and 2.44 mmdistinguish K micas, i.e., illite and muscovite, from mont-morillonite, which has a single absorption at 2.2 mm [Clarket al., 1990a]. Additionally, the sharpness of the 1.4-mmabsorption and the weak to absent 1.9-mm band indicate aphyllosilicate with little to no structural H2O. Illite andmuscovite are high layer charge (0.6–1.0), nonexpanding2:1 phyllosilicates that contain primarily Al in the octahe-
Figure 8. CRISM spectra from K mica–bearing materials(illite or muscovite). (a) Unratioed CRISM spectra fromFRT0000454E (thick line; 20.1�N, 70.1�E) and from 2 � 2average spectra from HRS00002FC5 (thin line; 20.3�N,70.2�E). (b) Ratioed CRISM spectra using numerators anddenominators from Figure 8a. Vertical lines at 1.4, 2.2, and2.35 mm indicate absorptions due to overtones and com-bination tones of metal OH–related absorptions and likelyindicate the presence of a K mica such as illite or muscovite.For 454E s1/s2, a 1.48-mm band indicates an additionalcontribution to the spectrum from prehnite- or prehnite/chlorite-bearing materials. (c) Library spectra of K micas,i.e., illite and muscovite. For details on spectra used, seeAppendix A.
E00D08 EHLMANN ET AL.: AQUEOUS ALTERATION NEAR NILI FOSSAE
11 of 33
E00D08
dral layer, some Al in the tetrahedral layer, K in theinterlayer region [Meunier, 2005]. The absorption featuresfrom 2.2 to 2.5 mm in K micas are due to stretch plus bendcombination bands of structural OH bound to Al [Clark etal., 1990a].[33] Distinguishing between illite and muscovite is chal-
lenging. Illite is a K-deficient intermediate phase betweenthe micas pyrophyllite (Al2Si4O10(OH)2) and muscovite(KAl2AlSi3O10(OH)2). Muscovite can be magmatic, hydro-thermal, or metamorphic. Illite can form from hydrothermal,diagenetic, or weathering reactions. In diagenetic or weath-ering reactions, disordered or 1M polytypes of illite withsignificant interlayer water or mixed layer illite-smectiteclays are the most common [Rosenberg, 2002]. Withincreasing temperature, pressure, or time, illite undergoesa polytypic conversion of 1Md to 1M to 2M1 and eventuallyto muscovite [Lonker and Fitzgerald, 1990; Rosenberg,2002]. NIR vibrational absorptions in spectra of thesevarious polytypes of illite and muscovite usually differ intheir relative strengths, though not positions (Figure 8c)[Clark et al., 1990a; Kruse and Hauff, 1991].[34] Because of the small size (<15 CRISM pixels at
most) of the K mica–bearing exposures found to date,obtaining ‘‘pure’’ spectra of this phase is difficult. Chloriteand/or prehnite are found in the same images and in geo-morphically similar knobby, ridged terrain. Their absorp-tions at 2.35 mm obviously contribute to the strength of the2.35-mm feature in some K mica–bearing spectra, and the1.48-mm absorption probably indicates the presence ofprehnite (e.g., 454E in Figure 8). The 2 � 2 averagespectrum from HRS00002FC5 is the ‘‘purest’’ found todate. The sharpness of the 1.4 and 2.2-mm absorptions, thelack of a 1.9-mm absorption, and the distinguishable 2.35and 2.44-mm absorptions indicate K mica. The small size ofexposures imaged to date and consequently relatively highnoise in spectra along with the similarity of illite andmuscovite in VNIR spectral data preclude a more specificidentification.
4.6. Zeolite: Analcime
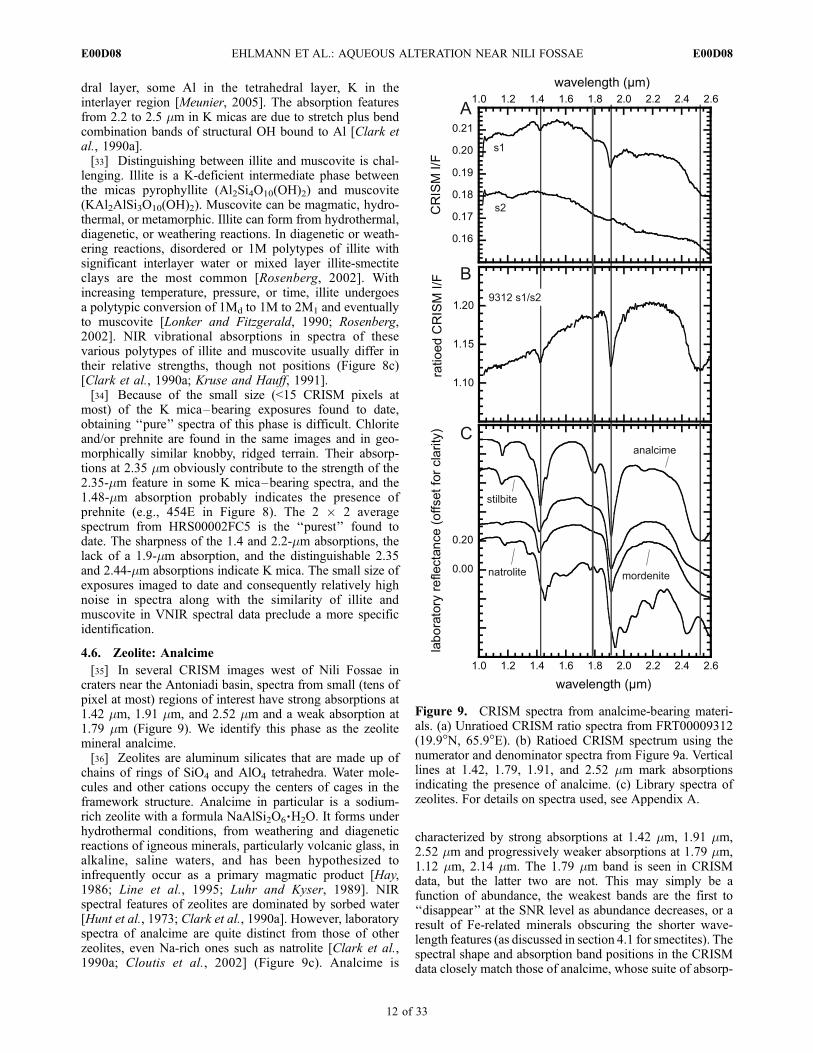
[35] In several CRISM images west of Nili Fossae incraters near the Antoniadi basin, spectra from small (tens ofpixel at most) regions of interest have strong absorptions at1.42 mm, 1.91 mm, and 2.52 mm and a weak absorption at1.79 mm (Figure 9). We identify this phase as the zeolitemineral analcime.[36] Zeolites are aluminum silicates that are made up of
chains of rings of SiO4 and AlO4 tetrahedra. Water mole-cules and other cations occupy the centers of cages in theframework structure. Analcime in particular is a sodium-rich zeolite with a formula NaAlSi2O6
.H2O. It forms underhydrothermal conditions, from weathering and diageneticreactions of igneous minerals, particularly volcanic glass, inalkaline, saline waters, and has been hypothesized toinfrequently occur as a primary magmatic product [Hay,1986; Line et al., 1995; Luhr and Kyser, 1989]. NIRspectral features of zeolites are dominated by sorbed water[Hunt et al., 1973; Clark et al., 1990a]. However, laboratoryspectra of analcime are quite distinct from those of otherzeolites, even Na-rich ones such as natrolite [Clark et al.,1990a; Cloutis et al., 2002] (Figure 9c). Analcime is
characterized by strong absorptions at 1.42 mm, 1.91 mm,2.52 mm and progressively weaker absorptions at 1.79 mm,1.12 mm, 2.14 mm. The 1.79 mm band is seen in CRISMdata, but the latter two are not. This may simply be afunction of abundance, the weakest bands are the first to‘‘disappear’’ at the SNR level as abundance decreases, or aresult of Fe-related minerals obscuring the shorter wave-length features (as discussed in section 4.1 for smectites). Thespectral shape and absorption band positions in the CRISMdata closely match those of analcime, whose suite of absorp-
Figure 9. CRISM spectra from analcime-bearing materi-als. (a) Unratioed CRISM ratio spectra from FRT00009312(19.9�N, 65.9�E). (b) Ratioed CRISM spectrum using thenumerator and denominator spectra from Figure 9a. Verticallines at 1.42, 1.79, 1.91, and 2.52 mm mark absorptionsindicating the presence of analcime. (c) Library spectra ofzeolites. For details on spectra used, see Appendix A.
E00D08 EHLMANN ET AL.: AQUEOUS ALTERATION NEAR NILI FOSSAE
12 of 33
E00D08
tions in this wavelength range are apparently unique amongminerals measured by NIR spectroscopy to date.
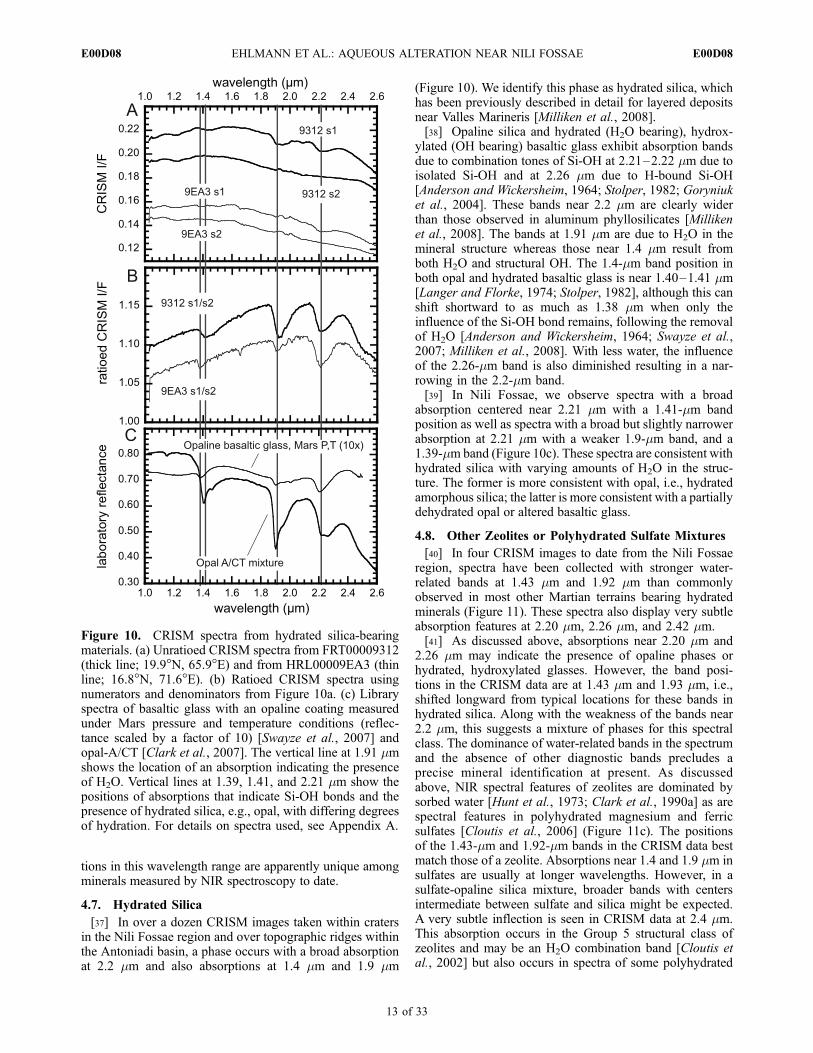
4.7. Hydrated Silica
[37] In over a dozen CRISM images taken within cratersin the Nili Fossae region and over topographic ridges withinthe Antoniadi basin, a phase occurs with a broad absorptionat 2.2 mm and also absorptions at 1.4 mm and 1.9 mm
(Figure 10). We identify this phase as hydrated silica, whichhas been previously described in detail for layered depositsnear Valles Marineris [Milliken et al., 2008].[38] Opaline silica and hydrated (H2O bearing), hydrox-
ylated (OH bearing) basaltic glass exhibit absorption bandsdue to combination tones of Si-OH at 2.21–2.22 mm due toisolated Si-OH and at 2.26 mm due to H-bound Si-OH[Anderson and Wickersheim, 1964; Stolper, 1982; Goryniuket al., 2004]. These bands near 2.2 mm are clearly widerthan those observed in aluminum phyllosilicates [Millikenet al., 2008]. The bands at 1.91 mm are due to H2O in themineral structure whereas those near 1.4 mm result fromboth H2O and structural OH. The 1.4-mm band position inboth opal and hydrated basaltic glass is near 1.40–1.41 mm[Langer and Florke, 1974; Stolper, 1982], although this canshift shortward to as much as 1.38 mm when only theinfluence of the Si-OH bond remains, following the removalof H2O [Anderson and Wickersheim, 1964; Swayze et al.,2007; Milliken et al., 2008]. With less water, the influenceof the 2.26-mm band is also diminished resulting in a nar-rowing in the 2.2-mm band.[39] In Nili Fossae, we observe spectra with a broad
absorption centered near 2.21 mm with a 1.41-mm bandposition as well as spectra with a broad but slightly narrowerabsorption at 2.21 mm with a weaker 1.9-mm band, and a1.39-mm band (Figure 10c). These spectra are consistent withhydrated silica with varying amounts of H2O in the struc-ture. The former is more consistent with opal, i.e., hydratedamorphous silica; the latter is more consistent with a partiallydehydrated opal or altered basaltic glass.
4.8. Other Zeolites or Polyhydrated Sulfate Mixtures
[40] In four CRISM images to date from the Nili Fossaeregion, spectra have been collected with stronger water-related bands at 1.43 mm and 1.92 mm than commonlyobserved in most other Martian terrains bearing hydratedminerals (Figure 11). These spectra also display very subtleabsorption features at 2.20 mm, 2.26 mm, and 2.42 mm.[41] As discussed above, absorptions near 2.20 mm and
2.26 mm may indicate the presence of opaline phases orhydrated, hydroxylated glasses. However, the band posi-tions in the CRISM data are at 1.43 mm and 1.93 mm, i.e.,shifted longward from typical locations for these bands inhydrated silica. Along with the weakness of the bands near2.2 mm, this suggests a mixture of phases for this spectralclass. The dominance of water-related bands in the spectrumand the absence of other diagnostic bands precludes aprecise mineral identification at present. As discussedabove, NIR spectral features of zeolites are dominated bysorbed water [Hunt et al., 1973; Clark et al., 1990a] as arespectral features in polyhydrated magnesium and ferricsulfates [Cloutis et al., 2006] (Figure 11c). The positionsof the 1.43-mm and 1.92-mm bands in the CRISM data bestmatch those of a zeolite. Absorptions near 1.4 and 1.9 mm insulfates are usually at longer wavelengths. However, in asulfate-opaline silica mixture, broader bands with centersintermediate between sulfate and silica might be expected.A very subtle inflection is seen in CRISM data at 2.4 mm.This absorption occurs in the Group 5 structural class ofzeolites and may be an H2O combination band [Cloutis etal., 2002] but also occurs in spectra of some polyhydrated
Figure 10. CRISM spectra from hydrated silica-bearingmaterials. (a) Unratioed CRISM spectra from FRT00009312(thick line; 19.9�N, 65.9�E) and from HRL00009EA3 (thinline; 16.8�N, 71.6�E). (b) Ratioed CRISM spectra usingnumerators and denominators from Figure 10a. (c) Libraryspectra of basaltic glass with an opaline coating measuredunder Mars pressure and temperature conditions (reflec-tance scaled by a factor of 10) [Swayze et al., 2007] andopal-A/CT [Clark et al., 2007]. The vertical line at 1.91 mmshows the location of an absorption indicating the presenceof H2O. Vertical lines at 1.39, 1.41, and 2.21 mm show thepositions of absorptions that indicate Si-OH bonds and thepresence of hydrated silica, e.g., opal, with differing degreesof hydration. For details on spectra used, see Appendix A.
E00D08 EHLMANN ET AL.: AQUEOUS ALTERATION NEAR NILI FOSSAE
13 of 33
E00D08
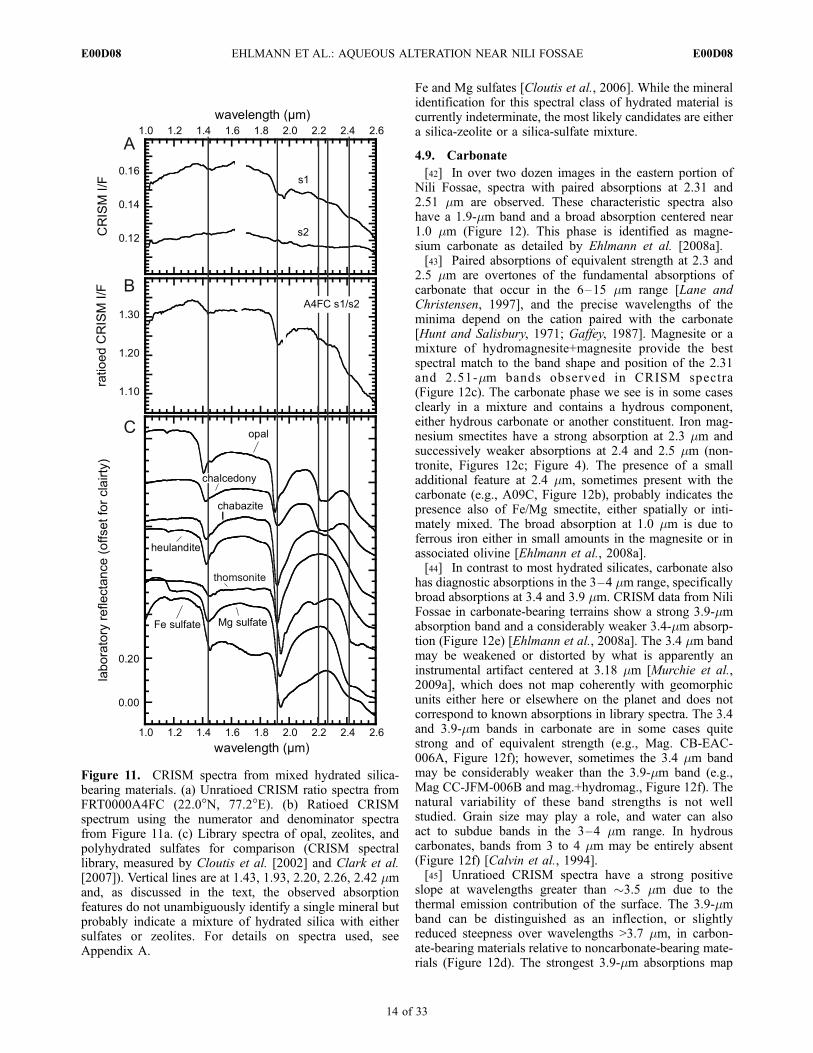
Fe and Mg sulfates [Cloutis et al., 2006]. While the mineralidentification for this spectral class of hydrated material iscurrently indeterminate, the most likely candidates are eithera silica-zeolite or a silica-sulfate mixture.
4.9. Carbonate
[42] In over two dozen images in the eastern portion ofNili Fossae, spectra with paired absorptions at 2.31 and2.51 mm are observed. These characteristic spectra alsohave a 1.9-mm band and a broad absorption centered near1.0 mm (Figure 12). This phase is identified as magne-sium carbonate as detailed by Ehlmann et al. [2008a].[43] Paired absorptions of equivalent strength at 2.3 and
2.5 mm are overtones of the fundamental absorptions ofcarbonate that occur in the 6–15 mm range [Lane andChristensen, 1997], and the precise wavelengths of theminima depend on the cation paired with the carbonate[Hunt and Salisbury, 1971; Gaffey, 1987]. Magnesite or amixture of hydromagnesite+magnesite provide the bestspectral match to the band shape and position of the 2.31and 2.51-mm bands observed in CRISM spectra(Figure 12c). The carbonate phase we see is in some casesclearly in a mixture and contains a hydrous component,either hydrous carbonate or another constituent. Iron mag-nesium smectites have a strong absorption at 2.3 mm andsuccessively weaker absorptions at 2.4 and 2.5 mm (non-tronite, Figures 12c; Figure 4). The presence of a smalladditional feature at 2.4 mm, sometimes present with thecarbonate (e.g., A09C, Figure 12b), probably indicates thepresence also of Fe/Mg smectite, either spatially or inti-mately mixed. The broad absorption at 1.0 mm is due toferrous iron either in small amounts in the magnesite or inassociated olivine [Ehlmann et al., 2008a].[44] In contrast to most hydrated silicates, carbonate also
has diagnostic absorptions in the 3–4 mm range, specificallybroad absorptions at 3.4 and 3.9 mm. CRISM data from NiliFossae in carbonate-bearing terrains show a strong 3.9-mmabsorption band and a considerably weaker 3.4-mm absorp-tion (Figure 12e) [Ehlmann et al., 2008a]. The 3.4 mm bandmay be weakened or distorted by what is apparently aninstrumental artifact centered at 3.18 mm [Murchie et al.,2009a], which does not map coherently with geomorphicunits either here or elsewhere on the planet and does notcorrespond to known absorptions in library spectra. The 3.4and 3.9-mm bands in carbonate are in some cases quitestrong and of equivalent strength (e.g., Mag. CB-EAC-006A, Figure 12f); however, sometimes the 3.4 mm bandmay be considerably weaker than the 3.9-mm band (e.g.,Mag CC-JFM-006B and mag.+hydromag., Figure 12f). Thenatural variability of these band strengths is not wellstudied. Grain size may play a role, and water can alsoact to subdue bands in the 3–4 mm range. In hydrouscarbonates, bands from 3 to 4 mm may be entirely absent(Figure 12f) [Calvin et al., 1994].[45] Unratioed CRISM spectra have a strong positive
slope at wavelengths greater than �3.5 mm due to thethermal emission contribution of the surface. The 3.9-mmband can be distinguished as an inflection, or slightlyreduced steepness over wavelengths >3.7 mm, in carbon-ate-bearing materials relative to noncarbonate-bearing mate-rials (Figure 12d). The strongest 3.9-mm absorptions map
Figure 11. CRISM spectra from mixed hydrated silica-bearing materials. (a) Unratioed CRISM ratio spectra fromFRT0000A4FC (22.0�N, 77.2�E). (b) Ratioed CRISMspectrum using the numerator and denominator spectrafrom Figure 11a. (c) Library spectra of opal, zeolites, andpolyhydrated sulfates for comparison (CRISM spectrallibrary, measured by Cloutis et al. [2002] and Clark et al.[2007]). Vertical lines are at 1.43, 1.93, 2.20, 2.26, 2.42 mmand, as discussed in the text, the observed absorptionfeatures do not unambiguously identify a single mineral butprobably indicate a mixture of hydrated silica with eithersulfates or zeolites. For details on spectra used, seeAppendix A.
E00D08 EHLMANN ET AL.: AQUEOUS ALTERATION NEAR NILI FOSSAE
14 of 33
E00D08
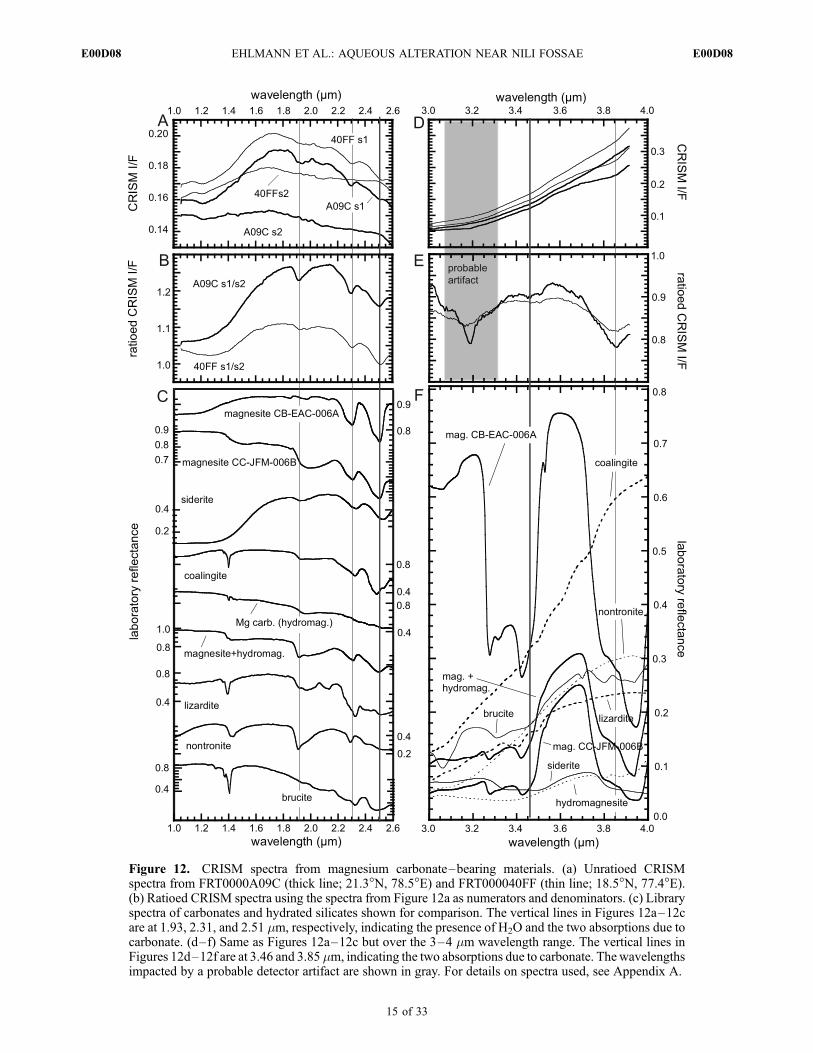
Figure 12. CRISM spectra from magnesium carbonate–bearing materials. (a) Unratioed CRISMspectra from FRT0000A09C (thick line; 21.3�N, 78.5�E) and FRT000040FF (thin line; 18.5�N, 77.4�E).(b) Ratioed CRISM spectra using the spectra from Figure 12a as numerators and denominators. (c) Libraryspectra of carbonates and hydrated silicates shown for comparison. The vertical lines in Figures 12a–12care at 1.93, 2.31, and 2.51 mm, respectively, indicating the presence of H2O and the two absorptions due tocarbonate. (d–f) Same as Figures 12a–12c but over the 3–4 mm wavelength range. The vertical lines inFigures 12d–12f are at 3.46 and 3.85 mm, indicating the two absorptions due to carbonate. Thewavelengthsimpacted by a probable detector artifact are shown in gray. For details on spectra used, see Appendix A.
E00D08 EHLMANN ET AL.: AQUEOUS ALTERATION NEAR NILI FOSSAE
15 of 33
E00D08
spatially in the same locations as the 2.31 and 2.51 mmbands [Ehlmann et al., 2008a, supplementary online mate-rial]. The 2.51-mm band never occurs alone in spectrallysampled terrains in this part of the planet but is alwaysaccompanied by the 2.31 mm band. These spectral charac-teristics allow magnesium carbonate to be identified andmapped.
5. Geomorphology and Geologic Setting
5.1. Mineral Distribution: Provinces of Alteration
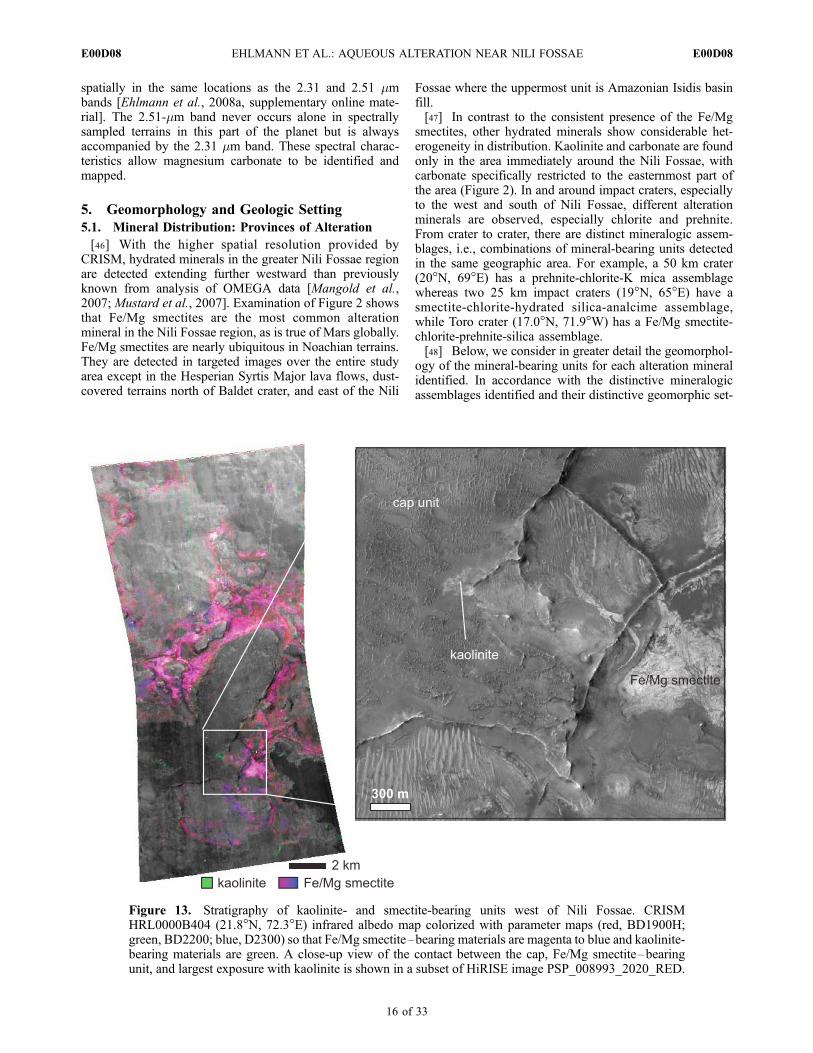
[46] With the higher spatial resolution provided byCRISM, hydrated minerals in the greater Nili Fossae regionare detected extending further westward than previouslyknown from analysis of OMEGA data [Mangold et al.,2007; Mustard et al., 2007]. Examination of Figure 2 showsthat Fe/Mg smectites are the most common alterationmineral in the Nili Fossae region, as is true of Mars globally.Fe/Mg smectites are nearly ubiquitous in Noachian terrains.They are detected in targeted images over the entire studyarea except in the Hesperian Syrtis Major lava flows, dust-covered terrains north of Baldet crater, and east of the Nili
Fossae where the uppermost unit is Amazonian Isidis basinfill.[47] In contrast to the consistent presence of the Fe/Mg
smectites, other hydrated minerals show considerable het-erogeneity in distribution. Kaolinite and carbonate are foundonly in the area immediately around the Nili Fossae, withcarbonate specifically restricted to the easternmost part ofthe area (Figure 2). In and around impact craters, especiallyto the west and south of Nili Fossae, different alterationminerals are observed, especially chlorite and prehnite.From crater to crater, there are distinct mineralogic assem-blages, i.e., combinations of mineral-bearing units detectedin the same geographic area. For example, a 50 km crater(20�N, 69�E) has a prehnite-chlorite-K mica assemblagewhereas two 25 km impact craters (19�N, 65�E) have asmectite-chlorite-hydrated silica-analcime assemblage,while Toro crater (17.0�N, 71.9�W) has a Fe/Mg smectite-chlorite-prehnite-silica assemblage.[48] Below, we consider in greater detail the geomorphol-
ogy of the mineral-bearing units for each alteration mineralidentified. In accordance with the distinctive mineralogicassemblages identified and their distinctive geomorphic set-
Figure 13. Stratigraphy of kaolinite- and smectite-bearing units west of Nili Fossae. CRISMHRL0000B404 (21.8�N, 72.3�E) infrared albedo map colorized with parameter maps (red, BD1900H;green, BD2200; blue, D2300) so that Fe/Mg smectite–bearing materials are magenta to blue and kaolinite-bearing materials are green. A close-up view of the contact between the cap, Fe/Mg smectite–bearingunit, and largest exposure with kaolinite is shown in a subset of HiRISE image PSP_008993_2020_RED.
E00D08 EHLMANN ET AL.: AQUEOUS ALTERATION NEAR NILI FOSSAE
16 of 33
E00D08
tings discussed below, we divide the region into provincesof alteration: Eastern, Western, and Central/North Syrtis.
5.2. Eastern Province: Nili Fossae Stratigraphy
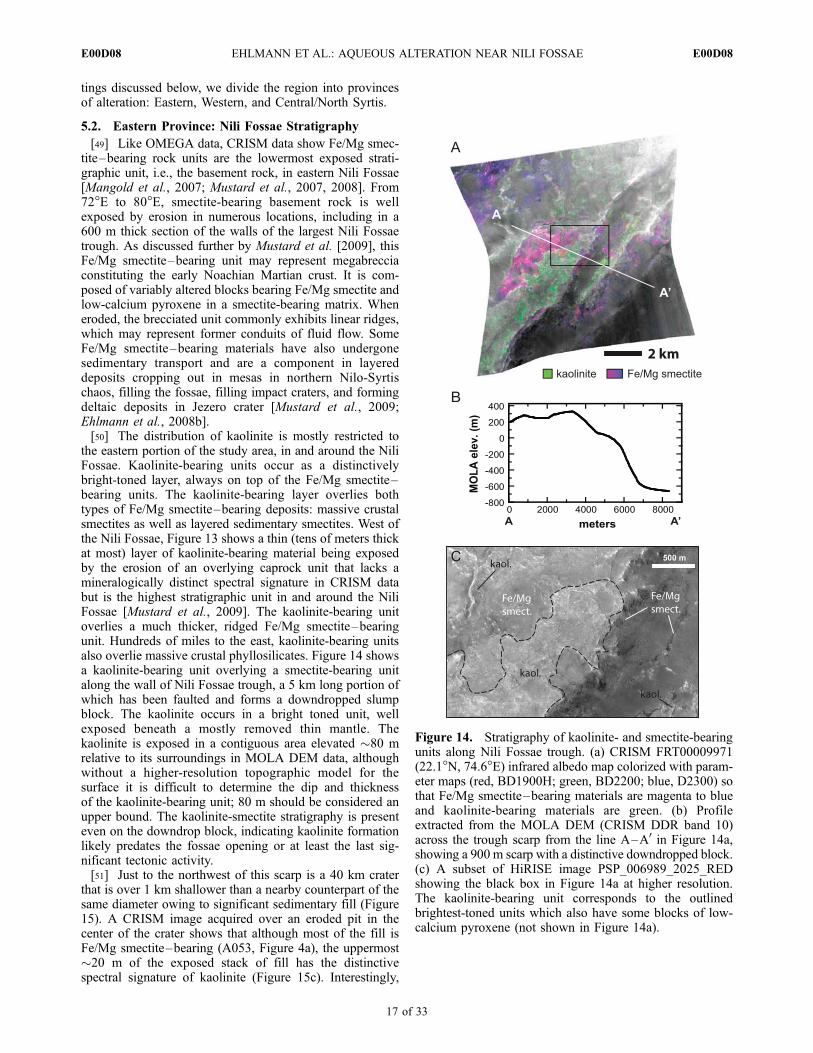
[49] Like OMEGA data, CRISM data show Fe/Mg smec-tite–bearing rock units are the lowermost exposed strati-graphic unit, i.e., the basement rock, in eastern Nili Fossae[Mangold et al., 2007; Mustard et al., 2007, 2008]. From72�E to 80�E, smectite-bearing basement rock is wellexposed by erosion in numerous locations, including in a600 m thick section of the walls of the largest Nili Fossaetrough. As discussed further by Mustard et al. [2009], thisFe/Mg smectite–bearing unit may represent megabrecciaconstituting the early Noachian Martian crust. It is com-posed of variably altered blocks bearing Fe/Mg smectite andlow-calcium pyroxene in a smectite-bearing matrix. Wheneroded, the brecciated unit commonly exhibits linear ridges,which may represent former conduits of fluid flow. SomeFe/Mg smectite–bearing materials have also undergonesedimentary transport and are a component in layereddeposits cropping out in mesas in northern Nilo-Syrtischaos, filling the fossae, filling impact craters, and formingdeltaic deposits in Jezero crater [Mustard et al., 2009;Ehlmann et al., 2008b].[50] The distribution of kaolinite is mostly restricted to
the eastern portion of the study area, in and around the NiliFossae. Kaolinite-bearing units occur as a distinctivelybright-toned layer, always on top of the Fe/Mg smectite–bearing units. The kaolinite-bearing layer overlies bothtypes of Fe/Mg smectite–bearing deposits: massive crustalsmectites as well as layered sedimentary smectites. West ofthe Nili Fossae, Figure 13 shows a thin (tens of meters thickat most) layer of kaolinite-bearing material being exposedby the erosion of an overlying caprock unit that lacks amineralogically distinct spectral signature in CRISM databut is the highest stratigraphic unit in and around the NiliFossae [Mustard et al., 2009]. The kaolinite-bearing unitoverlies a much thicker, ridged Fe/Mg smectite–bearingunit. Hundreds of miles to the east, kaolinite-bearing unitsalso overlie massive crustal phyllosilicates. Figure 14 showsa kaolinite-bearing unit overlying a smectite-bearing unitalong the wall of Nili Fossae trough, a 5 km long portion ofwhich has been faulted and forms a downdropped slumpblock. The kaolinite occurs in a bright toned unit, wellexposed beneath a mostly removed thin mantle. Thekaolinite is exposed in a contiguous area elevated �80 mrelative to its surroundings in MOLA DEM data, althoughwithout a higher-resolution topographic model for thesurface it is difficult to determine the dip and thicknessof the kaolinite-bearing unit; 80 m should be considered anupper bound. The kaolinite-smectite stratigraphy is presenteven on the downdrop block, indicating kaolinite formationlikely predates the fossae opening or at least the last sig-nificant tectonic activity.[51] Just to the northwest of this scarp is a 40 km crater
that is over 1 km shallower than a nearby counterpart of thesame diameter owing to significant sedimentary fill (Figure15). A CRISM image acquired over an eroded pit in thecenter of the crater shows that although most of the fill isFe/Mg smectite–bearing (A053, Figure 4a), the uppermost�20 m of the exposed stack of fill has the distinctivespectral signature of kaolinite (Figure 15c). Interestingly,
Figure 14. Stratigraphy of kaolinite- and smectite-bearingunits along Nili Fossae trough. (a) CRISM FRT00009971(22.1�N, 74.6�E) infrared albedo map colorized with param-eter maps (red, BD1900H; green, BD2200; blue, D2300) sothat Fe/Mg smectite–bearing materials are magenta to blueand kaolinite-bearing materials are green. (b) Profileextracted from the MOLA DEM (CRISM DDR band 10)across the trough scarp from the line A–A0 in Figure 14a,showing a 900 m scarp with a distinctive downdropped block.(c) A subset of HiRISE image PSP_006989_2025_REDshowing the black box in Figure 14a at higher resolution.The kaolinite-bearing unit corresponds to the outlinedbrightest-toned units which also have some blocks of low-calcium pyroxene (not shown in Figure 14a).
E00D08 EHLMANN ET AL.: AQUEOUS ALTERATION NEAR NILI FOSSAE
17 of 33
E00D08
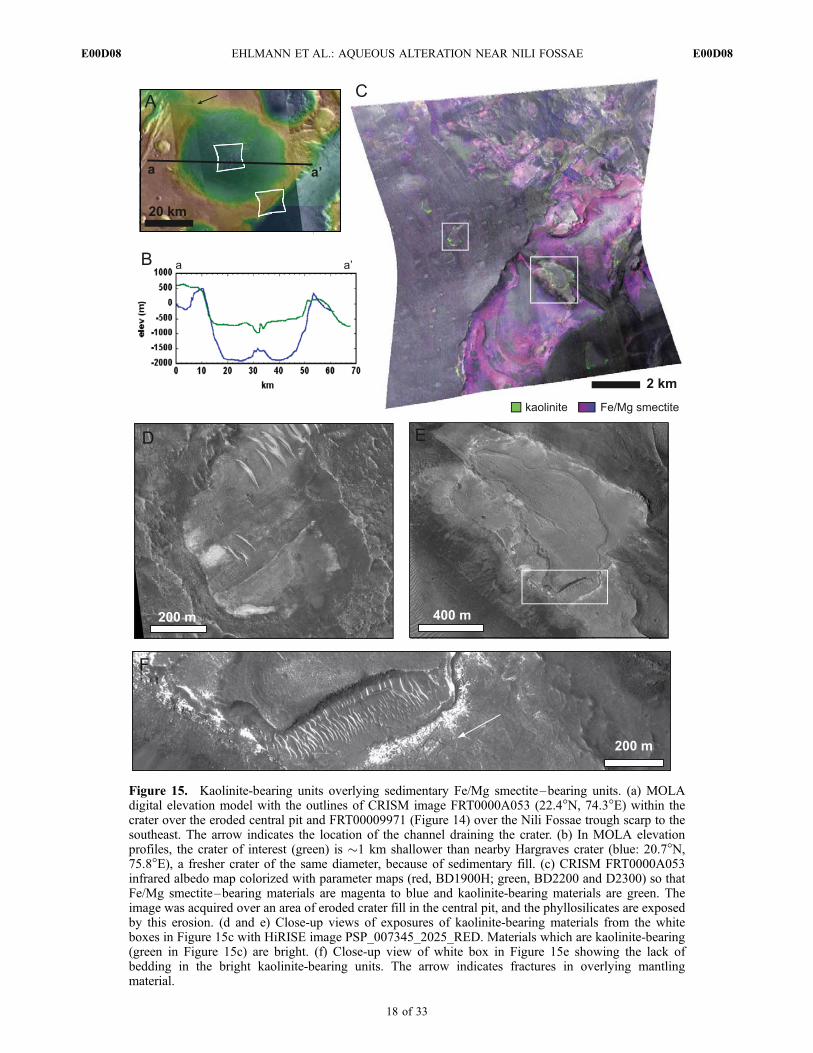
Figure 15. Kaolinite-bearing units overlying sedimentary Fe/Mg smectite–bearing units. (a) MOLAdigital elevation model with the outlines of CRISM image FRT0000A053 (22.4�N, 74.3�E) within thecrater over the eroded central pit and FRT00009971 (Figure 14) over the Nili Fossae trough scarp to thesoutheast. The arrow indicates the location of the channel draining the crater. (b) In MOLA elevationprofiles, the crater of interest (green) is �1 km shallower than nearby Hargraves crater (blue: 20.7�N,75.8�E), a fresher crater of the same diameter, because of sedimentary fill. (c) CRISM FRT0000A053infrared albedo map colorized with parameter maps (red, BD1900H; green, BD2200 and D2300) so thatFe/Mg smectite–bearing materials are magenta to blue and kaolinite-bearing materials are green. Theimage was acquired over an area of eroded crater fill in the central pit, and the phyllosilicates are exposedby this erosion. (d and e) Close-up views of exposures of kaolinite-bearing materials from the whiteboxes in Figure 15c with HiRISE image PSP_007345_2025_RED. Materials which are kaolinite-bearing(green in Figure 15c) are bright. (f) Close-up view of white box in Figure 15e showing the lack ofbedding in the bright kaolinite-bearing units. The arrow indicates fractures in overlying mantlingmaterial.
E00D08 EHLMANN ET AL.: AQUEOUS ALTERATION NEAR NILI FOSSAE
18 of 33
E00D08
as in observations of kaolinite over massive crustal Fe/Mgsmectite–bearing terrains, no bedding can be discerned inthe kaolinite-bearing unit. The kaolinite unit in some casesdoes have a fractured appearance, as in Figure 15f, wherethe fractures appear to extend into an overlying thin mantle.However, along with its stratigraphic position, the unit’smost characteristic trait is that the kaolinite-bearing materi-als are typically 5–15% brighter than surrounding materialsin both infrared albedo at 1.3 mm (IRA parameter) [Pelkeyet al., 2007] and reflectance at 0.77 mm (R770).[52] In the easternmost portion of Nili Fossae, 76�E to
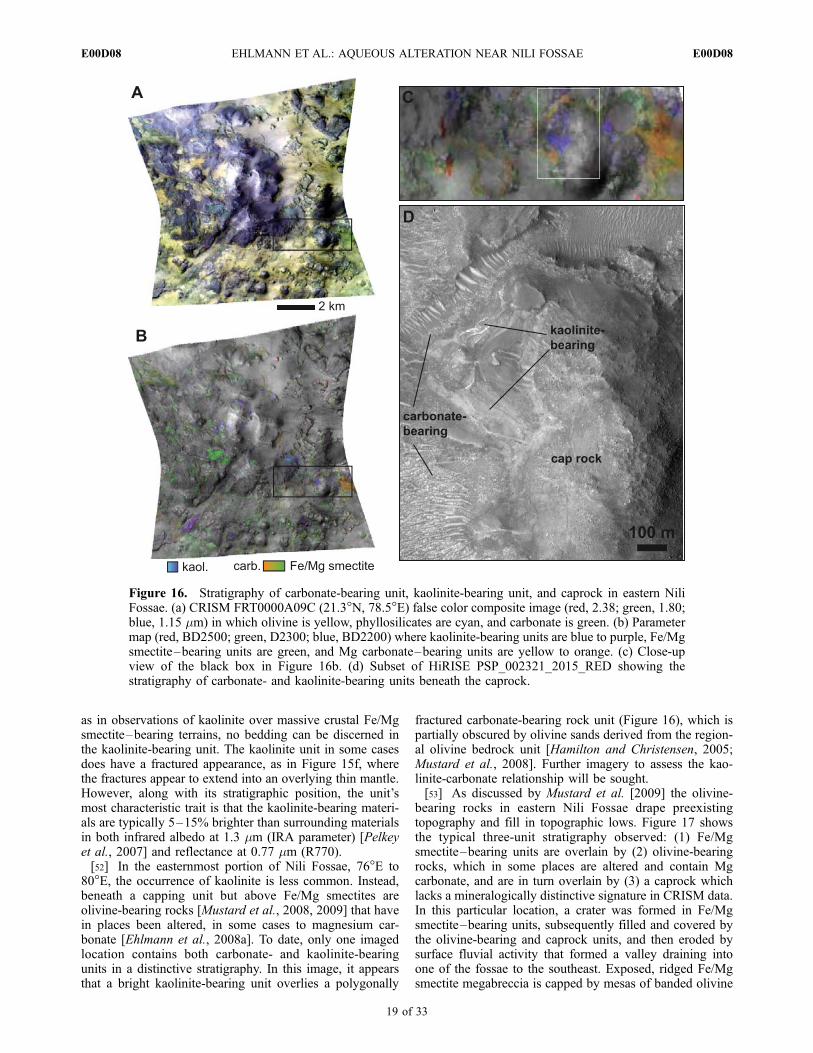
80�E, the occurrence of kaolinite is less common. Instead,beneath a capping unit but above Fe/Mg smectites areolivine-bearing rocks [Mustard et al., 2008, 2009] that havein places been altered, in some cases to magnesium car-bonate [Ehlmann et al., 2008a]. To date, only one imagedlocation contains both carbonate- and kaolinite-bearingunits in a distinctive stratigraphy. In this image, it appearsthat a bright kaolinite-bearing unit overlies a polygonally
fractured carbonate-bearing rock unit (Figure 16), which ispartially obscured by olivine sands derived from the region-al olivine bedrock unit [Hamilton and Christensen, 2005;Mustard et al., 2008]. Further imagery to assess the kao-linite-carbonate relationship will be sought.[53] As discussed by Mustard et al. [2009] the olivine-
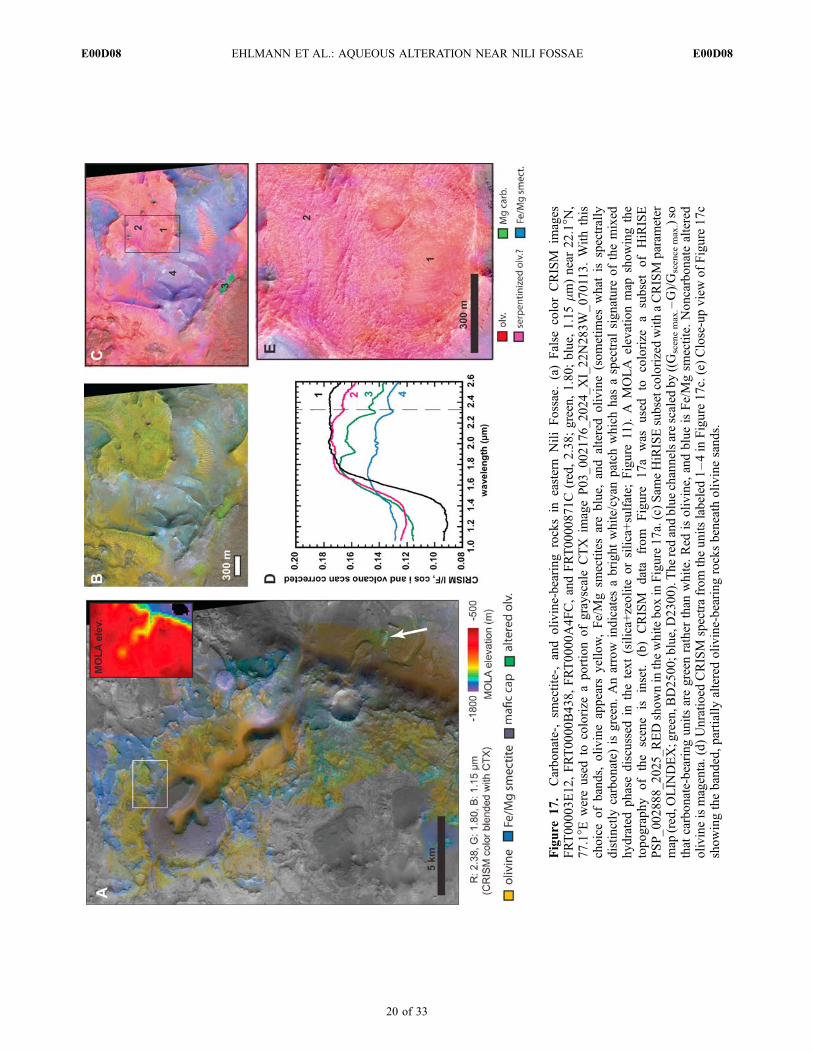
bearing rocks in eastern Nili Fossae drape preexistingtopography and fill in topographic lows. Figure 17 showsthe typical three-unit stratigraphy observed: (1) Fe/Mgsmectite–bearing units are overlain by (2) olivine-bearingrocks, which in some places are altered and contain Mgcarbonate, and are in turn overlain by (3) a caprock whichlacks a mineralogically distinctive signature in CRISM data.In this particular location, a crater was formed in Fe/Mgsmectite–bearing units, subsequently filled and covered bythe olivine-bearing and caprock units, and then eroded bysurface fluvial activity that formed a valley draining intoone of the fossae to the southeast. Exposed, ridged Fe/Mgsmectite megabreccia is capped by mesas of banded olivine
Figure 16. Stratigraphy of carbonate-bearing unit, kaolinite-bearing unit, and caprock in eastern NiliFossae. (a) CRISM FRT0000A09C (21.3�N, 78.5�E) false color composite image (red, 2.38; green, 1.80;blue, 1.15 mm) in which olivine is yellow, phyllosilicates are cyan, and carbonate is green. (b) Parametermap (red, BD2500; green, D2300; blue, BD2200) where kaolinite-bearing units are blue to purple, Fe/Mgsmectite–bearing units are green, and Mg carbonate–bearing units are yellow to orange. (c) Close-upview of the black box in Figure 16b. (d) Subset of HiRISE PSP_002321_2015_RED showing thestratigraphy of carbonate- and kaolinite-bearing units beneath the caprock.
E00D08 EHLMANN ET AL.: AQUEOUS ALTERATION NEAR NILI FOSSAE
19 of 33
E00D08
Figure
17.
Carbonate-,sm
ectite-,
andolivine-bearingrocksin
easternNiliFossae.(a)False
colorCRISM
images
FRT00003E12,FRT0000B438,FRT0000A4FC,andFRT0000871C
(red,2.38;green,1.80;blue,
1.15mm)near22.1�N
,77.1�E
wereusedto
colorize
aportionofgrayscaleCTX
imageP03_002176_2024_XI_22N283W_070113.Withthis
choiceofbands,
olivineappears
yellow,Fe/Mgsm
ectitesareblue,
andalteredolivine(sometim
eswhat
isspectrally
distinctly
carbonate)
isgreen.Anarrow
indicates
abrightwhite/cyan
patch
whichhas
aspectral
signature
ofthemixed
hydratedphasediscussed
inthetext(silica+zeolite
orsilica+sulfate;
Figure
11).A
MOLA
elevationmap
showingthe
topography
ofthe
scene
isinset.
(b)CRISM
data
from
Figure
17a
was
used
tocolorize
asubsetofHiRISE
PSP_002888_2025_REDshowninthewhiteboxinFigure17a.(c)Sam
eHiRISEsubsetcolorizedwithaCRISM
param
eter
map
(red,O
LIN
DEX;green,B
D2500;blue,D2300).Theredandbluechannelsarescaled
by((Gscenemax.–G)/Gscencemax.)so
that
carbonate-bearingunitsaregreen
rather
than
white.Red
isolivine,andblueisFe/Mgsm
ectite.Noncarbonatealtered
olivineismagenta.(d)Unratioed
CRISM
spectrafrom
theunitslabeled
1–4in
Figure
17c.(e)Close-upviewofFigure
17c
showingthebanded,partially
alteredolivine-bearingrocksbeneath
olivinesands.
E00D08 EHLMANN ET AL.: AQUEOUS ALTERATION NEAR NILI FOSSAE
20 of 33
E00D08
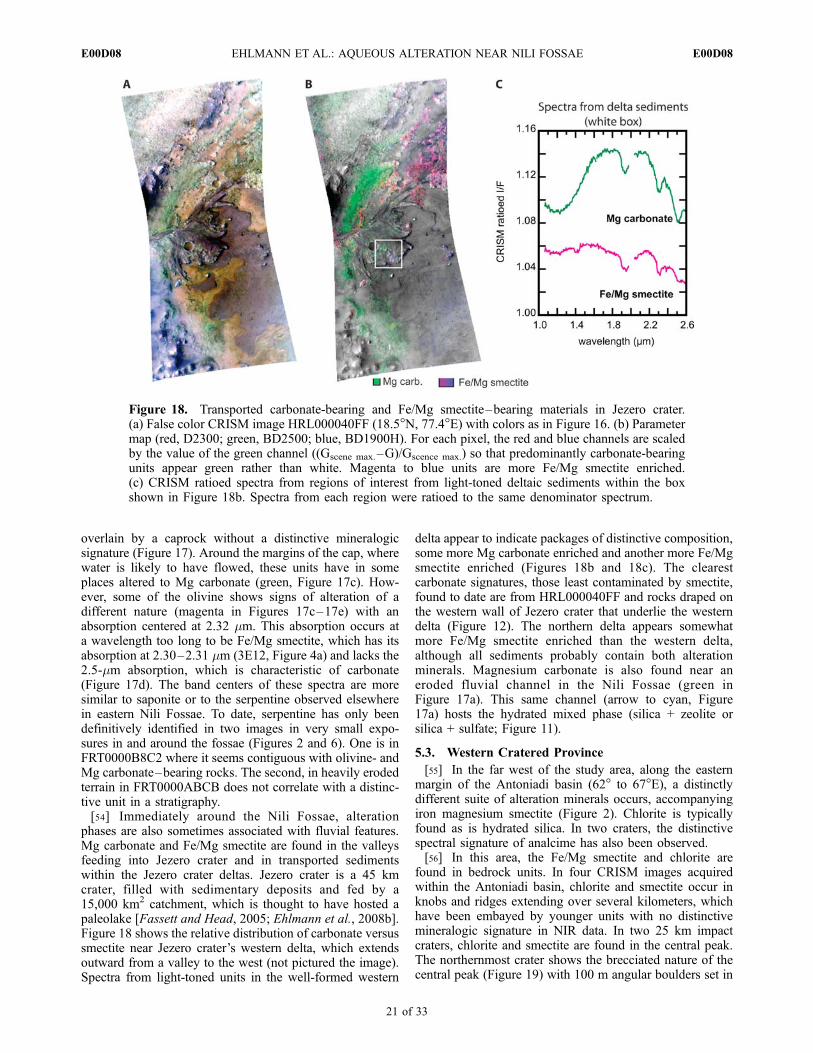
overlain by a caprock without a distinctive mineralogicsignature (Figure 17). Around the margins of the cap, wherewater is likely to have flowed, these units have in someplaces altered to Mg carbonate (green, Figure 17c). How-ever, some of the olivine shows signs of alteration of adifferent nature (magenta in Figures 17c–17e) with anabsorption centered at 2.32 mm. This absorption occurs ata wavelength too long to be Fe/Mg smectite, which has itsabsorption at 2.30–2.31 mm (3E12, Figure 4a) and lacks the2.5-mm absorption, which is characteristic of carbonate(Figure 17d). The band centers of these spectra are moresimilar to saponite or to the serpentine observed elsewherein eastern Nili Fossae. To date, serpentine has only beendefinitively identified in two images in very small expo-sures in and around the fossae (Figures 2 and 6). One is inFRT0000B8C2 where it seems contiguous with olivine- andMg carbonate–bearing rocks. The second, in heavily erodedterrain in FRT0000ABCB does not correlate with a distinc-tive unit in a stratigraphy.[54] Immediately around the Nili Fossae, alteration
phases are also sometimes associated with fluvial features.Mg carbonate and Fe/Mg smectite are found in the valleysfeeding into Jezero crater and in transported sedimentswithin the Jezero crater deltas. Jezero crater is a 45 kmcrater, filled with sedimentary deposits and fed by a15,000 km2 catchment, which is thought to have hosted apaleolake [Fassett and Head, 2005; Ehlmann et al., 2008b].Figure 18 shows the relative distribution of carbonate versussmectite near Jezero crater’s western delta, which extendsoutward from a valley to the west (not pictured the image).Spectra from light-toned units in the well-formed western
delta appear to indicate packages of distinctive composition,some more Mg carbonate enriched and another more Fe/Mgsmectite enriched (Figures 18b and 18c). The clearestcarbonate signatures, those least contaminated by smectite,found to date are from HRL000040FF and rocks draped onthe western wall of Jezero crater that underlie the westerndelta (Figure 12). The northern delta appears somewhatmore Fe/Mg smectite enriched than the western delta,although all sediments probably contain both alterationminerals. Magnesium carbonate is also found near aneroded fluvial channel in the Nili Fossae (green inFigure 17a). This same channel (arrow to cyan, Figure17a) hosts the hydrated mixed phase (silica + zeolite orsilica + sulfate; Figure 11).
5.3. Western Cratered Province
[55] In the far west of the study area, along the easternmargin of the Antoniadi basin (62� to 67�E), a distinctlydifferent suite of alteration minerals occurs, accompanyingiron magnesium smectite (Figure 2). Chlorite is typicallyfound as is hydrated silica. In two craters, the distinctivespectral signature of analcime has also been observed.[56] In this area, the Fe/Mg smectite and chlorite are
found in bedrock units. In four CRISM images acquiredwithin the Antoniadi basin, chlorite and smectite occur inknobs and ridges extending over several kilometers, whichhave been embayed by younger units with no distinctivemineralogic signature in NIR data. In two 25 km impactcraters, chlorite and smectite are found in the central peak.The northernmost crater shows the brecciated nature of thecentral peak (Figure 19) with 100 m angular boulders set in
Figure 18. Transported carbonate-bearing and Fe/Mg smectite–bearing materials in Jezero crater.(a) False color CRISM image HRL000040FF (18.5�N, 77.4�E) with colors as in Figure 16. (b) Parametermap (red, D2300; green, BD2500; blue, BD1900H). For each pixel, the red and blue channels are scaledby the value of the green channel ((Gscene max.–G)/Gscence max.) so that predominantly carbonate-bearingunits appear green rather than white. Magenta to blue units are more Fe/Mg smectite enriched.(c) CRISM ratioed spectra from regions of interest from light-toned deltaic sediments within the boxshown in Figure 18b. Spectra from each region were ratioed to the same denominator spectrum.
E00D08 EHLMANN ET AL.: AQUEOUS ALTERATION NEAR NILI FOSSAE
21 of 33
E00D08
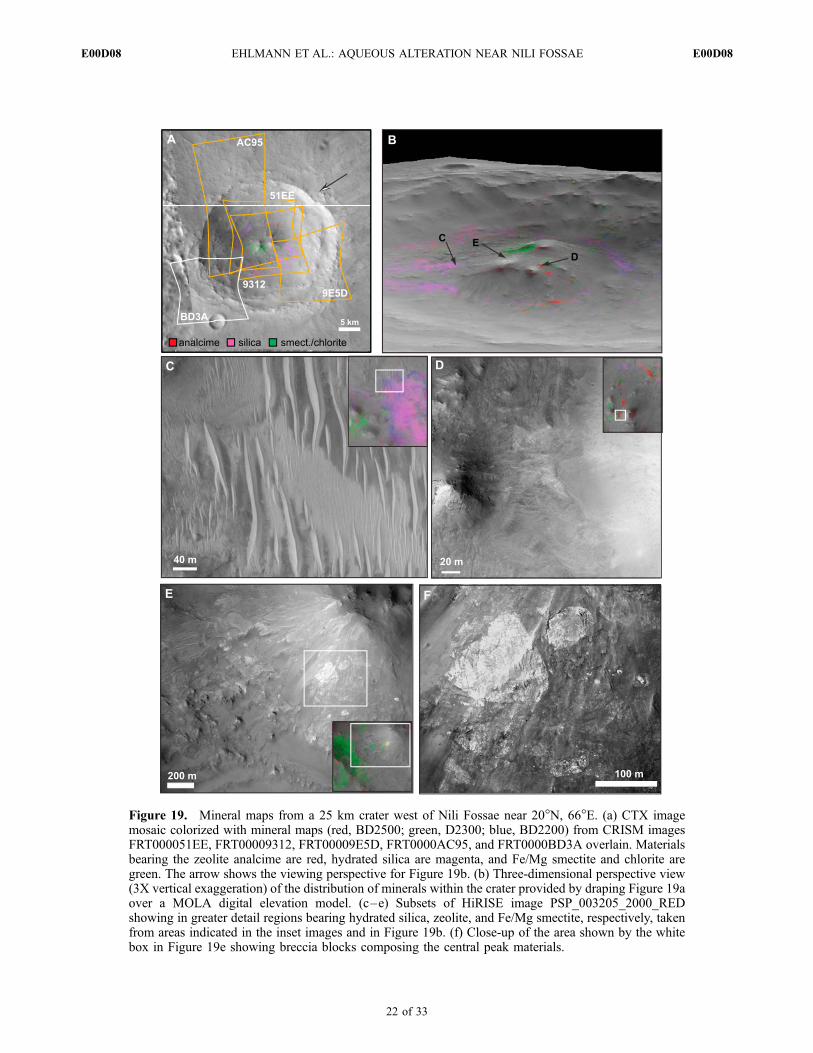
Figure 19. Mineral maps from a 25 km crater west of Nili Fossae near 20�N, 66�E. (a) CTX imagemosaic colorized with mineral maps (red, BD2500; green, D2300; blue, BD2200) from CRISM imagesFRT000051EE, FRT00009312, FRT00009E5D, FRT0000AC95, and FRT0000BD3A overlain. Materialsbearing the zeolite analcime are red, hydrated silica are magenta, and Fe/Mg smectite and chlorite aregreen. The arrow shows the viewing perspective for Figure 19b. (b) Three-dimensional perspective view(3X vertical exaggeration) of the distribution of minerals within the crater provided by draping Figure 19aover a MOLA digital elevation model. (c–e) Subsets of HiRISE image PSP_003205_2000_REDshowing in greater detail regions bearing hydrated silica, zeolite, and Fe/Mg smectite, respectively, takenfrom areas indicated in the inset images and in Figure 19b. (f) Close-up of the area shown by the whitebox in Figure 19e showing breccia blocks composing the central peak materials.
E00D08 EHLMANN ET AL.: AQUEOUS ALTERATION NEAR NILI FOSSAE
22 of 33
E00D08
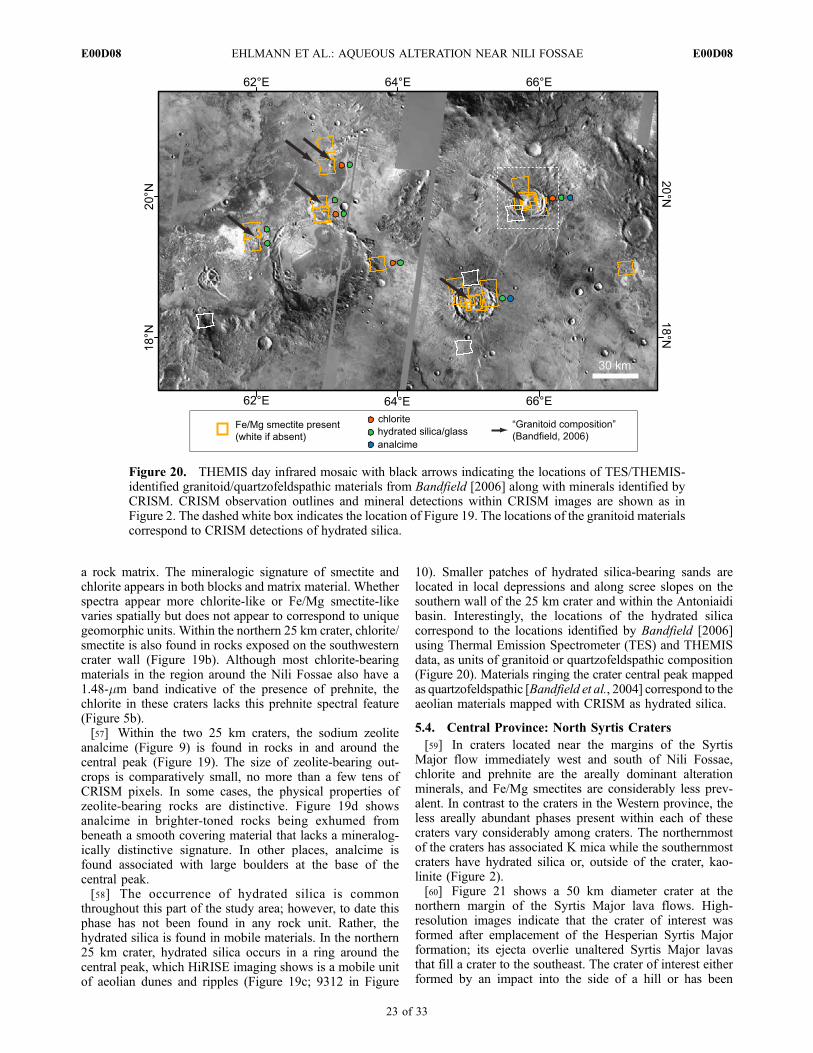
a rock matrix. The mineralogic signature of smectite andchlorite appears in both blocks and matrix material. Whetherspectra appear more chlorite-like or Fe/Mg smectite-likevaries spatially but does not appear to correspond to uniquegeomorphic units. Within the northern 25 km crater, chlorite/smectite is also found in rocks exposed on the southwesterncrater wall (Figure 19b). Although most chlorite-bearingmaterials in the region around the Nili Fossae also have a1.48-mm band indicative of the presence of prehnite, thechlorite in these craters lacks this prehnite spectral feature(Figure 5b).[57] Within the two 25 km craters, the sodium zeolite
analcime (Figure 9) is found in rocks in and around thecentral peak (Figure 19). The size of zeolite-bearing out-crops is comparatively small, no more than a few tens ofCRISM pixels. In some cases, the physical properties ofzeolite-bearing rocks are distinctive. Figure 19d showsanalcime in brighter-toned rocks being exhumed frombeneath a smooth covering material that lacks a mineralog-ically distinctive signature. In other places, analcime isfound associated with large boulders at the base of thecentral peak.[58] The occurrence of hydrated silica is common
throughout this part of the study area; however, to date thisphase has not been found in any rock unit. Rather, thehydrated silica is found in mobile materials. In the northern25 km crater, hydrated silica occurs in a ring around thecentral peak, which HiRISE imaging shows is a mobile unitof aeolian dunes and ripples (Figure 19c; 9312 in Figure
10). Smaller patches of hydrated silica-bearing sands arelocated in local depressions and along scree slopes on thesouthern wall of the 25 km crater and within the Antoniaidibasin. Interestingly, the locations of the hydrated silicacorrespond to the locations identified by Bandfield [2006]using Thermal Emission Spectrometer (TES) and THEMISdata, as units of granitoid or quartzofeldspathic composition(Figure 20). Materials ringing the crater central peak mappedas quartzofeldspathic [Bandfield et al., 2004] correspond to theaeolian materials mapped with CRISM as hydrated silica.
5.4. Central Province: North Syrtis Craters
[59] In craters located near the margins of the SyrtisMajor flow immediately west and south of Nili Fossae,chlorite and prehnite are the areally dominant alterationminerals, and Fe/Mg smectites are considerably less prev-alent. In contrast to the craters in the Western province, theless areally abundant phases present within each of thesecraters vary considerably among craters. The northernmostof the craters has associated K mica while the southernmostcraters have hydrated silica or, outside of the crater, kao-linite (Figure 2).[60] Figure 21 shows a 50 km diameter crater at the
northern margin of the Syrtis Major lava flows. High-resolution images indicate that the crater of interest wasformed after emplacement of the Hesperian Syrtis Majorformation; its ejecta overlie unaltered Syrtis Major lavasthat fill a crater to the southeast. The crater of interest eitherformed by an impact into the side of a hill or has been
Figure 20. THEMIS day infrared mosaic with black arrows indicating the locations of TES/THEMIS-identified granitoid/quartzofeldspathic materials from Bandfield [2006] along with minerals identified byCRISM. CRISM observation outlines and mineral detections within CRISM images are shown as inFigure 2. The dashed white box indicates the location of Figure 19. The locations of the granitoid materialscorrespond to CRISM detections of hydrated silica.
E00D08 EHLMANN ET AL.: AQUEOUS ALTERATION NEAR NILI FOSSAE
23 of 33
E00D08
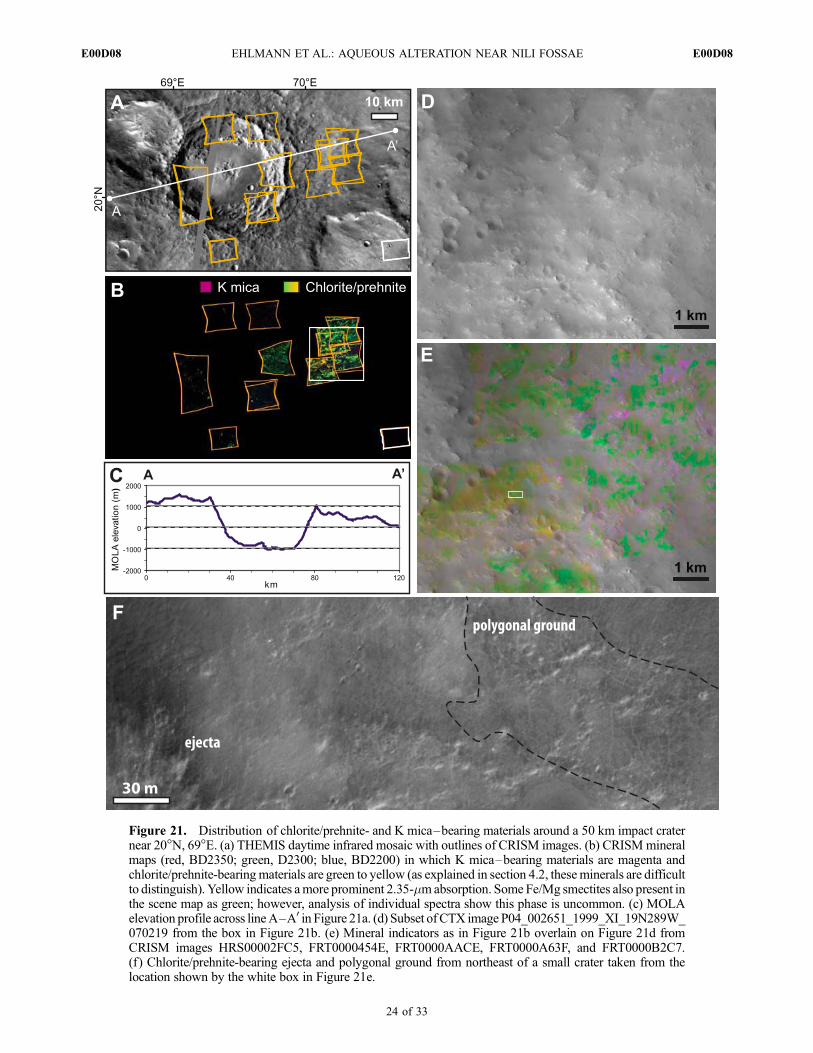
Figure 21. Distribution of chlorite/prehnite- and K mica–bearing materials around a 50 km impact craternear 20�N, 69�E. (a) THEMIS daytime infrared mosaic with outlines of CRISM images. (b) CRISMmineralmaps (red, BD2350; green, D2300; blue, BD2200) in which K mica–bearing materials are magenta andchlorite/prehnite-bearingmaterials are green to yellow (as explained in section 4.2, theseminerals are difficultto distinguish). Yellow indicates amore prominent 2.35-mmabsorption. Some Fe/Mg smectites also present inthe scene map as green; however, analysis of individual spectra show this phase is uncommon. (c) MOLAelevation profile across lineA–A0 in Figure 21a. (d) Subset of CTX image P04_002651_1999_XI_19N289W_070219 from the box in Figure 21b. (e) Mineral indicators as in Figure 21b overlain on Figure 21d fromCRISM images HRS00002FC5, FRT0000454E, FRT0000AACE, FRT0000A63F, and FRT0000B2C7.(f) Chlorite/prehnite-bearing ejecta and polygonal ground from northeast of a small crater taken from thelocation shown by the white box in Figure 21e.
E00D08 EHLMANN ET AL.: AQUEOUS ALTERATION NEAR NILI FOSSAE
24 of 33
E00D08
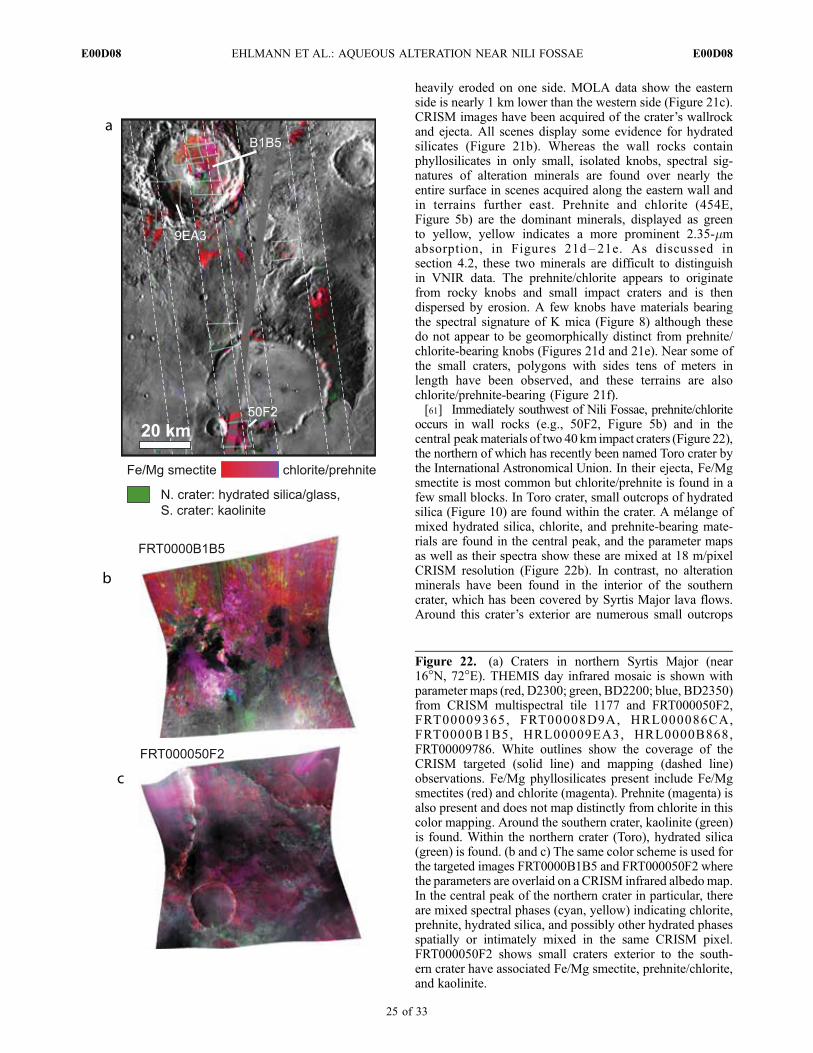
heavily eroded on one side. MOLA data show the easternside is nearly 1 km lower than the western side (Figure 21c).CRISM images have been acquired of the crater’s wallrockand ejecta. All scenes display some evidence for hydratedsilicates (Figure 21b). Whereas the wall rocks containphyllosilicates in only small, isolated knobs, spectral sig-natures of alteration minerals are found over nearly theentire surface in scenes acquired along the eastern wall andin terrains further east. Prehnite and chlorite (454E,Figure 5b) are the dominant minerals, displayed as greento yellow, yellow indicates a more prominent 2.35-mmabsorption, in Figures 21d – 21e. As discussed insection 4.2, these two minerals are difficult to distinguishin VNIR data. The prehnite/chlorite appears to originatefrom rocky knobs and small impact craters and is thendispersed by erosion. A few knobs have materials bearingthe spectral signature of K mica (Figure 8) although thesedo not appear to be geomorphically distinct from prehnite/chlorite-bearing knobs (Figures 21d and 21e). Near some ofthe small craters, polygons with sides tens of meters inlength have been observed, and these terrains are alsochlorite/prehnite-bearing (Figure 21f).[61] Immediately southwest of Nili Fossae, prehnite/chlorite
occurs in wall rocks (e.g., 50F2, Figure 5b) and in thecentral peakmaterials of two 40 km impact craters (Figure 22),the northern of which has recently been named Toro crater bythe International Astronomical Union. In their ejecta, Fe/Mgsmectite is most common but chlorite/prehnite is found in afew small blocks. In Toro crater, small outcrops of hydratedsilica (Figure 10) are found within the crater. A melange ofmixed hydrated silica, chlorite, and prehnite-bearing mate-rials are found in the central peak, and the parameter mapsas well as their spectra show these are mixed at 18 m/pixelCRISM resolution (Figure 22b). In contrast, no alterationminerals have been found in the interior of the southerncrater, which has been covered by Syrtis Major lava flows.Around this crater’s exterior are numerous small outcrops
Figure 22. (a) Craters in northern Syrtis Major (near16�N, 72�E). THEMIS day infrared mosaic is shown withparameter maps (red, D2300; green, BD2200; blue, BD2350)from CRISM multispectral tile 1177 and FRT000050F2,FRT00009365, FRT00008D9A, HRL000086CA,FRT0000B1B5, HRL00009EA3, HRL0000B868,FRT00009786. White outlines show the coverage of theCRISM targeted (solid line) and mapping (dashed line)observations. Fe/Mg phyllosilicates present include Fe/Mgsmectites (red) and chlorite (magenta). Prehnite (magenta) isalso present and does not map distinctly from chlorite in thiscolor mapping. Around the southern crater, kaolinite (green)is found. Within the northern crater (Toro), hydrated silica(green) is found. (b and c) The same color scheme is used forthe targeted images FRT0000B1B5 and FRT000050F2 wherethe parameters are overlaid on a CRISM infrared albedomap.In the central peak of the northern crater in particular, thereare mixed spectral phases (cyan, yellow) indicating chlorite,prehnite, hydrated silica, and possibly other hydrated phasesspatially or intimately mixed in the same CRISM pixel.FRT000050F2 shows small craters exterior to the south-ern crater have associated Fe/Mg smectite, prehnite/chlorite,and kaolinite.
E00D08 EHLMANN ET AL.: AQUEOUS ALTERATION NEAR NILI FOSSAE
25 of 33
E00D08
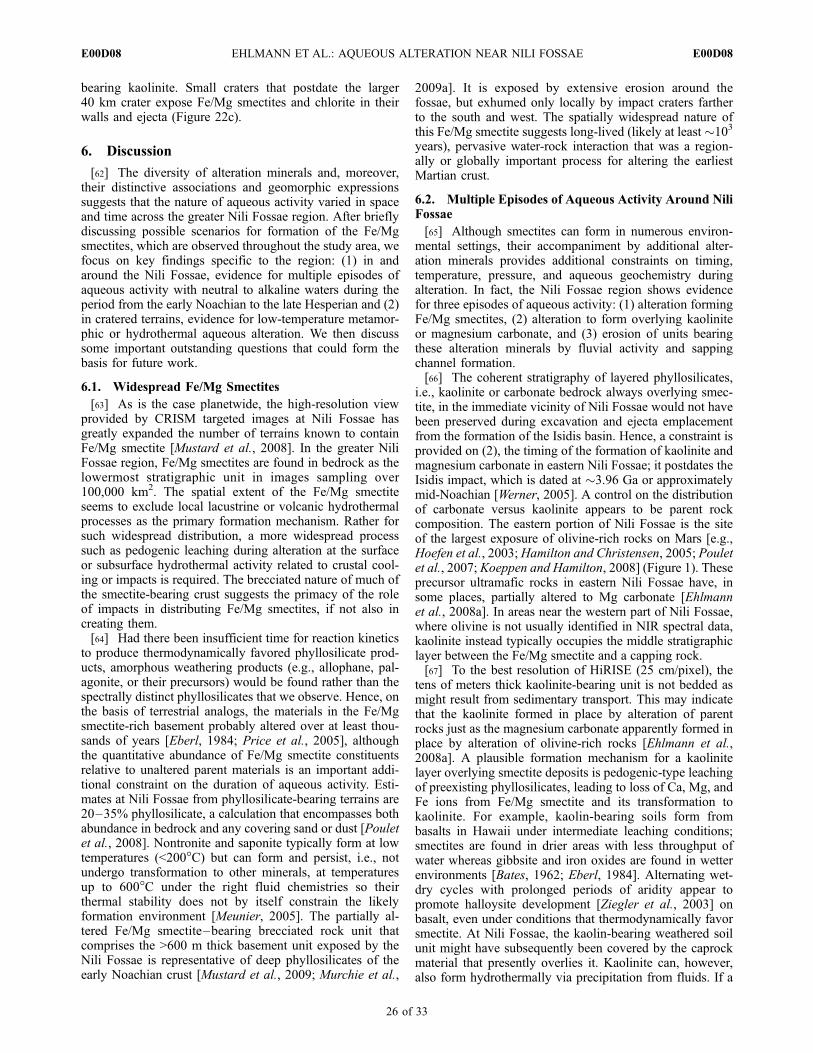
bearing kaolinite. Small craters that postdate the larger40 km crater expose Fe/Mg smectites and chlorite in theirwalls and ejecta (Figure 22c).
6. Discussion
[62] The diversity of alteration minerals and, moreover,their distinctive associations and geomorphic expressionssuggests that the nature of aqueous activity varied in spaceand time across the greater Nili Fossae region. After brieflydiscussing possible scenarios for formation of the Fe/Mgsmectites, which are observed throughout the study area, wefocus on key findings specific to the region: (1) in andaround the Nili Fossae, evidence for multiple episodes ofaqueous activity with neutral to alkaline waters during theperiod from the early Noachian to the late Hesperian and (2)in cratered terrains, evidence for low-temperature metamor-phic or hydrothermal aqueous alteration. We then discusssome important outstanding questions that could form thebasis for future work.
6.1. Widespread Fe/Mg Smectites
[63] As is the case planetwide, the high-resolution viewprovided by CRISM targeted images at Nili Fossae hasgreatly expanded the number of terrains known to containFe/Mg smectite [Mustard et al., 2008]. In the greater NiliFossae region, Fe/Mg smectites are found in bedrock as thelowermost stratigraphic unit in images sampling over100,000 km2. The spatial extent of the Fe/Mg smectiteseems to exclude local lacustrine or volcanic hydrothermalprocesses as the primary formation mechanism. Rather forsuch widespread distribution, a more widespread processsuch as pedogenic leaching during alteration at the surfaceor subsurface hydrothermal activity related to crustal cool-ing or impacts is required. The brecciated nature of much ofthe smectite-bearing crust suggests the primacy of the roleof impacts in distributing Fe/Mg smectites, if not also increating them.[64] Had there been insufficient time for reaction kinetics
to produce thermodynamically favored phyllosilicate prod-ucts, amorphous weathering products (e.g., allophane, pal-agonite, or their precursors) would be found rather than thespectrally distinct phyllosilicates that we observe. Hence, onthe basis of terrestrial analogs, the materials in the Fe/Mgsmectite-rich basement probably altered over at least thou-sands of years [Eberl, 1984; Price et al., 2005], althoughthe quantitative abundance of Fe/Mg smectite constituentsrelative to unaltered parent materials is an important addi-tional constraint on the duration of aqueous activity. Esti-mates at Nili Fossae from phyllosilicate-bearing terrains are20–35% phyllosilicate, a calculation that encompasses bothabundance in bedrock and any covering sand or dust [Pouletet al., 2008]. Nontronite and saponite typically form at lowtemperatures (<200�C) but can form and persist, i.e., notundergo transformation to other minerals, at temperaturesup to 600�C under the right fluid chemistries so theirthermal stability does not by itself constrain the likelyformation environment [Meunier, 2005]. The partially al-tered Fe/Mg smectite–bearing brecciated rock unit thatcomprises the >600 m thick basement unit exposed by theNili Fossae is representative of deep phyllosilicates of theearly Noachian crust [Mustard et al., 2009; Murchie et al.,
2009a]. It is exposed by extensive erosion around thefossae, but exhumed only locally by impact craters fartherto the south and west. The spatially widespread nature ofthis Fe/Mg smectite suggests long-lived (likely at least �103years), pervasive water-rock interaction that was a region-ally or globally important process for altering the earliestMartian crust.
6.2. Multiple Episodes of Aqueous Activity Around NiliFossae
[65] Although smectites can form in numerous environ-mental settings, their accompaniment by additional alter-ation minerals provides additional constraints on timing,temperature, pressure, and aqueous geochemistry duringalteration. In fact, the Nili Fossae region shows evidencefor three episodes of aqueous activity: (1) alteration formingFe/Mg smectites, (2) alteration to form overlying kaoliniteor magnesium carbonate, and (3) erosion of units bearingthese alteration minerals by fluvial activity and sappingchannel formation.[66] The coherent stratigraphy of layered phyllosilicates,
i.e., kaolinite or carbonate bedrock always overlying smec-tite, in the immediate vicinity of Nili Fossae would not havebeen preserved during excavation and ejecta emplacementfrom the formation of the Isidis basin. Hence, a constraint isprovided on (2), the timing of the formation of kaolinite andmagnesium carbonate in eastern Nili Fossae; it postdates theIsidis impact, which is dated at �3.96 Ga or approximatelymid-Noachian [Werner, 2005]. A control on the distributionof carbonate versus kaolinite appears to be parent rockcomposition. The eastern portion of Nili Fossae is the siteof the largest exposure of olivine-rich rocks on Mars [e.g.,Hoefen et al., 2003;Hamilton and Christensen, 2005; Pouletet al., 2007; Koeppen and Hamilton, 2008] (Figure 1). Theseprecursor ultramafic rocks in eastern Nili Fossae have, insome places, partially altered to Mg carbonate [Ehlmannet al., 2008a]. In areas near the western part of Nili Fossae,where olivine is not usually identified in NIR spectral data,kaolinite instead typically occupies the middle stratigraphiclayer between the Fe/Mg smectite and a capping rock.[67] To the best resolution of HiRISE (25 cm/pixel), the
tens of meters thick kaolinite-bearing unit is not bedded asmight result from sedimentary transport. This may indicatethat the kaolinite formed in place by alteration of parentrocks just as the magnesium carbonate apparently formed inplace by alteration of olivine-rich rocks [Ehlmann et al.,2008a]. A plausible formation mechanism for a kaolinitelayer overlying smectite deposits is pedogenic-type leachingof preexisting phyllosilicates, leading to loss of Ca, Mg, andFe ions from Fe/Mg smectite and its transformation tokaolinite. For example, kaolin-bearing soils form frombasalts in Hawaii under intermediate leaching conditions;smectites are found in drier areas with less throughput ofwater whereas gibbsite and iron oxides are found in wetterenvironments [Bates, 1962; Eberl, 1984]. Alternating wet-dry cycles with prolonged periods of aridity appear topromote halloysite development [Ziegler et al., 2003] onbasalt, even under conditions that thermodynamically favorsmectite. At Nili Fossae, the kaolin-bearing weathered soilunit might have subsequently been covered by the caprockmaterial that presently overlies it. Kaolinite can, however,also form hydrothermally via precipitation from fluids. If a
26 of 33
E00D08 EHLMANN ET AL.: AQUEOUS ALTERATION NEAR NILI FOSSAE E00D08
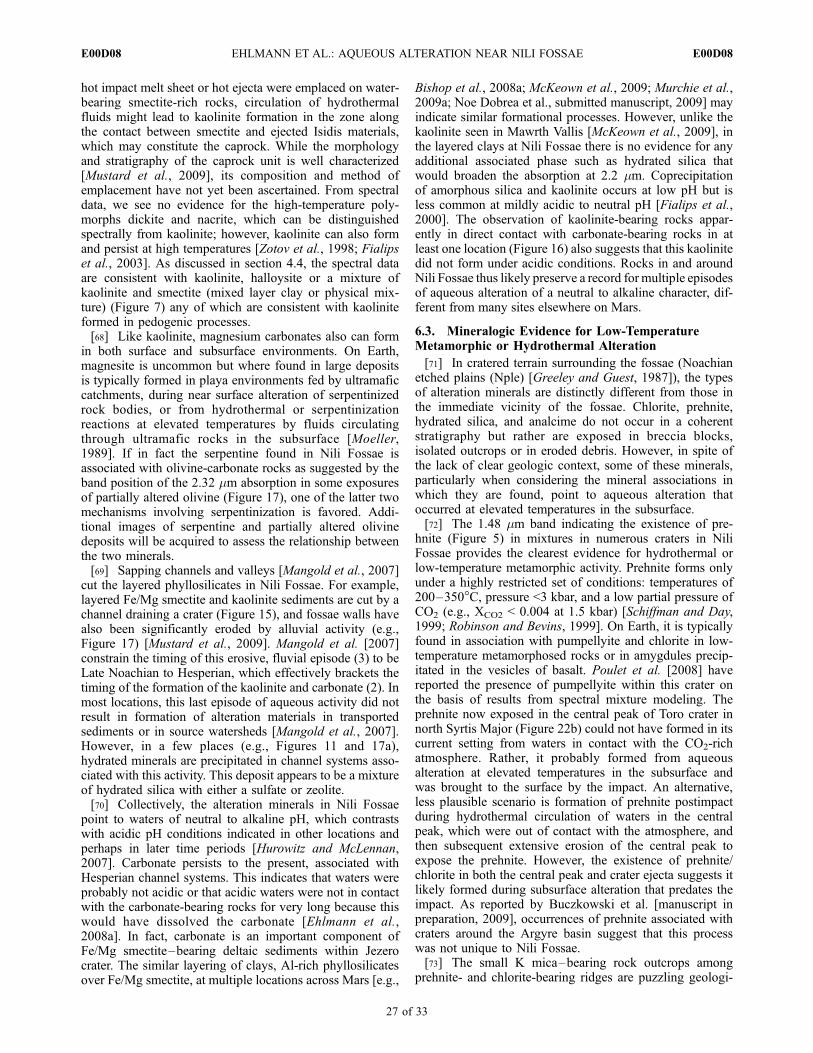
hot impact melt sheet or hot ejecta were emplaced on water-bearing smectite-rich rocks, circulation of hydrothermalfluids might lead to kaolinite formation in the zone alongthe contact between smectite and ejected Isidis materials,which may constitute the caprock. While the morphologyand stratigraphy of the caprock unit is well characterized[Mustard et al., 2009], its composition and method ofemplacement have not yet been ascertained. From spectraldata, we see no evidence for the high-temperature poly-morphs dickite and nacrite, which can be distinguishedspectrally from kaolinite; however, kaolinite can also formand persist at high temperatures [Zotov et al., 1998; Fialipset al., 2003]. As discussed in section 4.4, the spectral dataare consistent with kaolinite, halloysite or a mixture ofkaolinite and smectite (mixed layer clay or physical mix-ture) (Figure 7) any of which are consistent with kaoliniteformed in pedogenic processes.[68] Like kaolinite, magnesium carbonates also can form
in both surface and subsurface environments. On Earth,magnesite is uncommon but where found in large depositsis typically formed in playa environments fed by ultramaficcatchments, during near surface alteration of serpentinizedrock bodies, or from hydrothermal or serpentinizationreactions at elevated temperatures by fluids circulatingthrough ultramafic rocks in the subsurface [Moeller,1989]. If in fact the serpentine found in Nili Fossae isassociated with olivine-carbonate rocks as suggested by theband position of the 2.32 mm absorption in some exposuresof partially altered olivine (Figure 17), one of the latter twomechanisms involving serpentinization is favored. Addi-tional images of serpentine and partially altered olivinedeposits will be acquired to assess the relationship betweenthe two minerals.[69] Sapping channels and valleys [Mangold et al., 2007]
cut the layered phyllosilicates in Nili Fossae. For example,layered Fe/Mg smectite and kaolinite sediments are cut by achannel draining a crater (Figure 15), and fossae walls havealso been significantly eroded by alluvial activity (e.g.,Figure 17) [Mustard et al., 2009]. Mangold et al. [2007]constrain the timing of this erosive, fluvial episode (3) to beLate Noachian to Hesperian, which effectively brackets thetiming of the formation of the kaolinite and carbonate (2). Inmost locations, this last episode of aqueous activity did notresult in formation of alteration materials in transportedsediments or in source watersheds [Mangold et al., 2007].However, in a few places (e.g., Figures 11 and 17a),hydrated minerals are precipitated in channel systems asso-ciated with this activity. This deposit appears to be a mixtureof hydrated silica with either a sulfate or zeolite.[70] Collectively, the alteration minerals in Nili Fossae
point to waters of neutral to alkaline pH, which contrastswith acidic pH conditions indicated in other locations andperhaps in later time periods [Hurowitz and McLennan,2007]. Carbonate persists to the present, associated withHesperian channel systems. This indicates that waters wereprobably not acidic or that acidic waters were not in contactwith the carbonate-bearing rocks for very long because thiswould have dissolved the carbonate [Ehlmann et al.,2008a]. In fact, carbonate is an important component ofFe/Mg smectite–bearing deltaic sediments within Jezerocrater. The similar layering of clays, Al-rich phyllosilicatesover Fe/Mg smectite, at multiple locations across Mars [e.g.,
Bishop et al., 2008a; McKeown et al., 2009; Murchie et al.,2009a; Noe Dobrea et al., submitted manuscript, 2009] mayindicate similar formational processes. However, unlike thekaolinite seen in Mawrth Vallis [McKeown et al., 2009], inthe layered clays at Nili Fossae there is no evidence for anyadditional associated phase such as hydrated silica thatwould broaden the absorption at 2.2 mm. Coprecipitationof amorphous silica and kaolinite occurs at low pH but isless common at mildly acidic to neutral pH [Fialips et al.,2000]. The observation of kaolinite-bearing rocks appar-ently in direct contact with carbonate-bearing rocks in atleast one location (Figure 16) also suggests that this kaolinitedid not form under acidic conditions. Rocks in and aroundNili Fossae thus likely preserve a record for multiple episodesof aqueous alteration of a neutral to alkaline character, dif-ferent from many sites elsewhere on Mars.
6.3. Mineralogic Evidence for Low-TemperatureMetamorphic or Hydrothermal Alteration
[71] In cratered terrain surrounding the fossae (Noachianetched plains (Nple) [Greeley and Guest, 1987]), the typesof alteration minerals are distinctly different from those inthe immediate vicinity of the fossae. Chlorite, prehnite,hydrated silica, and analcime do not occur in a coherentstratigraphy but rather are exposed in breccia blocks,isolated outcrops or in eroded debris. However, in spite ofthe lack of clear geologic context, some of these minerals,particularly when considering the mineral associations inwhich they are found, point to aqueous alteration thatoccurred at elevated temperatures in the subsurface.[72] The 1.48 mm band indicating the existence of pre-
hnite (Figure 5) in mixtures in numerous craters in NiliFossae provides the clearest evidence for hydrothermal orlow-temperature metamorphic activity. Prehnite forms onlyunder a highly restricted set of conditions: temperatures of200–350�C, pressure <3 kbar, and a low partial pressure ofCO2 (e.g., XCO2 < 0.004 at 1.5 kbar) [Schiffman and Day,1999; Robinson and Bevins, 1999]. On Earth, it is typicallyfound in association with pumpellyite and chlorite in low-temperature metamorphosed rocks or in amygdules precip-itated in the vesicles of basalt. Poulet et al. [2008] havereported the presence of pumpellyite within this crater onthe basis of results from spectral mixture modeling. Theprehnite now exposed in the central peak of Toro crater innorth Syrtis Major (Figure 22b) could not have formed in itscurrent setting from waters in contact with the CO2-richatmosphere. Rather, it probably formed from aqueousalteration at elevated temperatures in the subsurface andwas brought to the surface by the impact. An alternative,less plausible scenario is formation of prehnite postimpactduring hydrothermal circulation of waters in the centralpeak, which were out of contact with the atmosphere, andthen subsequent extensive erosion of the central peak toexpose the prehnite. However, the existence of prehnite/chlorite in both the central peak and crater ejecta suggests itlikely formed during subsurface alteration that predates theimpact. As reported by Buczkowski et al. [manuscript inpreparation, 2009], occurrences of prehnite associated withcraters around the Argyre basin suggest that this processwas not unique to Nili Fossae.[73] The small K mica–bearing rock outcrops among
prehnite- and chlorite-bearing ridges are puzzling geologi-
E00D08 EHLMANN ET AL.: AQUEOUS ALTERATION NEAR NILI FOSSAE
27 of 33
E00D08
cally. Though it has been found elsewhere in the southernhighlands [Fraeman et al., 2009], so far, K mica in NiliFossae is restricted to one 50 km crater (Figures 2 and 21).It is difficult to tell whether the K mica, chlorite, andprehnite-bearing rocks constitute the ejecta of the crater orwhether the entire eastern side of the crater has been heavilyeroded and the chlorite, prehnite, and muscovite/illite sim-ply represent exposed bedrock. In either case, the easternside of the crater is some 1 km lower than the western sideso rocks from deeper in the crust are probably being sam-pled. On Earth, K micas, e.g., muscovite, can be primary ingranitic terrains. However, on Mars where basalt is domi-nant, K mica more likely results from hydrothermal activityor diagenesis. A key diagenetic process forming illite onEarth is conversion of smectite to illite upon burial, a pro-cess that is time- and depth-dependent and usually beginsat temperatures of 50–80�C [Hower, 1976]. Dioctahedralsmectites are converted first to mixed layer illite-smectitesand then to illite of various polytypes. Higher-grademetamorphic/hydrothermal activity can generate muscovite.For trioctahedral smectites, with increasing temperaturethe reaction proceeds as saponite to corrensite (intermediatechlorite-smectite) and to chlorite [Merriman and Peacor,1999]. In weakly metamorphosed rocks and sediments witha high ferromagnesian component, e.g., Fe/Mg smectites, achlorite-illite assemblage with chlorite dominating can occurand may explain the alteration minerals around the 50 kmcrater.[74] In the far west of the study area, craters have
associated analcime-bearing rocks and aeolian hydratedsilica deposits. Analcime and hydrated silica can originatein weathering reactions or from hydrothermal activity, andzeolites have been suggested as a possible constituent ofMars dust [Ruff, 2004]. In particular, the most commonenvironments for analcime are highly alkaline lake waters[Eugster, 1980], weathering of tephra [Sheppard and Hay,2001], and hydrothermal circulation < �200�C as has beenextensively studied for Icelandic basalts and Massif Centralin France [e.g., Weisenberger and Selbekk, 2008; Robertand Goffe, 1993]. No evidence for layered sediments, whichmight indicate one of the first two mechanisms, exists in thetwo 25 km craters near the Antoniadi basin. The cratershave been intensively studied in both near-infrared andthermal wavelengths to determine the composition of rocksand aeolian materials. TES deconvolution results show thecentral peak spectral unit to be enriched in quartz (total,7%), feldspar (9%), and sheet silicates/high Si glass (33%)and depleted in pyroxene (9%) relative to nearby SyrtisMajor plains materials [Bandfield et al., 2004]. CRISMdetects analcime, hydrated silica, chlorite, and Fe/Mg smec-tite. A mineral assemblage of Fe/Mg-rich smectites orchlorites with accessory zeolite, silica, quartz, and K-feld-spar results from hydrothermal alteration in terrestrial cra-ters [e.g., Allen et al., 1982; Naumov, 2005] and suggests apossible reinterpretation of the ‘‘granitoid’’ material in thework of Bandfield [2006] as hydrothermal in origin ratherthan igneous, as has been proposed for other TES-detectedhigh-silica materials near Hellas [Bandfield, 2008]. Themoderate TES-modeled abundances of quartz and K-feld-spar and their association with CRISM-detected hydratedSi-OH bearing phases (e.g., hydrated silica), phyllosilicates,and zeolites are consistent with such a formation process.
Quartz, K-spar, analcime, and amorphous silica can form asamgydules in vesicles. Upon erosion of these rocks, moreresistant silica-rich phases may be left behind as an aeolianlag, explaining the association of hydrated silica withmobile materials.[75] Variations in the temperature, water-rock ratio, and
fluid chemistry of hydrothermal systems may be respon-sible for these distinctive mineral assemblages observed incraters west of the Isidis basin. In all cases, however, fairlylow-temperature (<350�C) metamorphic and/or hydro-thermal processes are indicated by the mineral phases sofar observed.
6.4. Key Questions for Future Work
[76] The diversity of alteration minerals detected in theregion around the Nili Fossae is the highest yet observed onMars. Why is the diversity so great here? Is it simply aresult of a single event, the Isidis impact, and aqueousalteration, e.g., hydrothermal, immediately following andrelated to basin formation? The original Isidis crater hasbeen heavily modified by tectonism, erosion, and depositionto create the Isidis basin seen today, and it is not entirelyclear how far into the original impact basin the Nili Fossaeare found. The fossae likely correspond to a megaterraceformed between the inner and outer basin rings [Mustard etal., 2007]. The brecciated Fe/Mg smectites in the lowermoststratigraphic layer are the impacted materials, and olivinerich rocks at the base of an otherwise mineralogicallyindistinct cap unit are likely the product of an impact meltsheet [Mustard et al., 2009]. The minerals found in smallercraters west of the basin could, if directly related to theIsidis impact, have been generated during hydrothermalactivity within and around the outer basin ring. This isplausible given computational models of hydrothermalcooling that indicate hydrothermal systems can endure for103 years or longer with increasing duration for largerimpacts [Rathbun and Squyres, 2002; Abramov and Kring,2005]. However, the coherency over hundreds of km of thelayered stratigraphy in the eastern part of the study regionis less easily explained by impact-induced processes. More-over, the timing of at least the latest fluvial activitydefinitively postdates opening of the fossae [Mangoldet al., 2007]. These both suggest that any hydrothermalprocesses that might have been related to the Isidis impactrepresent only one of several episodes of regional aqueousactivity.[77] In terms of understanding the extent and duration of
alteration in various terrains, initial efforts [Poulet et al.,2008] to calculate modal mineralogy in phyllosilicate-bear-ing terrains should be expanded. An essential part of thiseffort will be expanding the number of well-characterizedminerals and rock samples in publicly available spectrallibraries as well as making laboratory measurements tomeasure their optical constants.[78] While the mineralogic evidence points to low-
temperature metamorphic or hydrothermal processes southand west of Nili Fossae near craters, a key question istheir timing. Did these processes predate or postdate theimpact craters with which they are associated? Understand-ing this requires high-resolution models of impact crateringprocesses. Some models predict shock temperatures nearcentral peaks would be too high for phyllosilicates or
E00D08 EHLMANN ET AL.: AQUEOUS ALTERATION NEAR NILI FOSSAE
28 of 33
E00D08
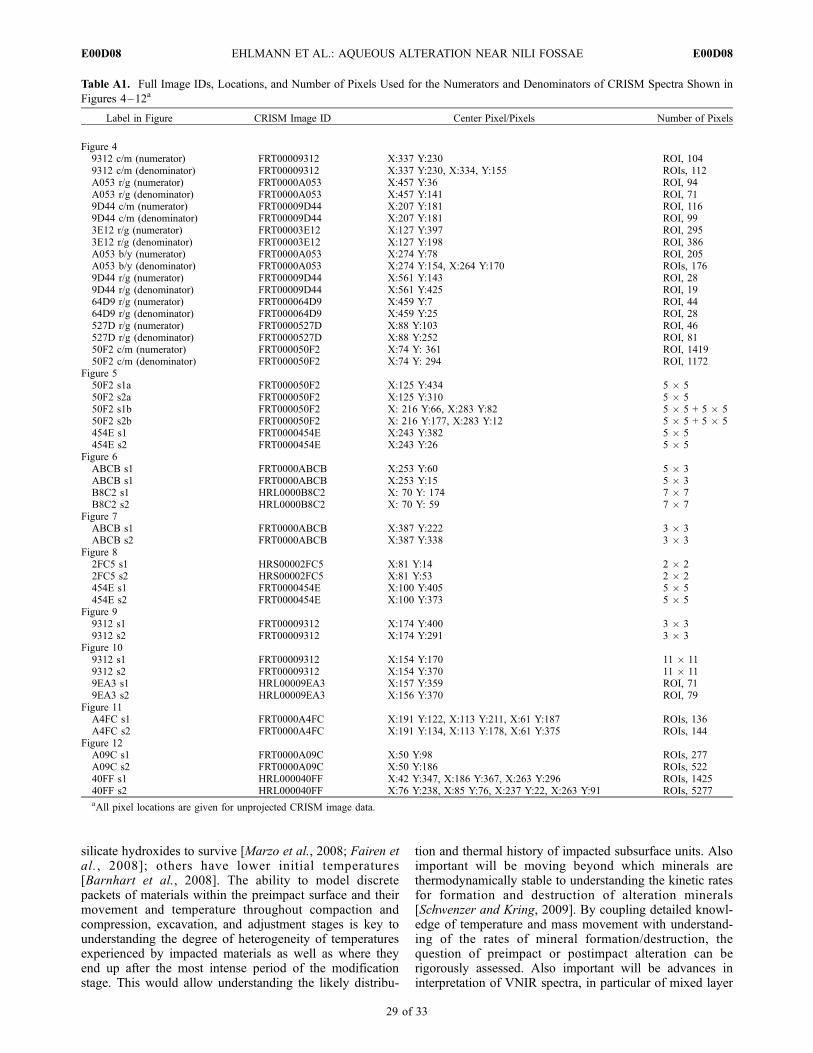
silicate hydroxides to survive [Marzo et al., 2008; Fairen etal., 2008]; others have lower initial temperatures[Barnhart et al., 2008]. The ability to model discretepackets of materials within the preimpact surface and theirmovement and temperature throughout compaction andcompression, excavation, and adjustment stages is key tounderstanding the degree of heterogeneity of temperaturesexperienced by impacted materials as well as where theyend up after the most intense period of the modificationstage. This would allow understanding the likely distribu-
tion and thermal history of impacted subsurface units. Alsoimportant will be moving beyond which minerals arethermodynamically stable to understanding the kinetic ratesfor formation and destruction of alteration minerals[Schwenzer and Kring, 2009]. By coupling detailed knowl-edge of temperature and mass movement with understand-ing of the rates of mineral formation/destruction, thequestion of preimpact or postimpact alteration can berigorously assessed. Also important will be advances ininterpretation of VNIR spectra, in particular of mixed layer
Table A1. Full Image IDs, Locations, and Number of Pixels Used for the Numerators and Denominators of CRISM Spectra Shown in
Figures 4–12a
Label in Figure CRISM Image ID Center Pixel/Pixels Number of Pixels
Figure 49312 c/m (numerator) FRT00009312 X:337 Y:230 ROI, 1049312 c/m (denominator) FRT00009312 X:337 Y:230, X:334, Y:155 ROIs, 112A053 r/g (numerator) FRT0000A053 X:457 Y:36 ROI, 94A053 r/g (denominator) FRT0000A053 X:457 Y:141 ROI, 719D44 c/m (numerator) FRT00009D44 X:207 Y:181 ROI, 1169D44 c/m (denominator) FRT00009D44 X:207 Y:181 ROI, 993E12 r/g (numerator) FRT00003E12 X:127 Y:397 ROI, 2953E12 r/g (denominator) FRT00003E12 X:127 Y:198 ROI, 386A053 b/y (numerator) FRT0000A053 X:274 Y:78 ROI, 205A053 b/y (denominator) FRT0000A053 X:274 Y:154, X:264 Y:170 ROIs, 1769D44 r/g (numerator) FRT00009D44 X:561 Y:143 ROI, 289D44 r/g (denominator) FRT00009D44 X:561 Y:425 ROI, 1964D9 r/g (numerator) FRT000064D9 X:459 Y:7 ROI, 4464D9 r/g (denominator) FRT000064D9 X:459 Y:25 ROI, 28527D r/g (numerator) FRT0000527D X:88 Y:103 ROI, 46527D r/g (denominator) FRT0000527D X:88 Y:252 ROI, 8150F2 c/m (numerator) FRT000050F2 X:74 Y: 361 ROI, 141950F2 c/m (denominator) FRT000050F2 X:74 Y: 294 ROI, 1172
Figure 550F2 s1a FRT000050F2 X:125 Y:434 5 � 550F2 s2a FRT000050F2 X:125 Y:310 5 � 550F2 s1b FRT000050F2 X: 216 Y:66, X:283 Y:82 5 � 5 + 5 � 550F2 s2b FRT000050F2 X: 216 Y:177, X:283 Y:12 5 � 5 + 5 � 5454E s1 FRT0000454E X:243 Y:382 5 � 5454E s2 FRT0000454E X:243 Y:26 5 � 5
Figure 6ABCB s1 FRT0000ABCB X:253 Y:60 5 � 3ABCB s1 FRT0000ABCB X:253 Y:15 5 � 3B8C2 s1 HRL0000B8C2 X: 70 Y: 174 7 � 7B8C2 s2 HRL0000B8C2 X: 70 Y: 59 7 � 7
Figure 7ABCB s1 FRT0000ABCB X:387 Y:222 3 � 3ABCB s2 FRT0000ABCB X:387 Y:338 3 � 3
Figure 82FC5 s1 HRS00002FC5 X:81 Y:14 2 � 22FC5 s2 HRS00002FC5 X:81 Y:53 2 � 2454E s1 FRT0000454E X:100 Y:405 5 � 5454E s2 FRT0000454E X:100 Y:373 5 � 5
Figure 99312 s1 FRT00009312 X:174 Y:400 3 � 39312 s2 FRT00009312 X:174 Y:291 3 � 3
Figure 109312 s1 FRT00009312 X:154 Y:170 11 � 119312 s2 FRT00009312 X:154 Y:370 11 � 119EA3 s1 HRL00009EA3 X:157 Y:359 ROI, 719EA3 s2 HRL00009EA3 X:156 Y:370 ROI, 79
Figure 11A4FC s1 FRT0000A4FC X:191 Y:122, X:113 Y:211, X:61 Y:187 ROIs, 136A4FC s2 FRT0000A4FC X:191 Y:134, X:113 Y:178, X:61 Y:375 ROIs, 144
Figure 12A09C s1 FRT0000A09C X:50 Y:98 ROIs, 277A09C s2 FRT0000A09C X:50 Y:186 ROIs, 52240FF s1 HRL000040FF X:42 Y:347, X:186 Y:367, X:263 Y:296 ROIs, 142540FF s2 HRL000040FF X:76 Y:238, X:85 Y:76, X:237 Y:22, X:263 Y:91 ROIs, 5277aAll pixel locations are given for unprojected CRISM image data.
E00D08 EHLMANN ET AL.: AQUEOUS ALTERATION NEAR NILI FOSSAE
29 of 33
E00D08
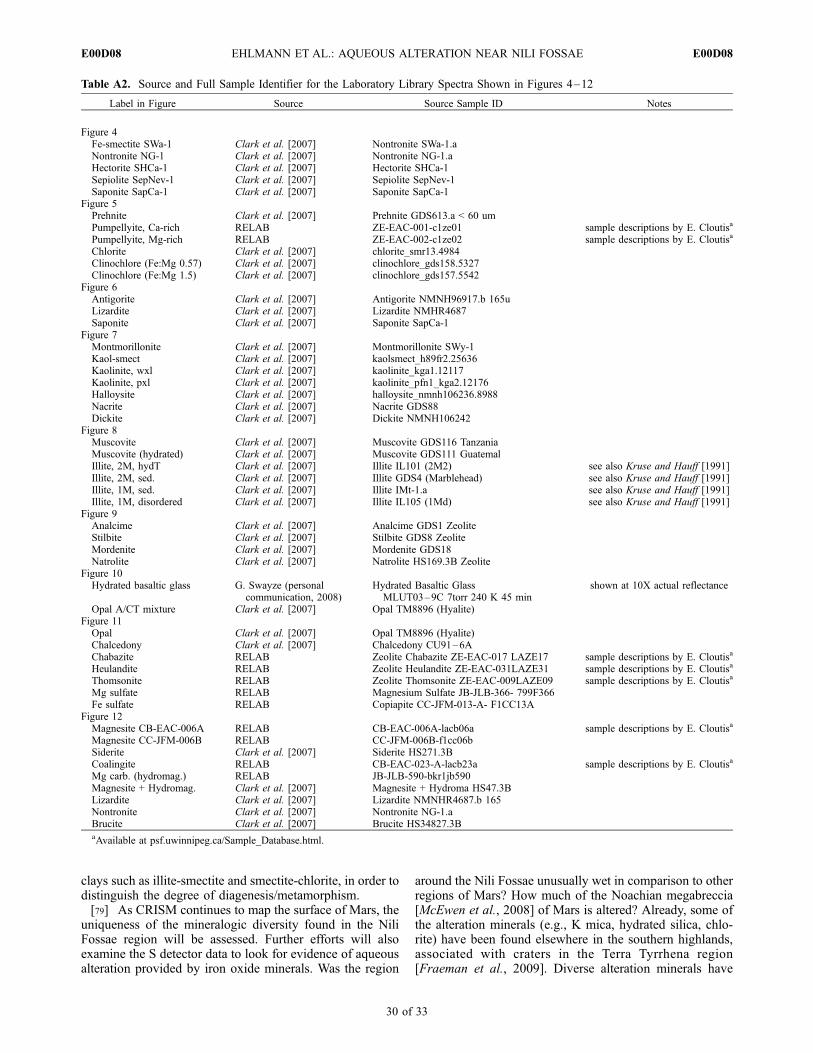
clays such as illite-smectite and smectite-chlorite, in order todistinguish the degree of diagenesis/metamorphism.[79] As CRISM continues to map the surface of Mars, the
uniqueness of the mineralogic diversity found in the NiliFossae region will be assessed. Further efforts will alsoexamine the S detector data to look for evidence of aqueousalteration provided by iron oxide minerals. Was the region
around the Nili Fossae unusually wet in comparison to otherregions of Mars? How much of the Noachian megabreccia[McEwen et al., 2008] of Mars is altered? Already, some ofthe alteration minerals (e.g., K mica, hydrated silica, chlo-rite) have been found elsewhere in the southern highlands,associated with craters in the Terra Tyrrhena region[Fraeman et al., 2009]. Diverse alteration minerals have
Table A2. Source and Full Sample Identifier for the Laboratory Library Spectra Shown in Figures 4–12
Label in Figure Source Source Sample ID Notes
Figure 4Fe-smectite SWa-1 Clark et al. [2007] Nontronite SWa-1.aNontronite NG-1 Clark et al. [2007] Nontronite NG-1.aHectorite SHCa-1 Clark et al. [2007] Hectorite SHCa-1Sepiolite SepNev-1 Clark et al. [2007] Sepiolite SepNev-1Saponite SapCa-1 Clark et al. [2007] Saponite SapCa-1
Figure 5Prehnite Clark et al. [2007] Prehnite GDS613.a < 60 umPumpellyite, Ca-rich RELAB ZE-EAC-001-c1ze01 sample descriptions by E. Cloutisa
Pumpellyite, Mg-rich RELAB ZE-EAC-002-c1ze02 sample descriptions by E. Cloutisa
Chlorite Clark et al. [2007] chlorite_smr13.4984Clinochlore (Fe:Mg 0.57) Clark et al. [2007] clinochlore_gds158.5327Clinochlore (Fe:Mg 1.5) Clark et al. [2007] clinochlore_gds157.5542
Figure 6Antigorite Clark et al. [2007] Antigorite NMNH96917.b 165uLizardite Clark et al. [2007] Lizardite NMHR4687Saponite Clark et al. [2007] Saponite SapCa-1
Figure 7Montmorillonite Clark et al. [2007] Montmorillonite SWy-1Kaol-smect Clark et al. [2007] kaolsmect_h89fr2.25636Kaolinite, wxl Clark et al. [2007] kaolinite_kga1.12117Kaolinite, pxl Clark et al. [2007] kaolinite_pfn1_kga2.12176Halloysite Clark et al. [2007] halloysite_nmnh106236.8988Nacrite Clark et al. [2007] Nacrite GDS88Dickite Clark et al. [2007] Dickite NMNH106242
Figure 8Muscovite Clark et al. [2007] Muscovite GDS116 TanzaniaMuscovite (hydrated) Clark et al. [2007] Muscovite GDS111 GuatemalIllite, 2M, hydT Clark et al. [2007] Illite IL101 (2M2) see also Kruse and Hauff [1991]Illite, 2M, sed. Clark et al. [2007] Illite GDS4 (Marblehead) see also Kruse and Hauff [1991]Illite, 1M, sed. Clark et al. [2007] Illite IMt-1.a see also Kruse and Hauff [1991]Illite, 1M, disordered Clark et al. [2007] Illite IL105 (1Md) see also Kruse and Hauff [1991]
Figure 9Analcime Clark et al. [2007] Analcime GDS1 ZeoliteStilbite Clark et al. [2007] Stilbite GDS8 ZeoliteMordenite Clark et al. [2007] Mordenite GDS18Natrolite Clark et al. [2007] Natrolite HS169.3B Zeolite
Figure 10Hydrated basaltic glass G. Swayze (personal
communication, 2008)Hydrated Basaltic Glass
MLUT03–9C 7torr 240 K 45 minshown at 10X actual reflectance
Opal A/CT mixture Clark et al. [2007] Opal TM8896 (Hyalite)Figure 11
Opal Clark et al. [2007] Opal TM8896 (Hyalite)Chalcedony Clark et al. [2007] Chalcedony CU91–6AChabazite RELAB Zeolite Chabazite ZE-EAC-017 LAZE17 sample descriptions by E. Cloutisa
Heulandite RELAB Zeolite Heulandite ZE-EAC-031LAZE31 sample descriptions by E. Cloutisa
Thomsonite RELAB Zeolite Thomsonite ZE-EAC-009LAZE09 sample descriptions by E. Cloutisa
Mg sulfate RELAB Magnesium Sulfate JB-JLB-366- 799F366Fe sulfate RELAB Copiapite CC-JFM-013-A- F1CC13A
Figure 12Magnesite CB-EAC-006A RELAB CB-EAC-006A-lacb06a sample descriptions by E. Cloutisa
Magnesite CC-JFM-006B RELAB CC-JFM-006B-f1cc06bSiderite Clark et al. [2007] Siderite HS271.3BCoalingite RELAB CB-EAC-023-A-lacb23a sample descriptions by E. Cloutisa
Mg carb. (hydromag.) RELAB JB-JLB-590-bkr1jb590Magnesite + Hydromag. Clark et al. [2007] Magnesite + Hydroma HS47.3BLizardite Clark et al. [2007] Lizardite NMNHR4687.b 165Nontronite Clark et al. [2007] Nontronite NG-1.aBrucite Clark et al. [2007] Brucite HS34827.3BaAvailable at psf.uwinnipeg.ca/Sample_Database.html.
E00D08 EHLMANN ET AL.: AQUEOUS ALTERATION NEAR NILI FOSSAE
30 of 33
E00D08
been mapped first in the well-exposed Nili Fossae region,following up on regional-scale OMEGA phyllosilicatedetections; however, with future exploration, we may findaqueous activity, including low-grade metamorphic or hy-drothermal activity, was much more widespread on ancientMars than previously known.
7. Conclusions
[80] In the Noachian terrain west of the Isidis basin,alteration minerals identified by CRISM based on distinc-tive absorptions from 1.0 to 2.6 mm include nontronite andmagnesium smectites, chlorite, prehnite, serpentine, kaolin-ite, K mica, analcime, hydrated silica, and magnesiumcarbonate. While Fe/Mg smectites are found throughoutthe study area over a much greater area than previouslyknown, the distribution of the other discovered alterationminerals is not homogeneous. Rather, these tend to occur inprovinces with distinctive assemblages of alteration miner-als and geomorphic settings.[81] Stratigraphic relationships among units bearing al-
teration minerals can be discerned in the eastern part of thestudy area, in eroded terrains in and around the Nili Fossae,where layered clays with Fe/Mg smectite, Mg carbonate,and kaolinite are found. In bedrock units, Mg carbonate andkaolinite occur above Fe/Mg smectite–bearing units. Mag-nesium carbonate is more common near the eastern NiliFossae and kaolinite is more common in the west. Thisprobably reflects the nature of the parent material, namelythe prevalence of more olivine-rich rocks in the east that canalter to magnesium carbonate.[82] In and around impact craters west and south of the
Nili Fossae, illite, analcime, and prehnite serve as mineral-ogic indicators for alteration at elevated temperatures in thesubsurface. Low-temperature metamorphism or hydrother-mal activity is most definitively indicated by prehnite wherealteration occurred out of contact with the CO2 atmosphereand at temperatures between 200 and 350�C. While Fe/Mgsmectite is still found associated with these impact craters,chlorite- and prehnite-bearing materials are much morecommon in the cratered terrains west and south of the NiliFossae and may reflect conversion of smectites to chloriteby burial and/or exposure to higher temperatures at depth.[83] Key questions for future work include constraining
whether aqueous alteration at elevated temperature predatedor postdated impact structures and more definitively con-straining the environment of carbonate and kaolinite forma-tion. Regardless, the mineralogic diversity of the regionaround the Nili Fossae indicates multiple episodes ofaqueous activity in multiple distinct environments. Aninitial phase of Fe/Mg smectite formation in the early tomid-Noachian was apparently followed by episodes ofsubsurface or surface aqueous mineralogic alteration, cul-minating finally in Hesperian fluvial reworking that led tolittle mineralogic alteration. The resultant alteration miner-als at Nili Fossae are more typical of those resulting fromneutral to alkaline conditions rather than acidic conditionsthought to have dominated other regions of Mars. Theexcellent exposure of bedrock units and the apparently longand complex history of aqueous activity in the regionaround the Nili Fossae make this part of Mars a compellingdestination for future in situ investigations.
Appendix A
[84] Using the processing steps outlined in section 3,other users of CRISM data can replicate the spectral datashown herein using information provided in this appendix.The image number, coordinates of the center point ofspectral data, and size of the region of interest are given forall CRISM spectral data shown in Figures 4–12 (Table A1).Information on the mineral samples whose library spectrawere used for identification of mineral phases on Mars isgiven in Table A2.
[85] Acknowledgments. Mario Parente and Frank Seelos providednumerous useful suggestions on data analysis for this manuscript. Thanks toLynn Carlson, Nicolas Mangold, and Nancy McKeown for helpful adviceon techniques for combining data sets to make geologic interpretations. Weappreciate the many helpful discussions with members of the CRISM teamand the ongoing, dedicated efforts of the CRISM-SOC to acquire thisspectacular data set. Reviewers Brad Dalton and Victoria Hamilton pro-vided detailed comments that improved this manuscript. We also thank theCTX and HiRISE teams for their commitment to coordinated observationswhich enable high-resolution studies of Mars mineralogy with morphology.
ReferencesAbramov, O., and D. A. Kring (2005), Impact-induced hydrothermal activ-ity on early Mars, J. Geophys. Res., 110, E12S09, doi:10.1029/2005JE002453.
Allen, C. C., J. L. Gooding, and K. Keil (1982), Hydrothermally alteredimpact melt rock and breccia: Contributions to the soil of Mars, J. Geo-phys. Res., 87, 10,083–10,101, doi:10.1029/JB087iB12p10083.
Anderson, J. H., Jr., and K. A. Wickersheim (1964), Near infrared char-acterization of water and hydroxyl groups on silica surfaces, Surf. Sci., 2,252–260, doi:10.1016/0039-6028(64)90064-0.
Arvidson, R. E., et al. (2006), Nature and origin of the hematite-bearingplains of Terra Meridiani based on analyses of orbital and Mars Explorationrover data sets, J. Geophys. Res., 111, E12S08, doi:10.1029/2006JE002728.
Bandfield, J. L. (2006), Extended surface exposures of granitoid compo-sitions in Syrtis Major, Mars, Geophys. Res. Lett., 33, L06203,doi:10.1029/2005GL025559.
Bandfield, J. L. (2008), High-silica deposits of an aqueous origin in westernHellas Basin, Mars, Geophys. Res. Lett., 35, L12205, doi:10.1029/2008GL033807.
Bandfield, J. L., V. E. Hamilton, P. R. Christensen, and H. Y. McSween Jr.(2004), Identification of quartzofeldspathic materials on Mars, J. Geo-phys. Res., 109, E10009, doi:10.1029/2004JE002290.
Barnhart, C. J., F. Nimmo, and B. J. Travis (2008), Geophysical controls onMartian post-impact hydrothermal systems, Lunar Planet. Sci., XXXIX,Abstract 2294.
Bates, T. F. (1962), Halloysite and gibbsite formation in Hawaii, Clays ClayMiner., 9, 315–328, doi:10.1346/CCMN.1960.0090119.
Bibring, J.-P., et al. (2005), Mars surface diversity as revealed by theOMEGA/Mars Express observations, Science, 307, 1576 – 1581,doi:10.1126/science.1108806.
Bibring, J.-P., et al. (2006), Global mineralogical and aqueous Mars historyderived from OMEGA/Mars Express data, Science, 312, 400 –404,doi:10.1126/science.1122659.
Bishop, J. L., C. M. Pieters, and J. O. Edwards (1994), Infrared spectro-scopic analyses on the nature of water in montmorillonite, Clays ClayMiner., 42, 702–716, doi:10.1346/CCMN.1994.0420606.
Bishop, J., J. Madejova, P. Komadel, and H. Froschl (2002a), The influenceof structural Fe, Al, and Mg on the infrared OH bands in spectra ofdioctahedral smectites, Clay Miner., 37, 607 – 616, doi:10.1180/0009855023740063.
Bishop, J. L., E. Murad, and M. D. Dyar (2002b), The influence of octahe-dral and tetrahedral cation substitution on the structure of smectites andserpentines as observed through infrared spectroscopy, Clay Miner., 37,617–628, doi:10.1180/0009855023740064.
Bishop, J. L., et al. (2008a), Phyllosilicate diversity and past aqueousactivity revealed at Mawrth Vallis, Mars, Science, 321, 830 – 833,doi:10.1126/science.1159699.
Bishop, J. L., M. D. Lane, M. D. Dyar, and A. J. Brown (2008b), Reflec-tance and emission spectroscopy of four groups of phyllosilicates: Smec-tites, kaolinite-serpentines, chlorites, and micas, Clay Miner., 43, 35–54,doi:10.1180/claymin.2008.043.1.03.
Calvin, W. M., and T. V. V. King (1997), Spectral characteristics of iron-bearing phyllosilicates: Comparison to Orgueil (CI1), Murchinson, andMurray (CM2), Meteorit. Planet. Sci., 32, 693–701.
E00D08 EHLMANN ET AL.: AQUEOUS ALTERATION NEAR NILI FOSSAE
31 of 33
E00D08
Calvin, W. M., T. V. V. King, and R. N. Clark (1994), Hydrous carbonateson Mars?: Evidence from Mariner 6/7 infrared spectrometer and ground-based telescopic spectra, J. Geophys. Res., 99, 14,659 – 14,675,doi:10.1029/94JE01090.
Chevrier, V., F. Poulet, and J.-P. Bibring (2007), Early geochemical envir-onment of Mars as determined from thermodynamics of phyllosilicates,Nature, 448, 60–63, doi:10.1038/nature05961.
Christensen, P. R., et al. (2004), The Thermal Emission Imaging System(THEMIS) for the Mars 2001 Odyssey mission, Space Sci. Rev., 110,85–130, doi:10.1023/B:SPAC.0000021008.16305.94.
Clark, R. N., and T. M. Hoefen (2000), Spectral feature mapping with MarsGlobal Surveyor Thermal Emission Spectra: Mineralogic implications,Bull. Am. Astron. Soc., 32, 1118.
Clark, R. N., T. V. V. King, M. Klejwa, G. A. Swayze, and N. Vergo(1990a), High spectral resolution reflectance spectroscopy of minerals,J. Geophys. Res., 95, 12,653–12,680, doi:10.1029/JB095iB08p12653.
Clark, R. N., G. A. Swayze, R. B. Singer, and J. B. Pollack (1990b), High-resolution reflectance spectra of Mars in the 2.3- mm region: Evidence forthe mineral scapolite, J. Geophys. Res., 95, 14,463–14,480, doi:10.1029/JB095iB09p14463.
Clark, R. N., G. A. Swayze, R. Wise, K. E. Livo, T. M. Hoefen, R. F.Kokaly, and S. J. Sutley (2007), USGS Digital Spectral Library splib06a,U.S. Geol. Surv. Data, 231.
Clark, R. N., et al. (2008), Diversity of mineralogy and occurrences ofphyllosilicates on Mars, Eos Trans. AGU, 89(53), Fall Meet. Suppl.,Abstract P43D–04.
Cloutis, E. A., P. M. Asher, and S. A. Mertzman (2002), Spectral reflec-tance properties of zeolites and remote sensing implications, J. Geophys.Res., 107(E9), 5067, doi:10.1029/2000JE001467.
Cloutis, E. A., et al. (2006), Detection and discrimination of sulfate miner-als using reflectance spectroscopy, Icarus, 184, 121–157, doi:10.1016/j.icarus.2006.04.003.
Crowley, J. K., and N. Vergo (1988), Near-infrared reflectance spectra ofmixtures of kaolin-group minerals: Use in clay mineral studies, ClaysClay Miner., 36, 310–316, doi:10.1346/CCMN.1988.0360404.
Eberl, D. D. (1984), Clay mineral formation in rocks and soils, Philos. Trans.R. Soc. London, Ser. A, 311, 241–257, doi:10.1098/rsta.1984.0026.
Ehlmann, B. L., et al. (2008a), Orbital identification of carbonate-bearingrocks on Mars, Science, 322, 1828–1832, doi:10.1126/science.1164759.
Ehlmann, B. L., et al. (2008b), Clay minerals in delta deposits and organicpreservation potential on Mars, Nat. Geosci., 1, 355–358, doi:10.1038/ngeo207.
Eugster, H. P. (1980), Geochemistry of evaporitic lacustrine deposits, Annu.Rev. Earth Planet. Sci., 8, 35 – 63, doi:10.1146/annurev.ea.08.050180.000343.
Fairen, A. G., A. F. Davila, G. A. Marzo, T. L. Roush, and C. P. McKay(2008), Post-Noachian water activity on Mars inferred from shock de-composition analysis of phyllosilicates within impact craters, paper pre-sented at Workshop on Martian Phyllosilicates, Abstract 7021, Cent.Natl. d’Etud. Spatiales, 21–23 Oct., Paris.
Fassett, C. I., and J. W. Head III (2005), Fluvial sedimentary deposits onMars: Ancient deltas in a crater lake in the Nili Fossae region, Geophys.Res. Lett., 32, L14201, doi:10.1029/2005GL023456.
Fialips, C.-I., S. Petit, A. Decarreau, and D. Beaufort (2000), Influence ofsynthesis pH on kaolinite ‘‘crystallinity’’ and surface properties, ClaysClay Miner., 48, 173–184, doi:10.1346/CCMN.2000.0480203.
Fialips, C.-I., J. Majzlan, D. Beaufort, and A. Navrotsky (2003), Newthermochemical evidence on the stability of dickite vs. kaolinite, Am.Mineral., 88, 837–845.
Fraeman, A. A., et al. (2009), Evaluating models of crustal cooling usingCRISM observations of impact craters in Terra Tyrrhena and NoachisTerra, Lunar Planet. Sci., XL, Abstract 2320.
Frey, M., and D. Robinson (Eds.) (1999), Low-Grade Metamorphism, 313pp., Blackwell Sci, Oxford, U. K.
Frost, R. L., J. T. Kloprogge, and Z. Ding (2002), Near-infrared spectro-scopic study of nontronites and ferruginous smectite, Spectrochim. ActaPart A, 1657–1668.
Gaffey, S. J. (1987), Spectral reflectance of carbonate minerals in the visibleand near infrared (0.35 –2.55 um): Anhydrous carbonate minerals,J. Geophys. Res., 92, 1429–1440, doi:10.1029/JB092iB02p01429.
Gendrin, A., et al. (2005), Sulfates inMartian layered terrains: The OMEGA/Mars Express view, Science , 307 , 1587 – 1591, doi:10.1126/science.1109087.
Giese, R. F. (1988), Kaolin minerals: Structures and stabilities, in Reviewsin Mineralogy, vol. 19, Hydrous Phyllosilicates (Exclusive of Micas),edited by S. W. Bailey, pp. 29–62, Mineral. Soc. of Am., Washington, D. C.
Goryniuk, M. C., B. A. Rivard, and B. Jones (2004), The reflectancespectra of opal-A (0.5–25 um) from the Taupo Volcanic Zone: Spectrathat may identify hydrothermal systems on planetary surfaces, Geophys.Res. Lett., 31, L24701, doi:10.1029/2004GL021481.
Grant, J. A., et al. (2008), HiRISE imaging of impact megabreccia and sub-meter aqueous strata in Holden Crater, Mars, Geology, 36, 195–198,doi:10.1130/G24340A.1.
Grauby, O., S. Petit, A. Decarreau, and A. Baronnet (1994), The nontronite-saponite series: An experimental approach, Eur. J. Mineral., 6, 99–112.
Greeley, R., and J. E. Guest (1987), Geologic map of the eastern equatorialregion of Mars, U.S. Geol. Surv. Misc. Invest. Ser. Map I-1802-B.
Hamilton, V. E., and P. R. Christensen (2005), Evidence for extensive, olivine-rich bedrock on Mars, Geology, 33, 433–436, doi:10.1130/G21258.1.
Hamilton, V. E., P. R. Christensen, H. Y. McSween Jr., and J. L. Bandfield(2003), Searching for the source regions of Martian meteorites usingMGS TES: Integrating Martian meteorites into the global distributionof igneous materials on Mars, Meteorit. Planet. Sci., 38(6), 871–885.
Hartmann, W. K., and G. Neukum (2001), Cratering chronology and theevolution of Mars, Space Sci. Rev., 96, 165 – 194, doi:10.1023/A:1011945222010.
Haskin, L. A., et al. (2005), Water alteration of rocks and soils on Mars atthe Spirit rover site in Gusev crater, Nature, 436, 66–69, doi:10.1038/nature03640.
Hay, R. L. (1986), Geologic occurrence of zeolites and some associatedminerals, Pure Appl. Chem., 58(10), 1339 – 1342, doi:10.1351/pac198658101339.
Hoefen, T. M., R. N. Clark, J. L. Bandfield, M. D. Smith, J. C. Pearl, andP. R. Christensen (2003), Discovery of olivine in the Nili Fossae region ofMars, Science, 302, 627–630, doi:10.1126/science.1089647.
Hower, J. (1976), Mechanism of burial metamorphism of argillaceous sedi-ment: 1. Mineralogical and chemical evidence,Geol. Soc. Am. Bull., 87(5),725–737, doi:10.1130/0016-7606(1976)87<725:MOBMOA>2.0.CO;2.
Hunt, G. R., and J. W. Salisbury (1971), Visible and near-infrared spectra ofminerals and rocks: II. Carbonates, Mod. Geol., 2, 23–30.
Hunt, G. R., J. W. Salisubury, and C. J. Lenhoff (1973), Visible and nearinfrared spectra of minerals and rocks: VI. Additional silicates, Mod.Geol., 4, 85–106.
Hurowitz, J. A., and S. M. McLennan (2007), A 3.5 Ga record of water-limited, acidic weathering conditions on Mars, Earth Planet. Sci. Lett.,260, 432–443, doi:10.1016/j.epsl.2007.05.043.
King, T. V. V., and R. N. Clark (1989), Spectral characteristics of chloritesand Mg-serpentines using high resolution reflectance spectroscopy,J. Geophys. Res., 94, 13,997–14,008, doi:10.1029/JB094iB10p13997.
Koeppen, W. C., and V. E. Hamilton (2008), Global distribution, composi-tion, and abundance of olivine on the surface of Mars from thermalinfrared data, J. Geophys. Res., 113 , E05001, doi:10.1029/2007JE002984.
Kruse, F. A., and P. L. Hauff (1991), Identification of illite polytype zoningin disseminated gold deposits using reflectance spectroscopy and X-raydiffraction: Potential for mapping with imaging spectrometers, IEEETrans. Geosci. Remote Sens., 29(1), 101–104, doi:10.1109/36.103298.
Lane, M. D., and P. R. Christensen (1997), Thermal emission spectroscopyof anhydrous carbonates, J. Geophys. Res., 102, 25,581 – 25,592,doi:10.1029/97JE02046.
Langer, K., and O. W. Florke (1974), Near infrared absorption spectra(4000–9000 cm-1) of opals and the role of ‘‘water’’ in these SiO2*nH2Ominerals, Fortschr. Mineral., 52, 17–51.
Line, C. M. B., A. Putnis, C. Putnis, and C. Giampaolo (1995), The dehy-dration kinetics and microtexture of analcime from two parageneses, Am.Mineral., 80, 268–279.
Lonker, S. W., and J. D. Fitzgerald (1990), Formation of coexisting 1M and2M polytypes in illite from an active hydrothermal system, Am. Mineral.,75, 1282–1289.
Luhr, J. F., and T. K. Kyser (1989), Primary igneous analcime: The Colimaminettes, Am. Mineral., 74, 216–223.
Malin, M. C., et al. (2007), Context Camera Investigation on board theMars Reconnaissance Orbiter, J. Geophys. Res., 112, E05S04,doi:10.1029/2006JE002808.
Mangold, N., et al. (2007), Mineralogy of the Nili Fossae region withOMEGA/Mars Express data: 2. Aqueous alteration of the crust, J. Geo-phys. Res., 112, E08S04, doi:10.1029/2006JE002835.
Marzo, G. A., et al. (2008), Evidence for relatively recent hydrothermalactivity due to an impact within the Syrtis Major, Eos Trans. AGU,89(53), Fall Meet. Suppl., Abstract P53A–1438.
McEwen, A. S., et al. (2007), Mars Reconnaissance Orbiter’s High Resolu-tion Imaging Science Experiment (HiRISE), J. Geophys. Res., 112,E05S02, doi:10.1029/2005JE002605.
McEwen, A. S., L. Tornabene, J. Grant, J. Wray, and J. Mustard (2008),Noachian megabreccia on Mars, AGU, 89(53), Fall Meet. Suppl.,Abstract P43D–03.
McKeown, N. K., et al. (2009), Characterization of phyllosilicates observedin the central Mawrth Vallis region, Mars, their potential formationalprocesses, and implications for past climate, J. Geophys. Res.,doi:10.1029/2008JE003301, in press.
E00D08 EHLMANN ET AL.: AQUEOUS ALTERATION NEAR NILI FOSSAE
32 of 33
E00D08
Merriman, R. J., and D. R. Peacor (1999), Very low-grade metapelites:Mineralogy, microfabrics, and measuring reaction progress, in Low-Grade Metamorphism, edited by M. Frey and D. Robinson, pp. 10–60, Blackwell Sci., Oxford, U. K.
Meunier, A. (2005), Clays, 472 pp., Springer, Berlin.Milliken, R. E., and J. F. Mustard (2005), Quantifying absolute water con-tent of minerals using near-infrared reflectance spectroscopy, J. Geophys.Res., 110, E12001, doi:10.1029/2005JE002534.
Milliken, R. E., et al. (2008), Opaline silica in young deposits on Mars,Geology, 36, 847–850, doi:10.1130/G24967A.1.
Moeller, P. (Ed.) (1989), Magnesite: Geology, Mineralogy, Geochemistry,Formation of Mg-Carbonates, Monogr. Ser. Miner. Deposits, vol. 28,300 pp., Gebruder Borntraeger, Berlin.
Murchie, S. L., et al. (2007a), Compact Reconnaissance Imaging Spectro-meter for Mars (CRISM) on Mars Reconnaissance Orbiter (MRO),J. Geophys. Res., 112, E05S03, doi:10.1029/2006JE002682.
Murchie, S., E. Guinness, and S. Slavney (2007b), CRISM data productsoftware interface specification, ftp://pds-geosciences.wustl.edu/mro-crism/mro-m-crism-2-edr-v1/mrocr_0001/document/crism_dpsis.pdf,NASA Planet. Data Syst., Greenbelt, Md., 17 Aug.
Murchie, S. L., et al. (2009a), A synthesis of Martian aqueous mineralogyafter one Mars year of observations from the Mars Reconnaissance Or-
biter, J. Geophys. Res., 114, E00D06, doi:10.1029/2009JE003342.Murchie, S. L., et al. (2009b), Compact Reconnaissance Imaging Spectrom-eter investigation and data set from the Mars Reconnaissance Orbiter’s
primary science phase, J. Geophys. Res., 114, E00D07, doi:10.1029/2009JE003344.
Murray, H. H. (1988), Kaolin minerals: Structures and stabilities, in Reviewsin Mineralogy, vol. 19, Hydrous Phyllosilicates (Exclusive of Micas),edited byS.W.Bailey, pp. 67–87,Mineral. Soc. ofAm.,Washington,D.C.
Mustard, J. F., et al. (2005), Olivine and pyroxene diversity in the crust ofMars, Science, 307, 1594–1597, doi:10.1126/science.1109098.
Mustard, J. F., et al. (2007), Mineralogy of the Nili Fossae region withOMEGA/Mars Express data: 1. Ancient impact melt in the Isidis basinand implications for the transition from the Noachian to Hesperian,J. Geophys. Res., 112, E08S03, doi:10.1029/2006JE002834.
Mustard, J. F., et al. (2008), Hydrated silicate minerals on Mars observed bythe CRISM instrument on MRO, Nature, 454, 305–309, doi:10.1038/nature07097.
Mustard, J. F., et al. (2009), Composition, Morphology, and Stratigraphyof Noachian Crust around the Isidis basin, J. Geophys. Res., doi:10.1029/2009JE003349, in press.
Naumov, M. V. (2005), Principal features of impact-generated hydrothermalcirculation systems: Mineralogical and geochemical evidence, Geofluids,5(3), 165–184, doi:10.1111/j.1468-8123.2005.00092.x.
Nelson, M. J., H. E. Newsom, and D. S. Draper (2005), Incipient hydro-thermal alteration of basalts and the origin of Martian soil, Geochim.Cosmochim. Acta, 69, 2701–2711, doi:10.1016/j.gca.2005.01.020.
Newsom, H. E. (1980), Hydrothermal alteration of impact melt sheets withimplications for Mars, Icarus, 44, 207–216, doi:10.1016/0019-1035(80)90066-4.
Parente, M. (2008), A new approach to denoising CRISM images, LunarPlanet. Sci., XXXIX, Abstract 2528.
Parmentier, E. M., J. F. Mustard, B. L. Ehlmann, and L. H. Roach (2008),Deep hydrothermal circulation and implications for the early crustal com-positional and thermal evolution of Mars, Lunar Planet. Sci., XXXIX,Abstract 1544.
Pelkey, S. M., et al. (2007), CRISM multispectral summary products: Para-meterizing mineral diversity on Mars from reflectance, J. Geophys. Res.,112, E08S14, doi:10.1029/2006JE002831.
Petit, S. J., A. Decarreau, and F. Martin (1999), Characterization of octahe-dral substitutions in kaolinites using near infrared spectroscopy, ClaysClay Miner., 47, 103–108, doi:10.1346/CCMN.1999.0470111.
Post, J. L., and L. Borer (2000), High-resolution infrared spectra, physicalproperties, and micromorphology of serpentines, Appl. Clay Sci., 16,73–85, doi:10.1016/S0169-1317(99)00047-2.
Post, J. L., and C. C. Plummer (1972), The chlorite series of FlagstaffHill area, California: A preliminary investigation, Clays Clay Miner.,20, 271–283, doi:10.1346/CCMN.1972.0200504.
Poulet, F., et al. (2005), Phyllosilicates on Mars and implications for earlyMartian climate, Nature, 438, 623–627, doi:10.1038/nature04274.
Poulet, F., et al. (2007), Martian surface mineralogy from Observatoire pourla Mineralogie, l’Eau, les Glaces et l’Activite on board the Mars Expressspacecraft (OMEGA/MEx): Global mineral maps, J. Geophys. Res., 112,E08S02, doi:10.1029/2006JE002840.
Poulet, F., et al. (2008), Abundance of minerals in the phyllosilicate-richunits on Mars, Astron. Astrophys., 487, L41–L44, doi:10.1051/0004-6361:200810150.
Price, J. R., et al. (2005), Rates and time scales of clay-mineral formationby weathering in saprolitic regoliths of the southern Appalachians from
geochemical mass balance, Geol. Soc. Am. Bull., 117(5–6), 783–794,doi:10.1130/B25547.1.
Rathbun, J. A., and S. W. Squyres (2002), Hydrothermal systems associatedwith Martian impact craters, Icarus, 157, 362 – 372, doi:10.1006/icar.2002.6838.
Robert, C., and B. Goffe (1993), Zeolitisation of basalts in subaqueous fresh-water settings: Field observations and experimental studies, Geochim.Cosmochim. Acta, 57, 3597–3612, doi:10.1016/0016-7037(93)90142-J.
Robinson, D., and R. E. Bevins (1999), Patterns of regional low-grademetamorphism in metabasites, in Low-Grade Metamorphism, edited byM. Frey and D. Robinson, pp. 143–168, Blackwell Sci., Oxford, U. K.
Rosenberg, P. E. (2002), The nature, formation, and stability of end-member illite: A hypothesis, Am. Mineral., 87, 103–107.
Ruff, S. W. (2004), Spectral evidence for zeolite in the dust on Mars,Icarus, 168, 131–143, doi:10.1016/j.icarus.2003.11.003.
Schiffman, P., and H. W. Day (1999), Petrological methods for the study ofvery low grade metabasites, in Low-Grade Metamorphism, edited by M.Frey and D. Robinson, pp. 108–142, Blackwell Sci., Oxford, U. K.
Schwenzer, S. P., and D. A. Kring (2009), Impact-generated hydrothermalalteration on Mars: Clay minerals, oxides, zeolites, and more, LunarPlanet. Sci., XL, Abstract 1421.
Sheppard, R. A., and R. L. Hay (2001), Formation of zeolites in openhydrologic systems, in Natural Zeolites: Occurrence, Properties, Appli-cations, edited by D. L. Bish and D. W. Ming, pp. 261–275, Mineral.Soc. of Am., Washington, D. C.
Squyres, S. W., et al. (2004), In-situ evidence for an ancient aqueous en-vironment at Meridiani Planum, Science, 306, 1709–1714, doi:10.1126/science.1104559.
Stolper, E. (1982), Water in silicate glasses: An infrared spectroscopicstudy, Contrib. Mineral. Petrol., 81, 1–17, doi:10.1007/BF00371154.
Swayze, G. A., et al. (2002), Mineral mapping Mauna Kea and Mauna Loashield volcanoes on Hawaii using AVIRIS data and the USGS Tetracor-der spectral identification system: Lessons applicable to the search forrelict Martian hydrothermal systems, JPL Publ., 03–4, 373–387.
Swayze, G. A., R. N. Clark, A. F. H. Goetz, T. G. Chrien, and N. S.Gorelick (2003), Effects of spectrometer band pass, sampling, and sig-nal-to-noise ratio on spectral identification using the Tetracorder algo-rithm, J. Geophys. Res., 108(E9), 5105, doi:10.1029/2002JE001975.
Swayze, G. A., et al. (2007), Spectral evidence for hydrated volcanic and/orimpact glass on Mars with MRO CRISM, in Seventh InternationalConference on Mars, July 9 – 13, 2007, Pasadena CA [CD-ROM],LPI Contrib., 1353, Abstract 1353.
Tornabene, L. L., J. E.Moersch, H. Y.McSween Jr., V. E. Hamilton, J. L. Piatek,and P. R. Christensen (2008), Surface and crater-exposed lithologic units ofthe Isidis basin as mapped by co-analysis of THEMIS and TES derived dataproducts, J. Geophys. Res., 113, E10001, doi:10.1029/2007JE002988.
Werner, S. C. (2005), Major aspects of the chronostratigraphy and geologicevolutionary history of Mars, Ph.D. thesis, Free Univ. of Berlin, Berlin.
Wichman, R. W., and P. H. Schultz (1989), Sequence and mechanisms ofdeformation around the Hellas and Isidis impact basins on Mars, J. Geo-phys. Res., 94, 17,333–17,357, doi:10.1029/JB094iB12p17333.
Weisenberger, T., and R. S. Selbekk (2008), Multi-stage zeolite faciesmineralization in the Hvalfjordur area, Iceland, Int. J. Earth Sci., 98,985–999, doi:10.1007/s00531-007-0296-6.
Wray, J. J., B. L. Ehlmann, S. W. Squyres, J. F. Mustard, and R. L. Kirk(2008), Compositional stratigraphy of clay-bearing layered deposits atMawrth Vallis, Mars, Geophys. Res. Lett., 35, L12202, doi:10.1029/2008GL034385.
Ziegler, K., et al. (2003), Halloysite as a kinetically controlled end productof arid-zone basalt weathering, Chem. Geol., 202, 461–478, doi:10.1016/j.chemgeo.2002.06.001.
Zotov, A., et al. (1998), An experimental study of kaolinite and dickiterelative stability at 150–300 degrees C and the thermodynamic propertiesof dickite, Am. Mineral., 83, 516–524.
�����������������������O. Barnouin-Jha and S. L. Murchie, Johns Hopkins University Applied
Physics Laboratory, Laurel, MD 20723, USA.J. L. Bishop and D. J. Des Marais, NASA Ames Research Center,
Mountain View, CA 94035, USA.R. N. Clark and G. A. Swayze, U.S. Geological Survey, Box 25046,
Denver, CO 80225, USA.B. L. Ehlmann, J. F. Mustard, and L. H. Roach, Department of
Geological Sciences, Brown University, Providence, RI 02912, USA.R. E. Milliken, Jet Propulsion Laboratory, California Institute of
Technology, Pasadena, CA 91109, USA.F. Poulet, Institut d’Astrophysique Spatiale, Universite Paris Sud, CNRS,
F-91405 Orsay, France.J. J. Wray, Department of Astronomy, Cornell University, Ithaca, NY
14853, USA.
E00D08 EHLMANN ET AL.: AQUEOUS ALTERATION NEAR NILI FOSSAE
33 of 33
E00D08


![NOx Binding in Hydrated Cementitious Phases NSF EEC …...based on the methods proposed by Balonis et al [13]. Calcium silicate hydrates were synthesized in lab from 5 grams of tricalcium](https://static.fdocuments.in/doc/165x107/60cc14905e9aee43d03d28b5/nox-binding-in-hydrated-cementitious-phases-nsf-eec-based-on-the-methods-proposed.jpg)


![O Hybrids membranes with potential for fuel cells – Part 3 ... · others thermoplastics at low temperatures[6]. Meanwhile the sepiolite is a natural hydrated magnesium silicate](https://static.fdocuments.in/doc/165x107/5ec1f89c85e4133ee76087b0/o-hybrids-membranes-with-potential-for-fuel-cells-a-part-3-others-thermoplastics.jpg)