Identification of Genetic Regions of Importance for ... · 1 Identification of Genetic Regions of...
38
1 Identification of Genetic Regions of Importance for Reproductive Performance in Female Mice Maria Liljander* 1 , Mary-Ann Sällström*, Sara Andersson*, Patrik Wernhoff § , Åsa Andersson**, Rikard Holmdahl § and Ragnar Mattsson* *Lund Transgenic Core Facility, BMC C13, Lund University, SE-221 84 Lund, Sweden. **The Danish University of Pharmaceutical Sciences, Dept. of Pharmacology, Copenhagen, Denmark. § Section For Medical Inflammation Research, Lund University, Lund, Sweden. Genetics: Published Articles Ahead of Print, published on March 17, 2006 as 10.1534/genetics.105.054049
Transcript of Identification of Genetic Regions of Importance for ... · 1 Identification of Genetic Regions of...

1
Identification of Genetic Regions of Importance for
Reproductive Performance in Female Mice
Maria Liljander*1, Mary-Ann Sällström*, Sara Andersson*, Patrik Wernhoff§, Åsa Andersson**,
Rikard Holmdahl§ and Ragnar Mattsson*
*Lund Transgenic Core Facility, BMC C13, Lund University, SE-221 84 Lund, Sweden.
**The Danish University of Pharmaceutical Sciences, Dept. of Pharmacology, Copenhagen,
Denmark.
§Section For Medical Inflammation Research, Lund University, Lund, Sweden.
Genetics: Published Articles Ahead of Print, published on March 17, 2006 as 10.1534/genetics.105.054049
2
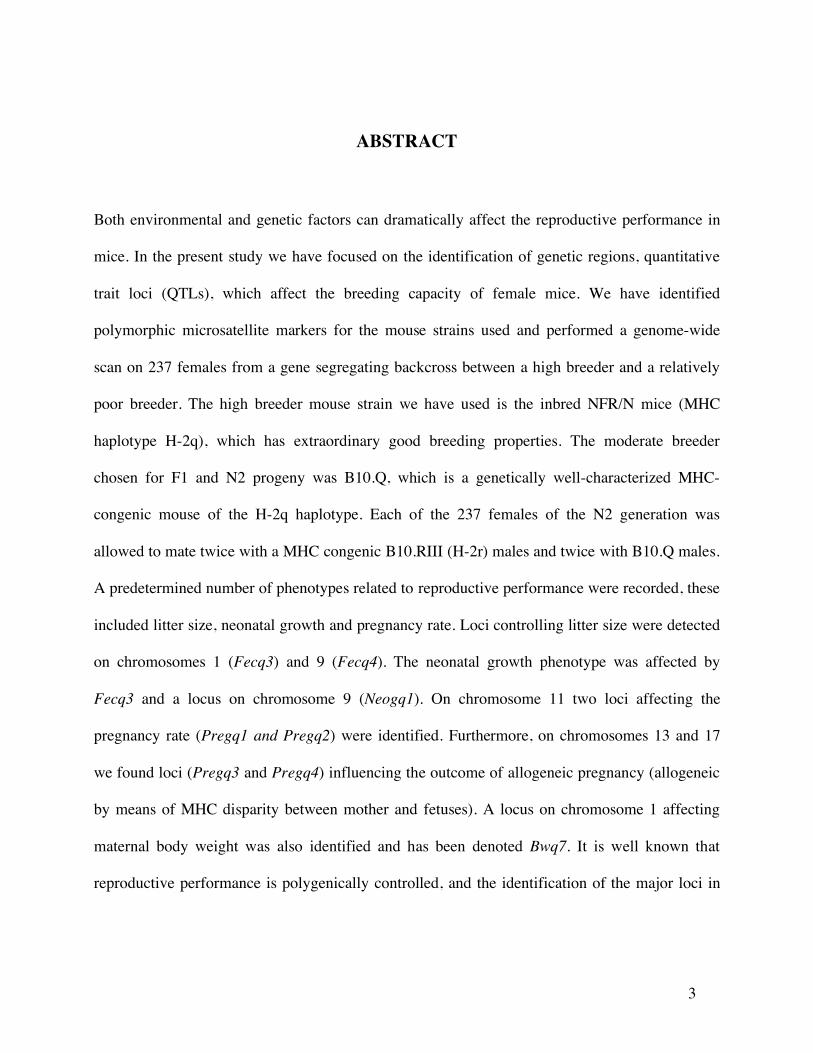
Short running title: Genetic Control of Mouse Reproduction.
Key words: QTL, pregnancy, litter size, NFR/N mice, B10.Q mice
1Corresponding author: Maria Liljander, e-mail: [email protected], Lund Transgenic
Core Facility, BMC C13, Lund University, SE-221 84 Lund, Sweden. Phone: +46-46-222 85 67,
Fax: +46-46-222 4110.
3
ABSTRACT
Both environmental and genetic factors can dramatically affect the reproductive performance in
mice. In the present study we have focused on the identification of genetic regions, quantitative
trait loci (QTLs), which affect the breeding capacity of female mice. We have identified
polymorphic microsatellite markers for the mouse strains used and performed a genome-wide
scan on 237 females from a gene segregating backcross between a high breeder and a relatively
poor breeder. The high breeder mouse strain we have used is the inbred NFR/N mice (MHC
haplotype H-2q), which has extraordinary good breeding properties. The moderate breeder
chosen for F1 and N2 progeny was B10.Q, which is a genetically well-characterized MHC-
congenic mouse of the H-2q haplotype. Each of the 237 females of the N2 generation was
allowed to mate twice with a MHC congenic B10.RIII (H-2r) males and twice with B10.Q males.
A predetermined number of phenotypes related to reproductive performance were recorded, these
included litter size, neonatal growth and pregnancy rate. Loci controlling litter size were detected
on chromosomes 1 (Fecq3) and 9 (Fecq4). The neonatal growth phenotype was affected by
Fecq3 and a locus on chromosome 9 (Neogq1). On chromosome 11 two loci affecting the
pregnancy rate (Pregq1 and Pregq2) were identified. Furthermore, on chromosomes 13 and 17
we found loci (Pregq3 and Pregq4) influencing the outcome of allogeneic pregnancy (allogeneic
by means of MHC disparity between mother and fetuses). A locus on chromosome 1 affecting
maternal body weight was also identified and has been denoted Bwq7. It is well known that
reproductive performance is polygenically controlled, and the identification of the major loci in

4
this complex process opens the possibility to investigate the natural genetic control of
reproduction.

5
INTRODUCTION
Reproductive success in mice, as in all mammals, is dependent on several environmental and
genetic factors. These factors are normally very complex and are often difficult to define. Most
scientists who have worked with mice in different animal houses have experienced that the same
inbred strains can show different reproductive performance. This discrepancy can be due to
differences in more or less definable environmental factors, such as differences in cages, food and
bedding material, routines, health status and handling of the mice. In research there is often a
considerable problem when there is a low reproductive performance of genetically modified
model mice. However, some strains of mice have, after many years of selection, become more
resistant to different types of stress and produce large litters in most types of environments. Such
strains are often denoted "high breeders", and they carry genes ensuring large litter size, high
stress resistance during pregnancy, and good nursing properties during the lactation period. The
NFR/N strain is an example of an inbred "high breeder" strain, while common C57BL strains
normally produce lower number of litters, and are often denoted "moderate breeders". Females of
the NFR/N strain are known to produce several large litters during a long period of time.
Furthermore, they are known to be excellent mothers (good nursing properties, high milk
production, rapid neonatal growth etc.), it is likely that these females carry several genes that are
valuable for successful reproduction in mice.
A limited number of reported studies have applied genetic mapping and linkage analyses in their
search for genetic regions of significant importance for successful reproduction in mice. In the
early 1980s a classical genetic analyses aimed to finding genetic regions critical for litter size was

6
performed, but no clear-cut results were obtained (HORSTGEN-SCHWARK et al. 1984). The
discovery of new techniques for genotyping during recent years together with the continued
development of more advanced linkage analysis programs, has made it possible to perform more
exact genetic analyses, and eventually also to identify single genes. In 1998 Kirkpatrick et al.
(1998) applied modern methods to map gene regions critical for litter size in an F2 progeny
between the outbred Quackenbush-Swiss mouse line and ordinary C57BL/6 mice. They found
significant linkages at specific segments of chromosomes 2 and 4 (Fecq1 and Fecq2) and a
suggestive linkage at a region of chromosome 9. Furthermore, in years 2002 and 2004 Peripato et
al. (2002; 2004) presented QTL data for maternal reproductive performance in an F2 progeny
between LG/J and SM/J mice, and they particularly point out genetic regions on chromosomes 7
and 12 as critical for the litter size phenotype. This group also showed that several reproductive
phenotypes are very complex, and subjected to epistatic interactions from genetic regions of
several chromosomes. Rocha et al. (2004) have also performed a QTL study of pregnancy-
associated traits in mice, and they report that loci on chromosome 2 are of particular importance.
Furthermore, Everett et al. (2004) reported that loci on chromosomes 1 and 9 are controlling the
ovulation of primary oocytes in mice; a phenotype related to litter size. In this context it should
also be mentioned that Spearow et al. (1999a; 1999b; 1999c) have mapped genes critical for
differences in hormone-induced ovulation rate (ORI genes) between A/J and C57BL/6 mice, and
QTLs for this trait were identified on chromosomes 2, 6, 9, 10 and X.
Still, there is a need for identification of additional loci that are critical for successful breeding of
mice. The present study is not only focusing on female-dependent differences in litter size in
normal mating, but also on a number of other female-associated traits critical for reproduction in

7
mice, such as vaginal plug frequency during 96 h mating periods, ratio of number of pregnancies
to the number of vaginal plugs, growth of pups, neonatal mortality and amount of maternal IgG
transmitted to the offspring etc.
A unique approach used in the present study is that we have included an analysis of the possible
influence of MHC differences between mother and fetuses. Mammalian allogeneic pregnancies is
dealing with the classical immunological problem i.e. that the mother should avoid
immunological rejection of her genetically different offspring and at the same time she should
mount an optimal defense against pathogens to provide the fetuses with passive immunity. Since
the days of Medaware (1953) the immunological enigma of mammalian pregnancy has been
highlighted several times, and a number of possible protective mechanisms have been presented,
such as low placental MHC expression (SUNDERLAND et al. 1981; MATTSSON et al. 1992)
protective properties of the placenta (PETROFF et al. 2003; ALUVIHARE et al. 2005) placental
complement inhibitory factors (THURMAN et al. 2005), cytokine balance (RAGHUPATHY et
al. 1997; SVENSSON et al. 2001) placental tryptophan catabolism (MUNN et al. 1998;
MELLOR et al. 2000) etc. Although many of the suggested mechanisms of protection might be
of importance during different situations it is still uncertain which of these that might be most
critical, or if products of genes that have yet to be identified may fulfill a more significant
protection. We have in the present study chosen to study mouse strains to evaluate differences in
pregnancy success depending on differences in MHC between mother and fetuses (allogeneic
versus syngeneic pregnancies by means of MHC). The two parental strains chosen (NFR/N and
B10.Q) carry MHC alleles of the H-2q haplotype. The females of the genotyped N2-generation
(backcross to B10.Q) have been allowed to mate both with B10.Q males (syngeneic pregnancy)

8
and B10.RIII males (allogeneic pregnancies). In the present study we provide genetic marker
information for the NFR/N strain and define genetic regions containing alleles that influence the
reproductive performance in female mice.

9
MATERIALS AND METHODS
Animals
NFR/N mice were originally obtained from the National Institute of Health (Maryland, USA) and
the B10.Q mice were originally bought from The Jackson Laboratory (Bar Harbor, Maine, USA).
(B10.Q × NFR/N)F1 hybrids and (B10.Q × NFR/N) × B10.Q N2 mice were bred in IVC-cages in
the BMC barrier animal house and at the Biomedical center and the Pathology animal house at
Lund University, Sweden. All mice were fed ad libitum with standard rodent pellets (LAB FOR
R36, irradiated breeding food for rats and mice, Lactamin AB, Sweden) and water in a climate-
controlled environment with a photoperiod of LD 12:12. The mice used in the present study had
clean health monitoring protocols according to the Federation of European Laboratory Animal
Sciences Association (FELASA) recommendations. Ethical permissions: M125-04 (embryo
transfer) and M290-03 (reproduction and arthritis).
Phenotype measurement and experimental design
A total number of 237 female mice of the (NFR/N x B10.Q) × B10.Q N2 backcross were used in
the present study. The females were kept with males at 4 occasions, each mating period lasting
for 96 hours to approximate one estrus cycle. First, the females were allowed to mate twice with
B10.RIII males (allogeneic mating by means of MHC) and finally twice with B10.Q males
(syngeneic mating by means of MHC). Phenotype data such as litter size, pups and mother′s
weight etc were collected during and after each pregnancy. The reproductive performance for the

10
parental strains (NFR/N, B10.Q) and the F1 generation (NFR/N x B10.Q) were tested in the same
way.
Description of phenotypes recorded:
1. Litter size: The number of pups born on the expected day for delivery.
2. Frequency of pregnancies: Number of pregnancies entered after 4 possible mating
occasions each being 96 hours long (96 h = the expected period of the estrus cycle).
3. Frequency of plugs: Number of vaginal plugs obtained after 4 possible mating periods
each being of 96 h. Plugs were observed every day for each animal during this 4 day
period.
4. Pregnancy rate = the ratio between detected number of pregnancies and detected
number of vaginal plugs.
5. Birth weight/pup = Mean weight (gram) per pup on the day of delivery.
6. Neonatal weight/pup day 7: Mean weight (gram) per pup on day 7 post partum.
7. Neonatal growth/pup day 1-7: Mean weight per pup day 7 minus mean weight per pup
day 1 (day 1 = day of delivery).
8. Maternal weight day 7: Maternal weight (gram) day 7 post partum.
9. Maternal growth day 1-7 post partum: Maternal weight (gram) after delivery day 1
minus maternal weight day 7 post partum.
10. Maternal body weight: Maternal weight (non-pregnant) at the age of 15 months.
11. IgG concentration/pup day 7: IgG concentration in neonatal blood.
12. Total IgG transmission day 7: Total IgG concentration in neonatal blood multiplied
with 10% of the total weight of the pups in the litter day 7. Approximately 10 % of the

11
body weight consists of blood. Approximately 80 % of the IgG detected in pups day 7
can be expected to originate from maternally transmitted milk (GUSTAFSSON et al.
1994).
13. Ovary weight: Mean wet weight of maternal ovaries at 15 months of age.
14. Uterus weight: Wet weight of maternal uterus (2 horns + cervix) at 15 months of age.
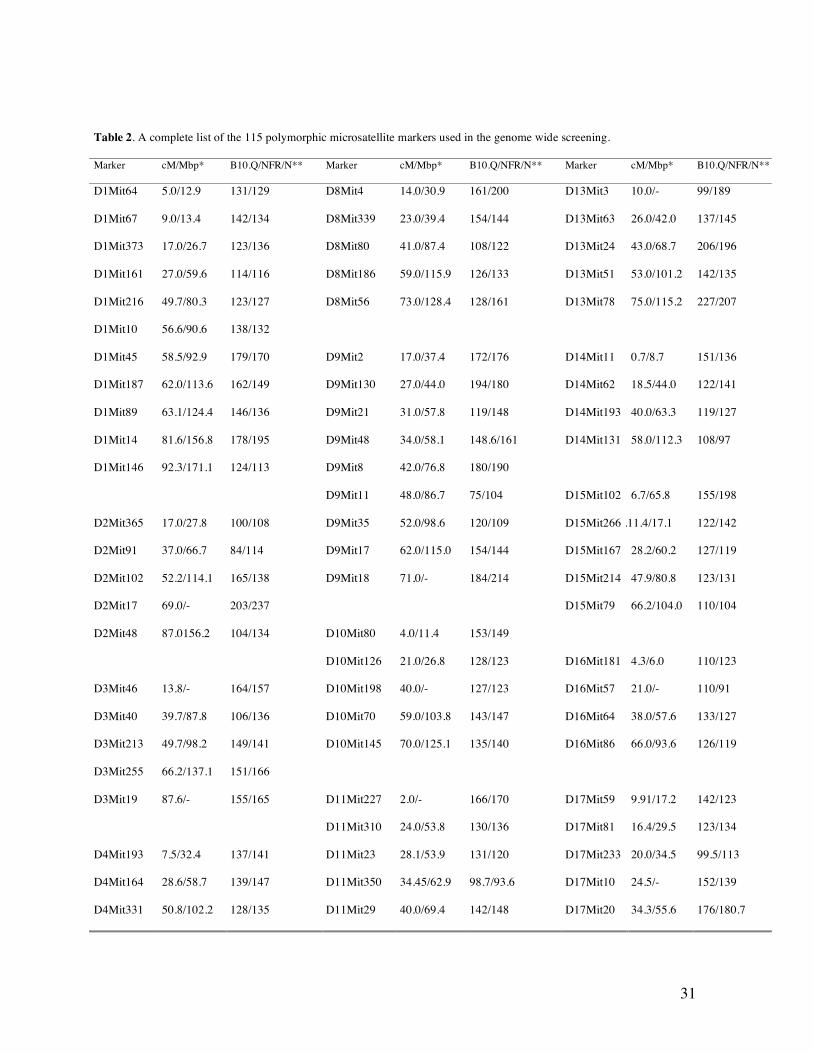
Micro-satellite genotyping and linkage analysis
Tail biopsies were collected from all N2 females and the parental strains. DNA was isolated
according to previously described protocol (LAIRD et al. 1991). Since NFR/N has not previously
been subjected to this type of genetic analyses, the first step in the present study was to identify
NFR/N specific microsatellite markers alleles (Table 2). After screening of parental DNA with
approximately 450 mouse fluorescence-labeled microsatellite markers (INTERACTIVA, Ulm,
Germany), 115 (25%) informative polymorphic markers were selected covering the genome. 237
female N2 mice were genotyped covering all chromosomes except for the Y chromosome. PCR
amplification for the markers was performed in a final volume of 10 µl in a 96-well V-bottom
microtitre plate using 20 ng of DNA, 10 mM KCl, 20mM Tris-HCl, 10 mM (NH4)2SO4, 2 mM
MgCl2, 0.1% Triton X-100, pH 8.8 (New England BioLabs Inc), 3 µM of each primer, 2 mM
dNTPs (Advanced Biotechnologies, Surrey, U.K), and 0.25 U Taq DNA Polymerase (New
England BioLabs Inc). The following program was used to amplify the DNA: denaturation at
95°C for 3 min, annealing at 56°C for 45 s, polymerization at 72°C for 1 min, 30 cycles of 95°C
for 30 s, 56°C for 45 s, 72°C for 1 min and a final extension step of 7 min at 72°C. The PCR
products were analyzed on a MegaBACE™ 1000 (Amersham Pharmacia Biotech) according to

12
the manufacture′s protocol. Data were analyzed with Genetic Profiler 1.1 through comparison
from parental mouse strains.
The linkage analyses were performed using R and the R/qtl (BROMAN et al. 2003; IHAKA and
GENTLEMAN 1996). Ninety percent of the mouse genome was within a 20 cM inter-marker
distance. The marker map was generated using the Kosambi map function and 1000 permutations
were performed for every phenotype (p < 0.05). The two-locus interaction was performed using
the imputation model in R/qtl. Here the calculated LODjoint score values compare a full model, if
including covariates (y = μ + βq1 + βq2 + βq1×q2 + Aγ + Zδq1 + Zδq2 + Zδq1×q2 + ε) to a null
model (y = μ + Aγ + ε). The epistasis, LODint score, compares the full model to an additive
model (y = μ + βq1 + βq2 + Aγ + Zδq1 + Zδq2 + ε). The q1 and q2 are unknown QTL genotypes
at two different locations, a matrix of covariates and Z a matrix of QTL interacting covariates.
Permutation tests (n=1000) were done subsequently to establish empirical significance thresholds
for the interactions. A threshold equal or above the 95th percentile was considered significant.
Figures, illustrating the interactions, were created using the image function in scanqtl. The new
loci symbols reflect the trait measured and are named according to the rules for nomenclature for
mice and rat strains at MGI (http://www.informatics.jax.org/mgihome//nomen/index.shtml)

13
Enzyme-Linked Immunosorbent Assay
The pups were sacrificed at the age of 7 days and sera from each litter were pooled. A sandwich
ELISA was performed to determine the amount of IgG that the mother has transferred to the pups
(ENGVALL et al. 1980) Briefly, goat anti mouse IgG (3 µg/ml) was coupled to immunosorbent
plates over night in 4°C. After blocking with Bovine Serum Albumin (Sigma) different dilutions
of purified mouse IgG (Sigma), test sera, positive and negative control was added. The murine
IgG levels were detected with peroxidase-conjugated goat anti-mouse IgG (Sigma). The ELISA
plates were analyzed in a spectrophotometer at 405 nm. The adult females were sacrificed at 15
month of age and sera analyzed as above.
Statistical analysis
Statistical analyses were performed by using the two-tailed Mann Whitney U-test (for non-
parametric data) or Student’s t-test.

14
RESULTS
Breeding properties in parental strains NFR/N and B10.Q
The NFR/N mouse is significantly larger in size than the B10.Q mouse (NFR/N females = 29.9 g
± 0.8, and B10.Q females = 26.0 g ± 0.7 at 4 month of age), and is known for its extraordinary
good breeding properties. In Table 1 we have summarized differences in litter size between these
two parental strains. The F0 generations (B10.Q × B10.Q and NFR/N × NFR/N) differs
significantly in litter size and neonatal growth. Characteristically, the F1 generation also shows
very good reproductive performance, which is significantly higher than in the B10.Q strain. The
MHC disparity between mother and fetuses (mating with two different MHC-congenic paternal
C57/BL strains: B10.RIII and B10.Q) did not significantly affect the litter size in the parental
NFR/N or NFR/N × B10.Q F1 females.
Plugs were recorded daily for each animal and 95 percent of the plugged females became
pregnant during the first mating opportunity. During mating period two, three and four, 90
percent of all plugged females became pregnant. None of the females became pregnant without
being plugged confirming the accuracy of plug detection.

15
QTL analyses of phenotypes for reproductive performance
Table 2 shows the map positions of markers typed across the data set. Significant QTLs were
found for several phenotypes (Table 3, Figure 1). On proximal chromosome 1 we found a region
affecting litter size and neonatal growth, denoted Fecq3. In addition, on chromosome 9 we found
another region affecting litter size (Fecq4) and neonatal growth (Neogq1). Furthermore, two loci
on chromosome 11 (Pregq1 and Pregq2) were found to strongly affect pregnancy rate, i.e. the
frequency of successful pregnancies after plugging (Figure 2).
Another phenotype of possible interest in reproductive contexts is the size of the mouse, since
there is normally a correlation between number of litters produced and the size of the mouse (the
NFR/N mice are larger than B10.Q and have the potential capacity to carry more pups). A highly
significant QTL (now denoted Bwq7) for this phenotype was identified around 62 cM on
chromosome 1 (Figure 1).
Epistatic interactions
A significant two-locus interaction was found for the phenotype pregnancy rate. Here the locus
Pregq1, identified from the single-locus analysis, on chromosome 11 was significantly affected,
LOD 5.6, by a locus on chromosome 10 at marker D10Mit198 (Figure 3). The interaction was
strongest under a complete model (q1*q2), allowing both strict epistasis and additive interaction.
The genetic interaction between marker D10Mit198 and D11Mit29 (Figure 4) show a reduced

16
pregnancy rate (0.82) for individuals expressing heterozygosity (AB/AB) at both loci compared
to AA/AB individuals (0.97).
QTLs specific for allogeneic pregnancy (MHC disparity between mother and fetuses)
The phenotypes listed above appeared to be unaffected by the type of mating (syngeneic or
allogeneic mating by means of MHC disparity between mother and father). However, a limited
number of QTL were recorded exclusively in allogeneic matings. As seen in Table 4, these QTLs
refer to the phenotype “pregnancy rate” which seems to be controlled by some gene/s around 26
cM on chromosome 13 (Pregq3). Furthermore, a region on chromosome 17 (Pregq4), the
chromosome harboring MHC in mice appears to affect the pregnancy rate i.e. the probability that
a mating results in a successful pregnancy increases if there is a MHC disparity between mother
and father (Figure 2B). The phenotype “frequency of plugs” was also significantly affected by a
region on chromosome 17. Our results indicate that gene/s outside the MHC are involved in
controlling this effect.
17
DISCUSSION
A limited number of linkage analyses based on QTL mapping have previously been performed
for identification of gene regions controlling pregnancy success in female mice (KIRKPATRICK
et al. 1998; PERIPATO et al. 2002; PERIPATO et al. 2004) According to our knowledge this is
the first study of this type that is also focusing on the identification of genetic regions that
specifically affect the outcome of allogeneic pregnancy (by means of MHC disparity); a question
that has been discussed by reproductive and transplantation immunologists for decades
(MEADAWAR et al. 1953; BILLINGTON et al. 1993; GUSTAFSSON et al. 1994; BULLA et
al 2004).
The fact that NFR/N and B10.Q mice carry the same MHC haplotype (H-2q) also made it
possible to study the possible influence of fetal/maternal MHC-disparity by allowing the females
to mate with either B10.Q or B10.RIII males ("syngeneic" and "allogeneic" pregnancies
respectively by means of MHC). It is known that MHC class I molecules are expressed on the
trophoblast cells of the spongio trophoblast region of the placenta (MATTSSON et al. 1992)
although previously it has been difficult to recognize immune reactivity against paternal MHC
during normal allogeneic pregnancy in most strains of mice (BILLINGTON et al. 1993).
However, other studies claim that such immune reactions are distinguishable (MUNN et al. 1998;
MELLOR et al. 2000) and that suppression of T cell responses against fetal/placental MHC is a
significant mechanism of protection against host versus graft reactivity in allogeneic pregnancies
in mice.

18
In our analyses we have distinguished between phenotypes that are unaffected or affected by the
type of mating. The sequential mating, first with B10.RIII males and later with B10.Q males may
influence the outcome of the frequency of pregnancies, but despite the order of the mating the
results clearly indicate that fetal/maternal MHC-disparity influence other reproductive traits such
as pregnancy rate and neonatal growth (Table 4). In Table 3 we present QTLs that are of general
validity for pregnancy (data from all pregnancies, independent of type of mating), while the
QTLs shown in Table 4 refers to observed differences between "syngeneic" and "allogeneic
pregnancy" by means of maternal/fetal MHC disparity.
It is obvious from the results in Table 3 that many genetic regions are involved in the regulation
of reproductive performance, furthermore the majority of these loci have not been reported
previously. We have found a locus (Fecq3) of significant negative influence of the NFR/N alleles
at around 9 cM of chromosome 1 (Figure 1). Several other QTLs of suggestive significance for
many different reproductive phenotypes were present at different regions of this chromosome.
However, the genetic analyses indicated a negative influence of NFR/N alleles on reproductive
parameters. It should be noted that the maternal body weight phenotype, which was mapped at 62
cM on chromosome 1 (now denoted Bwq7), shows a positive dominant affect from the NFR/N
fragment (Figure1). Two loci controlling body weight have previously been detected in the
vicinity of this region, i.e. Bw17 (ANUNCIADO et al. 2000) and Bwtq1 (MORRIS et al. 1999).
As to what extent Bwq7, which is a highly significant QTL, effects litter size is still unclear and
no other QTLs for litter size have been found in this region of chromosome 1. However, earlier
studies indicate some overlap between QTLs affecting both litter size and mature weight on

19
chromosome 4 (Kirkpatrick et al. 1998), which indicates the possibility to some correlation
between weight and litter sizes.
A genetic region of high interest in the context of litter size is chromosome 9 at around 42 cM
(Fecq4). Presence of NFR/N alleles in this region has a positive influence on litter size. What
makes this region even more interesting is that another trait (neonatal growth day 1-7), which are
phenotypes closely related to litter size show significant linkage to the very same region. It
should also be noted that Kirkpatrick et al. (1998) actually have identified a QTL of suggestive
significance for the litter size trait in the same region of chromosome 9. Although speculative, it
is worth mentioning that a highly interesting candidate gene, the fork-head box gene 1b (Fox1b)
is present in this region (41 cM). Fox1b is a part of a gene family and is coding for a transcription
factor, which has been reported to influence reproductive parameters, such as embryonic lethality,
postnatal mortality and lactation (LABOSKY et al. 1997).
If male mice are fertile, the vaginal plug formed in the female mouse after copulations is a fairly
certain indication of copulation and initiation of pregnancy. However, the plug is never a 100%
certain indication of pregnancy, onset and genetic differences exists between different strains of
mice. Failure to enter pregnancy after plugging can be due to fertilization failure, implantation
failure or early embryonic lethality. The phenotype ”pregnancy rate” is the ratio between number
of pregnancies and number of recorded plugs for each mouse, which in turn reflects the frequency
of early pregnancy failure. Two significant QTL for this phenotype were found on chromosome
11 (Figure 2A), one peak at 40 cM (Pregq1) and one peak at 64 cM (Pregq2). The Ace gene
coding for angiotensin-converting enzyme, located at 65 cM, on this chromosome is claimed to
20
affect male fertility (KONDOH et al. 2005). Furthermore, Kirkpatrick et al. (1998) reported a
suggestive significant locus for the trait litter size at around marker D11Mit231 + 11 cM. To our
knowledge, no other locus affecting female fertility has previously been identified on this part of
chromosome 11.
Pregq1 also shows an interaction affect (epistatic interaction) with another locus on chromosome
10 (D10Mit198). In our study we have used the N2 backcross of highly inbred mice (B10.Q and
NFR/N), which gives a less genetic variation than the F2. This may explain why our interaction
0test do not detect more than one clearly significant interaction. Since most reproductive traits are
very complex it is not surprising that other studies of intercrossed mice have resulted in the
identification of several gene interactions (PERIPATO et al. 2002; PERIPATO et al. 2004).
Neonatal growth is a phenotype that can be expected to be dependent on both litter size and milk
production (nutrient supply via milk). We have found several loci for these traits on chromosome
9 (Neogq1 and Fecq4) and Fecq3 on chromosome 1 mentioned above. Interestingly, Everett et al.
(EVERETT et al. 2004) recently reported that they have identified genetic regions affecting
ovulation of primary oocytes on chromosomes 1 and 9 (in the vicinity of the regions we denoted
Fecq3, Fecq4 and Neogq1). It is possible that we have identified the same loci, since ovulation
rate, litter size and neonatal growth may be related phenotypes.
All linkage analyses described above are based on mean and median values obtained from all
pregnancies (phenotypes that were not obviously affected by the MHC of the male). We have
also grouped our material in another way (mean and median values of syngeneic” versus

21
”allogeneic” pregnancies) in order to clarify whether some phenotypes are particularly affected
by the presence of foreign MHC in the feto-placental unit (Table 4). As shown in Figure 1 and
Figure 2B, there are regions on chromosomes 13 and 17 that appear to be specifically affected by
the type of mating. Here we have particularly focused our interest on a region outside the MHC
(around 44 cM) on chromosome 17 (Pregq4) that is showing a highly significant QTL, indicating
that this region contains genes that are very important for pregnancy success in allogeneic mating
(maternal/fetal MHC disparity).
From the data obtained we have decided to pay special attention to regions where significant QTL
have been observed for more than one phenotype, i.e. Fecq3 and Fecq4 (litter size), and Neogq1
(neonatal growth), Pregq1, Pregq2, Pregq3 and Pregq4 (pregnancy rate) and Bwq7 (maternal
body weight). The production of congenic mice for these chromosomal regions is in progress, and
will be essential tools in the future identification of specific genes. The data reported in this study
gives the starting point for identifying individual genes that may have an impact on breeding
success. The identification of specific genes that could then be crossed into genetically modified
model mice would not only have economical benefits, but also ethical benefits as there would be
fewer mice needed.

22
ACKNOWLEDGEMENT
This study was supported by Österlund’s fund, Crafoord’s fund, Gustav V 80 year foundation,
The Royal Physiographic Society in Lund and by Swegene. We thank Dr. A. Bäcklund for
comments and linguistics corrections.

23
LITERATURE CITED
ALUVIHARE, V. R., M. KALLIKOURDIS and A. G. BETZ, 2005 Tolerance, suppression and
the fetal allograft. Mol. Med. 83: 88-96.
ANUNCIADO, R. V., T. OHNO, M. MORI, A. ISHIKAWA, S. TANAKA, 2000 Distribution of
body weight, blood insulin and lipid levels in the SMXA recombinant inbred strains and the QTL
analysis. Exp. Anim. 49: 217-224.
BILLINGTON, W. D, 1993 Species diversity in the immunogenetic relationship between mother
and fetus: is trophoblast insusceptibility to immunological destruction the only essential common
feature for the maintenance of allogeneic pregnancy? Exp. Clin. Immunogenet. 10: 73-84.
BULLA, R. F., FISCHETTI, F. BOSSI and F. TEDESCO, 2004 Feto-maternal immune
interaction at the placental level. Lupus. 13: 625-629.
BROMAN, K. W., WU, H. SENS, S. and G. CHURCHILL, 2003 R/qtl: QTL mapping in
experimental crosses. Bioinformatics. 19: 889-890.
ENGWALL, E, 1980 Enzyme immunoassay ELISA and EMIT. Enzymology. 70: 419-439.

24
EVERETT, C. A., C. A. AUCHINCLOSS, M. H. KAUFMAN, C.M. ABBOTT and J. D. WEST,
2004 Genetic influences on ovulation of primary oocytes in LT/Sv strain mice. Reproduction.
128: 567-571.
GUSTAFSSON, E., A. MATTSSON, R. HOLMDAHL and R. MATTSSON, 1994. Pregnancy in
B-cell-deficient mice: Postpartum transfer of immunoglobulins prevents neonatal runting and
death. Biol. Reprod. 51: 1173-1180.
HORSTGEN-SCHWARK, G., E. J. EISEN, A. M. SAXTON and T. R. BANDY, 1984
Reproductive performance in a dialer cross among lines of mice selected for litter size and body
weight. J. Anima. Sic. 58: 846-862.
IHAKA, R., and R. GENTLEMEN, 1996 R: A language for data analysis and graphics, Journal
of Computational and Graphical Statistics 5: 299-314.
KIRKPATRICK, B. W., A. MANGELT, N. SCHULMAN and I. C. A. MARTIN, 1998
Identification of quantitative trait loci for prolificacy and growth in mice. Mamm. Genome 9: 97-
102.
KONDOH, G., H. TOJO, Y. NAKATANI, N. KOMAZAWA, C. MURATA et al., 2005
Angiotensin-converting enzyme is a GPI-anchored protein releasing factor crucial for
fertilization. Nat. Med. 11: 160-166.
25
LABOSKY, P. A., G. E. WINNER, T. L. JETTON, L. HARGETT, A. K. RYAN et al., 1997 The
winged helix gene, Mf3, is required for normal development of the diencephalon and midbrain,
postnatal growth and the milk-ejection reflex. Development 124: 1263-1274.
LAIRD, W. P., A. ZIJDERVELD, K. LINDERS, M. A. RUDNICKI and R. JAENISCH, 1991.
Simplified mammalian DNA isolation procedure. Nucleic Acids Research 15: 4293.
MATTSSON, R., A. MATTSSON, R. HOLMDAHL, A SCHEYNIUS and P. H. VAN DER
MEIDE, 1992 In vivo treatment with IFN-gamma during early pregnancy in mice induces strong
expression of MHC class I and II molecules in uterus and decidua but not in extra-embryonic
tissues. Biol. Reprod. 46: 1176-1186.
MEDAWARE, P. B., 1953 Some immunological and endocrinological problems raised by the
evolution of viviparity in vertebrates. Symp. Soc. Exp. Biol. Evolution. 11: 320-338.
MELLOR, A. L., and D. H. MUNN, 2000 Tryptophan catabolism and T cell tolerance.
Immunology Today 21: 250.
MORRIS, K. H, A. ISHIKAWA and P. D. KEIGHTLEY, 1999 Quantitative trait loci for growth
traits in C57BL/6J x DBA/2J mice. Mamm. Genome. 10: 225-228.
MUNN, D. H., ZHOU, M., ATTWOOD, J. T., BONDAREV I., CONWAY, S et al., 1998
Prevention of allogeneic fetal rejection by tryptophan catabolism. Science 281: 1191-1193.

26
PERIPATO, A. C., DE BRITO, R. A, MATIOLI, S. R, PLETSCHER, L. S, VAUGHN, T. T et
al., 2004 Epistasis affecting litter size in mice. J. Evol. Biol. 17: 593-602.
PERIPATO, A. C, DE BRITO, R. A, VAUGHN, T. T, PLETSCHER, L. S, MATIOLI, S. R et
al., 2002 Quantitative trait loci for maternal performance for offspring survival in mice. Genetics
162: 1341-1353.
PETROFF, M. G., L. CHEN, T. A. PHILLIPS, D. AZZOLA, SEDLMAYR, P et al., 2003 B7
Family Molecules Are Favorably Positioned at the Human Maternal-Fetal Interface. Biol.
Reprod. 68: 1496-504.
RAGHUPATHY, R., 1997 Th1 type immunity is incompatible with successful pregnancy.
Immunology Today 18: 478-482.
ROCHA, J. L, E. J. EISEN, F. SIEWERDT, L. D. VAN VLECK and D. POMP, 2004 A large-
sample QTL study in mice: III. Reproduction. Mamm. Genome 15: 878-886.
SPEAROW, J. L., P. A. NUTSON, W. S. MAILLIARD, M. PORTER and M. BARKLEY, 1999a
Mapping genes that control hormone-induced ovulation rate in mice. Biol. Reprod. 61: 857-872.
SPEAROW, J. L., and M. BARKLEY, 1999b Genetic control of hormone-induced ovulation rate
in mice. Biol.Reprod. 61: 851-856.

27
SPEAROW, J. L., P. DOEMENY, R. SERA, R. LEFFLER and M. BARKLEY, 1999c Genetic
variation in susceptibility to endocrine disruption by estrogen in mice. Science 285: 1259-1261.
SUNDERLAND, C. A., M. NAIEM, D. Y. MASON, C. W. REDMAN and G. M STIRRAT,
1981 The expression of major histocompatibility antigens by human chorionic villi. J. Reprod.
Immunol. 3: 323-331.
SVENSSON, L., M. ARVOLA, M-A. SÄLLSTRÖM, R. HOLMDAHL and R. MATTSSON,
2001 The Th2 cytokines IL-4 and IL-10 are not crucial for the completion of allogeneic
pregnancy in mice. J. Reprod. Immunol. 51: 3-7.
THURMAN, J. M., D. M. KRAUS, G. GIRARDI, D. HOURCADE, H. J. KANG et al., 2005 A
novel inhibitor of the alternative complement pathway prevents antiphospholipid antibody-
induced pregnancy loss in mice. Mol. Immunol. 42: 87-97.

28
FIGURE LEGENDS
Figure 1.
Chromosomal locations of QTL for litter size (Fecq3 and Fecq4), body weight (Bwq7), neonatal
growth (Neogq1) and pregnancy rate (Pregq3 and Pregq4). Dark lines within bars denote the
location of the maximum LOD score value.
Figure 2.
Logarithm of odds (LOD) plots for chromosomes with identified loci. Horizontal lines represent
experiment-wide significance level (p=0.05) according to permutation test (n=1000). (A)
Identification of two novel loci on chromosome 11 for pregnancy rate (Pregq1 and Pregq2). (B)
Identification of a novel locus (Pregq4) on chromosome 17 for pregnancy rate (allogeneic
pregnancies only). Analyzes were performed using the imputation model in R/qtl.
Figure 3.
Interaction graph for pregnancy rate showing interacting loci for chromosome 10 and 11.
Significant interaction, LOD= 5.6, was found for locus Pregq1, marker D11Mit29 on
chromosome 11, and marker D10Mit198 on chromosome 10. Significance levels according to
genome wide permutation tests, n=1000, were P(0.95) = 5.3. The values written in the picture are
LOD values from the interaction analysis in R/qtl using the scanqtl function and the imputation
model. Distances between markers are according to recombination frequency.

29
Figure 4.
Genetic interaction between marker D11Mit29 on chromosome 11 and marker D10Mit198 on
chromosome 10 for pregnancy rate. In the figure, A represents B10.Q and B NFR/N alleles. The
phenotypic variation is shown and expressed as error bars representing 1 SD.

30
TABLES
Table 1. Median litter size, mean pup weight (g) day 1 and 7 in the parental strains B10.Q and NFR/N (F0), F1 and the N2 generation (NFR/N ×
B10.Q) × B10.Q.
Females Males used in mating Number of females Litter size
Median (range)a
Pup weight day 1
Mean ± S.D.
Pup weight day7
Mean ± S.D.
F0 B10.Q B10.Q 10 7.0 (4, 8.5) 1.46 ± 0.15 4.2 ± 0.94
F0 NFR/N NFR/N 10 9.0 (7.5, 11)
p=0.0008b
1.63 ± 0.93
p=0.007b
5.2 ± 0.38
p=0.05b
F0 NFR/N B10.Q 10 9.0 (6.5, 12) 1.9 ± 0.08 5.9 ± 0.51
F0 NFR/N B10.RIII 10 9.5 (7, 13) 1.9 ± 0.21 5.3 ± 0.21
F1 NFR/N × B10.Q B10.Q 10 11.5 (9, 13) 1.68 ± 0.10 4.87 ± 0.38
F1 NFR/N × B10.Q B10.RIII 10 11.5 (10, 13.5) 1.67 ± 0.10 4.9 ± 0.36
N2 (NFR/N × B10.Q) × B10.Q B10.Q 237 7.8 (1, 13) 1.6 ± 0.16 4.6 ± 0.74
N2 (NFR/N × B10.Q) × B10.Q B10.RIII 237 8.1 (0, 14) 1.5 ± 0.14 4.7 ± 0.68
aRange = maximum and minimum value in the series.
bF0 (B10.Q × B10.Q) compared with (NFR/N × NFR/N). P values calculated with Student’s unpaired t-test.
31
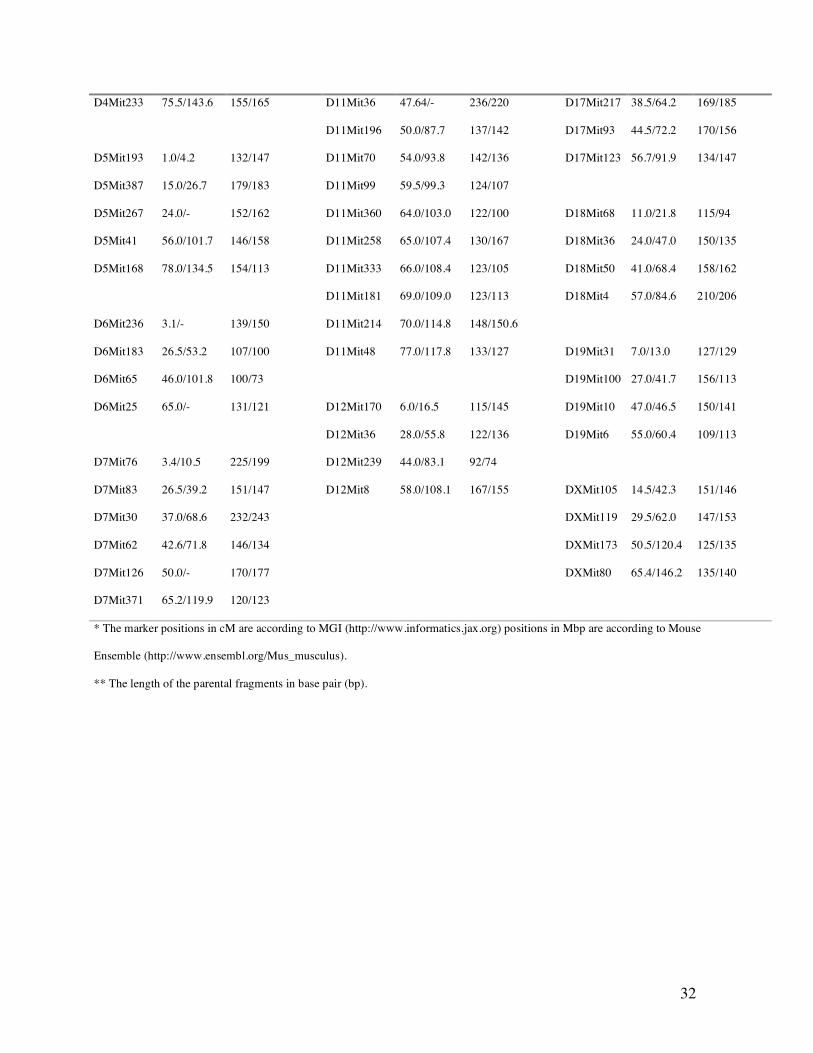
Table 2. A complete list of the 115 polymorphic microsatellite markers used in the genome wide screening.
Marker cM/Mbp* B10.Q/NFR/N** Marker cM/Mbp* B10.Q/NFR/N** Marker cM/Mbp* B10.Q/NFR/N**
D1Mit64 5.0/12.9 131/129 D8Mit4 14.0/30.9 161/200 D13Mit3 10.0/- 99/189
D1Mit67 9.0/13.4 142/134 D8Mit339 23.0/39.4 154/144 D13Mit63 26.0/42.0 137/145
D1Mit373 17.0/26.7 123/136 D8Mit80 41.0/87.4 108/122 D13Mit24 43.0/68.7 206/196
D1Mit161 27.0/59.6 114/116 D8Mit186 59.0/115.9 126/133 D13Mit51 53.0/101.2 142/135
D1Mit216 49.7/80.3 123/127 D8Mit56 73.0/128.4 128/161 D13Mit78 75.0/115.2 227/207
D1Mit10 56.6/90.6 138/132
D1Mit45 58.5/92.9 179/170 D9Mit2 17.0/37.4 172/176 D14Mit11 0.7/8.7 151/136
D1Mit187 62.0/113.6 162/149 D9Mit130 27.0/44.0 194/180 D14Mit62 18.5/44.0 122/141
D1Mit89 63.1/124.4 146/136 D9Mit21 31.0/57.8 119/148 D14Mit193 40.0/63.3 119/127
D1Mit14 81.6/156.8 178/195 D9Mit48 34.0/58.1 148.6/161 D14Mit131 58.0/112.3 108/97
D1Mit146 92.3/171.1 124/113 D9Mit8 42.0/76.8 180/190
D9Mit11 48.0/86.7 75/104 D15Mit102 6.7/65.8 155/198
D2Mit365 17.0/27.8 100/108 D9Mit35 52.0/98.6 120/109 D15Mit266 11.11.4/17.1 122/142
D2Mit91 37.0/66.7 84/114 D9Mit17 62.0/115.0 154/144 D15Mit167 28.2/60.2 127/119
D2Mit102 52.2/114.1 165/138 D9Mit18 71,0/- 184/214 D15Mit214 47.9/80.8 123/131
D2Mit17 69.0/- 203/237 D15Mit79 66.2/104.0 110/104
D2Mit48 87.0156.2 104/134 D10Mit80 4.0/11.4 153/149
D10Mit126 21.0/26.8 128/123 D16Mit181 4.3/6.0 110/123
D3Mit46 13.8/- 164/157 D10Mit198 40.0/- 127/123 D16Mit57 21.0/- 110/91
D3Mit40 39.7/87.8 106/136 D10Mit70 59.0/103.8 143/147 D16Mit64 38.0/57.6 133/127
D3Mit213 49.7/98.2 149/141 D10Mit145 70.0/125.1 135/140 D16Mit86 66.0/93.6 126/119
D3Mit255 66.2/137.1 151/166
D3Mit19 87.6/- 155/165 D11Mit227 2.0/- 166/170 D17Mit59 9.91/17.2 142/123
D11Mit310 24.0/53.8 130/136 D17Mit81 16.4/29.5 123/134
D4Mit193 7.5/32.4 137/141 D11Mit23 28.1/53.9 131/120 D17Mit233 20.0/34.5 99.5/113
D4Mit164 28.6/58.7 139/147 D11Mit350 34.45/62.9 98.7/93.6 D17Mit10 24.5/- 152/139
D4Mit331 50.8/102.2 128/135 D11Mit29 40.0/69.4 142/148 D17Mit20 34.3/55.6 176/180.7
32
D4Mit233 75.5/143.6 155/165 D11Mit36 47.64/- 236/220 D17Mit217 38.5/64.2 169/185
D11Mit196 50.0/87.7 137/142 D17Mit93 44.5/72.2 170/156
D5Mit193 1.0/4.2 132/147 D11Mit70 54.0/93.8 142/136 D17Mit123 56.7/91.9 134/147
D5Mit387 15.0/26.7 179/183 D11Mit99 59.5/99.3 124/107
D5Mit267 24.0/- 152/162 D11Mit360 64.0/103.0 122/100 D18Mit68 11.0/21.8 115/94
D5Mit41 56.0/101.7 146/158 D11Mit258 65.0/107.4 130/167 D18Mit36 24.0/47.0 150/135
D5Mit168 78.0/134.5 154/113 D11Mit333 66.0/108.4 123/105 D18Mit50 41.0/68.4 158/162
D11Mit181 69.0/109.0 123/113 D18Mit4 57.0/84.6 210/206
D6Mit236 3.1/- 139/150 D11Mit214 70.0/114.8 148/150.6
D6Mit183 26.5/53.2 107/100 D11Mit48 77.0/117.8 133/127 D19Mit31 7.0/13.0 127/129
D6Mit65 46.0/101.8 100/73 D19Mit100 27.0/41.7 156/113
D6Mit25 65.0/- 131/121 D12Mit170 6.0/16.5 115/145 D19Mit10 47.0/46.5 150/141
D12Mit36 28.0/55.8 122/136 D19Mit6 55.0/60.4 109/113
D7Mit76 3.4/10.5 225/199 D12Mit239 44.0/83.1 92/74
D7Mit83 26.5/39.2 151/147 D12Mit8 58.0/108.1 167/155 DXMit105 14.5/42.3 151/146
D7Mit30 37.0/68.6 232/243 DXMit119 29.5/62.0 147/153
D7Mit62 42.6/71.8 146/134 DXMit173 50.5/120.4 125/135
D7Mit126 50.0/- 170/177 DXMit80 65.4/146.2 135/140
D7Mit371 65.2/119.9 120/123
* The marker positions in cM are according to MGI (http://www.informatics.jax.org) positions in Mbp are according to Mouse
Ensemble (http://www.ensembl.org/Mus_musculus).
** The length of the parental fragments in base pair (bp).

33
Table 3. Markers associated with reproductive phenotypes in a N2 backcross involving (NFR/N× B10.Q) × B10.Q females mated
with B10.Q and B10.RIII males.
Phenotype Symbol Chr Flanking marker Linking marker cM/Mbp1 AB2 AA3 LOD
Litter size (median value from 4 pregnancies). Fecq3
Fecq4
1
9
D1Mit64 - D1Mit373
D9Mit130 - D9Mit48
D1Mit67
D9Mit21
9.0/13.4
42.0/79.8
7.9
8.0
9.0
6.8
2.8**
2.5**
Pregnancy rate. Pregq1
Pregq2
11
D11Mit23 - D11Mit36
D11Mit70 - D11Mit48
D11Mit29
D11Mit360
40.0/69.4
64.0/103.0
0.89
0.89
1.0
1.0
2.9**
2.7**
Neonatal growth (g)/pup day 1-7. Fecq3
Fecq4
Neogq1
1
9
9
D1Mit64 - D1Mit373
D9Mit130 - D9M48
D9Mit48 - D9Mit11
D1Mit67
D9Mit21
D9Mit8
9.0/13.4
31.0/57.8
42.0/76.8
3.38
3.30
3.41
3.95
3.04
2.95
3.8**
2.9*
3.0**
Maternal weight (g) at age 15 months. Bwq7 1 D1Mit145 - D1Mit89 D1Mit187 62.0/113.6 36.6 30.3 4.5***
Maternally transmitted IgG (mg/ml) day 7. 1
13
D1Mit187 - D1Mit14
D13Mit24 - D13Mit78
D1Mit89
D13Mit51
63.1/124.4
53.0/101.2
0.41
0.64
0.60
0.43
1.7*
1.7*
1The position in cM for the linking marker is according to MGI database (http://www.informatics.jax.org) and the markers physical position are
according to Mouse Ensemble built 33 (http://www.ensembl.org/Mus_Musculus).
2Mean phenotypic values in the group of mice heterozygous at the linking marker. Median values for litter size.
3Mean phenotypic values in the group of mice homozygous for B10.Q at the linking marker. Median values for litter size.
* Suggestive significance in a genome wide scan, ** Significant in a genome wide scan, *** Highly significant in a genome wide scan.

34
Table 4. Markers associated with reproductive phenotypes in a N2 backcross involving (NFR/N× B10.Q) × B10.Q females
mated with B10.RIII males (allogeneic mating) and B10.Q (syngeneic mating).
Phenotype Symbol Flanking Marker Linking marker cM/Mbp1 Allogeneic
pregnancy
AB2 AA3
Syngeneic
pregnancy
AB2 AA3
LOD score
Allo preg. Syn preg.
Pregnancy rate Pregq3
Pregq4
D13Mit3 – D13Mit24
D17Mit20 – D17Mit123
D13Mit63
D17Mit93
26.0/42.0
44.5/72.2
0.64 0.74
1.0 0.85
0.70 0.66
0.97 0.95
3.1** 0.2
4.8*** 0.3
Neonatal growth/pup
day 1-7 (g).
D6Mit236 – D6Mit65
D9Mit48 – D9Mit11
D6Mit183
D9Mit8
26.5/53.2
42.0/76.8
3.19 3.69
2.92 3.42
2.95 3.10
2.90 3.13
3.0* 0.4
3.1** 2.6
1 The markers position in cM for the linking marker is according to MGI (http://www.informatics.jax.org) and the markers physical position are
according to Mouse Ensemble built 33 (http://www.ensembl.org/Mus_Musculus).
2 Mean phenotypic values in the group of mice heterozygous at the linking marker.
3 Mean phenotypic values in the group of mice homozygous for B10.Q at the linking marker.
* Suggestive significance in a genome wide scan, ** Significant in a genome wide scan, ***Highly significant in a genome wide scan.

35
FIGURES
Figure 1.
10 cM
Chromosome 9 Chromosome 1 Chromosome 13 Chromosome 17
D1Mit67
D1Mit373
D1Mit161
Fecq3
D1Mit10
D9Mit2
D9Mit21 Fecq4
D9Mit8
D9Mit11 D9Mit35
D9Mit17
D9Mit18
D9Mit130
D9Mit48
Neogq1
D1Mit45
cM Marker 9.0
17.0
27.0
D1Mit216
D13Mit63
49.7
56.6 58.5
D1Mit187 62.0 D1Mit89 63.1
17.0
Marker cM
34.0 31.0
42.0
48.0 52.0
62.0
71.0
27.0
Bwq7
D13Mit3 10.0
D13Mit24 43.0
D13Mit51
26.0
53.0
Pregq3
9.91
D17Mit59
D17Mit81 16.4
cM Marker cM
Marker
D17Mit10 24.5
D17Mit20 34.3
D17Mit93 44.5
D17Mit123 56.7
Pregq4
D17Mit233 20.0

36
Figure 2.
Significance level p=0.05
LOD
scor
e
A. Pregnancy rate: Chromosome 11
B. Pregnancy rate (allogeneic pregnancies only): Chromosome 17
LOD
scor
e
Significance level p=0.05
0.0
0.0
1.0
0.5
1.5
D11Mit310 D11Mit227
2.5
2.0
D11Mit29 D11Mit36
D11Mit70 D11Mit23
D11Mit360 D11Mit48
D17Mit233 D17Mit20 D17Mit69 D17Mit81 D17Mit93 D17Mit123 D17Mit10
3.0
2.0
4.0
1.0

37
Figure 3.

38
Figure 4.