Identification of Distant Agouti-Like Sequences and Re- Evaluation
14
Identification of Distant Agouti-Like Sequences and Re- Evaluation of the Evolutionary History of the Agouti- Related Peptide (AgRP ) A ˚ ke Va ¨ stermark 1 *, Arunkumar Krishnan 1 , Michael E. Houle 2 , Robert Fredriksson 1 , Jose ´ Miguel Cerda ´- Reverter 3 , Helgi B. Schio ¨ th 1 1 Department of Neuroscience, Uppsala University, Uppsala, Sweden, 2 National Institute of Informatics, Research Organization of Information and Systems, Tokyo, Japan, 3 Instituto de Acuicultura de Torre de la Sal, Consejo Superior de Investigaciones Cientı ´ficas, Castello ´ n, Spain Abstract The Agouti-like peptides including AgRP, ASIP and the teleost-specific A2 (ASIP2 and AgRP2) peptides have potent and diverse functional roles in feeding, pigmentation and background adaptation mechanisms. There are contradictory theories about the evolution of the Agouti-like peptide family as well the nomenclature. Here we performed comprehensive mining and annotation of vertebrate Agouti-like sequences. We identified A2 sequences from salmon, trout, seabass, cod, cichlid, tilapia, gilt-headed sea bream, Antarctic toothfish, rainbow smelt, common carp, channel catfish and interestingly also in lobe-finned fish. Moreover, we surprisingly found eight novel homologues from the kingdom of arthropods and three from fungi, some sharing the characteristic C-x(6)-C-C motif which are present in the Agouti-like sequences, as well as approximate sequence length (130 amino acids), positioning of the motif sequence and sharing of exon-intron structures that are similar to the other Agouti-like peptides providing further support for the common origin of these sequences. Phylogenetic analysis shows that the AgRP sequences cluster basally in the tree, suggesting that these sequences split from a cluster containing both the ASIP and the A2 sequences. We also used a novel approach to determine the statistical evidence for synteny, a sinusoidal Hough transform pattern recognition technique. Our analysis shows that the teleost AgRP2 resides in a chromosomal region that has synteny with Hsa 8, but we found no convincing synteny between the regions that A2, AgRP and ASIP reside in, which would support that the Agouti-like peptides were formed by whole genome tetraplodization events. Here we suggest that the Agouti-like peptide genes were formed through classical subsequent gene duplications where the AgRP is the most distantly related to the three other members of that group, first splitting from a common ancestor to ASIP and A2, and then later the A2 split from ASIP followed by a split resulting in ASIP2 and AgRP2. Citation: Va ¨stermark A ˚ , Krishnan A, Houle ME, Fredriksson R, Cerda ´-Reverter JM, et al. (2012) Identification of Distant Agouti-Like Sequences and Re-Evaluation of the Evolutionary History of the Agouti-Related Peptide (AgRP ). PLoS ONE 7(7): e40982. doi:10.1371/journal.pone.0040982 Editor: Vincent Laudet, Ecole Normale Supe ´rieure de Lyon, France Received March 14, 2012; Accepted June 15, 2012; Published July 16, 2012 Copyright: ß 2012 Va ¨stermark et al. This is an open-access article distributed under the terms of the Creative Commons Attribution License, which permits unrestricted use, distribution, and reproduction in any medium, provided the original author and source are credited. Funding: The studies were supported by the Swedish Research Council to HS and by Recursos y Tecnologı ´as Agroalimentarias (AGL) 2010-22247-C03-01/ Incite09402193PR/CSD 2007-00002 to JMCR. The funders had no role in study design, data collection and analysis, decision to publish, or preparation of the manuscript. Competing Interests: The authors have declared that no competing interests exist. * E-mail: [email protected] Introduction Agouti signaling peptide (ASIP) was discovered in 1993 [1] while the Agouti-related peptide (AgRP) was first identified in 1997 [2,3]. The word Agouti, from the Guaranı ´ language of South America, refers to rodents noted for prominent-banded pigment patterns in individual hair shafts. Made from three coding exons, these proteins are approximately 130 amino acids long, and contain a cysteine knot (receptor binding domain) in the third coding exon. The cysteine knot mediates the function of ASIP as an inverse agonist of melanocortin (MC) 1 and 4 receptors [4] while AgRP acts mainly at the MC3 and MC4 receptors [5]. The effect of ASIP on mammalian hair follicle melanocytes is an increased production of pheomelanin (yellow) and a decreased production of eumelanin (brown/black). It helps to establish the dorsal-ventral pigmentation in goldfish, by being mainly expressed in ventral skin, where it inhibits melanophore differentiation and/or proliferation but promotes iridophore differentiation and/or proliferation [6]. AgRP is one of the most potent appetite stimulants within the hypothalamus, and it plays an important role in mediating the effects of the peripheral body weight regulators ghrelin and leptin [7]. In 2003, we cloned the first AgRP sequences in fish [8,9]. Then, in 2005, we searched for ASIP and AgRP sequences in fish and chicken and found a third category of Agouti-like proteins, which have a cysteine knot that has been shortened by one amino acid to give a C-x(6)-C-x(5)-C structure, rather than the usual C-x(6)-C- x(6)-C structure [10]. These new type of sequences were originally named ‘‘A2’’ because these sequences clustered with neither AgRP nor ASIP in the phylogeny. In 2006, another group (Kurokawa et al. [11]) reported for the first time the presence of four distinct Agouti genes in T. rubripes (torafugu) and these were termed ASIP1, AgRP1 and ASIP2, AgRP2. Kurokawa reported differential expression of AgRP2 in dorsal and ventral skin, indicating a role in pigmentation. Phylogenetic analysis suggested that the ASIP2 and AgRP2 or ‘‘A2’’ sequences clustered with AgRP1, hence indicating a higher similarity between the A2 (ASIP2 and AgRP2) PLoS ONE | www.plosone.org 1 July 2012 | Volume 7 | Issue 7 | e40982
Transcript of Identification of Distant Agouti-Like Sequences and Re- Evaluation

Identification of Distant Agouti-Like Sequences and Re-Evaluation of the Evolutionary History of the Agouti-Related Peptide (AgRP)Ake Vastermark1*, Arunkumar Krishnan1, Michael E. Houle2, Robert Fredriksson1, Jose Miguel Cerda-
Reverter3, Helgi B. Schioth1
1 Department of Neuroscience, Uppsala University, Uppsala, Sweden, 2 National Institute of Informatics, Research Organization of Information and Systems, Tokyo, Japan,
3 Instituto de Acuicultura de Torre de la Sal, Consejo Superior de Investigaciones Cientıficas, Castellon, Spain
Abstract
The Agouti-like peptides including AgRP, ASIP and the teleost-specific A2 (ASIP2 and AgRP2) peptides have potent anddiverse functional roles in feeding, pigmentation and background adaptation mechanisms. There are contradictory theoriesabout the evolution of the Agouti-like peptide family as well the nomenclature. Here we performed comprehensive miningand annotation of vertebrate Agouti-like sequences. We identified A2 sequences from salmon, trout, seabass, cod, cichlid,tilapia, gilt-headed sea bream, Antarctic toothfish, rainbow smelt, common carp, channel catfish and interestingly also inlobe-finned fish. Moreover, we surprisingly found eight novel homologues from the kingdom of arthropods and three fromfungi, some sharing the characteristic C-x(6)-C-C motif which are present in the Agouti-like sequences, as well asapproximate sequence length (130 amino acids), positioning of the motif sequence and sharing of exon-intron structuresthat are similar to the other Agouti-like peptides providing further support for the common origin of these sequences.Phylogenetic analysis shows that the AgRP sequences cluster basally in the tree, suggesting that these sequences split froma cluster containing both the ASIP and the A2 sequences. We also used a novel approach to determine the statisticalevidence for synteny, a sinusoidal Hough transform pattern recognition technique. Our analysis shows that the teleostAgRP2 resides in a chromosomal region that has synteny with Hsa 8, but we found no convincing synteny between theregions that A2, AgRP and ASIP reside in, which would support that the Agouti-like peptides were formed by whole genometetraplodization events. Here we suggest that the Agouti-like peptide genes were formed through classical subsequentgene duplications where the AgRP is the most distantly related to the three other members of that group, first splitting froma common ancestor to ASIP and A2, and then later the A2 split from ASIP followed by a split resulting in ASIP2 and AgRP2.
Citation: Vastermark A, Krishnan A, Houle ME, Fredriksson R, Cerda-Reverter JM, et al. (2012) Identification of Distant Agouti-Like Sequences and Re-Evaluation ofthe Evolutionary History of the Agouti-Related Peptide (AgRP ). PLoS ONE 7(7): e40982. doi:10.1371/journal.pone.0040982
Editor: Vincent Laudet, Ecole Normale Superieure de Lyon, France
Received March 14, 2012; Accepted June 15, 2012; Published July 16, 2012
Copyright: � 2012 Vastermark et al. This is an open-access article distributed under the terms of the Creative Commons Attribution License, which permitsunrestricted use, distribution, and reproduction in any medium, provided the original author and source are credited.
Funding: The studies were supported by the Swedish Research Council to HS and by Recursos y Tecnologıas Agroalimentarias (AGL) 2010-22247-C03-01/Incite09402193PR/CSD 2007-00002 to JMCR. The funders had no role in study design, data collection and analysis, decision to publish, or preparation of themanuscript.
Competing Interests: The authors have declared that no competing interests exist.
* E-mail: [email protected]
Introduction
Agouti signaling peptide (ASIP) was discovered in 1993 [1]
while the Agouti-related peptide (AgRP) was first identified in
1997 [2,3]. The word Agouti, from the Guaranı language of
South America, refers to rodents noted for prominent-banded
pigment patterns in individual hair shafts. Made from three
coding exons, these proteins are approximately 130 amino acids
long, and contain a cysteine knot (receptor binding domain) in
the third coding exon. The cysteine knot mediates the function of
ASIP as an inverse agonist of melanocortin (MC) 1 and 4
receptors [4] while AgRP acts mainly at the MC3 and MC4
receptors [5]. The effect of ASIP on mammalian hair follicle
melanocytes is an increased production of pheomelanin (yellow)
and a decreased production of eumelanin (brown/black). It helps
to establish the dorsal-ventral pigmentation in goldfish, by being
mainly expressed in ventral skin, where it inhibits melanophore
differentiation and/or proliferation but promotes iridophore
differentiation and/or proliferation [6]. AgRP is one of the most
potent appetite stimulants within the hypothalamus, and it plays
an important role in mediating the effects of the peripheral body
weight regulators ghrelin and leptin [7].
In 2003, we cloned the first AgRP sequences in fish [8,9]. Then,
in 2005, we searched for ASIP and AgRP sequences in fish and
chicken and found a third category of Agouti-like proteins, which
have a cysteine knot that has been shortened by one amino acid to
give a C-x(6)-C-x(5)-C structure, rather than the usual C-x(6)-C-
x(6)-C structure [10]. These new type of sequences were originally
named ‘‘A2’’ because these sequences clustered with neither AgRP
nor ASIP in the phylogeny. In 2006, another group (Kurokawa
et al. [11]) reported for the first time the presence of four distinct
Agouti genes in T. rubripes (torafugu) and these were termed ASIP1,
AgRP1 and ASIP2, AgRP2. Kurokawa reported differential
expression of AgRP2 in dorsal and ventral skin, indicating a role
in pigmentation. Phylogenetic analysis suggested that the ASIP2
and AgRP2 or ‘‘A2’’ sequences clustered with AgRP1, hence
indicating a higher similarity between the A2 (ASIP2 and AgRP2)
PLoS ONE | www.plosone.org 1 July 2012 | Volume 7 | Issue 7 | e40982
sequences with AgRP than ASIP. This paper also presented synteny
evidence suggesting a relation between AgRP1 and AgRP2. But
unfortunately this synteny was based on only few genes that were
placed on scaffolds that have all subsequently been changed [12].
The authors presented a theory that AgRP2 came from AgRP1,
and that the ASIP2 gene may have derived from the ASIP1 gene.
Based on this theory they introduced the present nomenclature of
AgRP2 and ASIP2 for the ‘‘A2’’ genes and this nomenclature has
been commonly used since.
Interestingly, the ‘‘A2’’ genes have a functional role in white
background adaptation in zebrafish, mediated by AgRP2 through
direct optical sensing in the pineal gland [13]. The AgRP2 peptide
causes an increase in MCH peptides, and triggers a change in
pigmentation by inducing pigment aggregation and most probably
melanophore apoptosis [13]. It is shown that AgRP2 acts on the
MC1 receptor, thus making it in function ASIP-like. Evolutionary
studies showed the presence of an ASIP like gene in a cartilaginous
fish, C. milii (elephant shark), representing the most ancient version
of an Agouti-like gene [14]. However, no Agouti-like sequences
were found in the cephalochordate B. floridae (lancelet) or in
lamprey, despite the fact that a functional MC receptor system
exists in the sea lamprey [15].
Two concurrent letters to the editor appeared on the evolution
of the Agouti-like genes in 2011 [12,16]. Braasch and Postlethwait
proposed that AgRP2 is an ‘‘ohnolog gone missing in tetrapods’’,
and that the A2 genes should be re-named ASIP2a (ASIP2) and
ASIP2b (AgRP2). The authors postulated that the original Agouti
gene underwent R1 (round one) of WGD (whole genome
duplication), forming the proto-AgRP and ASIP genes. These
proto-genes, in turn, underwent R2, forming two copies of each.
The authors put forward an evolutionary model, where proto-
ASIP, which was formed from proto-Agouti in R1, then duplicated
again in R2, forming two lineages. One of these copies (proto-A2)
duplicated in teleost-specifc genome duplication, giving rise to
AgRP2 and ASIP2 (or ASIP2a and ASIP2b). Underpinning this
argument, in addition to an phylogenetic tree, was use of a tool
known as ‘‘synteny DB dotplots’’ [17], which can be used to
visually inspect one-dimensional tracks showing the amount of
synteny between a region of interest in one organism, and all
chromosomes of another organism. Initially, the authors used this
method to make the observation that AgRP in human has synteny
similarity to AgRP1 in zebrafish, while they observed that AgRP2
did not share syntenies with AgRP in human. Braasch et al. then
proceeded to look at data from O. latipes (medaka), and discovered
a region in the human genome (Hsa 8 (60–100 Mb) that they
found to contain three of Kurokawa’s original marker genes
(SNX16, WWP1, and RIPK2). The authors assumed that they had
found an ancestral ‘‘A2’’ area in human, lacking the actual A2
genes, but preserving synteny with not only one, but both A2 areas
in fish. Then, using this alleged A2 area, they proceeded to a
comparison in human, noting a slightly higher degree of similarity
between the ASIP synteny area in human and the Hsa 8 region,
than between the ASIP synteny area in human and the AgRP
synteny area in human.
We were allowed to present a short comment to these
hypotheses in the same issue [12]. We showed that the choice of
root in a maximum likelihood tree of the same set of Agouti-like
sequences determines the positioning of the A2 subtree in relation
to the A1 clusters within this dataset. We showed that if the
phylogenetic tree was rooted on the elephant shark ASIP sequence,
the oldest full-length sequence available, the A2 sequences
clustered with AgRP, not ASIP. This was originally shown by a
low bootstrap value suggesting that the current sequences available
were not sufficient to determine if the A2 sequences were more
similar to the tetrapod AgRP or ASIP sequences, which was one of
the fundaments in Braasch and Postlethwait’s hypotheses. The
common structural feature C-x(6)-C-x(5)-C of the teleost A2
sequences and the phylogeny would however clearly suggest their
common origin, in contrast to what was originally suggested by the
Kurokawa nomenclature [11].
The functional importance of the AgRP, ASIP and the A2
peptides, as well as the controversy about the evolutionary history
of these sequences warrants further analysis. Here we present new
Agouti sequences, and phylogenetic and structure modeling which
are useful arguments for and against alternative evolutionary
schemes. We also look further into the methods of determining
synteny and implement a new method, the sinusoidal Hough
transform [18], a pattern recognition technique previously used in
microarray analysis (e.g. [19]) and other areas of image analysis in
biology and medicine, as an interesting tool to detect linear
synteny between two organisms.
We find fairly good agreement between the phylogeny, motifs
and structural properties which supports the evolutionary events
we suggest here. We do however not find specific synteny evidence
that the AgRP, ASIP and A2 genes could represent specific
branches in a 2R duplication scheme. It is well known that many,
if not most large chromosomal regions in teleosts, have synteny
with one or many regions in the human genome. The fact that a
teleost region, where one of the A2 genes resides in, has synteny
with humans does not validate a 2R duplication scheme.
Moreover, such duplication scheme would require multiple losses
of genes. There are also several other regions that are in synteny to
this particular teleost region as well as for the teleost region where
the other A2 genes are placed. The presence of ASIP2 in lobe-
finned fish, as well as the absence of AgRP2 in or near linear
synteny blocks in gnathostome ancestor element regions 10, 3b,
7b, and 7c, suggests that the duplication of the synteny block
containing the teleost A2 genes may not have occurred in the 3R.
Results
1. Database Annotation of A1 and A2 SequencesWe followed 110, 112, 116 of INSDC TPA policy, basing our
A2 entries on pre-existing Agouti-like sequences entries by the
same submission group, which include: (NP_001026628.1),
(NP_001129.1), (CAH60801.1), (CAH60802.1), and
(CAH60803.1). Details are given in Table S3.
2. Experimental Determination of European sea bass (D.labrax) AgRP1, AgRP2, ASIP1; Turbot (S. maximus) ASIP1;Solea (S. senegalesis) ASIP1
Reverse transcription-polymerase chain reaction (RT-PCR)
using degenerate primers designed by alignments of available fish
ASIP1 or AgRP1 sequences produced a partial cDNA fragments for
sole and turbot ASIP1 as well as sea bass AgRP1. The putative
translations exhibited high identity with the C-terminal cysteine
domain of the published ASIP1/AgRP sequences. To obtain the
sequence of the complete peptide precursor RACE-PCR was
performed in the 39 and 59 directions with specific primers. 39
RACE generated unique bands for all three species and provided
information about the coding region of the exon 4 and the 39
untranslated region. 59 RACE experiments also generated unique
and provided information about the first exons as well as the 59
untranslated region. The sea bass ASIP1 and AgRP2 sequence was
obtained by blasting Genebank and Aquagenomics database,
respectively with seabass AgRP1 sequence. Subsequently, both
sequences were cloned by RT-PCR and sequenced to corroborate
data obtained in silico.
Identification of Distant Agouti-Like Sequences
PLoS ONE | www.plosone.org 2 July 2012 | Volume 7 | Issue 7 | e40982

The peptide precursors have the same organization as other
species. The poly-cysteine domain contains 10 cysteine residues
with identical spatial pattern to that of Agouti-like proteins.
Similar to mammalian ASIP molecules fish ASIP1 sequences do not
exhibit a short amino acid extension following the tenth cysteine
residue as sbAgRP1 and sbAgRP2 do. All four peptides, fish ASIP1
and sea bass AGRP1, exhibits the cysteine knot structure A1 i.e. C-
x(6)-C-x(6)-CC whereas sea bass AgRP2 shows the typical A2-like
structure i.e C-x(6)-C-x(5)-CC.
3. Use of HMM to Search for Agouti-like SequencesWe searched for AgRP and ASIP-like sequences against the
UniProt database restricted to a sequence length that range
, = 150 residues. A search for homologues using the separate
HMM profiles against our dataset (1,240,895 sequences; length
, = 150 residues) significantly identified eight novel homologues
from the phylum arthropods and three from the phylum
ascomycota in the fungi kingdom. Multiple sequence alignment
of the final dataset demonstrated that the novel sequences in the
arthropods have the characteristic C-x(6)-C-C motif which are
present in the AgRP, AgRP1 and ASIP, ASIP1 sequences.
Furthermore, three sequences from fungi have longer C-x(8,9)-
C-C motif instead of C-x(5,6)-C-C motif. Moreover, these three
sequences have the C-[VI]-P motif and the C-A motif that are
conserved in most of the AgRP and ASIP-like sequences. The
conserved motifs between the novel sequences and the AgRP and
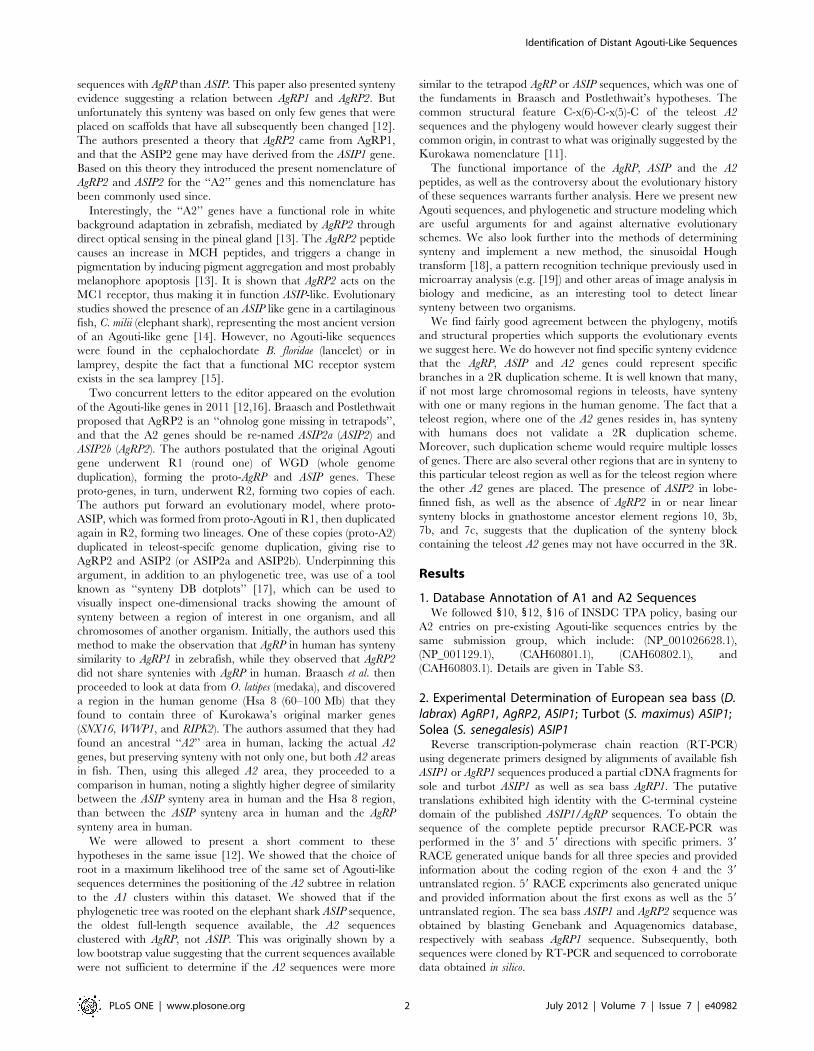
ASIP-like sequences are shown in Figure 1.
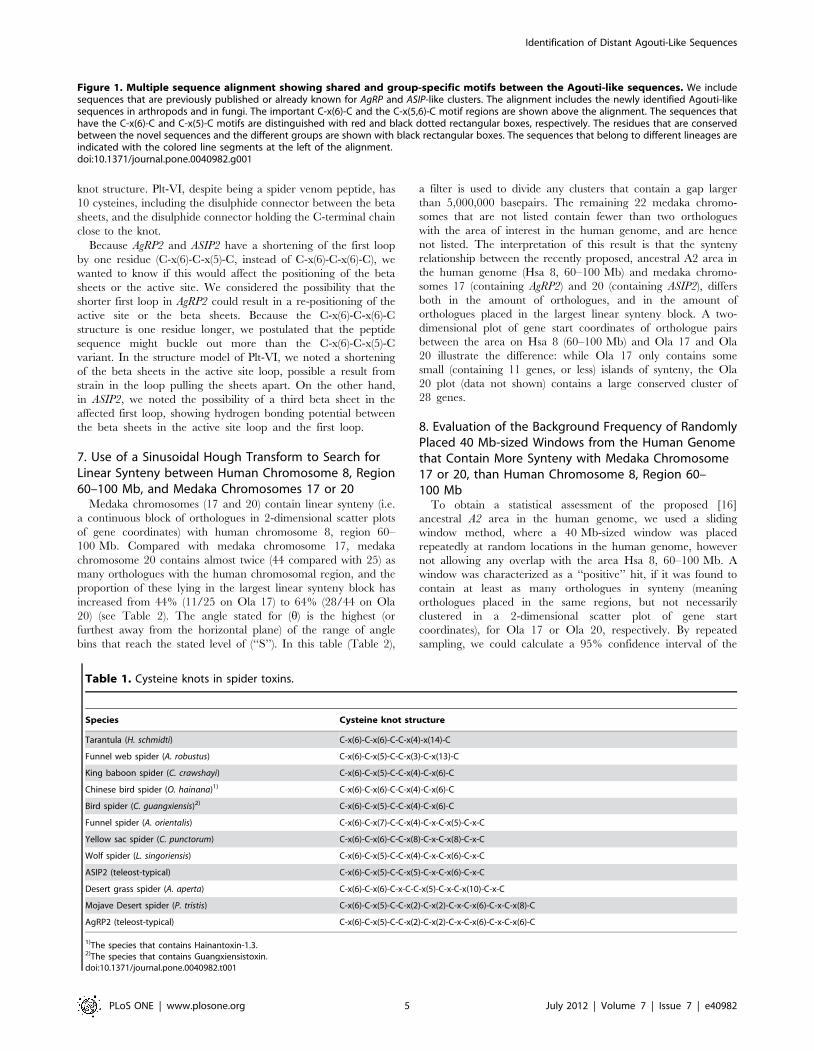
4. PHI-BLAST Search of A2-like SequencesIn the PHI-BLAST 2.2.25+ search, the top hit for AgRP2 is
(XP_002937367.1) (X. tropicalis AgRP, which contains the motif C-
x(6)-C-x(5)-C, despite being an A1 sequence). The second best hit
is a venom peptide from Mojave Desert spider (P. tristis), ‘‘Plt-VI’’
(AAC47205.1). The cysteine knot of Plt-VI (and also ‘‘Plt-VIII’’ or
‘‘Plt-XI’’) is thus identical to AgRP2 (C-x(6)-C-x(5)-C-C-x(2)-C-
x(2)-C-x-C-x(6)-C-x-C-x(6,8)-C). Some spider toxin sequences are
also similar (Table 1), in terms of cysteine knot structure, to
Atlantic cod ASIP2. Spider toxin cysteine knots invariably start
with C-x(6)-C. The next inter-cysteine segment varies in length
from 5–7 amino acids (e.g., C. guangxiensis has 5, O. hainana has 6,
and A. orientalis has 7). In the desert grass spider (A. aperta), this
inter-cysteine segment is replaced by x(6)-C-x, giving a total length
of 8, but that is an exception. Furthermore, all spiders have the C-
C pair, followed by an inter-cysteine segment of length x(4,5).
Only P. tristis has this segment punctuated by a single cysteine,
making it much more AgRP2-like (but some ASIP2 sequences
actually lack this feature). The Eurasian yellow sac spider (C.
punctorium), has 8 residues in this span, making it a highly
exceptional structure. After this, only some spiders contain the
paired C-x-C-x(n)-C-x-C feature, others only have C-x(n)-C,
which is the case in the Chinese bird spiders, and also in tarantulas
and in the King baboon spider. Finally, no spider, except P. tristis,
contains the additional cysteine after the ‘‘paired’’ feature. The
cysteine knot of torafugu ASIP2, C-x(6)-C-x(5)-C-C-x(5)-C-x-C-
x(6)-C-x-C-x(7), is remarkable similar to a sequence from wolf
spider (TXJ07_LYCSI), where the cysteine knot has the structure:
C-x(6)-C-x(5)-C-C-x(4)-C-x-C-x(6)-C-x-C-x(14). The venom pep-
tide Plt-VI displays many Agouti-like features: in terms of the
length (130 amino acids), positioning in the sequence (at the end),
and other sequence similarity with AGRP1 (e.g. I-x(2)-Q in the first
inter-cysteine segment, G-x(1,2)-L-P in the second segment, as well
as one or two cysteines in the beginning of the sequence, before the
actual inhibitor knot).
5. Bayesian Phylogenetic Analysis of A1, A2, and Agouti-like Sequences
The phylogenetic relationship of the Agouti-like sequences
was investigated using the Bayesian approach as implemented in
MrBayes 3.1.2. The topology supported by the Bayesian
approach was also verified using the Maximum Likelihood
approach as implemented in PhyML 3.0. We constructed
several preliminary trees to test the robustness of the
diversification of the Agouti-like sequences particularly when
the tree is rooted. In order to check the most stable topology
supported by the root, we made three separate consensus
sequences using HMMEMIT (see Methods), one with the
sequences identified in spider (SPTR_cons), second with
sequences identified in arthropods, excluding the spider
sequences (Arth_cons) and third as combined together (Arth1_-
cons). Except for the tree rooted on Arth1_cons, all the trees
clustered AgRP/AgRP1 together basal to the root and clustering
AgRP2 ASIP2 and ASIP together (100%). Considering the most
stable topology supported by preliminary trees, the tree was
finally rooted on consensus sequences SPTR_cons and Arth_-
cons (see Figure 2) that clustered ASIP, AgRP2 and ASIP2
together (100%) and separating AGRP and AgRP1 clusters basal
to the root.
6. Structure Modeling of A2 SequencesNon-metric multidimensional scaling was used (see Materials
and Methods) to construct a two-dimensional representation of the
similarity data, in which the data points are positioned so that the
distances between them reflect as much as possible the original
dissimilarity values (Figure 3). The resulting configuration shows a
clear bipartitioning of the AgRP or ASIP structures. Notably, the
Mojave Desert spider venom peptide Plt-VI sequence falls within
the range of the other Agouti-like sequences.
In human, both AgRP and ASIP have 10 cysteines that hold the
knot together. Starting from the N-terminal end, the sequence
passes the first cysteine, which holds together the first loop, which
is shortened by one residue in AgRP2. The first loop has two
disulphide connectors with the active site loop, which contains the
R-F-F motif. The arginine (R) residue is large and basic, giving a
rotamer with large conformational potential. In AgRP, the active
site loop contains two small anti-parallel beta sheets, and an
internal disulphide connector between the beta sheets. This
disulphide bond is missing in many venom peptides. The R-F-F
motif is placed on the N-terminal side of the active site loop,
directly after the first beta sheet in the active site loop. The
disulphide connectors between the first loop and the active site
loop cross over each other, i.e. if the structure is viewed from top/
down, looking towards the two loops from top, the disulfide bonds
holding the two loops together from a cross. After leaving the
active site loop, there is a final cysteine holding the C-terminal
chain together with the peptide sequence that connects the two
loops.
The AgRP structure is similar to many known structures,
including a triple beta sheet containing gene product (16I7) from
polydnavirus, a virus which is transmitted during oviposition of
parasitic wasps. Other similar known structures include: sea
anemone toxin (1ANS), A. aperta calcium channel blocker (1AGG),
A. dohrni assassin bug saliva calcium channel blocker (1LMR), plant
sweet taste perception blocker (1C4E), central Asian spider P263
pain receptor blocker (2KGU), and palutoxin (a sodium channel
blocker). The greatest difference between AgRP and these toxins to
which it shows high similarity, is the absence of the disulphide
bond connecting the beta sheets, as well as the absence of the
disulphide bond holding the C-terminal chain more closely to the
Identification of Distant Agouti-Like Sequences
PLoS ONE | www.plosone.org 3 July 2012 | Volume 7 | Issue 7 | e40982

Identification of Distant Agouti-Like Sequences
PLoS ONE | www.plosone.org 4 July 2012 | Volume 7 | Issue 7 | e40982
knot structure. Plt-VI, despite being a spider venom peptide, has
10 cysteines, including the disulphide connector between the beta
sheets, and the disulphide connector holding the C-terminal chain
close to the knot.
Because AgRP2 and ASIP2 have a shortening of the first loop
by one residue (C-x(6)-C-x(5)-C, instead of C-x(6)-C-x(6)-C), we
wanted to know if this would affect the positioning of the beta
sheets or the active site. We considered the possibility that the
shorter first loop in AgRP2 could result in a re-positioning of the
active site or the beta sheets. Because the C-x(6)-C-x(6)-C
structure is one residue longer, we postulated that the peptide
sequence might buckle out more than the C-x(6)-C-x(5)-C
variant. In the structure model of Plt-VI, we noted a shortening
of the beta sheets in the active site loop, possible a result from
strain in the loop pulling the sheets apart. On the other hand,
in ASIP2, we noted the possibility of a third beta sheet in the
affected first loop, showing hydrogen bonding potential between
the beta sheets in the active site loop and the first loop.
7. Use of a Sinusoidal Hough Transform to Search forLinear Synteny between Human Chromosome 8, Region60–100 Mb, and Medaka Chromosomes 17 or 20
Medaka chromosomes (17 and 20) contain linear synteny (i.e.
a continuous block of orthologues in 2-dimensional scatter plots
of gene coordinates) with human chromosome 8, region 60–
100 Mb. Compared with medaka chromosome 17, medaka
chromosome 20 contains almost twice (44 compared with 25) as
many orthologues with the human chromosomal region, and the
proportion of these lying in the largest linear synteny block has
increased from 44% (11/25 on Ola 17) to 64% (28/44 on Ola
20) (see Table 2). The angle stated for (h) is the highest (or
furthest away from the horizontal plane) of the range of angle
bins that reach the stated level of (‘‘S’’). In this table (Table 2),
a filter is used to divide any clusters that contain a gap larger
than 5,000,000 basepairs. The remaining 22 medaka chromo-
somes that are not listed contain fewer than two orthologues
with the area of interest in the human genome, and are hence
not listed. The interpretation of this result is that the synteny
relationship between the recently proposed, ancestral A2 area in
the human genome (Hsa 8, 60–100 Mb) and medaka chromo-
somes 17 (containing AgRP2) and 20 (containing ASIP2), differs
both in the amount of orthologues, and in the amount of
orthologues placed in the largest linear synteny block. A two-
dimensional plot of gene start coordinates of orthologue pairs
between the area on Hsa 8 (60–100 Mb) and Ola 17 and Ola
20 illustrate the difference: while Ola 17 only contains some
small (containing 11 genes, or less) islands of synteny, the Ola
20 plot (data not shown) contains a large conserved cluster of
28 genes.
8. Evaluation of the Background Frequency of RandomlyPlaced 40 Mb-sized Windows from the Human Genomethat Contain More Synteny with Medaka Chromosome17 or 20, than Human Chromosome 8, Region 60–100 Mb
To obtain a statistical assessment of the proposed [16]
ancestral A2 area in the human genome, we used a sliding
window method, where a 40 Mb-sized window was placed
repeatedly at random locations in the human genome, however
not allowing any overlap with the area Hsa 8, 60–100 Mb. A
window was characterized as a ‘‘positive’’ hit, if it was found to
contain at least as many orthologues in synteny (meaning
orthologues placed in the same regions, but not necessarily
clustered in a 2-dimensional scatter plot of gene start
coordinates), for Ola 17 or Ola 20, respectively. By repeated
sampling, we could calculate a 95% confidence interval of the
Figure 1. Multiple sequence alignment showing shared and group-specific motifs between the Agouti-like sequences. We includesequences that are previously published or already known for AgRP and ASIP-like clusters. The alignment includes the newly identified Agouti-likesequences in arthropods and in fungi. The important C-x(6)-C and the C-x(5,6)-C motif regions are shown above the alignment. The sequences thathave the C-x(6)-C and C-x(5)-C motifs are distinguished with red and black dotted rectangular boxes, respectively. The residues that are conservedbetween the novel sequences and the different groups are shown with black rectangular boxes. The sequences that belong to different lineages areindicated with the colored line segments at the left of the alignment.doi:10.1371/journal.pone.0040982.g001
Table 1. Cysteine knots in spider toxins.
Species Cysteine knot structure
Tarantula (H. schmidti) C-x(6)-C-x(6)-C-C-x(4)-x(14)-C
Funnel web spider (A. robustus) C-x(6)-C-x(5)-C-C-x(3)-C-x(13)-C
King baboon spider (C. crawshayi) C-x(6)-C-x(5)-C-C-x(4)-C-x(6)-C
Chinese bird spider (O. hainana)1) C-x(6)-C-x(6)-C-C-x(4)-C-x(6)-C
Bird spider (C. guangxiensis)2) C-x(6)-C-x(5)-C-C-x(4)-C-x(6)-C
Funnel spider (A. orientalis) C-x(6)-C-x(7)-C-C-x(4)-C-x-C-x(5)-C-x-C
Yellow sac spider (C. punctorum) C-x(6)-C-x(6)-C-C-x(8)-C-x-C-x(8)-C-x-C
Wolf spider (L. singoriensis) C-x(6)-C-x(5)-C-C-x(4)-C-x-C-x(6)-C-x-C
ASIP2 (teleost-typical) C-x(6)-C-x(5)-C-C-x(5)-C-x-C-x(6)-C-x-C
Desert grass spider (A. aperta) C-x(6)-C-x(6)-C-x-C-C-x(5)-C-x-C-x(10)-C-x-C
Mojave Desert spider (P. tristis) C-x(6)-C-x(5)-C-C-x(2)-C-x(2)-C-x-C-x(6)-C-x-C-x(8)-C
AgRP2 (teleost-typical) C-x(6)-C-x(5)-C-C-x(2)-C-x(2)-C-x-C-x(6)-C-x-C-x(6)-C
1)The species that contains Hainantoxin-1.3.2)The species that contains Guangxiensistoxin.doi:10.1371/journal.pone.0040982.t001
Identification of Distant Agouti-Like Sequences
PLoS ONE | www.plosone.org 5 July 2012 | Volume 7 | Issue 7 | e40982

frequency of obtaining a positive hit for either Ola 17 or Ola
20, which depends on the sample size. The sampling was
carried out until a confidence interval had stabilized (see
Figure 4). The termination points for Ola 17 and Ola 20 was
N = 100 and N = 500, respectively. The confidence intervals of
the frequency of ‘‘positive’’ hits for Ola 17 and Ola 20 was the
following: f = 0.1000 for medaka chromosome 17 (95% CI:
0.04120.16); f = 0.0180 for medaka chromosome 20 (95% CI:
0.006320.030). The final proportions can be recalculated as
exact binomial confidence intervals using R 2.13.2 1-sample
proportions test with continuity correction: f = 0.1000 for
medaka chromosome 17 (exact binomial 95% CI:
0.05220.18); f = 0.0180 for medaka chromosome 20 (exact
binomial 95% CI: 0.008820.035). This means that the
probability for a randomly placed window in the human
genome to display an as large amount of synteny as in the
comparisons between Hsa 8 (60–100 Mb and Ola 17 or Ola
20, is about 10% for Ola 17, but less than 2% for Ola 20. This
highlights a statistical difference between these medaka chro-
mosomes in their similarity with the proposed ancestral area in
the human genome.
9. A Control Experiment to Test Degree of Clustering onMedaka Chromosomes 17 and 20, of OrthologuesLocated in the Region Hsa 8, 60–100 Mb
To investigate whether it would be possible to use ‘‘synteny DB
dotplots’’ to test suspected findings, such as the proposed ancestral
area [16], we devised a control experiment. The purpose of the
control experiment was to determine if the alleged ancestral area
indeed represented a clustering of genomic coordinates in both
query and target organisms. Thus, we attempted to reverse the
experiment shown in panel ‘‘C’’ in Braasch et al., by using the
O. latipes chromosomes as query, and Hsa 8 as target.
The dotplots of medaka 17 and 20, this time used as query
chromosomes against full-length Hsa 8, show a striking difference
in gene density, where the linear synteny area on medaka 20 now
manifests as a clearly visible cluster (located at 14–15.5 Mb in Ola
20). Medaka chromosome 17, on the other hand, shows no
Figure 2. Phylogenetic analysis of Agouti-like sequences. The unrooted maximum likelihood phylogenetic tree of Agouti-like sequences.Robustness of the nodes is tested with the posterior probabilities based on MCMC analysis as implemented in the MrBayes program. Both bootstrap(out of 500 replicates) and the posterior probability support were given in italics for the significant nodes. The posterior probability (1) of the A2 nodeis highlighted in red color. The tree is rooted on the node that clustered the consensus sequences, which serves as out-group.The tree shows that A2is likely to have branched from ASIP1.doi:10.1371/journal.pone.0040982.g002
Identification of Distant Agouti-Like Sequences
PLoS ONE | www.plosone.org 6 July 2012 | Volume 7 | Issue 7 | e40982

comparable high density area. Because no particular region can be
specified for chromosomes displayed on the y-axis in synteny
database dotplots, many of the points will represent genes not
located in the relevant region on Hsa 8. Furthermore, the
visualization method has no filter to identify linear synteny, or the
largest linear synteny block (‘‘S’’), as opposed to closely spaced
orthologs.
10. Synteny Dotplot Results Indicate that MultipleRegions in the Human Genome are Syntenic with theAgRP2 and ASIP2 Regions in Teleosts
Our experimentation confirms the previous result that the
teleost AgRP2 chromosomal region shares syntenies neither with
the teleost AgRP1 region nor with the tetrapod AgRP region [16].
Furthermore, our investigation of this gene family using synteny
data clearly indicates that the teleost AgRP2 chromosomal neither
shares syntenies with the teleost ASIP1 region nor with the
tetrapod ASIP region (Figure 5, Panel A). Therefore, the teleost
AgRP2 chromosomal does not share any syntenies with the AgRP
or ASIP regions in teleosts or tetrapods.
We can also confirm the previous result [16] that teleost
AgRP2 and ASIP2 regions show conserved synteny to a region
on human chromosome 8. However, our experimentation shows
that this is not the only ancestral region of interest in the
human genome. For example, we have identified an area on
human chromosome 10 (Hsa 10) (Figure 5, Panel B). The Hsa
10 area (3–43 Mb) shown contains 48 orthologues in synteny
Figure 3. Two-dimensional representation of the similarity relationships between the structure models of A1 and A2 inhibitorcysteine knots, as obtained by non-metric multidimensional scaling. The MDS fit measures (s-stress = 0.14, RSQ = 0.95) indicate that theinter-model distances in this configuration reflect well the original inter-model dissimilarity values. The figure is generated by a Perl script thatoutputs support vector graphics. The figure shows that AgRP2 is more ASIP-like, and ASIP2 more AgRP-like, The shift of the A2 points towards ASIPagrees with the Mr. Bayes phylogram. Ptr Plt-VI is more AgRP-like.doi:10.1371/journal.pone.0040982.g003
Table 2. Hough transform comparison of synteny between Hsa 8, 60–100 Mb, and Ola 17 and 20.
Chromosome Orthologues h r Biggest linear synteny block (‘‘S’’)
11 19 45.50 80.55 3
16 24 55.50 83.15 8
17 25 37.50 46.85 11
20 44 13.50 15.45 28
doi:10.1371/journal.pone.0040982.t002
Identification of Distant Agouti-Like Sequences
PLoS ONE | www.plosone.org 7 July 2012 | Volume 7 | Issue 7 | e40982

with Ola 20 (ASIP2) and 26 orthologues in synteny with Ola 17
(AgRP2), the highest recorded number of orthologues in synteny
with Ola 20 in the human genome. This is comparable to the
corresponding result for the Hsa 8 area (44 and 25 orthologues,
respectively) [16]. A set of markers from Hsa 10 are shown
(Figure 5, panel B): GPR158, ABI1 (Ola 20), YME1L1 (Ola 17/
20), RAB18 (Ola 17/20), WAC (Ola 17/20). RAB18 is located
2.1 Mb from ASIP2. There are several areas in the human
genome that exceeds the Hsa 8 (60–100 Mb) area for amount
of synteny with Ola 17, such as Hsa 19 (1–41 Mb), containing
58 orthologues with Ola 17. Analyzing the Hsa 10 region with
the Hough transform shows that this area contains 8 and 14
orthologues (with Ola 17 and Ola 20, respectively) in linear
synteny blocks, a result that can be compared with 11 and 28
orthologues, for the Hsa 8 area. This difference indicates that
the Hsa 8 area is highly syntenic with Ola 20. In fact, only one
other area in the human genome, at chromosome 3 (110 Mb–
150 Mb) is detected as containing more (30 orthologues in
linear synteny block) with Ola 20. Other areas containing
. = 11 orthologues in linear synteny with Ola 17 are found
using the Hough transform at approximately 10% of randomly
placed genomic windows in the human genome.
It is true that the previously identified regions [16] in the human
genome – Hsa 16 (AgRP region), Hsa 8, and Hsa 20 (ASIP region) –
most likely derived from a single ASIP/AgRP region on the
ancestral vertebrate proto-chromosome B. Furthermore, Hsa 10
(3–43 Mb) contains 48 and 26 orthologues in synteny with Ola 20
and Ola 17, respectively. Hsa 19 (1–41 Mb) contains 58
orthologues with Ola 17. Using the Hough transform, we
discovered an area on Hsa 3 (110–150 Mb) which contains more
than 30 orthologues in linear synteny with Ola 20. Thus, there are
Figure 4. Visual representation of the sampling process of thehuman genome. Visual representation of the sampling process of thehuman genome, where the x-axis represents the current sample sizeand the y-axis the frequency of windows that are characterized as‘‘positive’’ hits against either Ola 17 or Ola 20. For each placed 40 Mb-sized window, we characterize the window as being a positive hit toeither medaka chromosome 17 or 20, if it contains more orthologues(more synteny) with Ola 17 or Ola 20, and human chromosome 8,region 60–100 Mb. The error bars represent a 95% confidence intervalthat depends on the sample size; if the lower limit of a 95% confidenceinterval is negative, it is shaded on the mean. The sampling process wasterminated at N = 100 and N = 500, for medaka chromosome 17 and 20,respectively. The mean frequencies and 95% confidence intervals are, atthe termination points: f = 0.1000 for medaka chromosome 17 (95% CI:0.041220.1588); f = 0.0180 for medaka chromosome 20 (95% CI:0.006320.0297). We use a log scale for ease of reading.doi:10.1371/journal.pone.0040982.g004
Figure 5. Conserved synteny dot plots derived from the Synteny Database [17]. (A–C) Conserved synteny dot plots derived from theSynteny Database [17]. (A) The zebrafish AgRP2 region on Dre 2 (red box) shares conserved syntenies with neither the zebrafish ASIP1 region (Dre 6)nor with the human ASIP region (Hsa 20). (B) The AgRP2 and ASIP2 regions in medaka and other teleosts share conserved synteny with each other andwith a region on human Hsa10, including several AgRP2- and ASIP2-neighboring genes. (C) Analysis of the human genome shows that the AgRPregion on Hsa16 shows more paralogous connections to the inferred ASIP2 region on Hsa 8 than to the ASIP region on Hsa 20 (183 vs. 82 genes,respectively, not restricting Y-axis chromosomal regions).doi:10.1371/journal.pone.0040982.g005
Identification of Distant Agouti-Like Sequences
PLoS ONE | www.plosone.org 8 July 2012 | Volume 7 | Issue 7 | e40982

at least six regions in the human genome that indicate strong
syntenies to the regions containing AgRP2 and ASIP2. The AgRP
region in the human genome contains more (183 vs. 82 genes)
syntenies with the chromosome (Hsa 8) containing the inferred
ASIP2 region than the chromosome containing the ASIP region in
human (Figure 5, Panel C).
Considering the reconstruction data of the early vertebrate
and gnathostome karyotypes [20], it is clear that medaka
chromosome 17 contains the same gnathostome ancestor
chromosome elements as medaka 20:10, 3B, 7B, 7C. In
addition, medaka chromosome 17 contains the following
gnathostome ancestor chromosome elements: 1a, 1c, 19a, and
19c. The area on Hsa 10 where we found synteny with both
the AgRP2 and ASIP2, contains the gnathostome ancestor
chromosome 10 elements, and the area on Hsa 19 that we
found to have synteny with Ola 17 contains 19a, 19b, and 19c.
The region on medaka chromosome 3, containing AgRP1,
derives from a completely different region, the gnathostome
ancestor chromosome element 15. Among the previously
identified putative synteny regions and the ones that we have
identified here (see above) that contain Agouti-like areas in the
human genome (ie Hsa 3, Hsa 8, Hsa 10, Hsa 16, Hsa 19, Hsa
20), it is only Hsa 8 and Hsa 16 that are convincingly derived
from ancestral vertebrate proto-chromosome B which is found
in the amniote and osteichthyan ancestor. The other areas are
more likely related to J (proposed Hsa 3 area), E and D (Hsa 10
area), and A (Hsa 19 area). The regions containing the A2
genes in medaka are not only related to proto-chromosome B,
but also to A, E, and F. In Figure S2, it can be seen that of the
80 same-name orthologues that exist between Ola 17 and Ola
20, there are 3–4 linear synteny blocks in the region of
gnathostome ancestor elements 10, 3b, 7b and 7c. However,
our genes of interest, AgRP2 and ASIP2, are not located in or
near any such blocks.
Our efforts to trace A1 and A2 markers in teleosts and sea
lamprey can be found in the online material (Tables S1 and S2).
11. Search for A2-like Sequences in Little Skate, SpottedGar, and European Eel
In little skate, using build 2, we found one target sequence on
contig LSb2-ctg674736 (1474 - 1331). However, using build 1, we
found an additional target sequence: LER_WGS_1_CON-
TIG_1088548. Both of the sequences have the C-x(6)-C-x(6)-C
form, and the R-F-F form of the functional motif. No A2-type
sequences are found in this organism.
We were able to locate the full-length ASIP, on the following
contigs: 1656154/AESE011535652 (start of the sequence),
1715056/AESE011594554 (middle exon), and 1088548/
AESE011079059 (the cysteine knot).
In spotted gar, we found one A2-like sequence on
AHAT01017486.1, and we TPA annotated this finding as:
BR000972. The contig contains ATP6V0D2, an AgRP2 marker
in teleosts. The sequence has the R-F-F form of the functional
motif, and the the C-x(6)-C-x(5)-C form of the cysteine knot. The
sequence contains the middlemost and last cysteines (AgRP2
feature). Spotted gar also contains the normal AgRP and ASIP.
In European eel, we found four scaffolds that contain Agouti-
like genes: scaffold9054, scaffold1167, scaffold3173, scaf-
fold1776. Two of these (on scaffolds 9054 and 1167) sequences
have the C-x(6)-C-x(5)-C form of the cysteine knot, and both
contain the the R-F-F form of the functional motif. For the
9054 scaffold, we were able to use GenScan to find a 3 exon
full-length sequence. One of the A2 sequences in eel apparenly
lacks the last cysteine.
Discussion
The lack of sequences has hampered studies of the evolution of
the Agouti-like peptides. We therefore expanded the sequence
pool of vertebrate Agouti-like sequences, which in turn enabled us
to develop a sensitive, profile-hidden Markov model for long-range
searches. Using these models and PHI-BLAST searches, we
surprisingly found eight novel homologues from the phylum
arthropods and three from the phylum ascomycota in the fungi
kingdom that have similarities with Agouti-like peptides. Impor-
tantly, the sequences in arthropods have the characteristic C-x(6)-
C-C motif which are present in the Agouti-like sequences. The
three sequences from fungi have however the longer C-x(8,9)-C-C
motif instead of the C-x(5,6)-C-C motif but these three sequences
have also the C-[VI]-P motif and the C-A motif that are conserved
in most of the AgRP and ASIP-like sequences. These sequences do
not only share these characteristic motifs (see Figure 1) but they
also have the approximate sequence length (about 130 amino
acids), and positioning of the motif sequence, i.e. in the end, that
matches the vertebrate Agouti-like sequences. Moreover, we found
that two of the sequences, one from the African malaria mosquito
(A. gambiae, A0NF98) and another one from the Southern house
mosquito (C. quinquefasciatus, B0W1P) share exon-intron structures
that are similar to the other Agouti-like peptides (online appendix,
Figure S1), providing further support for the common origin of
these sequences. The sequence that is the most similar to any
vertebrate Agouti-like sequence is a venom peptide from Mojave
Desert spider (P. tristis) that contains a cysteine knot identical to
AgRP2. It is unlikely that these Agouti-like sequences in arthropods
or in fungi are functioning through MC receptors as the most
ancient evidence of the MC receptors is found in sea lamprey [15].
Moreover, inhibitor cystein knot (ICK) structures in spider venom
peptides are thought to give the proteins stability and protection
against proteases, and in spiders, ICK proteins are known to block
ion channels, not GPCRs [21].
We made a large effort to annotate a number of vertebrate
Agouti-like sequences. We have added more than twice as many
new A2 sequences from different sources such as from mining of
new genomes (Atlantic cod AgRP2 and ASIP2, and tilapia AgRP2
and ASIP2), experimental sequencing (European sea bass AgRP2),
and by using ESTs imported from Kurokawa et al. [11,22]
(African cichlid ASIP2, trout AgRP2 and salmon AgRP2). The new
sequences give us a more complete view of which sequence motifs,
and which exon-intron structures, are typical of A2 sequences. The
larger A2 sequence pool has allowed us to identify a new A2 motif,
present in the second coding exon of all known A2 sequences, ‘‘L-
F-A-R’’ (identified using Multiple ‘Em’ for Motif Elicitation).
Furthermore, in the A2 cysteine knot (which starts with C-x(6)-C-
x(5)-C, not C-x(6)-C-x(6)-C), we show that the R-L-F motif is
indicative of the sequence being AgRP2, and R-F-F of ASIP2.
Otherwise the R-F-F is normally indicative of AgRP1 (and R-L-F
of ASIP1) in teleosts, in contrast to the current names AgRP2 and
ASIP2, but the change from R-F-F to R-L-F can be accomplished
by a single nucleotide change.
Then we performed phylogenetic analysis and 3D structural
modeling of these sequences. The arthropod and fungi sequences
do not show a phylogenetic relationship to any of the specific sub-
branches of the Agouti-like sequences (i.e. AgRP, ASIP or A2) but
group in a special branch outside of the vertebrate tree (data not
shown). However, the non-vertebrate sequences provide a very
good root for the vertebrate tree, in line with the ‘‘ancestral’’
character of the sequences. The phylogenetic analysis shows that
the AgRP sequences cluster basally in the tree, suggesting that these
sequences split from a cluster containing both the ASIP and the A2
Identification of Distant Agouti-Like Sequences
PLoS ONE | www.plosone.org 9 July 2012 | Volume 7 | Issue 7 | e40982

sequences. Later the ASIP and A2 split, and then the A2 split into
the AgRP2 and ASIP2. This is in good agreement with the
phylogeny presented previously by Braasch et al. [16], Kurokawa
[11] and us [12]. The suggestion that AgRP is the most ancient of
these branches and that ASIP is more closely related to A2 is also
supported by the intron structure of AgRP, which is much more
compact than the one of A2 or ASIP. It seems without a doubt that
the AgRP2 and ASIP2 peptides have a common origin. This
conclusion is also supported by our structural modeling. Protein
structure prediction is generally not considered an alternative to
resolving phylogenetic problems [23]. In this case, however,
because the cysteine knot structure is highly conserved and
structurally constrained by the disulfide bonds, the influence the
interspersed residues can be modeled with a higher accuracy than
many other structures. By limiting the modeling exercise to the
cysteine knot region only, we obtained a set of theoretical structure
models that could be compared by structure superposition, and
root-mean square deviation (RMSD) comparison. The resulting
set of pairwise RMSD distances could be analyzed using
multidimensional scaling in the statistics package SPSS 17.0,
obtaining a clustering where the RSQ (.0,87) and S-stress (,0,18)
indicators showed good clustering. The multidimensional scaling
showed that AgRP2 and ASIP2 are fairly similar, while the AgRP
and ASIP clusters are most dissimilar. Interestingly the Agouti-like
sequence from the Mojave Desert spider fell within the distances of
the structures from the vertebrate Agouti-like peptides, providing
further support to the conclusion that the arthropod sequences
share a common origin with the vertebrate ones.
Synteny analysis of large chromosomal regions is difficult for
many reasons: there is a lack of reliable tools that provide an
objective measurement of synteny, certain synteny always occurs
at random, most synteny regions contain genes that are not
duplicated by block duplications events, and the objectivity of
synteny of few genes among many can be questioned. At the same
time, synteny is a unique way to establish how genes or
chromosomal regions may have been copied through evolution.
Here we used a new approach to look at the statistical evidence for
synteny, a sinusoidal Hough transform pattern recognition
technique that is able to detect co-linearities of points in two
dimensions (see Materials and Methods). We compared the
number of orthologues between all permutations of teleost
chromosomes (from the species Dre, Gac, Ola, and Tni)
containing Agouti genes (online appendix, Table S1), and noted
a higher amount of synteny between A2 containing chromosomes,
contrasted to A1 chromosome comparisons. Using a large sample
of 40 Mb-sized human genomic windows, we found that there is a
high difference in the probability of encountering a comparable
amount of synteny between the medaka chromosomes 17 (AgRP2)
or 20 (ASIP2) and the Hsa 8 (region 60–100 Mb), being 10% for
the comparison with medaka chromosome 17 to only 2% for the
comparison with medaka chromosome 20 (see Figure 4). These
results challenge the conclusion of Braasch et al., because we find
no evidence of a comparable, and significant amount of synteny to
both the medaka chromosomes as suggested by Braasch et al. [12].
While our analysis confirms the synteny of Hsa 8 with teleost
AgRP2, our experimentation shows that this is not the only
ancestral region of interest in the human genome. For example, we
have identified an area on human chromosome 10 (Hsa 10) [See
Fig. 5, Panel B]. The Hsa 10 area (3–43 Mb) shown contains 48
orthologues in synteny with Ola 20 (ASIP2) and 26 orthologues in
synteny with Ola 17 (AgRP2), which has the highest recorded
number of orthologues in synteny with Ola 20 in the human
genome. This is comparable to the corresponding result for the
Hsa 8 area with 44 and 25 orthologues, respectively (Braasch et al.)
[16]. The figure shows a set of markers that are present on Hsa 10,
including: GPR158, ABI1 (Ola 20), YME1L1 (Ola 17/20), RAB18
(Ola 17/20), WAC (Ola 17/20), where RAB18 is 2.1 Mb from
ASIP2. There are also several areas in the human genome that
exceed the Hsa 8 (60–100 Mb) area for amount of synteny with
Ola 17, such as Hsa 19 (1–41 Mb), containing 58 orthologues with
Ola 17. Analyzing the Hsa 10 region with the Hough transform
shows that this area contains 8 and 14 orthologues with Ola 17
and Ola 20, respectively, in linear synteny blocks, a result that can
be compared with 11 and 28 orthologues, for the Hsa 8 area.
Other areas containing . = 11 orthologues in linear synteny with
Ola 17 are found using the Hough transform at approximately
10% of randomly placed genomic windows in the human genome.
Moreover, using the Hough transform, we discovered an area on
Hsa 3 (110–150 Mb) which contains more than 30 orthologues in
linear synteny with Ola 20. Thus, there are at least six regions in
the human genome that indicate some syntenies to the regions
containing AgRP2 and ASIP2. It is well established that medaka
chromosomes 17 and 20 derive partly from gnathostome
chromosomal elements 19c and 10 [20] that among other genetic
elements, in turn may be part of a vertebrate proto-chromosome
B. The origin of this region is much older than any trace of
vertebrate Agouti-like peptides. However, we do not see any
evidence that the ASIP and AgRP are found in any of the regions
that are related to these regions in humans, which is generally
considered to be the prerequisite for genes that have their origin in
the tetrapliodizations events like the Hox genes [24,25].
We find that while there is synteny imprint evidence for a
common origin of A2 genes (for example, Ola 20 (ASIP2) shares
.80 orthologues with Gac III (AgRP2)), much less points to a
common origin of AgRP1 and AgRP2 (only 1–15 orthologues
shared between relevant chromosome pairs). Recently, the sea
lamprey genome was moved from ‘‘Pre ENSEMBL’’ (on
September 16, 2011). The assembly into contigs of up to
.1 Mb presents a new opportunity for us to trace the
conservation of the synteny pattern prior to the teleosts.
Interestingly, we found that in lamprey, there are 15 contigs that
exclusively link AgRP2 and ASIP2 (see e.g. GL483536 or
GL476773 in online appendix; Table S2), but only 7 contigs that
exclusively link AgRP1 and AgRP2. These results provide further
support for a block duplication of the region containing AgRP2 and
ASIP2. Importantly, lamprey split from the lineage leading to the
tetrapods before the 2R and surely before the 3R suggesting that
the split of AgRP1 and AgRP2 did not happen through the two (or
three) rounds of genome duplications.
Overall, our specific chromosomal region analysis in this study
suggest that we are not able to find synteny imprints that would
support that the A2 genes would have a specific synteny in the
human genome, a key evidence for the hypothesis about the
evolution of the Agouti genes presented by Braasch et al. This is in
sharp contrast to many well-documented cases, which have gone
from 1 to 2 to 4 to 8, minus some losses, including Hox [26], ion
channels [27], opioid receptors [28], neuropeptide Y receptors
[29], IGF-BP [30], and the endothelin system [31]. It is difficult to
prove that the evolution could not have occurred according to the
scheme that is presented by Braasch et al. However, we find this
scheme very unlikely due to the following reasons: 1) The synteny
analysis does not provide evidence that ASIP, AgRP and A2 genes
are three arms that resulted from a whole genome duplications
(2R), 2) The scheme suggests that there are losses of four major
branches, i.e. ohnologs gone missing from R2 duplication of
ancestor to AgRP, OGM form tetrapod A2 duplication as well as
3R genes for ASIP1 and AgRP1, 3) The conserved synteny found in
lamprey as well as the finding of ASIP2 in lobe finned fish
Identification of Distant Agouti-Like Sequences
PLoS ONE | www.plosone.org 10 July 2012 | Volume 7 | Issue 7 | e40982

(coleacanth, Sarcopterygii), a linage that split from the lineage
leading to mammals, after the split of teleosts, suggests that the A2
genes existed before 3R, 4) The absence of Agouti 2-like sequences
in Chondrichthyes, such as the spiny dogfish does not support the
conclusion that the 2R are important for the creation the Agouti
peptide family.
In conclusion, here we provide a comprehensive analysis of the
current set of Agouti-like sequences. There is considerable
evidence that we have found Agouti-like sequences beyond the
vertebrate kingdom. It is possible that these sequences originated
through horizontal gene transfer, but this remains to be
determined. We find that while it is theoretically possible that
the evolutionary model proposed by Braasch et al. describes the
order of events within the Agouti peptide evolution, the scenario is
very improbable. We find that more likely, Agouti-like peptides,
like most vertebrate gene families, were formed through classical
subsequent gene duplications where the AgRP is likely to be the
most ancestral, first splitting from a common ancestor to ASIP and
A2 and then later the A2 split from ASIP followed by a split
resulting in ASIP2 and AgRP2. The finding of a single copy of
AgRP2 in spotted gar and double copies of A2 in European eel
appear consistent with a 3R origin, but the position of the AgRP2
and ASIP2 genes outside linear synteny blocks on their respective
TSGD-duplicated chromosomes in Medaka could suggest a
random copying event into the TSGD chromosomal context.
Materials and Methods
1. Database Annotation of A1 and A2 SequencesPlease refer to the online appendix (Table S3), for details.
2. Experimental Determination of European Sea Bass (D.Labrax) AgRP1, AgRP2, ASIP1; Turbot (S. Maximus) ASIP1;Solea (S. Senegalesis) ASIP1
Turbot (HE598752) and sole (HE598753) ASIP1 and sea bass
AgRP1 (HE660086) cDNAs were cloned by RT-PCR using
degenerate primers followed by RACE-PCR. Sea bass ASIP1
sequence (FM021895) covering the full coding sequences were
obtained from NCBI blasting against expressed sequence tags
(EST) database. Specific primers were then designed to amplify
the sequence that was cloned into pGemT easy vector and
sequenced. Sea bass AgRP2 sequence (HE660087) was obtained
from restricted access Aquagenomic databases (http://www.
aquagenomics.es). As before specific primers were designed to
clone and verify sea bass AGRP2 sequence.
3. Use of HMM to Search for Agouti-like SequencesWe constructed separate HMMs (hidden Markov models) for
AgRP, AgRP1, AgRP2 and for ASIP, ASIP1 and ASIP2 clusters using
the HMMER3 software. These separate HMM models were used
to search against the UniProt database restricted to a sequence
length that range , = 150 residues. A total of 1,240,895 sequences
that are longer than 150 residues long were aligned with six
different HMM models using the HMMSEARCH program with
an E-value cutoff of 0.001. The search obtained sequences that
were already known but also eight novel sequences from the
phylum arthropoda and three sequences from the phylum
ascomycota of the fungi kingdom.
4. PHI-BLAST Search of A2-like SequencesWe used PHI-BLAST 2.2.25+ to query the ‘‘nr’’ database (all
non-redundant GenBank CDS features), using agouti related
protein-2 from S. salar as query, filtering against false positives
using the PHI pattern C-x(6)-C-x(5)-C-C-x(2)-C-x(2)-C-x-C-x(6)-
C-x-C-x(6,8)-C, and reporting sequences with the pattern at
position 75 and E-value WORSE than the threshold ( = 10). This
is to allow for length variability in the last inter-cysteine segment,
which has the length 8 in chicken, and the length 9 in human or
mouse. Furthermore, we compared the 1,357 spider toxin
sequences found in the ‘‘Protein’’ database (NCBI), with Atlantic
cod ASIP2 (and torafugu ASIP2).
5. Phylogenetic Analysis of A1, A2, and Agouti-likeSequences
A multiple sequence alignment was generated for the final set of
AgRP and ASIP like sequences using MAFFT version 6 with the E-
INS_I version having default parameters. The alignments were
inspected and edited using Jalview (v. 2.6.1). The phylogenetic
analysis was performed using a Bayesian approach as implemented
in MrBayes version 3.1.2. Markov Chain Monte Carlo (MCMC)
analysis was used to approximate the posterior probabilities of the
trees. Analysis was run using a gamma shaped model for the
variation of evolutionary rates across sites (rates = gamma) and the
mixed option (aamodelpr = mixed) was used to estimate the best
amino acid substitution model. Each analysis was set to run for
3,000,000 generations and every hundredth tree was sampled. A
stop rule was applied to determine when to terminate the MCMC
generations as recommended in the MrBayes manual (standard
deviation of split frequencies ,0.01). If the MCMC analysis does
not hit the stop value within the default number of generations,
additional generations were run for it to reach the minimum split
frequencies. The first 25% of the sampled trees were discarded
(burnin = 0.25) to reassure a good sample from the posterior
probability distribution. A consensus tree was built from the
remaining 75% of the sampled trees with the MrBayes sumt
command using the 50% majority rule method. The sump
command was used to control so that an adequate sample of the
posterior probability distribution was reached during the MCMC
procedure. The phylogenetic tree was drawn in FigTree 1.3.1
(http://tree.bio.ed.ac.uk/software/figtree/).
To root the tree, consensus sequences from arthropods used in
the phylogenetic analysis were generated using HMMEMIT from
HMMER3 package. First, the sequences that belong to the
arthropod sequences identified in UniProt search and the spider
sequences were aligned separately and separate HMM profiles
were built from those alignments. Each HMM profiles serves as an
input for the HMMEMIT program and a consensus sequence.
were obtained using option ‘‘2C’’ as implemented in the
HMMER3 package. The consensus sequence is formed using a
plurality rule that selects the maximum probability residue at each
match state from the HMM profiles.
6. Structure Modeling of ‘‘A2’’ Sequences andMultidimensional Scaling of RMSD Results
The three-dimensional structure of cysteine inhibitor knots
(receptor binding domain) of 22 sequences was modeled using
HHpred, http://toolkit.tuebingen.mpg.de/hhpred (Release-
2.14.0), and MODELLER 9v3, 2008/02/01, r5971 [32]. The
sequences were: Cmi AgRP (40 residues, ending in cys); Cmi ASIP
(40 residues, ending in cys); Dre AgRP2 (39 residues, ending in cys);
Dre AgRP1 (40 residues, ending in cys); Dre ASIP1 (40 residues,
ending in cys); Ola AgRP2 (39 residues, ending in cys); Ola AgRP1
(40 residues, ending in cys); Ola ASIP2 (39 residues, ending in cys);
Tru AgRP1 (40 residues, ending in cys); Tru AgRP2 (39 residues,
ending in cys); Tru ASIP1 (40 residues, ending in cys); Tru ASIP2
(39 residues, ending in his); Tni AgRP2 (39 residues, ending in cys);
Identification of Distant Agouti-Like Sequences
PLoS ONE | www.plosone.org 11 July 2012 | Volume 7 | Issue 7 | e40982

Tni AgRP1 (40 residues, ending in cys); Tni ASIP2 (39 residues,
ending in his); Tni ASIP1 (40 residues, ending in cys); Gac AgRP1
(40 residues, ending in cys); Gac AgRP2 (39 residues, ending in cys);
Gac ASIP1 (40 residues, ending in cys); Gac ASIP2 (37 residues,
ending in ala); Dla AgRP2 (39 residues, ending in cys); Mojave
Desert spider (P. tristis; ‘‘Ptr’’) venom peptide ‘‘Plt-VI’’ (41 residues,
ending in cys).
HHpred was used with the realign with MAC option, max. 3
HHbit iterations, scoring secondary structure, using local align-
ment mode, and searching against: PDB 70 18 June 2011.
MODELLER 9v3, 2008/02/01, r5971, was used with default
settings, manual template selection, selecting either ASIP (1y7j)
(ASIP) or AgRP (1hyk) for A1 sequences and using the best
template for A2 sequences, generating 22 PDB files. Pairwise
global root-mean-square deviation (RMSD), based on a-carbons
in all pairs of superposed structures, was obtained from SuperPose
version 1 (http://wishart.biology.ualberta.ca/SuperPose/) using
default settings [33]. The MatchMaker function in UCSF
Chimera 1.5.3rc (http://www.cgl.ucsf.edu/chimera/docs/credits.
html), an extensible molecular modeling system, was used to create
a portable network image of Ptr Plt-VI (41 residues, ending in cys),
using its closest neighbor in terms of RMSD distance, as a
reference for superposition. Non-metric multidimensional scaling
was performed using the ALSCAL algorithm [34], as implement-
ed in SPSS Statistics 17.0, with the s-stress convergence parameter
set to 0.001, and min s-stress = .0.005. RMSD values were
treated as a measure of dissimilarity. We used a square symmetric
data shape; after 6 iterations, s-stress improvement was less than
the threshold. A Perl script was used to convert the MDS
coordinates to support vector graphics.
7. Use of a Sinusoidal Hough Transform to Search forLinear Synteny Between Human Chromosome 8, Region60–100 Mb, and Medaka Chromosomes 17 or 20
Data was obtained from BioMart (http://www.biomart.org),
using the ENSEMBL Genes Sanger 63 (Sanger UK) datasource,
selecting as organism either H. sapiens (Hsa GRCh37.p3) or
O. latipes (Ola HdrR). For human, only chromosome 8, region 60–
100 Mb is selected. For medaka, chromosomes 17 and 20 are
selected. From each organism, the following BioMart data fields
are selected: chromosome name, gene start (bp), and ‘‘associated
gene name’’.
A Perl script is used to parse these data, simplifying the
‘‘associated gene name’’ to the first word, and excluding certain
classes of genes that are likely to have ambiguous names (the
source code is available upon request). Then, we define
orthologues as genes that have the same name between Hsa 8
and Ola 17 or Ola 20. We create two scatterplots diagrams, one
for orthologues between Hsa 8, region 60–100 Mb, and Ola 17 or
Ola 20, respectively. In the scatterplots, the x and y coordinates of
each point represents the gene start location in human and
medaka.
Each point in the scatterplots can be transformed into a
sinusoidal curve in a new system of polar coordinates (h, r), where
h represents an angle and r represents a radius from the origin,
using Duda and Hart’s version of the Hough transform [18]. The
corresponding formula is (eq. 1):
x cos qzy sin q~r ð1Þ
The transformation has the property that any collection of
collinear points in the scatterplot will be transformed into
sinusoidal curves that intersect at a common point in the polar
coordinate space. Near collinearities in the scatterplot can be
detected by finding regions in the polar coordinate space through
which many sinusoidal curves pass.
We employ a simple sliding window approach to detect such
regions. We divide the range of angles h M (0,180) into 180 bins of
width 1 degree, and identify each bin with the angle at the
midpoint of the range it spans. Since the values of the radius r are
roughly of the same order of magnitude as the original gene start
locations x and y, we divide the r dimension into bins of width
100,000. Given that 100,000 base pairs is a reasonable distance
between a pair of genes in a linear synteny block, it is used here as
our default setting for this parameter.
Given the sizes of the chromosomal regions being compared, we
have found empirically that a range from r M (240 Mb, +100 Mb)
is sufficient to cover the values of r at which sinusoidal curves
intersect. We will divide this range into 1400 bins of width 0.1 Mb,
and identify each bin with its midpoint value of r. We partition the
transform space into cells, where (h, r) M (0,180) 6 (240,100) into
cells of the form Ci,j = (i,i+1) 6 (240+0.1j, 239.9+0.1j), for all 0#
i ,180 and 0# j ,1400. Each cell Ci,j corresponds to a potential
collinearity along the line: x cos hi + y sin hi = rj, where h I = i+0.5
and rj = 239.95+0.1j.
In order to determine collinearities within the original
scatterplot diagram, for each sinusoidal curve we identify those
cells that are intersected by the curve and increment a counter for
each of these cells. All combinations of all cells and all sinusoidal
curves are evaluated leading to final intersection count of Oi,j for
each cell Ci,j.
Given the large evolutionary distance between human and
medaka (divergence time = 454.9 Mya), and the relatively small
region considered on the human chromosome (40 Mb), it is
presumed that in many cases, the largest amount of linear synteny
(denoted ‘‘S’’) will give a clear indication of the total amount of
linear synteny in the regions being compared. While the count of
orthologues in the largest linear synteny block returned by our
script would mask a potential second best area of linear synteny, it
would clearly recognize the difference between a case where there
is no linear synteny and a case where there is some (or a large
amount of) linear synteny. Another caveat is that it does not
analyze the degree of clustering along the line that goes through
the cluster, but given the small angle increments and the limited
region considered in human, the problem of detecting linearly
placed but not closely clustered points appears very limited. Thus,
we have defined a simple procedure to diagnose scatterplots
showing locations of orthologues in organisms, that uses as few
parameters as possible.
We apply the above method to compare human chromosome 8,
region 60–100 Mb, and medaka chromosomes 17 or 20. As a
comparison, we also compare human chromosome 8, region 60–
100 Mb, with medaka chromosomes 11 and 16 in the same way
(data is obtained and preprocessed as described for medaka
chromosome 17 or 20). For each comparison, we also report the
number of orthologues.
8. Evaluation of the Background Frequency of RandomlyPlaced 40 Mb-sized Windows from the Human Genomethat Contain More Synteny with Medaka Chromosome17 or 20, than Human Chromosome 8, Region 60–100 Mb
Data was obtained from BioMart (http://www.biomart.org),
using the ENSEMBL Genes Sanger 63 (Sanger UK) datasource,
selecting as organism either H. sapiens (Hsa GRCh37.p3) or
Identification of Distant Agouti-Like Sequences
PLoS ONE | www.plosone.org 12 July 2012 | Volume 7 | Issue 7 | e40982

O. latipes (Ola HdrR). For human, all chromosomes are selected.
For medaka, chromosomes 17 and 20 are selected. Data is
obtained and preprocessed as described above.
Genomic windows of size 40 Mb are randomly placed on the
human genome, using a Perl script. The windows are not allowed
to overlap with human chromosome 8, region 60–100 Mb, or to
overshoot chromosome ends. Each window is characterized as a
positive hit to either chromosome 17 or 20 in medaka, if the
number of orthologues in the region exceeded the amount of
synteny observed in with human chromosome 8, region 60–
100 Mb.
After sampling (N) windows, we can calculate a frequency (f) of
observing ‘‘positive’’ windows for either chromosome 17 or 20 in
medaka. We can calculate a 95% confidence interval that depends
on the sample size, resting on the normal approximation of the
binomial distribution, using the standard formula (eq. 2):
f+1:96|
ffiffiffiffiffiffiffiffiffiffiffiffiffiffiffiffiffiffiffiffiffif |(1{f )
N
rð2Þ
Given the number (24) and size range (50–250 Mb) of human
chromosomes, 100–250 randomly placed windows of size 40 Mb
would appear to give an excellent sampling of the genome.
However, we continue the sampling process and follow the
behaviour of the 95% confidence interval until it stabilizes, at
which point we terminate the process. The sampling process is
visualized using GraphPad Prism 5. The use of the normal
distribution assumes that the proportions of positive and negative
windows are not exceedingly close to zero.
9. A Control Experiment to Test Degree of Clustering onMedaka Chromosomes 17 and 20, of OrthologuesLocated in the Region Hsa 8, 60–100 Mb
To further investigate the 2-dimensional clustering of ortholo-
gues in the ancestral area on Hsa 8, we attempted to reverse the
source and outgroup genomes in synteny database dotplots. The
goal was to test if the observed clustering would be visible.
We generated a dotplot using ‘‘synteny DB dotplots’’ (http://
teleost.cs.uoregon.edu/dotplots/), setting the source genome to
Ola and the outgroup to Hsa, using the following settings: Ens61;
X axis: Source; Y axis: Outgroup; Image type: Dotplot; Scale to
chromosome length: no; Highlight gene of interest: no; X-axis
chromosome: 17 or 20.
10. A Control Experiment to Evaluate the SyntenyDotplot Set of Braasch et al
We took the first panel of Braasch et al. and switched the query
region to AgRP, instead of ASIP. This is because since Braasch et al.
noted that there was no similarity between the AgRP2 region in
zebrafish and the AgRP region in human. However, we wanted to
evaluate whether there was similarity between the AgRP2 region in
zebrafish and the ASIP region in human. Furthermore, we
scanned the human genome for randomly placed 40 Mb-sized
windows that superseded the ancestral Hsa 8 (60–100 Mb) area
presented by Braasch et al. in one of the following ways: 1)
Exceeding the amount of synteny with both Ola 17 and Ola 20
simultaneously, 2) Exceeding all windows in the human genome
for synteny with Ola 17, 3) Exceeding all windows in human
genome for linear synteny with Ola 20 (evaluated using Hough
transform). Finally, we re-evaluated the similarity of the ancestral
Hsa 8 (60–100 Mb) area presented by Braasch et al., not
comparing it with ASIP (to which Braasch et al. noted similarity),
but to the AgRP region in human. We generated dotplots (Figure 5,
panels A–C) using ‘‘synteny DB dotplots’’ (http://teleost.cs.
uoregon.edu/dotplots/), setting the source genome to Dre/Ola/
Hsa, and the outgroup to Hsa, using the following settings: Ens61;
X-axis: outgroup; Y-axis: source; Image type: Dotplot; Scale to
chromosome length: no; Highlight gene of interest: no (but in
panel B, using: GPR158, ABI1, YME1L1, RAB18, WAC); X-axis
chromosome: Hsa 20 (30–50 Mb)/Hsa 10 (3–43 Mb)/Hsa 16
(55–75 Mb).
11. Search for A2-like Sequences in Little Skate, SpottedGar, and European Eel
The little skate genome (http://skatebase.org/), Leucoraja
erinacea, has recently become available. Little skate is a cartilagious
fish that belongs to the Elasmobranchs (as opposed to the
Holocephali, which include elephant shark, the genome currently
considered to contain the most ancient copy of AgRP and ASIP).
The spotted gar (Lepisosteus oculatus) and European eel (http://
www.eelgenome.com/), Anguilla anguilla, genomes represent the
last and first sequenced genomes to diverge before and after 3R
whole genome duplication. We obtained query sequences of
AgRP1, AgRP2, ASIP1, and ASIP2 from Fugu to search for
Agouti-like sequences, using TBLASTN, as well as full-length
ASIP from elephant shark.
Supporting Information
Figure S1 Schematic presentation of the exon-intronarchitecture of Agouti genes. Boxes represent exons and
connecting lines represent introns (representation does not
correspond to their lengths). The forward slash between the
nucleotide bases represent the intron positions. The gene structure
that is available for the Agouti-like sequences in the arthropods
was shown. B0W1P2 is from C. quinquefasciatus and A0NF98 is
from A. gambiae.
(TIFF)
Figure S2 Overview of orthologues located on Ola 17and Ola 20. The graph shows the gene start coordinates of same-
name orthologues between medaka chromosome 17 (ancestral
gnathostome chromosome element 1a, 1c, 19a, 19c, 10, 3b, 7b, 7c)
and 20 (ancestral gnathostome chromosome element 10, 3b, 7b,
7c). The location of AgRP2 and ASIP2 is indicated with red bars. In
the 10, 3b, 7b, and 7c region, 3–4 blocks of linear synteny can be
seen, including e.g. EMILIN1, which is surrounded by same-name
orthologues in a genomic window centered on this gene on both
Ola 17 and Ola 20 (data not shown). However, only few of these
genes (NCOA2, TRIM55, ARMC1, IMPA1, CRISPLD1, and
RALYL) are found on the Hsa 8 (60–100 Mb) region. Although
these results do not entirely rule out the possibility of teleost-
specific genome duplication (TSGD) of our genes of interest,
AgRP2 and ASIP2, they are clearly not located in a linear synteny
block.
(TIFF)
Table S1 Orthologue counts between A1- and A2-containing teleost chromosomes.
(DOCX)
Table S2 Sea lamprey contigs sharing orthologues withA1 or A2-containing teleost chromosomes.
(DOCX)
Table S3 1) The comment field is accession number to
previously existing related entries, such as machine annotated
entries that could be replaced by our TPA entries or constitute
Identification of Distant Agouti-Like Sequences
PLoS ONE | www.plosone.org 13 July 2012 | Volume 7 | Issue 7 | e40982

genomic mappings of expressed sequence tags. 2) Included in
Figure 1. 3) Included in Figure 2.
(DOCX)
Acknowledgments
We thank Markus Sallman Almen, Uppsala University, for help with
structure modeling, advice on phylogeny and sequence search, Asa
Vernby, Statisticon, Stockholm, for help with calculation of exact
confidence intervals, Takehide Kosuge, DNA databank of Japan, for help
with TPA annotations in public databases, and Hiromi Ichikawa, for help
with RMSD-scaling.
Author Contributions
Conceived and designed the experiments: AV AK MEH JMCR RF HBS.
Performed the experiments: AV AK MEH JMCR. Analyzed the data: AV
RF HBS. Contributed reagents/materials/analysis tools: MEH JMCR.
Wrote the paper: AV AK MEH JMCR RF HBS.
References
1. Lu D, Willard D, Patel IR, Kadwell S, Overton L, et al. (1994) Agouti protein is
an antagonist of the melanocyte-stimulating-hormone receptor. Nature 371:
799–802.
2. Shutter J, Graham M, Kinsey AC, Scully S, Luthy R, et al. (1997) Hypothalamic
expression of ART, a novel gene related to agouti, is up-regulated in obese and
diabetic mutant mice. Genes Dev 11: 593–602.
3. Ollmann MM, Wilson BD, Yang YK, Kerns JA, Chen Y, et al. (1997)
Antagonism of central melanocortin receptors in vitro and in vivo by agouti-
related protein. Science 278: 135–138.
4. Craik DJ, Daly NL, Waine C (2001) The cystine knot motif in toxins and
implications for drug design. Toxicon 39: 43–60.
5. Schioth HB, Haitina T, Ling MK, Ringholm A, Fredriksson R, et al. (2005)
Evolutionary conservation of the structural, pharmacological, and genomic
characteristics of the melanocortin receptor subtypes. Peptides 26: 1886–1900.
6. Cerda-Reverter JM, Haitina T, Schioth HB, Peter RE (2005) Gene structure of
the goldfish agouti-signaling protein: a putative role in the dorsal-ventral
pigment pattern of fish. Endocrinology 146: 1597–1610.
7. Cone RD (2005) Anatomy and regulation of the central melanocortin system.
Nat Neurosci 8: 571–578.
8. Cerda-Reverter JM, Peter RE (2003) Endogenous melanocortin antagonist in
fish: structure, brain mapping, and regulation by fasting of the goldfish agouti-
related protein gene. Endocrinology 144: 4552–4561.
9. Song Y, Golling G, Thacker TL, Cone RD (2003) Agouti-related protein
(AGRP) is conserved and regulated by metabolic state in the zebrafish, Danio
rerio. Endocrine 22: 257–265.
10. Klovins J SH (2005) Agouti-related proteins (AGRPs) and agouti-signaling
peptide (ASIP) in fish and chicken. Ann N Y Acad Sci 1040: 363–367.
11. Kurokawa T, Murashita K, Uji S (2006) Characterization and tissue distribution
of multiple agouti-family genes in pufferfish, Takifugu rubripes. Peptides 27:
3165–3175.
12. Schioth HB, Vastermark A, Cone RD (2011) Reply to Braasch and Postlethwait:
Evolutionary origin of the teleost A2 agouti genes (agouti signaling protein 2 and
agouti-related protein 2) remains unclear. Proc Natl Acad Sci U S A 108: E49–
50.
13. Zhang C SY, Thompson DA, Madonna MA, Millhauser GL, Toro S, Varga Z,
Westerfield M, Gamse J, Chen W, Cone RD. (2010) Pineal-specific agouti
protein regulates teleost background adaptation. PNAS 107: 20164–20171.
14. Vastermark A, Schioth HB (2011) The early origin of melanocortin receptors,
agouti-related peptide, agouti signalling peptide, and melanocortin receptor-
accessory proteins, with emphasis on pufferfishes, elephant shark, lampreys, and
amphioxus. Eur J Pharmacol 660: 61–69.
15. Haitina T, Klovins J, Takahashi A, Lowgren M, Ringholm A, et al. (2007)
Functional characterization of two melanocortin (MC) receptors in lamprey
showing orthology to the MC1 and MC4 receptor subtypes. BMC Evol Biol 7:
101.
16. Braasch I, Postlethwait JH (2011) The teleost agouti-related protein 2 gene is an
ohnolog gone missing from the tetrapod genome. Proc Natl Acad Sci U S A 108:
E47–48.
17. Catchen JM, Conery JS, Postlethwait JH (2009) Automated identification ofconserved synteny after whole-genome duplication. Genome Res 19: 1497–
1505.18. Duda RO, Hart PE (1972) Use of the Hough transformation to detect lines and
curves in pictures. Comm ACM 15: 11–15.
19. Zhao H, Yan H (2007) HoughFeature, a novel method for assessing drug effectsin three-color cDNA microarray experiments. BMC Bioinformatics 8: 256.
20. Nakatani Y, Takeda H, Kohara Y, Morishita S (2007) Reconstruction of thevertebrate ancestral genome reveals dynamic genome reorganization in early
vertebrates. Genome Res 17: 1254–1265.
21. Saez N, Senff S, Jensen J, Er S, Herzig V, et al. (2010) Spider-Venom Peptides asTherapeutics. Toxins 2: 2851–2871.
22. Murashita K, Kurokawa T, Ebbesson LO, Stefansson SO, Ronnestad I (2009)Characterization, tissue distribution, and regulation of agouti-related protein
(AgRP), cocaine- and amphetamine-regulated transcript (CART) and neuro-peptide Y (NPY) in Atlantic salmon (Salmo salar). Gen Comp Endocrinol 162:
160–171.
23. Saunders R, Deane CM (2010) Protein structure prediction begins well but endsbadly. Proteins 78: 1282–1290.
24. Lynch VJ, Wagner GP (2009) Multiple chromosomal rearrangements structuredthe ancestral vertebrate Hox-bearing protochromosomes. PLoS Genet 5:
e1000349.
25. Ravi V, Lam K, Tay BH, Tay A, Brenner S, et al. (2009) Elephant shark(Callorhinchus milii) provides insights into the evolution of Hox gene clusters in
gnathostomes. Proc Natl Acad Sci U S A 106: 16327–16332.26. Henkel CV, Burgerhout E, de Wijze DL, Dirks RP, Minegishi Y, et al. (2012)
Primitive duplicate Hox clusters in the European eel’s genome. PLoS One 7:e32231.
27. Widmark J, Sundstrom G, Ocampo Daza D, Larhammar D (2011) Differential
evolution of voltage-gated sodium channels in tetrapods and teleost fishes. MolBiol Evol 28: 859–871.
28. Dreborg S, Sundstrom G, Larsson TA, Larhammar D (2008) Evolution ofvertebrate opioid receptors. Proc Natl Acad Sci U S A 105: 15487–15492.
29. Larsson TA, Tay BH, Sundstrom G, Fredriksson R, Brenner S, et al. (2009)
Neuropeptide Y-family peptides and receptors in the elephant shark,Callorhinchus milii confirm gene duplications before the gnathostome radiation.
Genomics 93: 254–260.30. Daza DO, Sundstrom G, Bergqvist CA, Duan C, Larhammar D (2011)
Evolution of the insulin-like growth factor binding protein (IGFBP) family.Endocrinology 152: 2278–2289.
31. Braasch I, Volff JN, Schartl M (2009) The endothelin system: evolution of
vertebrate-specific ligand-receptor interactions by three rounds of genomeduplication. Mol Biol Evol 26: 783–799.
32. Sali A, Potterton L, Yuan F, van Vlijmen H, Karplus M (1995) Evaluation ofcomparative protein modeling by MODELLER. Proteins 23: 318–326.
33. Maiti R, Van Domselaar GH, Zhang H, Wishart DS (2004) SuperPose: a simple
server for sophisticated structural superposition. Nucleic Acids Res 32: W590–594.
34. Kruskal J (1964) Non-metric multidimensional scaling: a numerical method.Psychometrika 29: 115–129.
Identification of Distant Agouti-Like Sequences
PLoS ONE | www.plosone.org 14 July 2012 | Volume 7 | Issue 7 | e40982