Identification and Quantification of 22 Common Anions in ...
7
Identification and Quantification of 22 Common Anions in Pharmaceuticals in a Single Run Using HPIC with Suppressed Conductivity and Charge Detection Hua Yang, Linda Lopez; Thermo Fisher Scientific, Sunnyvale, CA, USA
Transcript of Identification and Quantification of 22 Common Anions in ...

Identification and Quantification of 22 Common Anions in Pharmaceuticals in a Single Run Using HPIC with Suppressed Conductivity and Charge Detection Hua Yang, Linda Lopez; Thermo Fisher Scientific, Sunnyvale, CA, USA

2 Identification and Quantification of 22 Common Anions in Pharmaceuticals in a Single Run Using HPIC with Suppressed Conductivity and Charge Detection
All trademarks are the property of Thermo Fisher Scientific and its subsidiaries.This information is not intended to encourage use of these products in any manners that might infringe the intellectual property rights of others.
Identification and Quantification of 22 Common Anions in Pharmaceuticals in a Single Run Using HPIC with Suppressed Conductivity and Charge DetectionHua Yang, Linda Lopez; Thermo Fisher Scientific, Sunnyvale, CA, USA
PO71116_E 05/14S
Overview An anion analysis method was developed to identify and quantify multiple counter and
impurity ions
The method described uses a capillary HPIC system with suppressed conductivity (CD) and charge (QD) detectors and a Thermo Scientific™ Dionex™ IonPac™ AS11HC-4µm capillary column. The method separates 22 common pharmaceutical anions in a single run.
The counter ion profile of an allergy drug was analyzed using the method. Chloride was quantified with high sensitivity (LOQ = 0.004 mg/L) and a large linear range (0.1 to 500 mg/L).
IntroductionIon analysis is important for the pharmaceutical industry because many active pharmaceutical ingredients (APIs) exist in their salt form. Pharmaceutical products are strictly regulated by the United States Food and Drug Administration (U.S. FDA) and other regulatory agencies, and must be tested for composition to verify their identity, strength, quality and purity.1 The importance of ion analysis for the pharmaceutical industry has increased in recent years, not only because ion analysis is required for the final products in their salt form, but also ion analysis is becoming more critical for early stage drug development. Identification and quantification of ions is used in material quality control and counter ion selection during early stage drug development. The monitoring of material quality has become increasingly critical due to increased outsourcing of API synthesis. The APIs received from vendors may be contaminated with different counter ions during their synthesis, and therefore, have different physicochemical (solubility, crystallinity, hygroscopicity) and pharmacokinetic properties; Additionally, selecting a proper counter ion to improve API solubility and stability has become a increasing critical step in formulation development due to a trend that new drug-like compounds are less and less aqueous soluble.
Conventional HPLC is not suitable for these ion analysis, because they are typically small ions that lack a chromophore and are not retained by HPLC column. Ion chromatography (IC) with suppressed conductivity detection (CD) is an established and sensitive method used for ion determination.2,3 IC has been used previously in U.S. Pharmacopeia (USP) methods for single ion analysis of final pharmaceutical products. However ion analysis method is still needed to provide both counter and impurity ion profiles for APIs and formulations, as demanded by recent pharmaceutical developments.
In this application, 26 anions, which cover the majority counter and impurity ions in pharmaceutical samples, were selected for study with the objective to identify and quantify the analytes in a single run. The counteranions were separated on a high-capacity and high efficiency, 4 µm particle ion-exchange columns, facilitated on a Reagent-Free™ IC (RFIC™) high-pressure™ capable capillary IC system (HPIC™). The counteranions were detected by suppressed conductivity detection (CD) and the ThermoScientific Dionex Charge Detector (QD). The resulting method is powerful and easy-to-use tool applicable for the pharmaceutical industry.
Chloride is the most prominent counter ion used in pharmaceuticals. The application example reported here uses the method to analyze an allergy drug in which both APIs are chloride salts.
Figure 4-1 shows the chromatograms of a water blank, an allergy drug tablet dissolved in 1000 mL water, and its 5-fold dilution. The results confirm that the drug has a clean counter ion profile with mainly chloride and trace amount of acetate, nitrite, nitrate and sulfate.
Figure 4-2 compares the CD and QD chromatograms of the undiluted sample. An additional unknown anion (peak 3) detected by QD illustrates the advantages of having two detectors that are based on different technologies. For some analytes, CD can be used to detect and quantify them, but with QD they are opaque or minimally detected and vice versa.
FIGURE 1. Schematic of capillary HPIC system with dual detectors.
ExperimentalStandards and Sample Preparation
Stock standards: Twenty-six individual stock standards (~1000 mg/L) were prepared by dissolving reagents for: chloride, gluconate, acetate, glycolate, formate, pyruvate, glucuronate, nitrate, bromide, glutarate, succinate, malate, tartrate, malonate, benzoate, maleate, sulfate, fumarate, phosphate, citrate, tosylate, benzenesulfonate, lactate, fluoride, nitrite, and trifluoroacetate in 18 MΩ-cm resistivity deionized water. Mixed standard: Prepare the mixed standard from the 1000 mg/L anion stock standardsand deionized water. Chloride calibration standards: Dilute the 1000 mg/L chloride stock solution appropriately with deionized water to make nine chloride calibration standards ranging from 0.1 to 500 mg/L.
Samples: An over-the-counter (OTC) allergy drug with API as a chloride salt was purchased from a local pharmacy. Samples were prepared by dissolving one tablet in 1000 mL of deionized water and then filtering with a 0.20 µm IC syringe filter prior to injection to remove insoluble particles. Some filtered samples were diluted with deionizedwater.
Ion Chromatography Conditions
Instrument: Thermo Scientific Dionex ICS-5000+ HPIC capillary systemColumn: Dionex IonPac AS11-HC-4µm, 0.4 × 250 mm Eluent Source: Thermo Scientific Dionex EGC-KOH capillary cartridgeGradient: 1.5−2 mM KOH (0−5 min), 2−8 mM (5−8 min), 8−16 mM (8−26 min),
16−70 mM (26−32 min), 70 mM (32−38 min).Flow Rate: 0.0150 mL/minInj. Volume: 0.40 µLColumn Temp.: 30 °CIC Cube Temp.: 15 °CDetection: CD: Suppressed conductivity detection, AutoSuppression™
Thermo Scientific™ Dionex™ ACES™ 300 Anion Electrolytic Suppressor, recycle mode
QD: Charge detection, 6V
Data AnalysisThermo Scientific™ Dionex™ Chromeleon™ Chromatography Data System (CDS) software.
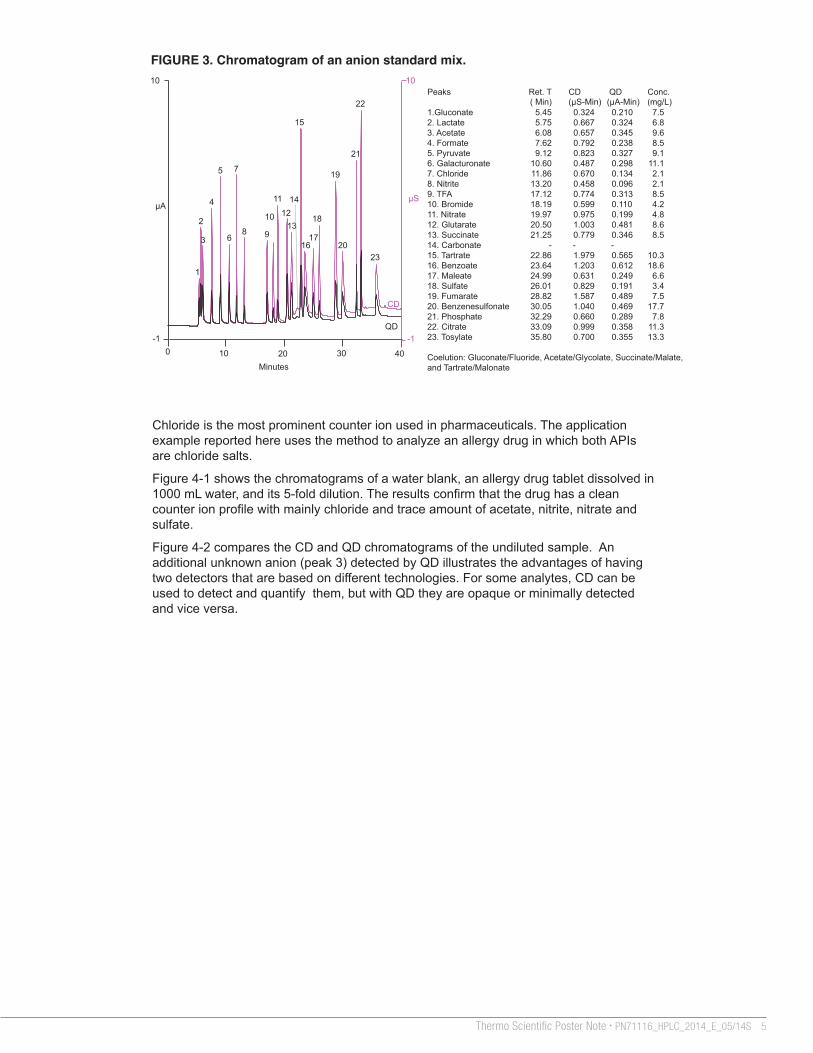
FIGURE 3. Chromatogram of an anion standard mix.
TABLE 1. Chloride in allergy drug tablets.
To quantify chloride, nine chloride standards, from 0.1 to 500 mg/L, were used for the calibration. Figure 5 shows the CD calibration curve of chloride with a good linearity, r2 =0.9999. IC with suppressed conductivity detection (CD) is very sensitive with LOQ = 0.004 mg/L.
Data Management
Waste
H20
DegasModule*
CR-ATC*
Pump*
EGC*
* High Pressure module (up to 5000 psi)
ATC*
Non-metallic Pump
Deionized water18 MΩ-cm resistivity
Eluent Generator Cartridge
Anion Trap Column
Continuously-Regenerated Anion Trap Column
Autosampler
Anion Capillary Electrolytic Suppressor
Columns
Injection Valve with internal sample loop
Carbonate Removal Device
ConductivityDetector (CD)
Charge Detector (QD)
Recycle Mode
µA
Minutes3010 200 40
-1
10
QD
CD
µS
10
-1
1
2
3
4
5
6
7
8 9
10
11
1213
14
15
1617
18
19
20
21
22
23
Peaks Ret. T CD QD Conc.( Min) (µS-Min) (µA-Min) (mg/L)
1.Gluconate 5.45 0.324 0.210 7.52. Lactate 5.75 0.667 0.324 6.83. Acetate 6.08 0.657 0.345 9.64. Formate 7.62 0.792 0.238 8.55. Pyruvate 9.12 0.823 0.327 9.16. Galacturonate 10.60 0.487 0.298 11.17. Chloride 11.86 0.670 0.134 2.18. Nitrite 13.20 0.458 0.096 2.19. TFA 17.12 0.774 0.313 8.510. Bromide 18.19 0.599 0.110 4.211. Nitrate 19.97 0.975 0.199 4.812. Glutarate 20.50 1.003 0.481 8.613. Succinate 21.25 0.779 0.346 8.514. Carbonate - - -15. Tartrate 22.86 1.979 0.565 10.316. Benzoate 23.64 1.203 0.612 18.617. Maleate 24.99 0.631 0.249 6.618. Sulfate 26.01 0.829 0.191 3.419. Fumarate 28.82 1.587 0.489 7.520. Benzenesulfonate 30.05 1.040 0.469 17.721. Phosphate 32.29 0.660 0.289 7.822. Citrate 33.09 0.999 0.358 11.323. Tosylate 35.80 0.700 0.355 13.3
Coelution: Gluconate/Fluoride, Acetate/Glycolate, Succinate/Malate,and Tartrate/Malonate
Conclusion A versatile and easy to use anion analysis method was developed for the pharmaceutical
industry which is suitable for the study of both counter and impurity ion profiles for APIs and formulations.
Using a capillary HPIC system with CD and QD detectors, and a Dionex IonPac AS11HC-4µm capillary column:
• Twenty-two common pharmaceutical anions were separated in a single run.
• Multiple counter ions in drug products were easily identified and quantified with confidence, which facilitated the profiling of this allergy drug.
• For chloride, this method had a low limit of quantification (0.004 mg/L) and a large linear range (0.1 to 500 mg/L).
References1. FDA, CFR Title 21, Foods and Drugs, Chapter 1, Part 211 Current Good Manufacturing
Practices for Finished Pharmaceuticals http://www.accessdata.fda.gov/scripts/cdrh/cfdocs/cfcfr/CFRSearch.cfm?fr=211.110 (accessed April 15, 2014).
2. Dionex (now part of Thermo Scientific) Application Note 116: Quantification of Anions in Pharmaceuticals. Sunnyvale, CA, 2002. [Online] http://www.thermoscientific.com/content/dam/tfs/ATG/CMD/CMD%20Documents/Application%20&%20Technical%20Notes/Chromatography/GC%20HPLC%20and%20UHPLC%20Columns%20and%20Accessories/Chromatography%20Column%20Accessories/4079-AN116_LPN0924-01.pdf (accessed April 15, 2014).
3. Dionex (now part of Thermo Scientific) Application Note 164: Assay for Citrate and Phosphate in Pharmaceutical Formulation Using Ion Chromatography. Sunnyvale, CA, 2004. [Online] http://www.thermoscientific.com/content/dam/tfs/ATG/CMD/CMD%20Documents/Application%20&%20Technical%20Notes/Chromatography/GC%20HPLC%20and%20UHPLC%20Columns%20and%20Accessories/Chromatography%20Column%20Accessories/49183-AN164_LPN1643.pdf (accessed April 14, 2014).
4. Dionex (now part of Thermo Scientific) Application Note 273: Higher Resolution Separation of Organic Acids and Common Inorganic Anions in Wine. Sunnyvale, CA, 2011. [Online] http://www.thermoscientific.com/content/dam/tfs/ATG/CMD/CMD%20Documents/Application%20&%20Technical%20Notes/Chromatography/Liquid%20Chromatography/Liquid%20Chromatography%20Accessories/110622-AN273-IC-OrganicAcids-Anions-Wine-15Jun2011-LPN2727-01.pdf (accessed April 15, 2014).
µS
Minutes
3010 200-1
9
BA
C
2
3 4 651
0 200 400 600Chloride (mg/L)
0
200
Are
a (µ
S*m
in)
r2 = 0.9999 RSD = 2.08
Twenty-six of most commonly used counter ions and commonly seen impurity ions in pharmaceutical samples were included in this study. The Dionex IonPac AS11-HC-4µm capillary column was selected for its ability to separate various organic and inorganic acids in a wide range of products including fruit juices and wine.4 The 4µm resin particle technology has further improved the resolution and increased the column efficiency. As can be seen in Figure 3, 22 of 26 organic and inorganic anions were separated in a single run in less than 40 minutes. Four anions coelute with the other ions of interest, and therefore removed from the mixed standard.
The QD detector is an excellent orthogonal complement for the CD detector. Because each ion had a characteristic retention time, CD response, and QD response (Figure 3), all ions were identified and quantified with confidence using the two detectors.
µA
Minutes
3010 2000
1 2
0
3
7
61
QD
CD
45
2
µS
Peaks Ret. T Concentration( Min) (mg/L)
A B1. Acetate 6.08 0.3 −2. Chloride 11.86 8.5 1.7 3. Nitrite 13.20 0.1 −4. Nitrate 19.97 0.2 −5. Carbonate* 6. Sulfate 26.01 0.1 −
Samples:A: One tablet in 1000 mL waterB: 5-fold dilution of AC: Water blank
* System Peak
Peaks Concentration(mg/L)
CD QD1.Acetate 0.3 0.42.Chloride 8.5 8.53.Unknown <LOD −4. Nitrite 0.1 −5. Nitrate 0.2 <LOQ 6. Carbonate* 7. Sulfate 0.1 0.1
* System Peak
FIGURE 4 Anions in an allergy drug tablet.Figure 4-1 Chromatograms using
suppressed conductivity (CD) detection.Figure 4-2 Comparison of CD and QD
chromatograms.
Table 1 summarizes the results from the analysis five tablets of an allergy drug. The chloride results using CD (8.32 mg/tablet) agree with the drug label. The concentrations from QD were higher (8.36 mg/tablet), possibly attributable to the interference of unknown peak 3.
FIGURE 5 Calibration curve of chloride from 0.1 to 500 mg/L.
Results and Discussion
Conductivity Detector (CD) Charge Detector (QD)
Guard and Separation Columns
Dionex ACES 300 Suppressor
Dionex CRD 180
4-Port Injection Valve
Cap IC Degas
FIGURE 2. Thermo Scientific Dionex IC Cube module.
Figure 1 shows the schematic of the flow diagram of the HPIC system used for this application. It is a high-pressure capillary IC system (HPIC) with CD / QD detectors. The capillary IC components are configured in close proximity in Thermo Scientific™ Dionex™ IC Cube™ module (Figure 2) to minimize the flow path.

3Thermo Scientific Poster Note • PN71116_HPLC_2014_E_05/14S
All trademarks are the property of Thermo Fisher Scientific and its subsidiaries.This information is not intended to encourage use of these products in any manners that might infringe the intellectual property rights of others.
Identification and Quantification of 22 Common Anions in Pharmaceuticals in a Single Run Using HPIC with Suppressed Conductivity and Charge DetectionHua Yang, Linda Lopez; Thermo Fisher Scientific, Sunnyvale, CA, USA
PO71116_E 05/14S
Overview An anion analysis method was developed to identify and quantify multiple counter and
impurity ions
The method described uses a capillary HPIC system with suppressed conductivity (CD) and charge (QD) detectors and a Thermo Scientific™ Dionex™ IonPac™ AS11HC-4µm capillary column. The method separates 22 common pharmaceutical anions in a single run.
The counter ion profile of an allergy drug was analyzed using the method. Chloride was quantified with high sensitivity (LOQ = 0.004 mg/L) and a large linear range (0.1 to 500 mg/L).
IntroductionIon analysis is important for the pharmaceutical industry because many active pharmaceutical ingredients (APIs) exist in their salt form. Pharmaceutical products are strictly regulated by the United States Food and Drug Administration (U.S. FDA) and other regulatory agencies, and must be tested for composition to verify their identity, strength, quality and purity.1 The importance of ion analysis for the pharmaceutical industry has increased in recent years, not only because ion analysis is required for the final products in their salt form, but also ion analysis is becoming more critical for early stage drug development. Identification and quantification of ions is used in material quality control and counter ion selection during early stage drug development. The monitoring of material quality has become increasingly critical due to increased outsourcing of API synthesis. The APIs received from vendors may be contaminated with different counter ions during their synthesis, and therefore, have different physicochemical (solubility, crystallinity, hygroscopicity) and pharmacokinetic properties; Additionally, selecting a proper counter ion to improve API solubility and stability has become a increasing critical step in formulation development due to a trend that new drug-like compounds are less and less aqueous soluble.
Conventional HPLC is not suitable for these ion analysis, because they are typically small ions that lack a chromophore and are not retained by HPLC column. Ion chromatography (IC) with suppressed conductivity detection (CD) is an established and sensitive method used for ion determination.2,3 IC has been used previously in U.S. Pharmacopeia (USP) methods for single ion analysis of final pharmaceutical products. However ion analysis method is still needed to provide both counter and impurity ion profiles for APIs and formulations, as demanded by recent pharmaceutical developments.
In this application, 26 anions, which cover the majority counter and impurity ions in pharmaceutical samples, were selected for study with the objective to identify and quantify the analytes in a single run. The counteranions were separated on a high-capacity and high efficiency, 4 µm particle ion-exchange columns, facilitated on a Reagent-Free™ IC (RFIC™) high-pressure™ capable capillary IC system (HPIC™). The counteranions were detected by suppressed conductivity detection (CD) and the ThermoScientific Dionex Charge Detector (QD). The resulting method is powerful and easy-to-use tool applicable for the pharmaceutical industry.
Chloride is the most prominent counter ion used in pharmaceuticals. The application example reported here uses the method to analyze an allergy drug in which both APIs are chloride salts.
Figure 4-1 shows the chromatograms of a water blank, an allergy drug tablet dissolved in 1000 mL water, and its 5-fold dilution. The results confirm that the drug has a clean counter ion profile with mainly chloride and trace amount of acetate, nitrite, nitrate and sulfate.
Figure 4-2 compares the CD and QD chromatograms of the undiluted sample. An additional unknown anion (peak 3) detected by QD illustrates the advantages of having two detectors that are based on different technologies. For some analytes, CD can be used to detect and quantify them, but with QD they are opaque or minimally detected and vice versa.
FIGURE 1. Schematic of capillary HPIC system with dual detectors.
ExperimentalStandards and Sample Preparation
Stock standards: Twenty-six individual stock standards (~1000 mg/L) were prepared by dissolving reagents for: chloride, gluconate, acetate, glycolate, formate, pyruvate, glucuronate, nitrate, bromide, glutarate, succinate, malate, tartrate, malonate, benzoate, maleate, sulfate, fumarate, phosphate, citrate, tosylate, benzenesulfonate, lactate, fluoride, nitrite, and trifluoroacetate in 18 MΩ-cm resistivity deionized water. Mixed standard: Prepare the mixed standard from the 1000 mg/L anion stock standardsand deionized water. Chloride calibration standards: Dilute the 1000 mg/L chloride stock solution appropriately with deionized water to make nine chloride calibration standards ranging from 0.1 to 500 mg/L.
Samples: An over-the-counter (OTC) allergy drug with API as a chloride salt was purchased from a local pharmacy. Samples were prepared by dissolving one tablet in 1000 mL of deionized water and then filtering with a 0.20 µm IC syringe filter prior to injection to remove insoluble particles. Some filtered samples were diluted with deionizedwater.
Ion Chromatography ConditionsInstrument: Thermo Scientific Dionex ICS-5000+ HPIC capillary systemColumn: Dionex IonPac AS11-HC-4µm, 0.4 × 250 mm Eluent Source: Thermo Scientific Dionex EGC-KOH capillary cartridgeGradient: 1.5−2 mM KOH (0−5 min), 2−8 mM (5−8 min), 8−16 mM (8−26 min),
16−70 mM (26−32 min), 70 mM (32−38 min).Flow Rate: 0.0150 mL/minInj. Volume: 0.40 µLColumn Temp.: 30 °CIC Cube Temp.: 15 °CDetection: CD: Suppressed conductivity detection, AutoSuppression™
Thermo Scientific™ Dionex™ ACES™ 300 Anion Electrolytic Suppressor, recycle mode
QD: Charge detection, 6V
Data AnalysisThermo Scientific™ Dionex™ Chromeleon™ Chromatography Data System (CDS) software.
FIGURE 3. Chromatogram of an anion standard mix.
TABLE 1. Chloride in allergy drug tablets.
To quantify chloride, nine chloride standards, from 0.1 to 500 mg/L, were used for the calibration. Figure 5 shows the CD calibration curve of chloride with a good linearity, r2 =0.9999. IC with suppressed conductivity detection (CD) is very sensitive with LOQ = 0.004 mg/L.
Data Management
Waste
H20
DegasModule*
CR-ATC*
Pump*
EGC*
* High Pressure module (up to 5000 psi)
ATC*
Non-metallic Pump
Deionized water18 MΩ-cm resistivity
Eluent Generator Cartridge
Anion Trap Column
Continuously-Regenerated Anion Trap Column
Autosampler
Anion Capillary Electrolytic Suppressor
Columns
Injection Valve with internal sample loop
Carbonate Removal Device
ConductivityDetector (CD)
Charge Detector (QD)
Recycle Mode
µA
Minutes3010 200 40
-1
10
QD
CD
µS
10
-1
1
2
3
4
5
6
7
8 9
10
11
1213
14
15
1617
18
19
20
21
22
23
Peaks Ret. T CD QD Conc.( Min) (µS-Min) (µA-Min) (mg/L)
1.Gluconate 5.45 0.324 0.210 7.52. Lactate 5.75 0.667 0.324 6.83. Acetate 6.08 0.657 0.345 9.64. Formate 7.62 0.792 0.238 8.55. Pyruvate 9.12 0.823 0.327 9.16. Galacturonate 10.60 0.487 0.298 11.17. Chloride 11.86 0.670 0.134 2.18. Nitrite 13.20 0.458 0.096 2.19. TFA 17.12 0.774 0.313 8.510. Bromide 18.19 0.599 0.110 4.211. Nitrate 19.97 0.975 0.199 4.812. Glutarate 20.50 1.003 0.481 8.613. Succinate 21.25 0.779 0.346 8.514. Carbonate - - -15. Tartrate 22.86 1.979 0.565 10.316. Benzoate 23.64 1.203 0.612 18.617. Maleate 24.99 0.631 0.249 6.618. Sulfate 26.01 0.829 0.191 3.419. Fumarate 28.82 1.587 0.489 7.520. Benzenesulfonate 30.05 1.040 0.469 17.721. Phosphate 32.29 0.660 0.289 7.822. Citrate 33.09 0.999 0.358 11.323. Tosylate 35.80 0.700 0.355 13.3
Coelution: Gluconate/Fluoride, Acetate/Glycolate, Succinate/Malate,and Tartrate/Malonate
Conclusion A versatile and easy to use anion analysis method was developed for the pharmaceutical
industry which is suitable for the study of both counter and impurity ion profiles for APIs and formulations.
Using a capillary HPIC system with CD and QD detectors, and a Dionex IonPac AS11HC-4µm capillary column:
• Twenty-two common pharmaceutical anions were separated in a single run.
• Multiple counter ions in drug products were easily identified and quantified with confidence, which facilitated the profiling of this allergy drug.
• For chloride, this method had a low limit of quantification (0.004 mg/L) and a large linear range (0.1 to 500 mg/L).
References1. FDA, CFR Title 21, Foods and Drugs, Chapter 1, Part 211 Current Good Manufacturing
Practices for Finished Pharmaceuticals http://www.accessdata.fda.gov/scripts/cdrh/cfdocs/cfcfr/CFRSearch.cfm?fr=211.110 (accessed April 15, 2014).
2. Dionex (now part of Thermo Scientific) Application Note 116: Quantification of Anions in Pharmaceuticals. Sunnyvale, CA, 2002. [Online] http://www.thermoscientific.com/content/dam/tfs/ATG/CMD/CMD%20Documents/Application%20&%20Technical%20Notes/Chromatography/GC%20HPLC%20and%20UHPLC%20Columns%20and%20Accessories/Chromatography%20Column%20Accessories/4079-AN116_LPN0924-01.pdf (accessed April 15, 2014).
3. Dionex (now part of Thermo Scientific) Application Note 164: Assay for Citrate and Phosphate in Pharmaceutical Formulation Using Ion Chromatography. Sunnyvale, CA, 2004. [Online] http://www.thermoscientific.com/content/dam/tfs/ATG/CMD/CMD%20Documents/Application%20&%20Technical%20Notes/Chromatography/GC%20HPLC%20and%20UHPLC%20Columns%20and%20Accessories/Chromatography%20Column%20Accessories/49183-AN164_LPN1643.pdf (accessed April 14, 2014).
4. Dionex (now part of Thermo Scientific) Application Note 273: Higher Resolution Separation of Organic Acids and Common Inorganic Anions in Wine. Sunnyvale, CA, 2011. [Online] http://www.thermoscientific.com/content/dam/tfs/ATG/CMD/CMD%20Documents/Application%20&%20Technical%20Notes/Chromatography/Liquid%20Chromatography/Liquid%20Chromatography%20Accessories/110622-AN273-IC-OrganicAcids-Anions-Wine-15Jun2011-LPN2727-01.pdf (accessed April 15, 2014).
µS
Minutes
3010 200-1
9
BA
C
2
3 4 651
0 200 400 600Chloride (mg/L)
0
200
Are
a (µ
S*m
in)
r2 = 0.9999 RSD = 2.08
Twenty-six of most commonly used counter ions and commonly seen impurity ions in pharmaceutical samples were included in this study. The Dionex IonPac AS11-HC-4µm capillary column was selected for its ability to separate various organic and inorganic acids in a wide range of products including fruit juices and wine.4 The 4µm resin particle technology has further improved the resolution and increased the column efficiency. As can be seen in Figure 3, 22 of 26 organic and inorganic anions were separated in a single run in less than 40 minutes. Four anions coelute with the other ions of interest, and therefore removed from the mixed standard.
The QD detector is an excellent orthogonal complement for the CD detector. Because each ion had a characteristic retention time, CD response, and QD response (Figure 3), all ions were identified and quantified with confidence using the two detectors.
µA
Minutes
3010 2000
1 2
0
3
7
61
QD
CD
45
2
µS
Peaks Ret. T Concentration( Min) (mg/L)
A B1. Acetate 6.08 0.3 −2. Chloride 11.86 8.5 1.7 3. Nitrite 13.20 0.1 −4. Nitrate 19.97 0.2 −5. Carbonate* 6. Sulfate 26.01 0.1 −
Samples:A: One tablet in 1000 mL waterB: 5-fold dilution of AC: Water blank
* System Peak
Peaks Concentration(mg/L)
CD QD1.Acetate 0.3 0.42.Chloride 8.5 8.53.Unknown <LOD −4. Nitrite 0.1 −5. Nitrate 0.2 <LOQ 6. Carbonate* 7. Sulfate 0.1 0.1
* System Peak
FIGURE 4 Anions in an allergy drug tablet.Figure 4-1 Chromatograms using
suppressed conductivity (CD) detection.Figure 4-2 Comparison of CD and QD
chromatograms.
Table 1 summarizes the results from the analysis five tablets of an allergy drug. The chloride results using CD (8.32 mg/tablet) agree with the drug label. The concentrations from QD were higher (8.36 mg/tablet), possibly attributable to the interference of unknown peak 3.
FIGURE 5 Calibration curve of chloride from 0.1 to 500 mg/L.
Results and Discussion
Conductivity Detector (CD) Charge Detector (QD)
Guard and Separation Columns
Dionex ACES 300 Suppressor
Dionex CRD 180
4-Port Injection Valve
Cap IC Degas
FIGURE 2. Thermo Scientific Dionex IC Cube module.
Figure 1 shows the schematic of the flow diagram of the HPIC system used for this application. It is a high-pressure capillary IC system (HPIC) with CD / QD detectors. The capillary IC components are configured in close proximity in Thermo Scientific™ Dionex™ IC Cube™ module (Figure 2) to minimize the flow path.

4 Identification and Quantification of 22 Common Anions in Pharmaceuticals in a Single Run Using HPIC with Suppressed Conductivity and Charge Detection
All trademarks are the property of Thermo Fisher Scientific and its subsidiaries.This information is not intended to encourage use of these products in any manners that might infringe the intellectual property rights of others.
Identification and Quantification of 22 Common Anions in Pharmaceuticals in a Single Run Using HPIC with Suppressed Conductivity and Charge DetectionHua Yang, Linda Lopez; Thermo Fisher Scientific, Sunnyvale, CA, USA
PO71116_E 05/14S
Overview An anion analysis method was developed to identify and quantify multiple counter and
impurity ions
The method described uses a capillary HPIC system with suppressed conductivity (CD) and charge (QD) detectors and a Thermo Scientific™ Dionex™ IonPac™ AS11HC-4µm capillary column. The method separates 22 common pharmaceutical anions in a single run.
The counter ion profile of an allergy drug was analyzed using the method. Chloride was quantified with high sensitivity (LOQ = 0.004 mg/L) and a large linear range (0.1 to 500 mg/L).
IntroductionIon analysis is important for the pharmaceutical industry because many active pharmaceutical ingredients (APIs) exist in their salt form. Pharmaceutical products are strictly regulated by the United States Food and Drug Administration (U.S. FDA) and other regulatory agencies, and must be tested for composition to verify their identity, strength, quality and purity.1 The importance of ion analysis for the pharmaceutical industry has increased in recent years, not only because ion analysis is required for the final products in their salt form, but also ion analysis is becoming more critical for early stage drug development. Identification and quantification of ions is used in material quality control and counter ion selection during early stage drug development. The monitoring of material quality has become increasingly critical due to increased outsourcing of API synthesis. The APIs received from vendors may be contaminated with different counter ions during their synthesis, and therefore, have different physicochemical (solubility, crystallinity, hygroscopicity) and pharmacokinetic properties; Additionally, selecting a proper counter ion to improve API solubility and stability has become a increasing critical step in formulation development due to a trend that new drug-like compounds are less and less aqueous soluble.
Conventional HPLC is not suitable for these ion analysis, because they are typically small ions that lack a chromophore and are not retained by HPLC column. Ion chromatography (IC) with suppressed conductivity detection (CD) is an established and sensitive method used for ion determination.2,3 IC has been used previously in U.S. Pharmacopeia (USP) methods for single ion analysis of final pharmaceutical products. However ion analysis method is still needed to provide both counter and impurity ion profiles for APIs and formulations, as demanded by recent pharmaceutical developments.
In this application, 26 anions, which cover the majority counter and impurity ions in pharmaceutical samples, were selected for study with the objective to identify and quantify the analytes in a single run. The counteranions were separated on a high-capacity and high efficiency, 4 µm particle ion-exchange columns, facilitated on a Reagent-Free™ IC (RFIC™) high-pressure™ capable capillary IC system (HPIC™). The counteranions were detected by suppressed conductivity detection (CD) and the ThermoScientific Dionex Charge Detector (QD). The resulting method is powerful and easy-to-use tool applicable for the pharmaceutical industry.
Chloride is the most prominent counter ion used in pharmaceuticals. The application example reported here uses the method to analyze an allergy drug in which both APIs are chloride salts.
Figure 4-1 shows the chromatograms of a water blank, an allergy drug tablet dissolved in 1000 mL water, and its 5-fold dilution. The results confirm that the drug has a clean counter ion profile with mainly chloride and trace amount of acetate, nitrite, nitrate and sulfate.
Figure 4-2 compares the CD and QD chromatograms of the undiluted sample. An additional unknown anion (peak 3) detected by QD illustrates the advantages of having two detectors that are based on different technologies. For some analytes, CD can be used to detect and quantify them, but with QD they are opaque or minimally detected and vice versa.
FIGURE 1. Schematic of capillary HPIC system with dual detectors.
ExperimentalStandards and Sample Preparation
Stock standards: Twenty-six individual stock standards (~1000 mg/L) were prepared by dissolving reagents for: chloride, gluconate, acetate, glycolate, formate, pyruvate, glucuronate, nitrate, bromide, glutarate, succinate, malate, tartrate, malonate, benzoate, maleate, sulfate, fumarate, phosphate, citrate, tosylate, benzenesulfonate, lactate, fluoride, nitrite, and trifluoroacetate in 18 MΩ-cm resistivity deionized water. Mixed standard: Prepare the mixed standard from the 1000 mg/L anion stock standardsand deionized water. Chloride calibration standards: Dilute the 1000 mg/L chloride stock solution appropriately with deionized water to make nine chloride calibration standards ranging from 0.1 to 500 mg/L.
Samples: An over-the-counter (OTC) allergy drug with API as a chloride salt was purchased from a local pharmacy. Samples were prepared by dissolving one tablet in 1000 mL of deionized water and then filtering with a 0.20 µm IC syringe filter prior to injection to remove insoluble particles. Some filtered samples were diluted with deionizedwater.
Ion Chromatography Conditions
Instrument: Thermo Scientific Dionex ICS-5000+ HPIC capillary systemColumn: Dionex IonPac AS11-HC-4µm, 0.4 × 250 mm Eluent Source: Thermo Scientific Dionex EGC-KOH capillary cartridgeGradient: 1.5−2 mM KOH (0−5 min), 2−8 mM (5−8 min), 8−16 mM (8−26 min),
16−70 mM (26−32 min), 70 mM (32−38 min).Flow Rate: 0.0150 mL/minInj. Volume: 0.40 µLColumn Temp.: 30 °CIC Cube Temp.: 15 °CDetection: CD: Suppressed conductivity detection, AutoSuppression™
Thermo Scientific™ Dionex™ ACES™ 300 Anion Electrolytic Suppressor, recycle mode
QD: Charge detection, 6V
Data AnalysisThermo Scientific™ Dionex™ Chromeleon™ Chromatography Data System (CDS) software.
FIGURE 3. Chromatogram of an anion standard mix.
TABLE 1. Chloride in allergy drug tablets.
To quantify chloride, nine chloride standards, from 0.1 to 500 mg/L, were used for the calibration. Figure 5 shows the CD calibration curve of chloride with a good linearity, r2 =0.9999. IC with suppressed conductivity detection (CD) is very sensitive with LOQ = 0.004 mg/L.
Data Management
Waste
H20
DegasModule*
CR-ATC*
Pump*
EGC*
* High Pressure module (up to 5000 psi)
ATC*
Non-metallic Pump
Deionized water18 MΩ-cm resistivity
Eluent Generator Cartridge
Anion Trap Column
Continuously-Regenerated Anion Trap Column
Autosampler
Anion Capillary Electrolytic Suppressor
Columns
Injection Valve with internal sample loop
Carbonate Removal Device
ConductivityDetector (CD)
Charge Detector (QD)
Recycle Mode
µA
Minutes3010 200 40
-1
10
QD
CD
µS
10
-1
1
2
3
4
5
6
7
8 9
10
11
1213
14
15
1617
18
19
20
21
22
23
Peaks Ret. T CD QD Conc.( Min) (µS-Min) (µA-Min) (mg/L)
1.Gluconate 5.45 0.324 0.210 7.52. Lactate 5.75 0.667 0.324 6.83. Acetate 6.08 0.657 0.345 9.64. Formate 7.62 0.792 0.238 8.55. Pyruvate 9.12 0.823 0.327 9.16. Galacturonate 10.60 0.487 0.298 11.17. Chloride 11.86 0.670 0.134 2.18. Nitrite 13.20 0.458 0.096 2.19. TFA 17.12 0.774 0.313 8.510. Bromide 18.19 0.599 0.110 4.211. Nitrate 19.97 0.975 0.199 4.812. Glutarate 20.50 1.003 0.481 8.613. Succinate 21.25 0.779 0.346 8.514. Carbonate - - -15. Tartrate 22.86 1.979 0.565 10.316. Benzoate 23.64 1.203 0.612 18.617. Maleate 24.99 0.631 0.249 6.618. Sulfate 26.01 0.829 0.191 3.419. Fumarate 28.82 1.587 0.489 7.520. Benzenesulfonate 30.05 1.040 0.469 17.721. Phosphate 32.29 0.660 0.289 7.822. Citrate 33.09 0.999 0.358 11.323. Tosylate 35.80 0.700 0.355 13.3
Coelution: Gluconate/Fluoride, Acetate/Glycolate, Succinate/Malate,and Tartrate/Malonate
Conclusion A versatile and easy to use anion analysis method was developed for the pharmaceutical
industry which is suitable for the study of both counter and impurity ion profiles for APIs and formulations.
Using a capillary HPIC system with CD and QD detectors, and a Dionex IonPac AS11HC-4µm capillary column:
• Twenty-two common pharmaceutical anions were separated in a single run.
• Multiple counter ions in drug products were easily identified and quantified with confidence, which facilitated the profiling of this allergy drug.
• For chloride, this method had a low limit of quantification (0.004 mg/L) and a large linear range (0.1 to 500 mg/L).
References1. FDA, CFR Title 21, Foods and Drugs, Chapter 1, Part 211 Current Good Manufacturing
Practices for Finished Pharmaceuticals http://www.accessdata.fda.gov/scripts/cdrh/cfdocs/cfcfr/CFRSearch.cfm?fr=211.110 (accessed April 15, 2014).
2. Dionex (now part of Thermo Scientific) Application Note 116: Quantification of Anions in Pharmaceuticals. Sunnyvale, CA, 2002. [Online] http://www.thermoscientific.com/content/dam/tfs/ATG/CMD/CMD%20Documents/Application%20&%20Technical%20Notes/Chromatography/GC%20HPLC%20and%20UHPLC%20Columns%20and%20Accessories/Chromatography%20Column%20Accessories/4079-AN116_LPN0924-01.pdf (accessed April 15, 2014).
3. Dionex (now part of Thermo Scientific) Application Note 164: Assay for Citrate and Phosphate in Pharmaceutical Formulation Using Ion Chromatography. Sunnyvale, CA, 2004. [Online] http://www.thermoscientific.com/content/dam/tfs/ATG/CMD/CMD%20Documents/Application%20&%20Technical%20Notes/Chromatography/GC%20HPLC%20and%20UHPLC%20Columns%20and%20Accessories/Chromatography%20Column%20Accessories/49183-AN164_LPN1643.pdf (accessed April 14, 2014).
4. Dionex (now part of Thermo Scientific) Application Note 273: Higher Resolution Separation of Organic Acids and Common Inorganic Anions in Wine. Sunnyvale, CA, 2011. [Online] http://www.thermoscientific.com/content/dam/tfs/ATG/CMD/CMD%20Documents/Application%20&%20Technical%20Notes/Chromatography/Liquid%20Chromatography/Liquid%20Chromatography%20Accessories/110622-AN273-IC-OrganicAcids-Anions-Wine-15Jun2011-LPN2727-01.pdf (accessed April 15, 2014).
µS
Minutes
3010 200-1
9
BA
C
2
3 4 651
0 200 400 600Chloride (mg/L)
0
200
Are
a (µ
S*m
in)
r2 = 0.9999 RSD = 2.08
Twenty-six of most commonly used counter ions and commonly seen impurity ions in pharmaceutical samples were included in this study. The Dionex IonPac AS11-HC-4µm capillary column was selected for its ability to separate various organic and inorganic acids in a wide range of products including fruit juices and wine.4 The 4µm resin particle technology has further improved the resolution and increased the column efficiency. As can be seen in Figure 3, 22 of 26 organic and inorganic anions were separated in a single run in less than 40 minutes. Four anions coelute with the other ions of interest, and therefore removed from the mixed standard.
The QD detector is an excellent orthogonal complement for the CD detector. Because each ion had a characteristic retention time, CD response, and QD response (Figure 3), all ions were identified and quantified with confidence using the two detectors.
µA
Minutes
3010 2000
1 2
0
3
7
61
QD
CD
45
2
µS
Peaks Ret. T Concentration( Min) (mg/L)
A B1. Acetate 6.08 0.3 −2. Chloride 11.86 8.5 1.7 3. Nitrite 13.20 0.1 −4. Nitrate 19.97 0.2 −5. Carbonate* 6. Sulfate 26.01 0.1 −
Samples:A: One tablet in 1000 mL waterB: 5-fold dilution of AC: Water blank
* System Peak
Peaks Concentration(mg/L)
CD QD1.Acetate 0.3 0.42.Chloride 8.5 8.53.Unknown <LOD −4. Nitrite 0.1 −5. Nitrate 0.2 <LOQ 6. Carbonate* 7. Sulfate 0.1 0.1
* System Peak
FIGURE 4 Anions in an allergy drug tablet.Figure 4-1 Chromatograms using
suppressed conductivity (CD) detection.Figure 4-2 Comparison of CD and QD
chromatograms.
Table 1 summarizes the results from the analysis five tablets of an allergy drug. The chloride results using CD (8.32 mg/tablet) agree with the drug label. The concentrations from QD were higher (8.36 mg/tablet), possibly attributable to the interference of unknown peak 3.
FIGURE 5 Calibration curve of chloride from 0.1 to 500 mg/L.
Results and Discussion
Conductivity Detector (CD) Charge Detector (QD)
Guard and Separation Columns
Dionex ACES 300 Suppressor
Dionex CRD 180
4-Port Injection Valve
Cap IC Degas
FIGURE 2. Thermo Scientific Dionex IC Cube module.
Figure 1 shows the schematic of the flow diagram of the HPIC system used for this application. It is a high-pressure capillary IC system (HPIC) with CD / QD detectors. The capillary IC components are configured in close proximity in Thermo Scientific™ Dionex™ IC Cube™ module (Figure 2) to minimize the flow path.
5Thermo Scientific Poster Note • PN71116_HPLC_2014_E_05/14S
All trademarks are the property of Thermo Fisher Scientific and its subsidiaries.This information is not intended to encourage use of these products in any manners that might infringe the intellectual property rights of others.
Identification and Quantification of 22 Common Anions in Pharmaceuticals in a Single Run Using HPIC with Suppressed Conductivity and Charge DetectionHua Yang, Linda Lopez; Thermo Fisher Scientific, Sunnyvale, CA, USA
PO71116_E 05/14S
Overview An anion analysis method was developed to identify and quantify multiple counter and
impurity ions
The method described uses a capillary HPIC system with suppressed conductivity (CD) and charge (QD) detectors and a Thermo Scientific™ Dionex™ IonPac™ AS11HC-4µm capillary column. The method separates 22 common pharmaceutical anions in a single run.
The counter ion profile of an allergy drug was analyzed using the method. Chloride was quantified with high sensitivity (LOQ = 0.004 mg/L) and a large linear range (0.1 to 500 mg/L).
IntroductionIon analysis is important for the pharmaceutical industry because many active pharmaceutical ingredients (APIs) exist in their salt form. Pharmaceutical products are strictly regulated by the United States Food and Drug Administration (U.S. FDA) and other regulatory agencies, and must be tested for composition to verify their identity, strength, quality and purity.1 The importance of ion analysis for the pharmaceutical industry has increased in recent years, not only because ion analysis is required for the final products in their salt form, but also ion analysis is becoming more critical for early stage drug development. Identification and quantification of ions is used in material quality control and counter ion selection during early stage drug development. The monitoring of material quality has become increasingly critical due to increased outsourcing of API synthesis. The APIs received from vendors may be contaminated with different counter ions during their synthesis, and therefore, have different physicochemical (solubility, crystallinity, hygroscopicity) and pharmacokinetic properties; Additionally, selecting a proper counter ion to improve API solubility and stability has become a increasing critical step in formulation development due to a trend that new drug-like compounds are less and less aqueous soluble.
Conventional HPLC is not suitable for these ion analysis, because they are typically small ions that lack a chromophore and are not retained by HPLC column. Ion chromatography (IC) with suppressed conductivity detection (CD) is an established and sensitive method used for ion determination.2,3 IC has been used previously in U.S. Pharmacopeia (USP) methods for single ion analysis of final pharmaceutical products. However ion analysis method is still needed to provide both counter and impurity ion profiles for APIs and formulations, as demanded by recent pharmaceutical developments.
In this application, 26 anions, which cover the majority counter and impurity ions in pharmaceutical samples, were selected for study with the objective to identify and quantify the analytes in a single run. The counteranions were separated on a high-capacity and high efficiency, 4 µm particle ion-exchange columns, facilitated on a Reagent-Free™ IC (RFIC™) high-pressure™ capable capillary IC system (HPIC™). The counteranions were detected by suppressed conductivity detection (CD) and the ThermoScientific Dionex Charge Detector (QD). The resulting method is powerful and easy-to-use tool applicable for the pharmaceutical industry.
Chloride is the most prominent counter ion used in pharmaceuticals. The application example reported here uses the method to analyze an allergy drug in which both APIs are chloride salts.
Figure 4-1 shows the chromatograms of a water blank, an allergy drug tablet dissolved in 1000 mL water, and its 5-fold dilution. The results confirm that the drug has a clean counter ion profile with mainly chloride and trace amount of acetate, nitrite, nitrate and sulfate.
Figure 4-2 compares the CD and QD chromatograms of the undiluted sample. An additional unknown anion (peak 3) detected by QD illustrates the advantages of having two detectors that are based on different technologies. For some analytes, CD can be used to detect and quantify them, but with QD they are opaque or minimally detected and vice versa.
FIGURE 1. Schematic of capillary HPIC system with dual detectors.
ExperimentalStandards and Sample Preparation
Stock standards: Twenty-six individual stock standards (~1000 mg/L) were prepared by dissolving reagents for: chloride, gluconate, acetate, glycolate, formate, pyruvate, glucuronate, nitrate, bromide, glutarate, succinate, malate, tartrate, malonate, benzoate, maleate, sulfate, fumarate, phosphate, citrate, tosylate, benzenesulfonate, lactate, fluoride, nitrite, and trifluoroacetate in 18 MΩ-cm resistivity deionized water. Mixed standard: Prepare the mixed standard from the 1000 mg/L anion stock standardsand deionized water. Chloride calibration standards: Dilute the 1000 mg/L chloride stock solution appropriately with deionized water to make nine chloride calibration standards ranging from 0.1 to 500 mg/L.
Samples: An over-the-counter (OTC) allergy drug with API as a chloride salt was purchased from a local pharmacy. Samples were prepared by dissolving one tablet in 1000 mL of deionized water and then filtering with a 0.20 µm IC syringe filter prior to injection to remove insoluble particles. Some filtered samples were diluted with deionizedwater.
Ion Chromatography Conditions
Instrument: Thermo Scientific Dionex ICS-5000+ HPIC capillary systemColumn: Dionex IonPac AS11-HC-4µm, 0.4 × 250 mm Eluent Source: Thermo Scientific Dionex EGC-KOH capillary cartridgeGradient: 1.5−2 mM KOH (0−5 min), 2−8 mM (5−8 min), 8−16 mM (8−26 min),
16−70 mM (26−32 min), 70 mM (32−38 min).Flow Rate: 0.0150 mL/minInj. Volume: 0.40 µLColumn Temp.: 30 °CIC Cube Temp.: 15 °CDetection: CD: Suppressed conductivity detection, AutoSuppression™
Thermo Scientific™ Dionex™ ACES™ 300 Anion Electrolytic Suppressor, recycle mode
QD: Charge detection, 6V
Data AnalysisThermo Scientific™ Dionex™ Chromeleon™ Chromatography Data System (CDS) software.
FIGURE 3. Chromatogram of an anion standard mix.
TABLE 1. Chloride in allergy drug tablets.
To quantify chloride, nine chloride standards, from 0.1 to 500 mg/L, were used for the calibration. Figure 5 shows the CD calibration curve of chloride with a good linearity, r2 =0.9999. IC with suppressed conductivity detection (CD) is very sensitive with LOQ = 0.004 mg/L.
Data Management
Waste
H20
DegasModule*
CR-ATC*
Pump*
EGC*
* High Pressure module (up to 5000 psi)
ATC*
Non-metallic Pump
Deionized water18 MΩ-cm resistivity
Eluent Generator Cartridge
Anion Trap Column
Continuously-Regenerated Anion Trap Column
Autosampler
Anion Capillary Electrolytic Suppressor
Columns
Injection Valve with internal sample loop
Carbonate Removal Device
ConductivityDetector (CD)
Charge Detector (QD)
Recycle Mode
µA
Minutes3010 200 40
-1
10
QD
CD
µS
10
-1
1
2
3
4
5
6
7
8 9
10
11
1213
14
15
1617
18
19
20
21
22
23
Peaks Ret. T CD QD Conc.( Min) (µS-Min) (µA-Min) (mg/L)
1.Gluconate 5.45 0.324 0.210 7.52. Lactate 5.75 0.667 0.324 6.83. Acetate 6.08 0.657 0.345 9.64. Formate 7.62 0.792 0.238 8.55. Pyruvate 9.12 0.823 0.327 9.16. Galacturonate 10.60 0.487 0.298 11.17. Chloride 11.86 0.670 0.134 2.18. Nitrite 13.20 0.458 0.096 2.19. TFA 17.12 0.774 0.313 8.510. Bromide 18.19 0.599 0.110 4.211. Nitrate 19.97 0.975 0.199 4.812. Glutarate 20.50 1.003 0.481 8.613. Succinate 21.25 0.779 0.346 8.514. Carbonate - - -15. Tartrate 22.86 1.979 0.565 10.316. Benzoate 23.64 1.203 0.612 18.617. Maleate 24.99 0.631 0.249 6.618. Sulfate 26.01 0.829 0.191 3.419. Fumarate 28.82 1.587 0.489 7.520. Benzenesulfonate 30.05 1.040 0.469 17.721. Phosphate 32.29 0.660 0.289 7.822. Citrate 33.09 0.999 0.358 11.323. Tosylate 35.80 0.700 0.355 13.3
Coelution: Gluconate/Fluoride, Acetate/Glycolate, Succinate/Malate,and Tartrate/Malonate
Conclusion A versatile and easy to use anion analysis method was developed for the pharmaceutical
industry which is suitable for the study of both counter and impurity ion profiles for APIs and formulations.
Using a capillary HPIC system with CD and QD detectors, and a Dionex IonPac AS11HC-4µm capillary column:
• Twenty-two common pharmaceutical anions were separated in a single run.
• Multiple counter ions in drug products were easily identified and quantified with confidence, which facilitated the profiling of this allergy drug.
• For chloride, this method had a low limit of quantification (0.004 mg/L) and a large linear range (0.1 to 500 mg/L).
References1. FDA, CFR Title 21, Foods and Drugs, Chapter 1, Part 211 Current Good Manufacturing
Practices for Finished Pharmaceuticals http://www.accessdata.fda.gov/scripts/cdrh/cfdocs/cfcfr/CFRSearch.cfm?fr=211.110 (accessed April 15, 2014).
2. Dionex (now part of Thermo Scientific) Application Note 116: Quantification of Anions in Pharmaceuticals. Sunnyvale, CA, 2002. [Online] http://www.thermoscientific.com/content/dam/tfs/ATG/CMD/CMD%20Documents/Application%20&%20Technical%20Notes/Chromatography/GC%20HPLC%20and%20UHPLC%20Columns%20and%20Accessories/Chromatography%20Column%20Accessories/4079-AN116_LPN0924-01.pdf (accessed April 15, 2014).
3. Dionex (now part of Thermo Scientific) Application Note 164: Assay for Citrate and Phosphate in Pharmaceutical Formulation Using Ion Chromatography. Sunnyvale, CA, 2004. [Online] http://www.thermoscientific.com/content/dam/tfs/ATG/CMD/CMD%20Documents/Application%20&%20Technical%20Notes/Chromatography/GC%20HPLC%20and%20UHPLC%20Columns%20and%20Accessories/Chromatography%20Column%20Accessories/49183-AN164_LPN1643.pdf (accessed April 14, 2014).
4. Dionex (now part of Thermo Scientific) Application Note 273: Higher Resolution Separation of Organic Acids and Common Inorganic Anions in Wine. Sunnyvale, CA, 2011. [Online] http://www.thermoscientific.com/content/dam/tfs/ATG/CMD/CMD%20Documents/Application%20&%20Technical%20Notes/Chromatography/Liquid%20Chromatography/Liquid%20Chromatography%20Accessories/110622-AN273-IC-OrganicAcids-Anions-Wine-15Jun2011-LPN2727-01.pdf (accessed April 15, 2014).
µS
Minutes
3010 200-1
9
BA
C
2
3 4 651
0 200 400 600Chloride (mg/L)
0
200
Are
a (µ
S*m
in)
r2 = 0.9999 RSD = 2.08
Twenty-six of most commonly used counter ions and commonly seen impurity ions in pharmaceutical samples were included in this study. The Dionex IonPac AS11-HC-4µm capillary column was selected for its ability to separate various organic and inorganic acids in a wide range of products including fruit juices and wine.4 The 4µm resin particle technology has further improved the resolution and increased the column efficiency. As can be seen in Figure 3, 22 of 26 organic and inorganic anions were separated in a single run in less than 40 minutes. Four anions coelute with the other ions of interest, and therefore removed from the mixed standard.
The QD detector is an excellent orthogonal complement for the CD detector. Because each ion had a characteristic retention time, CD response, and QD response (Figure 3), all ions were identified and quantified with confidence using the two detectors.
µA
Minutes
3010 2000
1 2
0
3
7
61
QD
CD
45
2
µS
Peaks Ret. T Concentration( Min) (mg/L)
A B1. Acetate 6.08 0.3 −2. Chloride 11.86 8.5 1.7 3. Nitrite 13.20 0.1 −4. Nitrate 19.97 0.2 −5. Carbonate* 6. Sulfate 26.01 0.1 −
Samples:A: One tablet in 1000 mL waterB: 5-fold dilution of AC: Water blank
* System Peak
Peaks Concentration(mg/L)
CD QD1.Acetate 0.3 0.42.Chloride 8.5 8.53.Unknown <LOD −4. Nitrite 0.1 −5. Nitrate 0.2 <LOQ 6. Carbonate* 7. Sulfate 0.1 0.1
* System Peak
FIGURE 4 Anions in an allergy drug tablet.Figure 4-1 Chromatograms using
suppressed conductivity (CD) detection.Figure 4-2 Comparison of CD and QD
chromatograms.
Table 1 summarizes the results from the analysis five tablets of an allergy drug. The chloride results using CD (8.32 mg/tablet) agree with the drug label. The concentrations from QD were higher (8.36 mg/tablet), possibly attributable to the interference of unknown peak 3.
FIGURE 5 Calibration curve of chloride from 0.1 to 500 mg/L.
Results and Discussion
Conductivity Detector (CD) Charge Detector (QD)
Guard and Separation Columns
Dionex ACES 300 Suppressor
Dionex CRD 180
4-Port Injection Valve
Cap IC Degas
FIGURE 2. Thermo Scientific Dionex IC Cube module.
Figure 1 shows the schematic of the flow diagram of the HPIC system used for this application. It is a high-pressure capillary IC system (HPIC) with CD / QD detectors. The capillary IC components are configured in close proximity in Thermo Scientific™ Dionex™ IC Cube™ module (Figure 2) to minimize the flow path.

6 Identification and Quantification of 22 Common Anions in Pharmaceuticals in a Single Run Using HPIC with Suppressed Conductivity and Charge Detection
All trademarks are the property of Thermo Fisher Scientific and its subsidiaries.This information is not intended to encourage use of these products in any manners that might infringe the intellectual property rights of others.
Identification and Quantification of 22 Common Anions in Pharmaceuticals in a Single Run Using HPIC with Suppressed Conductivity and Charge DetectionHua Yang, Linda Lopez; Thermo Fisher Scientific, Sunnyvale, CA, USA
PO71116_E 05/14S
Overview An anion analysis method was developed to identify and quantify multiple counter and
impurity ions
The method described uses a capillary HPIC system with suppressed conductivity (CD) and charge (QD) detectors and a Thermo Scientific™ Dionex™ IonPac™ AS11HC-4µm capillary column. The method separates 22 common pharmaceutical anions in a single run.
The counter ion profile of an allergy drug was analyzed using the method. Chloride was quantified with high sensitivity (LOQ = 0.004 mg/L) and a large linear range (0.1 to 500 mg/L).
IntroductionIon analysis is important for the pharmaceutical industry because many active pharmaceutical ingredients (APIs) exist in their salt form. Pharmaceutical products are strictly regulated by the United States Food and Drug Administration (U.S. FDA) and other regulatory agencies, and must be tested for composition to verify their identity, strength, quality and purity.1 The importance of ion analysis for the pharmaceutical industry has increased in recent years, not only because ion analysis is required for the final products in their salt form, but also ion analysis is becoming more critical for early stage drug development. Identification and quantification of ions is used in material quality control and counter ion selection during early stage drug development. The monitoring of material quality has become increasingly critical due to increased outsourcing of API synthesis. The APIs received from vendors may be contaminated with different counter ions during their synthesis, and therefore, have different physicochemical (solubility, crystallinity, hygroscopicity) and pharmacokinetic properties; Additionally, selecting a proper counter ion to improve API solubility and stability has become a increasing critical step in formulation development due to a trend that new drug-like compounds are less and less aqueous soluble.
Conventional HPLC is not suitable for these ion analysis, because they are typically small ions that lack a chromophore and are not retained by HPLC column. Ion chromatography (IC) with suppressed conductivity detection (CD) is an established and sensitive method used for ion determination.2,3 IC has been used previously in U.S. Pharmacopeia (USP) methods for single ion analysis of final pharmaceutical products. However ion analysis method is still needed to provide both counter and impurity ion profiles for APIs and formulations, as demanded by recent pharmaceutical developments.
In this application, 26 anions, which cover the majority counter and impurity ions in pharmaceutical samples, were selected for study with the objective to identify and quantify the analytes in a single run. The counteranions were separated on a high-capacity and high efficiency, 4 µm particle ion-exchange columns, facilitated on a Reagent-Free™ IC (RFIC™) high-pressure™ capable capillary IC system (HPIC™). The counteranions were detected by suppressed conductivity detection (CD) and the ThermoScientific Dionex Charge Detector (QD). The resulting method is powerful and easy-to-use tool applicable for the pharmaceutical industry.
Chloride is the most prominent counter ion used in pharmaceuticals. The application example reported here uses the method to analyze an allergy drug in which both APIs are chloride salts.
Figure 4-1 shows the chromatograms of a water blank, an allergy drug tablet dissolved in 1000 mL water, and its 5-fold dilution. The results confirm that the drug has a clean counter ion profile with mainly chloride and trace amount of acetate, nitrite, nitrate and sulfate.
Figure 4-2 compares the CD and QD chromatograms of the undiluted sample. An additional unknown anion (peak 3) detected by QD illustrates the advantages of having two detectors that are based on different technologies. For some analytes, CD can be used to detect and quantify them, but with QD they are opaque or minimally detected and vice versa.
FIGURE 1. Schematic of capillary HPIC system with dual detectors.
ExperimentalStandards and Sample Preparation
Stock standards: Twenty-six individual stock standards (~1000 mg/L) were prepared by dissolving reagents for: chloride, gluconate, acetate, glycolate, formate, pyruvate, glucuronate, nitrate, bromide, glutarate, succinate, malate, tartrate, malonate, benzoate, maleate, sulfate, fumarate, phosphate, citrate, tosylate, benzenesulfonate, lactate, fluoride, nitrite, and trifluoroacetate in 18 MΩ-cm resistivity deionized water. Mixed standard: Prepare the mixed standard from the 1000 mg/L anion stock standardsand deionized water. Chloride calibration standards: Dilute the 1000 mg/L chloride stock solution appropriately with deionized water to make nine chloride calibration standards ranging from 0.1 to 500 mg/L.
Samples: An over-the-counter (OTC) allergy drug with API as a chloride salt was purchased from a local pharmacy. Samples were prepared by dissolving one tablet in 1000 mL of deionized water and then filtering with a 0.20 µm IC syringe filter prior to injection to remove insoluble particles. Some filtered samples were diluted with deionizedwater.
Ion Chromatography ConditionsInstrument: Thermo Scientific Dionex ICS-5000+ HPIC capillary systemColumn: Dionex IonPac AS11-HC-4µm, 0.4 × 250 mm Eluent Source: Thermo Scientific Dionex EGC-KOH capillary cartridgeGradient: 1.5−2 mM KOH (0−5 min), 2−8 mM (5−8 min), 8−16 mM (8−26 min),
16−70 mM (26−32 min), 70 mM (32−38 min).Flow Rate: 0.0150 mL/minInj. Volume: 0.40 µLColumn Temp.: 30 °CIC Cube Temp.: 15 °CDetection: CD: Suppressed conductivity detection, AutoSuppression™
Thermo Scientific™ Dionex™ ACES™ 300 Anion Electrolytic Suppressor, recycle mode
QD: Charge detection, 6V
Data AnalysisThermo Scientific™ Dionex™ Chromeleon™ Chromatography Data System (CDS) software.
FIGURE 3. Chromatogram of an anion standard mix.
TABLE 1. Chloride in allergy drug tablets.
To quantify chloride, nine chloride standards, from 0.1 to 500 mg/L, were used for the calibration. Figure 5 shows the CD calibration curve of chloride with a good linearity, r2 =0.9999. IC with suppressed conductivity detection (CD) is very sensitive with LOQ = 0.004 mg/L.
Data Management
Waste
H20
DegasModule*
CR-ATC*
Pump*
EGC*
* High Pressure module (up to 5000 psi)
ATC*
Non-metallic Pump
Deionized water18 MΩ-cm resistivity
Eluent Generator Cartridge
Anion Trap Column
Continuously-Regenerated Anion Trap Column
Autosampler
Anion Capillary Electrolytic Suppressor
Columns
Injection Valve with internal sample loop
Carbonate Removal Device
ConductivityDetector (CD)
Charge Detector (QD)
Recycle Mode
µA
Minutes3010 200 40
-1
10
QD
CD
µS
10
-1
1
2
3
4
5
6
7
8 9
10
11
1213
14
15
1617
18
19
20
21
22
23
Peaks Ret. T CD QD Conc.( Min) (µS-Min) (µA-Min) (mg/L)
1.Gluconate 5.45 0.324 0.210 7.52. Lactate 5.75 0.667 0.324 6.83. Acetate 6.08 0.657 0.345 9.64. Formate 7.62 0.792 0.238 8.55. Pyruvate 9.12 0.823 0.327 9.16. Galacturonate 10.60 0.487 0.298 11.17. Chloride 11.86 0.670 0.134 2.18. Nitrite 13.20 0.458 0.096 2.19. TFA 17.12 0.774 0.313 8.510. Bromide 18.19 0.599 0.110 4.211. Nitrate 19.97 0.975 0.199 4.812. Glutarate 20.50 1.003 0.481 8.613. Succinate 21.25 0.779 0.346 8.514. Carbonate - - -15. Tartrate 22.86 1.979 0.565 10.316. Benzoate 23.64 1.203 0.612 18.617. Maleate 24.99 0.631 0.249 6.618. Sulfate 26.01 0.829 0.191 3.419. Fumarate 28.82 1.587 0.489 7.520. Benzenesulfonate 30.05 1.040 0.469 17.721. Phosphate 32.29 0.660 0.289 7.822. Citrate 33.09 0.999 0.358 11.323. Tosylate 35.80 0.700 0.355 13.3
Coelution: Gluconate/Fluoride, Acetate/Glycolate, Succinate/Malate,and Tartrate/Malonate
Conclusion A versatile and easy to use anion analysis method was developed for the pharmaceutical
industry which is suitable for the study of both counter and impurity ion profiles for APIs and formulations.
Using a capillary HPIC system with CD and QD detectors, and a Dionex IonPac AS11HC-4µm capillary column:
• Twenty-two common pharmaceutical anions were separated in a single run.
• Multiple counter ions in drug products were easily identified and quantified with confidence, which facilitated the profiling of this allergy drug.
• For chloride, this method had a low limit of quantification (0.004 mg/L) and a large linear range (0.1 to 500 mg/L).
References1. FDA, CFR Title 21, Foods and Drugs, Chapter 1, Part 211 Current Good Manufacturing
Practices for Finished Pharmaceuticals http://www.accessdata.fda.gov/scripts/cdrh/cfdocs/cfcfr/CFRSearch.cfm?fr=211.110 (accessed April 15, 2014).
2. Dionex (now part of Thermo Scientific) Application Note 116: Quantification of Anions in Pharmaceuticals. Sunnyvale, CA, 2002. [Online] http://www.thermoscientific.com/content/dam/tfs/ATG/CMD/CMD%20Documents/Application%20&%20Technical%20Notes/Chromatography/GC%20HPLC%20and%20UHPLC%20Columns%20and%20Accessories/Chromatography%20Column%20Accessories/4079-AN116_LPN0924-01.pdf (accessed April 15, 2014).
3. Dionex (now part of Thermo Scientific) Application Note 164: Assay for Citrate and Phosphate in Pharmaceutical Formulation Using Ion Chromatography. Sunnyvale, CA, 2004. [Online] http://www.thermoscientific.com/content/dam/tfs/ATG/CMD/CMD%20Documents/Application%20&%20Technical%20Notes/Chromatography/GC%20HPLC%20and%20UHPLC%20Columns%20and%20Accessories/Chromatography%20Column%20Accessories/49183-AN164_LPN1643.pdf (accessed April 14, 2014).
4. Dionex (now part of Thermo Scientific) Application Note 273: Higher Resolution Separation of Organic Acids and Common Inorganic Anions in Wine. Sunnyvale, CA, 2011. [Online] http://www.thermoscientific.com/content/dam/tfs/ATG/CMD/CMD%20Documents/Application%20&%20Technical%20Notes/Chromatography/Liquid%20Chromatography/Liquid%20Chromatography%20Accessories/110622-AN273-IC-OrganicAcids-Anions-Wine-15Jun2011-LPN2727-01.pdf (accessed April 15, 2014).
µS
Minutes
3010 200-1
9
BA
C
2
3 4 651
0 200 400 600Chloride (mg/L)
0
200
Are
a (µ
S*m
in)
r2 = 0.9999 RSD = 2.08
Twenty-six of most commonly used counter ions and commonly seen impurity ions in pharmaceutical samples were included in this study. The Dionex IonPac AS11-HC-4µm capillary column was selected for its ability to separate various organic and inorganic acids in a wide range of products including fruit juices and wine.4 The 4µm resin particle technology has further improved the resolution and increased the column efficiency. As can be seen in Figure 3, 22 of 26 organic and inorganic anions were separated in a single run in less than 40 minutes. Four anions coelute with the other ions of interest, and therefore removed from the mixed standard.
The QD detector is an excellent orthogonal complement for the CD detector. Because each ion had a characteristic retention time, CD response, and QD response (Figure 3), all ions were identified and quantified with confidence using the two detectors.
µA
Minutes
3010 2000
1 2
0
3
7
61
QD
CD
45
2
µS
Peaks Ret. T Concentration( Min) (mg/L)
A B1. Acetate 6.08 0.3 −2. Chloride 11.86 8.5 1.7 3. Nitrite 13.20 0.1 −4. Nitrate 19.97 0.2 −5. Carbonate* 6. Sulfate 26.01 0.1 −
Samples:A: One tablet in 1000 mL waterB: 5-fold dilution of AC: Water blank
* System Peak
Peaks Concentration(mg/L)
CD QD1.Acetate 0.3 0.42.Chloride 8.5 8.53.Unknown <LOD −4. Nitrite 0.1 −5. Nitrate 0.2 <LOQ 6. Carbonate* 7. Sulfate 0.1 0.1
* System Peak
FIGURE 4 Anions in an allergy drug tablet.Figure 4-1 Chromatograms using
suppressed conductivity (CD) detection.Figure 4-2 Comparison of CD and QD
chromatograms.
Table 1 summarizes the results from the analysis five tablets of an allergy drug. The chloride results using CD (8.32 mg/tablet) agree with the drug label. The concentrations from QD were higher (8.36 mg/tablet), possibly attributable to the interference of unknown peak 3.
FIGURE 5 Calibration curve of chloride from 0.1 to 500 mg/L.
Results and Discussion
Conductivity Detector (CD) Charge Detector (QD)
Guard and Separation Columns
Dionex ACES 300 Suppressor
Dionex CRD 180
4-Port Injection Valve
Cap IC Degas
FIGURE 2. Thermo Scientific Dionex IC Cube module.
Figure 1 shows the schematic of the flow diagram of the HPIC system used for this application. It is a high-pressure capillary IC system (HPIC) with CD / QD detectors. The capillary IC components are configured in close proximity in Thermo Scientific™ Dionex™ IC Cube™ module (Figure 2) to minimize the flow path.

Thermo Fisher Scientific, Sunnyvale, CA USA is ISO 9001:2008 Certified.
www.thermoscientific.com©2014 Thermo Fisher Scientific Inc. All rights reserved. ISO is a trademark of the International Standards Organization. All other trademarks are the property of Thermo Fisher Scientific Inc. and its subsidiaries. This information is presented as an example of the capabilities of Thermo Fisher Scientific Inc. products. It is not intended to encourage use of these products in any manners that might infringe the intellectual property rights of others. Specifications, terms and pricing are subject to change. Not all products are available in all countries. Please consult your local sales representative for details.
PN71116_E 05/14S
Africa +43 1 333 50 34 0Australia +61 3 9757 4300Austria +43 810 282 206Belgium +32 53 73 42 41Brazil +55 11 3731 5140Canada +1 800 530 8447China 800 810 5118 (free call domestic)
400 650 5118
Denmark +45 70 23 62 60Europe-Other +43 1 333 50 34 0Finland +358 9 3291 0200France +33 1 60 92 48 00Germany +49 6103 408 1014India +91 22 6742 9494Italy +39 02 950 591
Japan +81 6 6885 1213Korea +82 2 3420 8600Latin America +1 561 688 8700Middle East +43 1 333 50 34 0Netherlands +31 76 579 55 55 New Zealand +64 9 980 6700 Norway +46 8 556 468 00
Russia/CIS +43 1 333 50 34 0Singapore +65 6289 1190Sweden +46 8 556 468 00 Switzerland +41 61 716 77 00Taiwan +886 2 8751 6655UK/Ireland +44 1442 233555USA +1 800 532 4752
All trademarks are the property of Thermo Fisher Scientific and its subsidiaries.This information is not intended to encourage use of these products in any manners that might infringe the intellectual property rights of others.
Identification and Quantification of 22 Common Anions in Pharmaceuticals in a Single Run Using HPIC with Suppressed Conductivity and Charge DetectionHua Yang, Linda Lopez; Thermo Fisher Scientific, Sunnyvale, CA, USA
PO71116_E 05/14S
Overview An anion analysis method was developed to identify and quantify multiple counter and
impurity ions
The method described uses a capillary HPIC system with suppressed conductivity (CD) and charge (QD) detectors and a Thermo Scientific™ Dionex™ IonPac™ AS11HC-4µm capillary column. The method separates 22 common pharmaceutical anions in a single run.
The counter ion profile of an allergy drug was analyzed using the method. Chloride was quantified with high sensitivity (LOQ = 0.004 mg/L) and a large linear range (0.1 to 500 mg/L).
IntroductionIon analysis is important for the pharmaceutical industry because many active pharmaceutical ingredients (APIs) exist in their salt form. Pharmaceutical products are strictly regulated by the United States Food and Drug Administration (U.S. FDA) and other regulatory agencies, and must be tested for composition to verify their identity, strength, quality and purity.1 The importance of ion analysis for the pharmaceutical industry has increased in recent years, not only because ion analysis is required for the final products in their salt form, but also ion analysis is becoming more critical for early stage drug development. Identification and quantification of ions is used in material quality control and counter ion selection during early stage drug development. The monitoring of material quality has become increasingly critical due to increased outsourcing of API synthesis. The APIs received from vendors may be contaminated with different counter ions during their synthesis, and therefore, have different physicochemical (solubility, crystallinity, hygroscopicity) and pharmacokinetic properties; Additionally, selecting a proper counter ion to improve API solubility and stability has become a increasing critical step in formulation development due to a trend that new drug-like compounds are less and less aqueous soluble.
Conventional HPLC is not suitable for these ion analysis, because they are typically small ions that lack a chromophore and are not retained by HPLC column. Ion chromatography (IC) with suppressed conductivity detection (CD) is an established and sensitive method used for ion determination.2,3 IC has been used previously in U.S. Pharmacopeia (USP) methods for single ion analysis of final pharmaceutical products. However ion analysis method is still needed to provide both counter and impurity ion profiles for APIs and formulations, as demanded by recent pharmaceutical developments.
In this application, 26 anions, which cover the majority counter and impurity ions in pharmaceutical samples, were selected for study with the objective to identify and quantify the analytes in a single run. The counteranions were separated on a high-capacity and high efficiency, 4 µm particle ion-exchange columns, facilitated on a Reagent-Free™ IC (RFIC™) high-pressure™ capable capillary IC system (HPIC™). The counteranions were detected by suppressed conductivity detection (CD) and the ThermoScientific Dionex Charge Detector (QD). The resulting method is powerful and easy-to-use tool applicable for the pharmaceutical industry.
Chloride is the most prominent counter ion used in pharmaceuticals. The application example reported here uses the method to analyze an allergy drug in which both APIs are chloride salts.
Figure 4-1 shows the chromatograms of a water blank, an allergy drug tablet dissolved in 1000 mL water, and its 5-fold dilution. The results confirm that the drug has a clean counter ion profile with mainly chloride and trace amount of acetate, nitrite, nitrate and sulfate.
Figure 4-2 compares the CD and QD chromatograms of the undiluted sample. An additional unknown anion (peak 3) detected by QD illustrates the advantages of having two detectors that are based on different technologies. For some analytes, CD can be used to detect and quantify them, but with QD they are opaque or minimally detected and vice versa.
FIGURE 1. Schematic of capillary HPIC system with dual detectors.
ExperimentalStandards and Sample Preparation
Stock standards: Twenty-six individual stock standards (~1000 mg/L) were prepared by dissolving reagents for: chloride, gluconate, acetate, glycolate, formate, pyruvate, glucuronate, nitrate, bromide, glutarate, succinate, malate, tartrate, malonate, benzoate, maleate, sulfate, fumarate, phosphate, citrate, tosylate, benzenesulfonate, lactate, fluoride, nitrite, and trifluoroacetate in 18 MΩ-cm resistivity deionized water. Mixed standard: Prepare the mixed standard from the 1000 mg/L anion stock standardsand deionized water. Chloride calibration standards: Dilute the 1000 mg/L chloride stock solution appropriately with deionized water to make nine chloride calibration standards ranging from 0.1 to 500 mg/L.
Samples: An over-the-counter (OTC) allergy drug with API as a chloride salt was purchased from a local pharmacy. Samples were prepared by dissolving one tablet in 1000 mL of deionized water and then filtering with a 0.20 µm IC syringe filter prior to injection to remove insoluble particles. Some filtered samples were diluted with deionizedwater.
Ion Chromatography Conditions
Instrument: Thermo Scientific Dionex ICS-5000+ HPIC capillary systemColumn: Dionex IonPac AS11-HC-4µm, 0.4 × 250 mm Eluent Source: Thermo Scientific Dionex EGC-KOH capillary cartridgeGradient: 1.5−2 mM KOH (0−5 min), 2−8 mM (5−8 min), 8−16 mM (8−26 min),
16−70 mM (26−32 min), 70 mM (32−38 min).Flow Rate: 0.0150 mL/minInj. Volume: 0.40 µLColumn Temp.: 30 °CIC Cube Temp.: 15 °CDetection: CD: Suppressed conductivity detection, AutoSuppression™
Thermo Scientific™ Dionex™ ACES™ 300 Anion Electrolytic Suppressor, recycle mode
QD: Charge detection, 6V
Data AnalysisThermo Scientific™ Dionex™ Chromeleon™ Chromatography Data System (CDS) software.
FIGURE 3. Chromatogram of an anion standard mix.
TABLE 1. Chloride in allergy drug tablets.
To quantify chloride, nine chloride standards, from 0.1 to 500 mg/L, were used for the calibration. Figure 5 shows the CD calibration curve of chloride with a good linearity, r2 =0.9999. IC with suppressed conductivity detection (CD) is very sensitive with LOQ = 0.004 mg/L.
Data Management
Waste
H20
DegasModule*
CR-ATC*
Pump*
EGC*
* High Pressure module (up to 5000 psi)
ATC*
Non-metallic Pump
Deionized water18 MΩ-cm resistivity
Eluent Generator Cartridge
Anion Trap Column
Continuously-Regenerated Anion Trap Column
Autosampler
Anion Capillary Electrolytic Suppressor
Columns
Injection Valve with internal sample loop
Carbonate Removal Device
ConductivityDetector (CD)
Charge Detector (QD)
Recycle Mode
µA
Minutes3010 200 40
-1
10
QD
CD
µS
10
-1
1
2
3
4
5
6
7
8 9
10
11
1213
14
15
1617
18
19
20
21
22
23
Peaks Ret. T CD QD Conc.( Min) (µS-Min) (µA-Min) (mg/L)
1.Gluconate 5.45 0.324 0.210 7.52. Lactate 5.75 0.667 0.324 6.83. Acetate 6.08 0.657 0.345 9.64. Formate 7.62 0.792 0.238 8.55. Pyruvate 9.12 0.823 0.327 9.16. Galacturonate 10.60 0.487 0.298 11.17. Chloride 11.86 0.670 0.134 2.18. Nitrite 13.20 0.458 0.096 2.19. TFA 17.12 0.774 0.313 8.510. Bromide 18.19 0.599 0.110 4.211. Nitrate 19.97 0.975 0.199 4.812. Glutarate 20.50 1.003 0.481 8.613. Succinate 21.25 0.779 0.346 8.514. Carbonate - - -15. Tartrate 22.86 1.979 0.565 10.316. Benzoate 23.64 1.203 0.612 18.617. Maleate 24.99 0.631 0.249 6.618. Sulfate 26.01 0.829 0.191 3.419. Fumarate 28.82 1.587 0.489 7.520. Benzenesulfonate 30.05 1.040 0.469 17.721. Phosphate 32.29 0.660 0.289 7.822. Citrate 33.09 0.999 0.358 11.323. Tosylate 35.80 0.700 0.355 13.3
Coelution: Gluconate/Fluoride, Acetate/Glycolate, Succinate/Malate,and Tartrate/Malonate
Conclusion A versatile and easy to use anion analysis method was developed for the pharmaceutical
industry which is suitable for the study of both counter and impurity ion profiles for APIs and formulations.
Using a capillary HPIC system with CD and QD detectors, and a Dionex IonPac AS11HC-4µm capillary column:
• Twenty-two common pharmaceutical anions were separated in a single run.
• Multiple counter ions in drug products were easily identified and quantified with confidence, which facilitated the profiling of this allergy drug.
• For chloride, this method had a low limit of quantification (0.004 mg/L) and a large linear range (0.1 to 500 mg/L).
References1. FDA, CFR Title 21, Foods and Drugs, Chapter 1, Part 211 Current Good Manufacturing
Practices for Finished Pharmaceuticals http://www.accessdata.fda.gov/scripts/cdrh/cfdocs/cfcfr/CFRSearch.cfm?fr=211.110 (accessed April 15, 2014).
2. Dionex (now part of Thermo Scientific) Application Note 116: Quantification of Anions in Pharmaceuticals. Sunnyvale, CA, 2002. [Online] http://www.thermoscientific.com/content/dam/tfs/ATG/CMD/CMD%20Documents/Application%20&%20Technical%20Notes/Chromatography/GC%20HPLC%20and%20UHPLC%20Columns%20and%20Accessories/Chromatography%20Column%20Accessories/4079-AN116_LPN0924-01.pdf (accessed April 15, 2014).
3. Dionex (now part of Thermo Scientific) Application Note 164: Assay for Citrate and Phosphate in Pharmaceutical Formulation Using Ion Chromatography. Sunnyvale, CA, 2004. [Online] http://www.thermoscientific.com/content/dam/tfs/ATG/CMD/CMD%20Documents/Application%20&%20Technical%20Notes/Chromatography/GC%20HPLC%20and%20UHPLC%20Columns%20and%20Accessories/Chromatography%20Column%20Accessories/49183-AN164_LPN1643.pdf (accessed April 14, 2014).
4. Dionex (now part of Thermo Scientific) Application Note 273: Higher Resolution Separation of Organic Acids and Common Inorganic Anions in Wine. Sunnyvale, CA, 2011. [Online] http://www.thermoscientific.com/content/dam/tfs/ATG/CMD/CMD%20Documents/Application%20&%20Technical%20Notes/Chromatography/Liquid%20Chromatography/Liquid%20Chromatography%20Accessories/110622-AN273-IC-OrganicAcids-Anions-Wine-15Jun2011-LPN2727-01.pdf (accessed April 15, 2014).
µS
Minutes
3010 200-1
9
BA
C
2
3 4 651
0 200 400 600Chloride (mg/L)
0
200
Are
a (µ
S*m
in)
r2 = 0.9999 RSD = 2.08
Twenty-six of most commonly used counter ions and commonly seen impurity ions in pharmaceutical samples were included in this study. The Dionex IonPac AS11-HC-4µm capillary column was selected for its ability to separate various organic and inorganic acids in a wide range of products including fruit juices and wine.4 The 4µm resin particle technology has further improved the resolution and increased the column efficiency. As can be seen in Figure 3, 22 of 26 organic and inorganic anions were separated in a single run in less than 40 minutes. Four anions coelute with the other ions of interest, and therefore removed from the mixed standard.
The QD detector is an excellent orthogonal complement for the CD detector. Because each ion had a characteristic retention time, CD response, and QD response (Figure 3), all ions were identified and quantified with confidence using the two detectors.
µA
Minutes
3010 2000
1 2
0
3
7
61
QD
CD
45
2
µS
Peaks Ret. T Concentration( Min) (mg/L)
A B1. Acetate 6.08 0.3 −2. Chloride 11.86 8.5 1.7 3. Nitrite 13.20 0.1 −4. Nitrate 19.97 0.2 −5. Carbonate* 6. Sulfate 26.01 0.1 −
Samples:A: One tablet in 1000 mL waterB: 5-fold dilution of AC: Water blank
* System Peak
Peaks Concentration(mg/L)
CD QD1.Acetate 0.3 0.42.Chloride 8.5 8.53.Unknown <LOD −4. Nitrite 0.1 −5. Nitrate 0.2 <LOQ 6. Carbonate* 7. Sulfate 0.1 0.1
* System Peak
FIGURE 4 Anions in an allergy drug tablet.Figure 4-1 Chromatograms using
suppressed conductivity (CD) detection.Figure 4-2 Comparison of CD and QD
chromatograms.
Table 1 summarizes the results from the analysis five tablets of an allergy drug. The chloride results using CD (8.32 mg/tablet) agree with the drug label. The concentrations from QD were higher (8.36 mg/tablet), possibly attributable to the interference of unknown peak 3.
FIGURE 5 Calibration curve of chloride from 0.1 to 500 mg/L.
Results and Discussion
Conductivity Detector (CD) Charge Detector (QD)
Guard and Separation Columns
Dionex ACES 300 Suppressor
Dionex CRD 180
4-Port Injection Valve
Cap IC Degas
FIGURE 2. Thermo Scientific Dionex IC Cube module.
Figure 1 shows the schematic of the flow diagram of the HPIC system used for this application. It is a high-pressure capillary IC system (HPIC) with CD / QD detectors. The capillary IC components are configured in close proximity in Thermo Scientific™ Dionex™ IC Cube™ module (Figure 2) to minimize the flow path.