Idaho State Board of Education 2017 Teacher Pipeline Report · Idaho State Board of Education 2017...
64
Idaho State Board of Education 2017 Teacher Pipeline Report Christina Linder Cathleen M. McHugh, Ph.D. Educator Effectiveness Program Manager Principal Research Analyst Idaho State Board of Education Idaho State Board of Education Introduction As part of the Governor’s Task Force for Improving Education (2013) and the subsequent work done by the State Board of Education (Board) in implementing the recommendations regarding tiered certification and a teacher pay “Career Ladder”, some discrepancies were revealed regarding certain certification requirements. At the August 2015 Board meeting the Board discussed possible solutions for these issues and heard reports from school districts regarding the difficulty to fill certain positions. The Board reviewed data and reports on educator supply and demand in December of 2015 and then again in August 2016. As a result, Board staff were directed to bring together a broad group of education stakeholders to make recommendations on ways to increase and strengthen the educator pipeline. The initial meeting of the workgroup was held on February 8, 2017, followed by three subgroup convenings from April 27 through May 3, 2017. The group then formalized early recommendations sent to the Board on April 20, 2017. Areas considered by the workgroup included attracting and retaining candidates in teacher preparation programs, recruiting individuals into the profession through traditional, non-traditional, and alternate pathways, incentivizing and attracting educators to teach in our rural and underserved areas, and recruiting and retaining educators for hard-to-fill subject areas such as special education. On June 6, 2017, and then again on October 12, 2017, the full committee reconvened to further define recommendations identified as critical to developing Idaho’s Educator Pipeline. Final recommendations at the conclusion of this report fall into the following three categories: 1. Develop an Idaho Teacher Supply and Demand Report consisting of multiple data points to determine if, where, and why a teacher shortage exists in Idaho 2. Begin developing a coherent policy dialogue 3. Further explore workgroup proposals outlined below: a. Attract/Recruit: Openly promote teaching as a profession to boost public perception ; Continue to support higher salaries and compensation packages b. Prepare/Certify: Expand options in preparation and certification to include mastery-based preparation programs that account for experiential credit; closer alignment between secondary and postsecondary education to expedite preparation for high school students interested in teaching c. Retain: Development and support for teachers including induction programs and greater teacher-leader opportunities; emphasize evaluation for the purpose of professional growth and measurable outcomes that are teacher driven PLANNING, POLICY AND GOVERNMENTAL AFFAIRS DECEMBER 21, 2017 PPGA TAB 5 Page 5
Transcript of Idaho State Board of Education 2017 Teacher Pipeline Report · Idaho State Board of Education 2017...

Idaho State Board of Education 2017 Teacher Pipeline Report
Christina Linder Cathleen M. McHugh, Ph.D. Educator Effectiveness Program Manager Principal Research Analyst Idaho State Board of Education Idaho State Board of Education
Introduction
As part of the Governor’s Task Force for Improving Education (2013) and the subsequent work done by the State Board of Education (Board) in implementing the recommendations regarding tiered certification and a teacher pay “Career Ladder”, some discrepancies were revealed regarding certain certification requirements. At the August 2015 Board meeting the Board discussed possible solutions for these issues and heard reports from school districts regarding the difficulty to fill certain positions. The Board reviewed data and reports on educator supply and demand in December of 2015 and then again in August 2016. As a result, Board staff were directed to bring together a broad group of education stakeholders to make recommendations on ways to increase and strengthen the educator pipeline.
The initial meeting of the workgroup was held on February 8, 2017, followed by three subgroup convenings from April 27 through May 3, 2017. The group then formalized early recommendations sent to the Board on April 20, 2017. Areas considered by the workgroup included attracting and retaining candidates in teacher preparation programs, recruiting individuals into the profession through traditional, non-traditional, and alternate pathways, incentivizing and attracting educators to teach in our rural and underserved areas, and recruiting and retaining educators for hard-to-fill subject areas such as special education. On June 6, 2017, and then again on October 12, 2017, the full committee reconvened to further define recommendations identified as critical to developing Idaho’s Educator Pipeline. Final recommendations at the conclusion of this report fall into the following three categories:
1. Develop an Idaho Teacher Supply and Demand Report consisting of multiple datapoints to determine if, where, and why a teacher shortage exists in Idaho
2. Begin developing a coherent policy dialogue
3. Further explore workgroup proposals outlined below:a. Attract/Recruit: Openly promote teaching as a profession to boost public
perception ; Continue to support higher salaries and compensation packages
b. Prepare/Certify: Expand options in preparation and certification to includemastery-based preparation programs that account for experiential credit; closeralignment between secondary and postsecondary education to expeditepreparation for high school students interested in teaching
c. Retain: Development and support for teachers including induction programs andgreater teacher-leader opportunities; emphasize evaluation for the purpose ofprofessional growth and measurable outcomes that are teacher driven
PLANNING, POLICY AND GOVERNMENTAL AFFAIRS DECEMBER 21, 2017
PPGA TAB 5 Page 5
Discussion
Producing an Idaho Teacher Supply and Demand Report that consists of multiple data points is critical to discovering trends over time and creating a cohesive, statewide dialogue about teacher shortages. The goal for this initial report was to collect baseline data from multiple sources to: 1) begin building consensus around the most meaningful and relevant indicators of supply and demand for Idaho; 2) precisely characterize each of the indicators; 3) define what we expect to learn from the indicators and how they will guide policy, and; 4) determine measurable goals. What follows is an overview of the information the workgroup agreed would be a most useful to begin defining and annual supply and demand report:
• What patterns exist in teacher staffing over the last three years? What are the areas of shortage and surplus in teacher certification? Do these patterns vary by region of the state?
• Are there differences in the teacher shortage areas in charter schools, rural schools, and urban schools?
• What K–12 public school enrollment trends are expected for the next three to five years? • How do district leaders perceive teacher shortage areas in their own districts?
Regarding the final bullet in this list, Pipeline Workgroup members had access to, and approved, replication of the district leader perception survey utilized in the Minnesota Teacher Supply and Demand Report. At the final meeting held in October 2017, however, a vocal segment of the members indicated concern about the instrument and consequently, the results. For that reason, the perceptions of district leaders regarding teacher shortages in their schools are not officially included in the body of this report. The survey instrument will be revised for future use, and a summary overview of the data originally intended for this report appears as Attachment 3. Final sources of data used to compile this report include the Teacher Certification Database, School Staffing Reports, Title II Reports and information supplied by the Idaho Department of Labor. Due to multiple adjustments over time affecting the consistency of the Teacher Certification Database, no information collected prior to FY14 was analyzed for inclusion in this report. All of the information that follows is based upon instructional staff certifications, including CTE, and excluding certificates with only Administrator or Pupil Personnel Services endorsements. See Appendix I located in Attachment 2- Idaho Pipeline Report Detail for a list of endorsements included, and how they were classified for the purpose of this report. Additionally, to distinguish between urban and rural districts, the NCES Urban-Centric Locale Definitions were used throughout. Those definitions and the classification for each Idaho district is included here as Attachment 4.
PLANNING, POLICY AND GOVERNMENTAL AFFAIRS DECEMBER 21, 2017
PPGA TAB 5 Page 6

Findings The primary task of the teacher pipeline workgroup was identify to what degree Idaho is experiencing a teaching shortage, drawing upon all available information; anecdotal evidence, survey data, and state reports. As noted in “A Coming Crisis in Teaching?” (Sutcher, Darling-Hammond,& Carver-Thomas, 2016), the term “teacher shortage” is often narrowly defined as an insufficient production of new teachers in light of the size of student enrollments and teacher retirements. However, “teacher staffing problems are driven by a myriad of factors, including not only production of new teachers in various fields, but also teacher turnover, changes in educational programs and pupil-teacher ratios, and the attractiveness of teaching generally and in specific locations” (Sutcher, et al., 2016, p.10). This report will explore a number of characteristics that contribute to shortages in Idaho, and begin to identify where policy can have the greatest impact. Among the findings in this report:
• Approximately 1,873 Idaho instructional certificates are issued annually; of thosecertificated individuals, approximately 33% do not serve in an Idaho public school
• The attrition rate for Idaho teachers remains at a steady 10% annually, compared toapproximately 8% nationally
• Approximately 76% of Idaho’s attrition rate is made up of teachers leaving the teachingworkforce before reaching retirement age, compared to 66% of teachers nationally
The following report will provide a foundation for understanding the issues facing Idaho’s teacher pipeline, and attempt to align the workgroup’s recommendations for Board consideration.
Part One: Teacher Supply in Idaho
This section of the report will explore the number of teachers being produced by Idaho’s universities and colleges that may be eligible for certification, and provide an overview of Idaho’s existing supply of teachers and their content area endorsements.
Detail on candidates enrolled in Idaho’s educator preparation programs and information on the content area emphasis in which they are being prepared has been inconsistent, and therefore is not included in this report. Definitions of enrollment and content area have now been defined for use by all institutions, and this data will be collected for the 2016-17 academic year and beyond. Title II information on those completing Idaho’s programs is consistent and reliable only for the two years included below.
Table 1: Potential new teachers (Completers) produced by traditional Idaho educator preparation programs
Year Completers by Program Totals Boise State
BYU Idaho
Idaho State
College of Idaho
LCSC NNU U of Idaho
2014-15 196 320 83 12 48 54 108 821 2015-16 172 384 92 20 49 56 99 872
PLANNING, POLICY AND GOVERNMENTAL AFFAIRS DECEMBER 21, 2017
PPGA TAB 5 Page 7

In summary, while we do not have enough accurate data to determine a trend, in the last two years Idaho institutions of higher education have annually produced approximately 846 completers who are generally eligible for certification. Beginning with data from FY17, the content areas in which these candidates are being prepared will be closely followed. Some of Idaho’s institutions have made concerted efforts to increase the number of candidates qualified for certification in Special Education and STEM fields.
The following is a breakdown of the approximately 15,000 active instructional staff by content area endorsement. Total certificates issued include teachers receiving full certification as well as interim certification. Interim certification is temporary, and can only be utilized for a maximum of three years while a candidate is meeting the state’s requirements for full certification (with the exception of the Provisional and Alternate Authorization to Endorsement). Interim certification that is renewable for up to three years encompasses all Board-approved alternative pathways. Alternative pathways include American Board Certified Teachers of Excellence (ABCTE), Teach for America (TFA), Content-Specialist Alternative Authorization, and Teacher to New Certificate. Alternative Authorization to Endorsement and Provisional certificate routes are valid for a period of one year.
Table 2: Number receiving Idaho certifications issued with Special Education endorsement
Year Total SpEd certificates issued 2013-2014 260 2014-2015 237 2015-2016 282 2016-2017 292 Note: A teacher that received more than one certification would only appear once in this tally.
Table 3: Number receiving Idaho certifications issued with Career Technical endorsement
Year Total CTE certificates issued 2013-2014 33 2014-2015 51 2015-2016 61 2016-2017 56 Note: A teacher that received more than one certification would only appear once in this tally.
Table 4: Idaho certifications issued for content endorsements, by area of assignment
STEM Content Areas
Mathematics Life and Physical Science
Computer and Informational Systems
2013-2014 187 142 19 2014-2015 150 138 21 2015-2016 172 171 19 2016-2017 207 184 14
PLANNING, POLICY AND GOVERNMENTAL AFFAIRS DECEMBER 21, 2017
PPGA TAB 5 Page 8
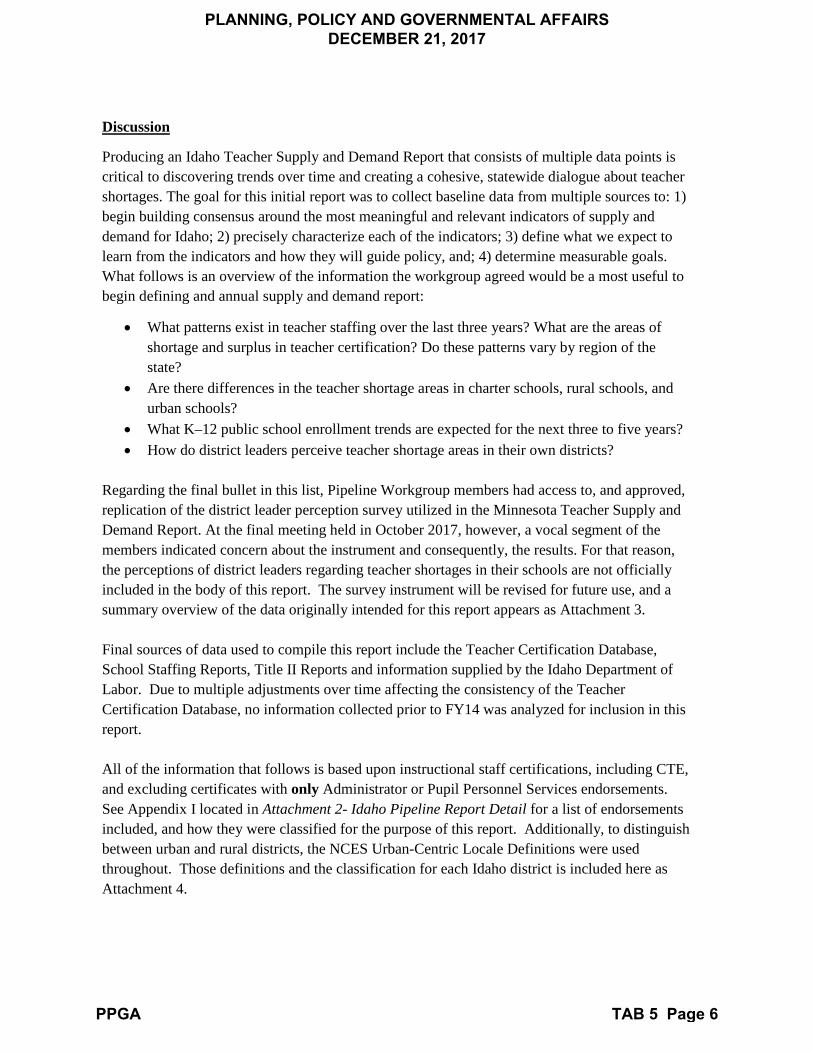
Languages and Humanities
English Language and
Literature World Language Humanities 2013-2014 436 74 568 2014-2015 380 68 500 2015-2016 407 48 485 2016-2017 416 63 488
Other
Social Science Fine and Performing Arts
Physical, Health, and Safety
2013-2014 213 247 97 2014-2015 192 194 75 2015-2016 168 200 75 2016-2017 187 173 86
Note: Area of assignment was determined by using the crosswalk between endorsements and assignments provided by SDE in the 2016-17 Assignment Credential Manual. See appendix found in Attachment A for a list of which endorsements are counted in each category. A teacher that received more than one endorsement would appear more than once in these tables; duplicated across content areas but not within.
In general, while the number of teachers certified to teach STEM courses has increased, the number of teachers certified to teach other subjects has decreased.
The following table illustrates the total number of individuals issued an initial certificate to teach in Idaho, including the percentages of those who were issued a certificate but did not choose to teach in an Idaho public school.
Table 5: Number receiving new Idaho certifications (non-duplicated), with instructional endorsements
Certificates issued to those who were employed in Idaho Share not employed
as instructional staff in an
Idaho Public School
Academic Certificates Certification period is from Sept 1-August 31 Total
certificates issued
State of first certification
CTE Certificates Total Idaho Other state 2013-2014 1,932 1,249 828 421 33 35% 2014-2015 1,720 1,180 782 398 51 31% 2015-2016 1,889 1,298 909 389 61 31% 2016-2017 1,952 1,234 821 413 56 37%
Notes: Certification period is from Sept 1-August 31. Excludes certifications with only Administration or Pupil Personnel Services endorsements. A teacher that received more than one certification would only appear once in this tally. Total certificates issued includes certificates issued to teachers who never had a teaching assignment in Idaho. State of first certification is not available for these teachers. CTE Certificates are those certificates with only CTE endorsements. Teachers with both academic and CTE endorsements would be included in the Academic certificates group
PLANNING, POLICY AND GOVERNMENTAL AFFAIRS DECEMBER 21, 2017
PPGA TAB 5 Page 9

It is significant to note that approximately one third of the teachers who become certified in Idaho each year are not employed in Idaho as teachers. This critical finding must be further studied. Are these potential Idaho teachers using their teaching certificates in border states? Are they choosing other professions within the state? Are these potential educators choosing to stay home with their families rather than teach and, if so, could they be enticed into the classroom with part-time opportunities and job sharing? Or, are these teachers unable to find jobs in the content area in which they were prepared, or the geographic locations they desire?
Future reports will track the subject areas held by this pool of teachers to further understand the population. If it can be determined why approximately 700 new teachers choose not to (or are unable to) teach in Idaho public schools every year, state policymakers would have critical information to shape future education policy.
Part Two: Teacher Demand in Idaho
Growth Projections
The Idaho Department of Labor projects the average increase in demand for teachers to average 1.5% annually over time.
Figure 1. Teacher Demand Projections 2014-2024 Idaho Department of Labor Long Term Projections
The number of instructional staff working in Idaho’s public schools averages 15,530 each year. After accounting for Idaho’s steady attrition rate that results in the loss of approximately 1,553
Idaho State Total
Growth in Demand for Teachers 2014-2024 :
15.5%
Annual Average Growth Rate in Demand for
Teachers: 1.5%
Regions:
Region 1 – 1.5% Region 2 – 1.0% Region 3 – 2.1% Region 4 – 1.0% Region 5 – 0.8% Region 6 – 1.3%
PLANNING, POLICY AND GOVERNMENTAL AFFAIRS DECEMBER 21, 2017
PPGA TAB 5 Page 10
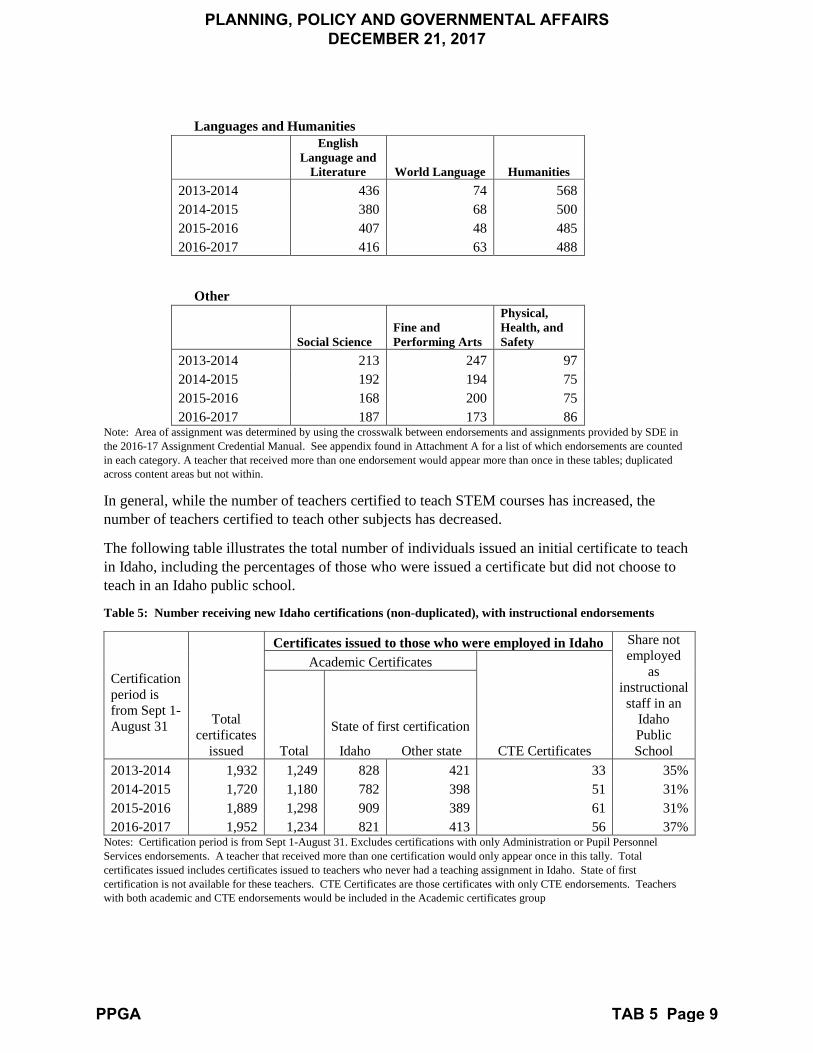
teachers annually, an additional 233 must be hired in various districts across the state to counter growth of student populations. The following tables illustrate attrition patterns of teachers with instructional teaching assignments.
Attrition of Idaho Teachers Statewide
According to national statistics, teacher attrition compared to other professions is high, and averages 8% annually (Sutcher, et al., 2016,). In the following table, Idaho’s attrition rates are examined according to a number of factors; age, years of experience, by cohort, and by region. A teacher is counted as leaving if that teacher had an instructional assignment in one year and did not have an instructional assignment in the next year.
Table 6: Number of teachers with instructional assignments who have instructional assignments in the next school year
Number with instructional assignment
Number with instructional assignment in
next year Attrition
Rate
Number without instructional
assignment but with
Administrative assignment
Share who leave to become only Administrators
2013-2014 15,322 13,814 10% 108 1% 2014-2015 15,507 13,922 10% 98 1% 2015-2016 15,767 14,116 10% 114 1%
In summary, approximately ten percent of teachers with instructional assignments in one year do not have instructional assignments in the next year. Of those, only one percent left to become full-time administrators.
Table 7: Number of teachers with instructional assignments who do not have instructional assignments in the next school year, by age
Attrition Rate - Share with an assignment in base year but without
assignment in next year 2013-2014 2014-2015 2015-2016 Age 24 or younger 16% 18% 18% Age 25 to 29 11% 13% 14% Age 30 to 34 10% 9% 11% Age 35 to 39 7% 8% 7% Age 40 to 44 7% 6% 6% Age 45 to 49 5% 6% 7% Age 50 to 54 6% 7% 6% Age 55 to 59 13% 13% 14% Age 60 to 64 23% 28% 24% Age 65 and older 31% 35% 36% Overall 10% 11% 10%
Note: Age is measured as of base year. Rates higher than the overall rate are highlighted.
PLANNING, POLICY AND GOVERNMENTAL AFFAIRS DECEMBER 21, 2017
PPGA TAB 5 Page 11
In summary, attrition rates in the Idaho teaching population are highest for those under the age of 35 and those over the age of 54. Of the 10% who leave the profession annually, those teachers aged 55 years or older account for 24% of Idaho’s annual attrition on average, with 76% clearly leaving for reasons other than retirement. Nationally, pre-retirement attrition accounts for 66% of overall teacher attrition (Sutcher, et al., 2016, p. 3). Considering that Idaho’s average annual rate of attrition is equal to approximately 1,500 teachers lost, it can be estimated that 360 retire with 1,140 leaving teaching each year due to other compelling factors. It is clear that Idaho is losing teachers for reasons other than retirement at a rate that is higher than the national average. This is an area that demands further research.
Table 8: Number of teachers with instructional assignments who do not have instructional assignments in the next school year, by years of experience
Attrition Rate - Share with an assignment in base year but without assignment in next year
2013-2014 2014-2015 2015-2016 No prior experience 14% 17% 15% 0.1 to 3.9 years of experience 10% 12% 11% 4.0 to 7.9 years of experience 10% 9% 11% 8 to 10 years of experience 7% 8% 8% More than 10 years of experience 10% 10% 10% Overall 10% 11% 10% Note: Experience is measured as of base year. Attrition rates higher than the overall rate are highlighted. Years of experience only includes years of teaching K-12 in Idaho.
Approximately 15 percent of new teachers leave after the first year of teaching. This is also an important statistic for further research. Do the bulk of those leaving hold interim certificates or full certificates? Are they exiting voluntarily or not?
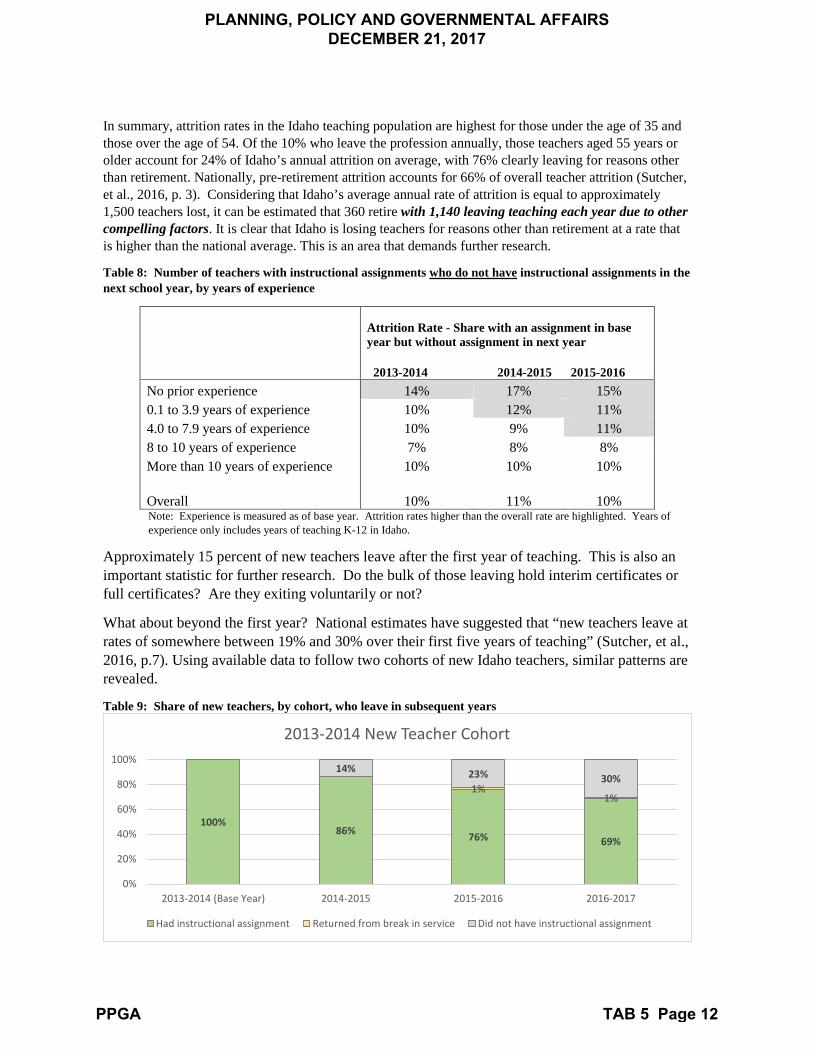
What about beyond the first year? National estimates have suggested that “new teachers leave at rates of somewhere between 19% and 30% over their first five years of teaching” (Sutcher, et al., 2016, p.7). Using available data to follow two cohorts of new Idaho teachers, similar patterns are revealed.
Table 9: Share of new teachers, by cohort, who leave in subsequent years
100%86% 76% 69%
1%1%
14% 23% 30%
0%
20%
40%
60%
80%
100%
2013-2014 (Base Year) 2014-2015 2015-2016 2016-2017
2013-2014 New Teacher Cohort
Had instructional assignment Returned from break in service Did not have instructional assignment
PLANNING, POLICY AND GOVERNMENTAL AFFAIRS DECEMBER 21, 2017
PPGA TAB 5 Page 12
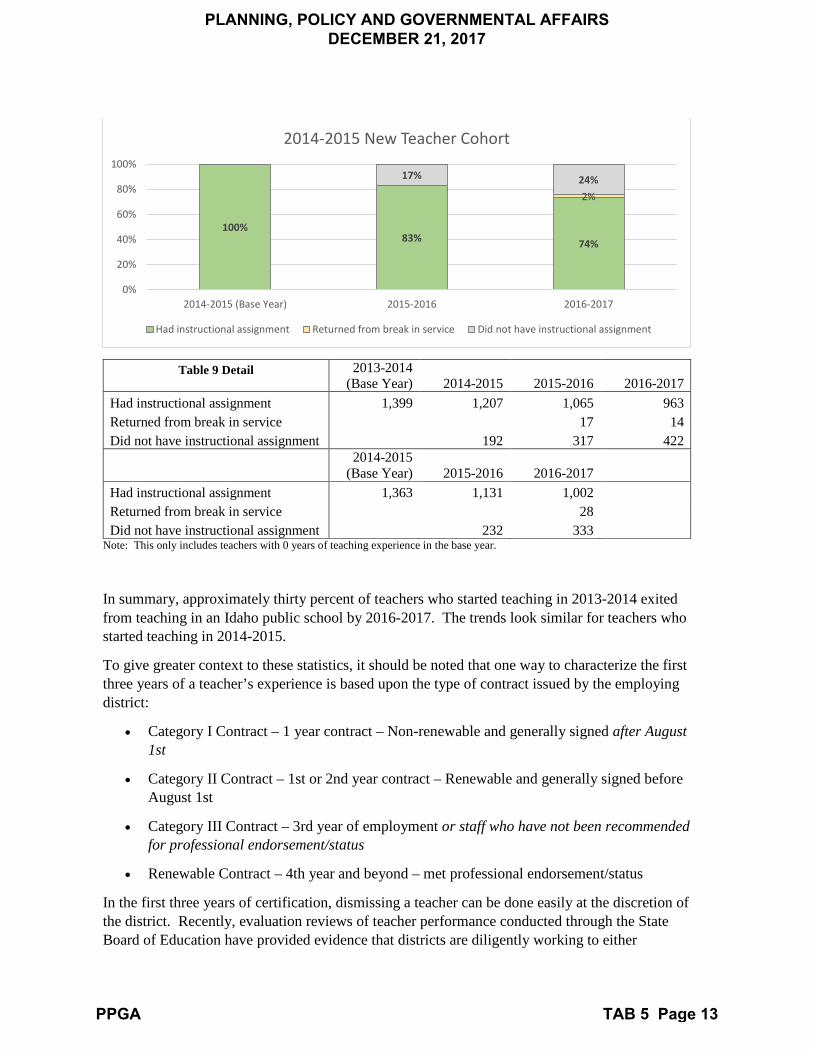
Table 9 Detail
2013-2014 (Base Year) 2014-2015 2015-2016 2016-2017
Had instructional assignment 1,399 1,207 1,065 963 Returned from break in service 17 14 Did not have instructional assignment 192 317 422
2014-2015
(Base Year) 2015-2016 2016-2017 Had instructional assignment 1,363 1,131 1,002 Returned from break in service 28 Did not have instructional assignment 232 333
Note: This only includes teachers with 0 years of teaching experience in the base year.
In summary, approximately thirty percent of teachers who started teaching in 2013-2014 exited from teaching in an Idaho public school by 2016-2017. The trends look similar for teachers who started teaching in 2014-2015.
To give greater context to these statistics, it should be noted that one way to characterize the first three years of a teacher’s experience is based upon the type of contract issued by the employing district:
• Category I Contract – 1 year contract – Non-renewable and generally signed after August 1st
• Category II Contract – 1st or 2nd year contract – Renewable and generally signed before August 1st
• Category III Contract – 3rd year of employment or staff who have not been recommended for professional endorsement/status
• Renewable Contract – 4th year and beyond – met professional endorsement/status
In the first three years of certification, dismissing a teacher can be done easily at the discretion of the district. Recently, evaluation reviews of teacher performance conducted through the State Board of Education have provided evidence that districts are diligently working to either
100%83% 74%
2%
17% 24%
0%
20%
40%
60%
80%
100%
2014-2015 (Base Year) 2015-2016 2016-2017
2014-2015 New Teacher Cohort
Had instructional assignment Returned from break in service Did not have instructional assignment
PLANNING, POLICY AND GOVERNMENTAL AFFAIRS DECEMBER 21, 2017
PPGA TAB 5 Page 13

remediate or release teachers who are not proficient prior to issuing a renewable contract in the fourth year.
As noted earlier, it will be critical to understand the percentage of teachers exiting the profession voluntarily compared to those being dismissed within each new teaching cohort. In either scenario, voluntary or not, a strong case can be made for induction programs and mentor support. Countless studies have concluded that a robust induction program with well-trained, effective mentors will decrease the attrition of new teachers. “Each time a teacher leaves a district, it not only increases demand but also imposes replacement costs on districts. A decade ago, replacement costs for teachers were estimated to range from around $4,400 in a small rural district to nearly $18,000 in a large urban district for every teacher who leaves” (Sutcher, et al., 2016, p.5).
Referring to Table 9 below, an average of 1,553 teachers leave Idaho public schools each year. Using the lowest replacement cost estimate of $4,400 per teacher (from a decade ago), we can conclude that Idaho districts spend $6,833,200.00 every year replacing teachers lost to attrition. The actual cost is likely two to three times higher.
Statewide, between attrition (which includes retiring teachers) and student population growth, nearly 2,000 teachers are needed each year to meet the demands of Idaho school districts:
Table 10: Number of instructional staff hires needed annually to address attrition and growth
Number with instructional assignment
Number of hires needed to
account for 10% attrition
annually
Number of hires needed to account
for projected growth annually
TOTAL ANNUAL HIRES OF
INSTRUCTIONAL STAFF NEEDED TO STAFF IDAHO
SCHOOLS
2013-2014 15,322 1,532 230 1,762 2014-2015 15,507 1,551 233 1,784 2015-2016 15,767 1,577 236 1,813
If we were to use the narrow definition of “teacher shortage”, characterized by a demand comprised only of replacements for retiring teachers and new teachers needed to cover growth in enrollments, Idaho should not have an issue. With Idaho’s traditional educator preparation programs steadily producing an average of 846 teachers annually, and almost 400 teachers from out of state becoming certificated in Idaho (Table 5) there should be more than enough newly certified teachers annually to replace the average 360 teachers who retire each year and the 233 needed annually to address student population growth. In fact, there would be a surplus of teachers certificated every year. However, statewide data from multiple sources indicates steady, preretirement age attrition to be the greatest contributor to Idaho’s teacher shortage; and a critical issue we must further explore to define the specific causes.
Attrition of Idaho Teachers by District Type and Region
This section of the report examines attrition patterns of teachers with instructional teaching assignments by district type and region. As in previous tables, a teacher is counted as leaving if that teacher had an instructional assignment in one year in a district and did not have an instructional assignment in the next
PLANNING, POLICY AND GOVERNMENTAL AFFAIRS DECEMBER 21, 2017
PPGA TAB 5 Page 14
year in that same district. Therefore, this measures attrition both from the profession as well as from the individual district.
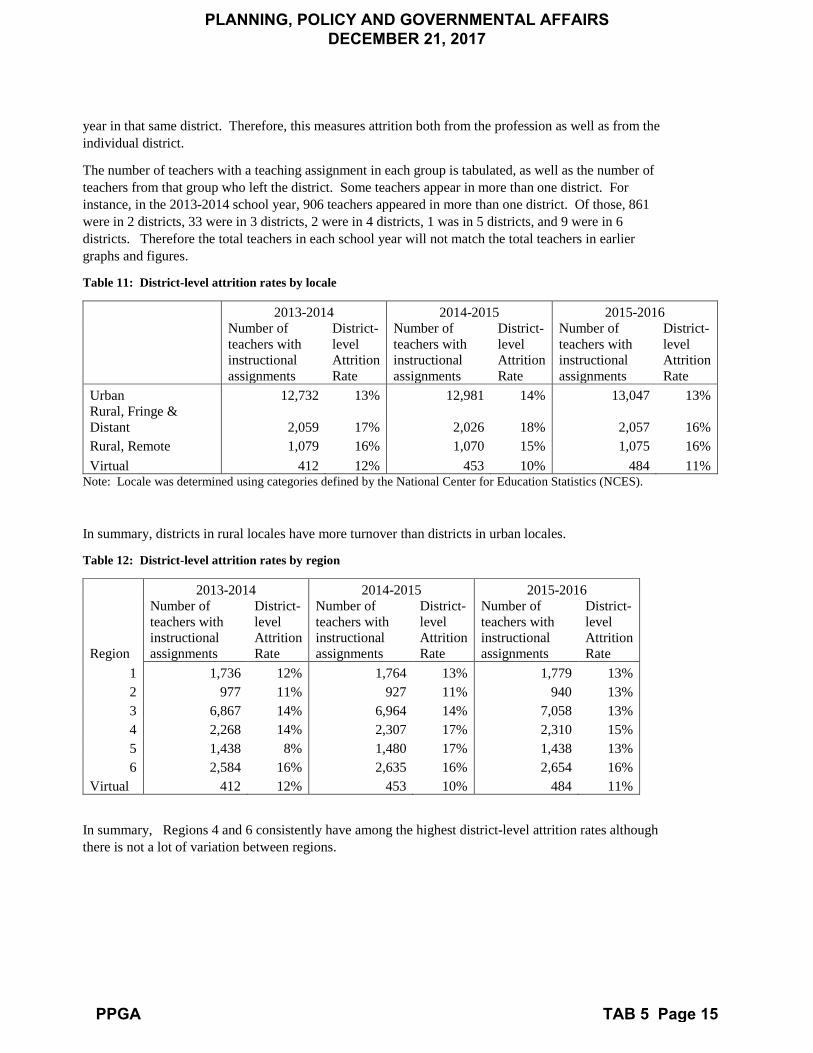
The number of teachers with a teaching assignment in each group is tabulated, as well as the number of teachers from that group who left the district. Some teachers appear in more than one district. For instance, in the 2013-2014 school year, 906 teachers appeared in more than one district. Of those, 861 were in 2 districts, 33 were in 3 districts, 2 were in 4 districts, 1 was in 5 districts, and 9 were in 6 districts. Therefore the total teachers in each school year will not match the total teachers in earlier graphs and figures.
Table 11: District-level attrition rates by locale
2013-2014 2014-2015 2015-2016
Number of teachers with instructional assignments
District-level Attrition Rate
Number of teachers with instructional assignments
District-level Attrition Rate
Number of teachers with instructional assignments
District-level Attrition Rate
Urban 12,732 13% 12,981 14% 13,047 13% Rural, Fringe & Distant 2,059 17% 2,026 18% 2,057 16% Rural, Remote 1,079 16% 1,070 15% 1,075 16% Virtual 412 12% 453 10% 484 11%
Note: Locale was determined using categories defined by the National Center for Education Statistics (NCES).
In summary, districts in rural locales have more turnover than districts in urban locales.
Table 12: District-level attrition rates by region
2013-2014 2014-2015 2015-2016
Region
Number of teachers with instructional assignments
District-level Attrition Rate
Number of teachers with instructional assignments
District-level Attrition Rate
Number of teachers with instructional assignments
District-level Attrition Rate
1 1,736 12% 1,764 13% 1,779 13% 2 977 11% 927 11% 940 13% 3 6,867 14% 6,964 14% 7,058 13% 4 2,268 14% 2,307 17% 2,310 15% 5 1,438 8% 1,480 17% 1,438 13% 6 2,584 16% 2,635 16% 2,654 16%
Virtual 412 12% 453 10% 484 11%
In summary, Regions 4 and 6 consistently have among the highest district-level attrition rates although there is not a lot of variation between regions.
PLANNING, POLICY AND GOVERNMENTAL AFFAIRS DECEMBER 21, 2017
PPGA TAB 5 Page 15

Table 13: One-year district-level attrition for first-year teachers
2013-2014 2014-2015 2015-2016 Number of first-year teachers with instructional assignments
District-level Attrition Rate
Number of first-year teachers with instructional assignments
District-level Attrition Rate
Number of first-year teachers with instructional assignments
District-level Attrition Rate
Urban 1,090 22% 1,120 24% 1,232 19% Rural, Fringe & Distant 223 21% 207 20% 181 33% Rural, Remote 124 27% 90 23% 89 20% Virtual 58 14% 27 26% 31 19%
Note: This measures attrition following the first-year of teaching for teachers with instructional assignments.
In summary, there is not a clear pattern of differences in district-level attrition for first-year teachers by locale.
Prevalence of Alternative Pathways to Certification
This section of the report examines the number of instructional staff working on interim certificates while pursuing full state certification. Pathways represented below encompass both traditional and non-traditional preparation programs.
It is important to note that pathways to certification recorded below are based upon information supplied by the Teacher Certification Database through FY16, but do not reflect current practice. Effective March 25, 2016, the Teacher to New designation was split into two markedly different routes in order to align with changes made in IDAPA 08.02.02.021.02 and 08.02.02.042.01. Rule now defines a clear distinction between a fully certified teacher pursuing another certificate type (either pupil personnel or administrative) and a fully certified teacher pursuing another area of endorsement. The Teacher to New alternative pathway to a new certificate may be granted for a maximum of three years. The Alternative Authorization to Endorsement is only valid for one year, but provides three different options by which to pursue the endorsement.
Because it appears that at this point the Teacher Certification Database has not yet been updated to provide data that represents the above changes, effective FY17, Board staff will work closely with the department to ensure future data is captured in detail to reflect this important distinction.
Table 14: Types and Numbers of Alternative Pathways to Certification, by Region
2013-2014 ABCTE Content Specialist
Prov Auth
Teacher to New TFA
Share of teachers
Region 1 5 4 16 2% Region 2 3 4 29 4% Region 3 38 14 57 79 3% Region 4 19 11 17 42 4% Region 5 17 3 22 29 5% Region 6 25 3 43 27 4%
PLANNING, POLICY AND GOVERNMENTAL AFFAIRS DECEMBER 21, 2017
PPGA TAB 5 Page 16
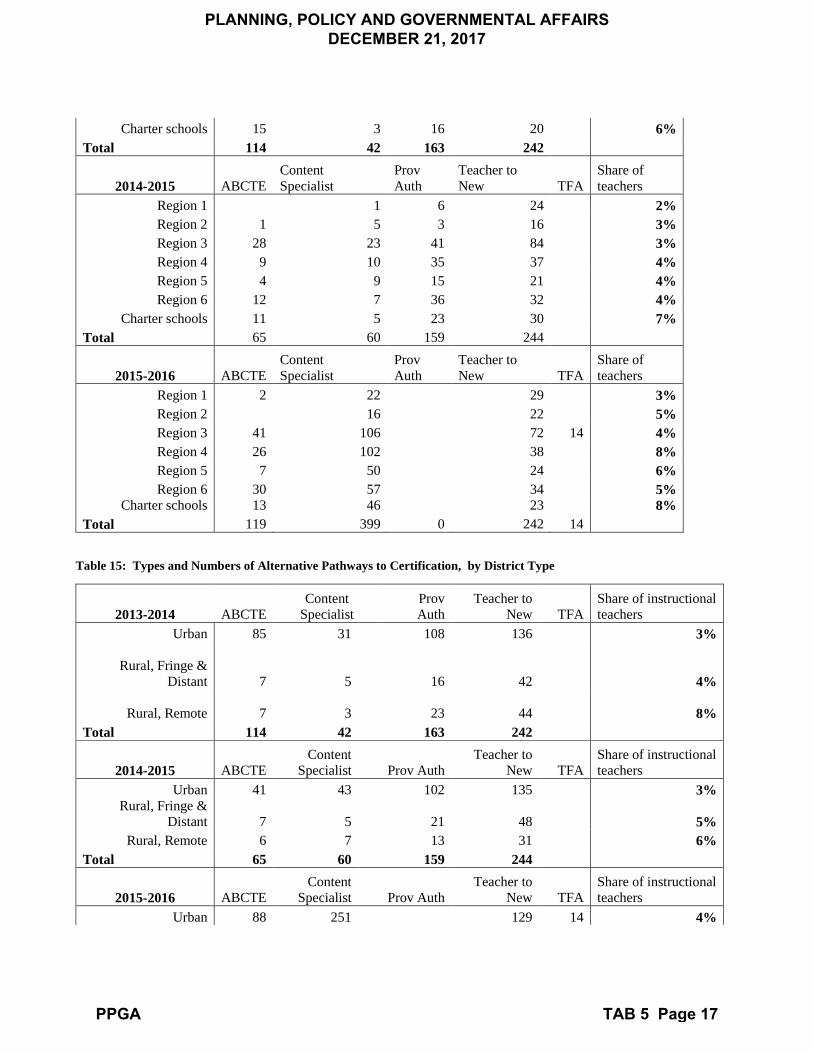
Charter schools 15 3 16 20 6% Total 114 42 163 242
2014-2015 ABCTE Content Specialist
Prov Auth
Teacher to New TFA
Share of teachers
Region 1 1 6 24 2% Region 2 1 5 3 16 3% Region 3 28 23 41 84 3% Region 4 9 10 35 37 4% Region 5 4 9 15 21 4% Region 6 12 7 36 32 4%
Charter schools 11 5 23 30 7% Total 65 60 159 244
2015-2016 ABCTE Content Specialist
Prov Auth
Teacher to New TFA
Share of teachers
Region 1 2 22 29 3% Region 2 16 22 5% Region 3 41 106 72 14 4% Region 4 26 102 38 8% Region 5 7 50 24 6% Region 6 30 57 34 5%
Charter schools 13 46 23 8% Total 119 399 0 242 14
Table 15: Types and Numbers of Alternative Pathways to Certification, by District Type
2013-2014 ABCTE Content
Specialist Prov Auth
Teacher to New TFA
Share of instructional teachers
Urban 85 31 108 136 3%
Rural, Fringe & Distant 7 5 16 42 4%
Rural, Remote 7 3 23 44 8% Total 114 42 163 242
2014-2015 ABCTE Content
Specialist Prov Auth Teacher to
New TFA Share of instructional teachers
Urban 41 43 102 135 3% Rural, Fringe &
Distant 7 5 21 48 5% Rural, Remote 6 7 13 31 6%
Total 65 60 159 244
2015-2016 ABCTE Content
Specialist Prov Auth Teacher to
New TFA Share of instructional teachers
Urban 88 251 129 14 4%
PLANNING, POLICY AND GOVERNMENTAL AFFAIRS DECEMBER 21, 2017
PPGA TAB 5 Page 17
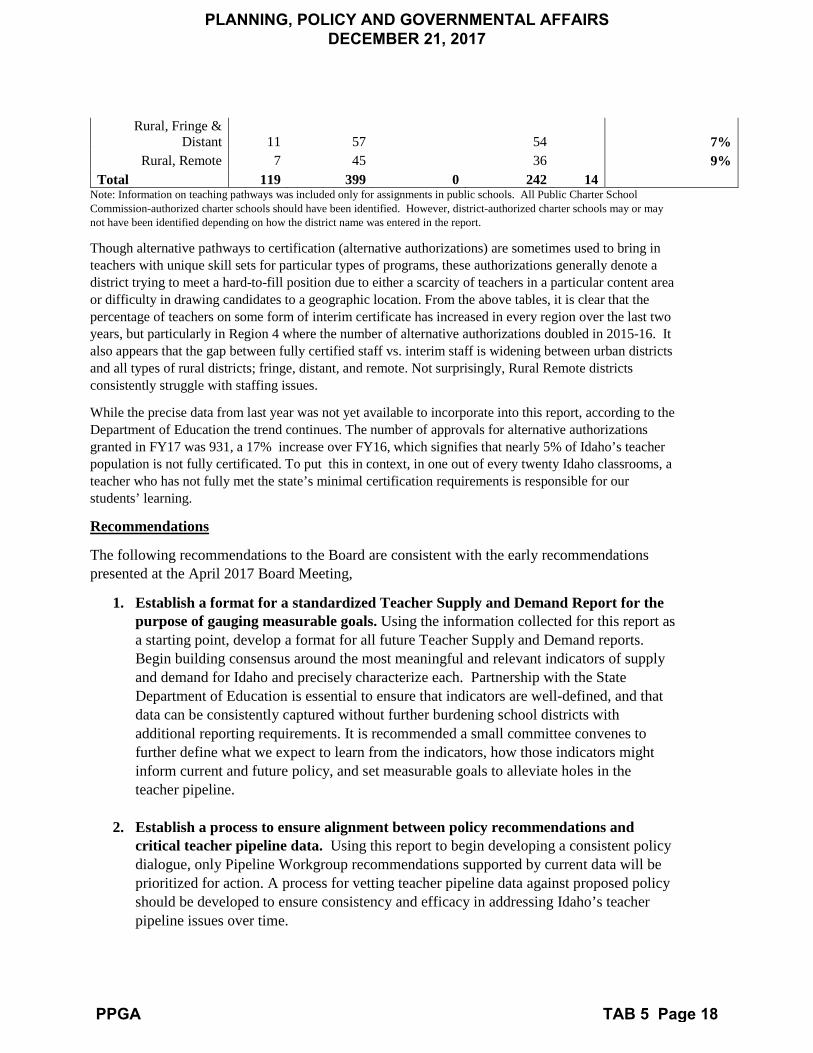
Rural, Fringe & Distant 11 57 54 7%
Rural, Remote 7 45 36 9% Total 119 399 0 242 14
Note: Information on teaching pathways was included only for assignments in public schools. All Public Charter School Commission-authorized charter schools should have been identified. However, district-authorized charter schools may or may not have been identified depending on how the district name was entered in the report.
Though alternative pathways to certification (alternative authorizations) are sometimes used to bring in teachers with unique skill sets for particular types of programs, these authorizations generally denote a district trying to meet a hard-to-fill position due to either a scarcity of teachers in a particular content area or difficulty in drawing candidates to a geographic location. From the above tables, it is clear that the percentage of teachers on some form of interim certificate has increased in every region over the last two years, but particularly in Region 4 where the number of alternative authorizations doubled in 2015-16. It also appears that the gap between fully certified staff vs. interim staff is widening between urban districts and all types of rural districts; fringe, distant, and remote. Not surprisingly, Rural Remote districts consistently struggle with staffing issues.
While the precise data from last year was not yet available to incorporate into this report, according to the Department of Education the trend continues. The number of approvals for alternative authorizations granted in FY17 was 931, a 17% increase over FY16, which signifies that nearly 5% of Idaho’s teacher population is not fully certificated. To put this in context, in one out of every twenty Idaho classrooms, a teacher who has not fully met the state’s minimal certification requirements is responsible for our students’ learning.
Recommendations
The following recommendations to the Board are consistent with the early recommendations presented at the April 2017 Board Meeting,
1. Establish a format for a standardized Teacher Supply and Demand Report for thepurpose of gauging measurable goals. Using the information collected for this report asa starting point, develop a format for all future Teacher Supply and Demand reports.Begin building consensus around the most meaningful and relevant indicators of supplyand demand for Idaho and precisely characterize each. Partnership with the StateDepartment of Education is essential to ensure that indicators are well-defined, and thatdata can be consistently captured without further burdening school districts withadditional reporting requirements. It is recommended a small committee convenes tofurther define what we expect to learn from the indicators, how those indicators mightinform current and future policy, and set measurable goals to alleviate holes in theteacher pipeline.
2. Establish a process to ensure alignment between policy recommendations andcritical teacher pipeline data. Using this report to begin developing a consistent policydialogue, only Pipeline Workgroup recommendations supported by current data will beprioritized for action. A process for vetting teacher pipeline data against proposed policyshould be developed to ensure consistency and efficacy in addressing Idaho’s teacherpipeline issues over time.
PLANNING, POLICY AND GOVERNMENTAL AFFAIRS DECEMBER 21, 2017
PPGA TAB 5 Page 18
3. In the coming year, begin to implement workgroup recommendations that aresupported by the data provided regarding Idaho’s teacher pipeline. The followingare the specific, actionable recommendations created by the Pipeline Workgroup over thecourse of the last ten months. At the October 12, 2017 meeting, workgroup membersvoted on ten specific recommendations. Twenty-three of the thirty-seven membersparticipated. All of the recommendations were unanimously supported with the exceptionof six “no” votes regarding the establishment of a mastery-based pathway to certification.Once it was agreed that Idaho’s colleges and universities would work together to quicklyestablish a single mastery pathway before seeking outside providers, the recommendationreceived full support.
Each recommendation is listed below. Though work group members had access topreliminary data, the information presented in this report was not yet available at theOctober meeting. From the first convening in February 2017, the intention of theworkgroup was to propose action items grounded in fact and best practices. Of the teninitial recommendations, only those supported by current data are being proposed forimmediate action. All others are categorized as items for future consideration.Additionally, if a recommendation has been cited as a “top idea” by the Education PolicyCenter of the American Institutes for Research (AIR), it is noted here with references towhich other states are engaged in similar work.
a) Attract/Recruit: Attracting talent and creating incentives to teachAccording to information drawn from the Department of Education’s TeacherCertification Database, maintaining our current teaching workforce must be Idaho’shighest priority, not necessarily attracting new talent and incentivizing teaching; theexception being districts designated within the rural categories. Incentives to teachershould be targeted to support rural districts, but statewide the priority must be focused onretaining the current teacher workforce. For these reasons the following two action itemsare recommended for immediate action:
i. Explore incentives to teach in rural districts: Loan forgiveness, housingoptions, hiring bonuses, and scholarships for candidates committing todistrict the district for a specified period of time
ii. Continue to support higher salaries and compensation packages / Fundthe third rung of the Career Ladder (Cited by AIR referencing work beingdone in Nevada, Arizona, Minnesota, New Mexico, Tennessee, andLouisiana)
Recommendations for future consideration include:
iii. Develop a public service announcement campaign uniquely focused on theIdaho lifestyle and Idaho schools to attract new teachers
iv. Explore statewide incentives to pursue teaching
v. Create opportunities for scholarships to support full-time student teachers
PLANNING, POLICY AND GOVERNMENTAL AFFAIRS DECEMBER 21, 2017
PPGA TAB 5 Page 19
b) Prepare/Certify: Alternate routes and “Grow Your Own” strategiesBased upon the increasing number of Alternative Authorizations being issued, bothrecommendations in this category are being prioritized. In November 2017, the Boardacted proactively in approving a mastery-based route to teaching that will embrace thesame rigor and utilize the same performance assessments as traditional routes to teacherpreparation, but be noticeably more affordable than current routes. The length of time itgenerally takes to get a teacher fully certified through the current pathways is alsosignificantly decreased in this mastery-based model. While policymakers strive toaddress the issues at the core of our “leaking” teacher pipeline, vacancies throughoutthe state must be filled with competent candidates that will be well-supported, andmore likely to remain in those teaching positions for the long run. Additionally, a dualcredit program must be developed to assist interested high school students in pursuingteaching. This is especially critical for districts located in rural remote areas to growtheir own teaching force. The program must be affordable and expedient.
vi. Develop a Mastery-based Content Specialist program to supplement thecurrent alternative authorizations
vii. Closer alignment between secondary and postsecondary educationcourses and increase specific dual credit opportunities to expeditepreparation for high school students interested in teaching
c) Retain: Development and support for all teachers, including induction programs,evaluation feedback, and teacher leadership opportunitiesIt is clear that this area, retaining Idaho’s teachers, must be the area of greatest focusand immediate attention. Further research is critical to determine the key issues that arecompelling Idaho teachers to leave the classroom. In the meantime, however, workgroup recommendations mirror best practices in teacher retention nationally.
viii. Support mentor program standards and explore a variety of innovativementoring models, training supports, resources (Cited by AIR referencingwork being done to develop robust induction programs and mentoring inArizona, New Mexico, Louisiana, Michigan, Colorado, Connecticut,Delaware, New Jersey, Oregon, and Massachusetts)
ix. Emphasize evaluation practices that balance accountability and teacherdriven professional growth with measurable outcomes (Cited by AIRreferencing evaluation measures that encourage professional growthimplemented in Kentucky, Washington, and New York)
x. Explore option for a “Teacher Backpack” through reallocation of apercentage of PD money to support teachers in individualizing theirprofessional growth opportunities and pursuing leadership rolesaccording to their Individualized Professional Learning Plan (Cited byAIR referencing work being done to develop professional learningopportunities resulting in greater leadership roles for teachers in New
PLANNING, POLICY AND GOVERNMENTAL AFFAIRS DECEMBER 21, 2017
PPGA TAB 5 Page 20

Mexico, Louisiana, Michigan, Delaware, Oregon, New Mexico, North Dakota, Minnesota, Tennessee, and Nevada)
Conclusion
Retention is clearly the primary issue facing Idaho’s supply of highly effective teachers. Because 76% of the 1,550 teachers who leave the profession every year exit prior to retirement age, Idaho’s rate of preretirement teacher attrition is 10% higher than the national average. Idaho’s traditional educator preparation programs are steadily producing an average of 846 teachers annually and Idaho issues approximately 400 certificates to teachers from other states; this should be more than enough newly certified teachers to replace the average 360 teachers who retire and the 233 needed annually to address student population growth. Until Idaho’s leaky pipeline is addressed, however, teacher shortages will have a constant presence in our education landscape.
Idaho policymakers may want to consider creating a research agenda that follows cohorts of teachers from preparation through their first five years of teaching, comparing attrition rates between those who are fully certified versus those utilizing alternate routes, and distinguishing whether they are leaving the classroom voluntarily or not. Another critical area for research would be to understand why 33% of the teachers who receive an initial Idaho teaching certificate choose not to serve in our public schools, perhaps by incorporating a survey as part of the certification application process or upon graduation from Idaho preparation programs. Finally, it is most critical to the health of Idaho education to discover the contributing circumstances that cause over 1,000 teachers to leave teaching every year for reasons other than retirement.
As we strive to better understand the factors that underlie the attrition in our teaching workforce across the state, we will be able to recognize those policy options that are addressing the true challenges in preparing and retaining high quality teachers. However, until we have identified the issues that best characterize the faults in Idaho’s teacher pipeline, some major factors influencing national teacher retention have been identified (Sutcher, et al., 2016,) which can be acted upon immediately:
1) Compensation that is competitive with other occupations;
2) Preparation that focuses on pedagogical training and is affordable;
3) Mentoring and induction programs that utilize trained mentors and adequate release time forcollaboration.
The Pipeline Workgroup has offered actionable recommendations that touch on each of these categories.
Reference:
Sutcher, L., Darling-Hammond, L., & Carver-Thomas, D. (2016). A coming crisis in teaching? Teacher supply, demand, and shortages in the US. Learning Policy Institute.
PLANNING, POLICY AND GOVERNMENTAL AFFAIRS DECEMBER 21, 2017
PPGA TAB 5 Page 21

Attachment 2. Pipeline Report Detail
2017 Teacher Pipeline Report1 Table 1: IHE Completers
Table 2: Number receiving New Idaho certifications (non-duplicated), instructional endorsements only
Significant fact: About a third of instructional teachers who are certified in Idaho each year are not employed in Idaho. The number of instructional teachers certified and employed in Idaho is relatively constant.
Certificates issued to those who were employed in Idaho
Share not employed in
Idaho
Academic Certificates Total
certificates issued
State of first certification
CTE Certificates Total Idaho Other state 2013-2014 1,932 1,249 828 421 33 35% 2014-2015 1,720 1,180 782 398 51 31% 2015-2016 1,889 1,298 909 389 61 31% 2016-2017 1,952 1,234 821 413 56 37%
Notes: Excludes certifications with only Administration or Pupil Personnel Services endorsements. A teacher that received more than one certification would only appear once in this tally. Total certificates issued includes certificates issued to teachers who never had a teaching assignment in Idaho. State of first certification is not available for these teachers. CTE Certificates are those certificates with only CTE endorsements. Teachers with both academic and CTE endorsements would be included in the Academic certificates group.
Table 3: Idaho certifications issued by school level (duplicated), instructional endorsements only
Significant fact: The number of elementary and secondary certificates issued in 2016-2017 is the same as the number issued in 2013-2014.
Elementary Secondary 2013-2014 1,044 831 2014-2015 866 735 2015-2016 1,049 780 2016-2017 1,042 829
Notes: Excludes certifications with only Administration or Pupil Personnel Services endorsements. A teacher that received more than one certification could appear more than once in this tally. Excludes CTE only endorsements as they would be eligible to teach only at the Secondary level. This covers all certificates issued. School level was determined by the endorsements issued. See Appendix I for a list of endorsements and how they were classified. Endorsements could also cover All Grades – these endorsements were not included in this analysis.
1 Cathleen M. McHugh, Ph.D. Principal Research Analyst Idaho State Board of Education [email protected]
PLANNING, POLICY AND GOVERNMENTAL AFFAIRS DECEMBER 21, 2017
PPGA TAB 5 Page 22

Table 4: Number receiving Idaho certifications issued with Special Education endorsements
Significant fact: The number of certifications issued with Special Education endorsements is higher in 2016-2017 than in any other year.
Total certificates issued
2013-2014 260 2014-2015 237 2015-2016 282 2016-2017 292
Notes: A teacher that received more than one certification would only appear once in this tally.
Table 5: Idaho certifications issued for select secondary endorsements, by area of assignment
Significant fact: While the number of teachers certified to teach STEM courses has increased, the number of teachers certified to teach other subjects has decreased.
STEM
Mathematics Life and Physical Science
Computer and Informational Systems
2013-2014 187 142 19 2014-2015 150 138 21 2015-2016 172 171 19 2016-2017 207 184 14
Languages and Humanities
English Language and
Literature World
Language Humanities 2013-2014 436 74 568 2014-2015 380 68 500 2015-2016 407 48 485 2016-2017 416 63 488
Other
Social Science Fine and Performing Arts
Physical, Health, and Safety
2013-2014 213 247 97 2014-2015 192 194 75 2015-2016 168 200 75 2016-2017 187 173 86
Note: Area of assignment was determined by using the crosswalk between endorsements and assignments provided by SDE in the 2016-17 Assignment Credential Manual. See appendix for a list of which endorsements are counted in each category. Special education endorsements were not included. A teacher would appear only once in each subject category but may appear in more than one subject category.
PLANNING, POLICY AND GOVERNMENTAL AFFAIRS DECEMBER 21, 2017
PPGA TAB 5 Page 23
What are the demographic characteristics of teachers?
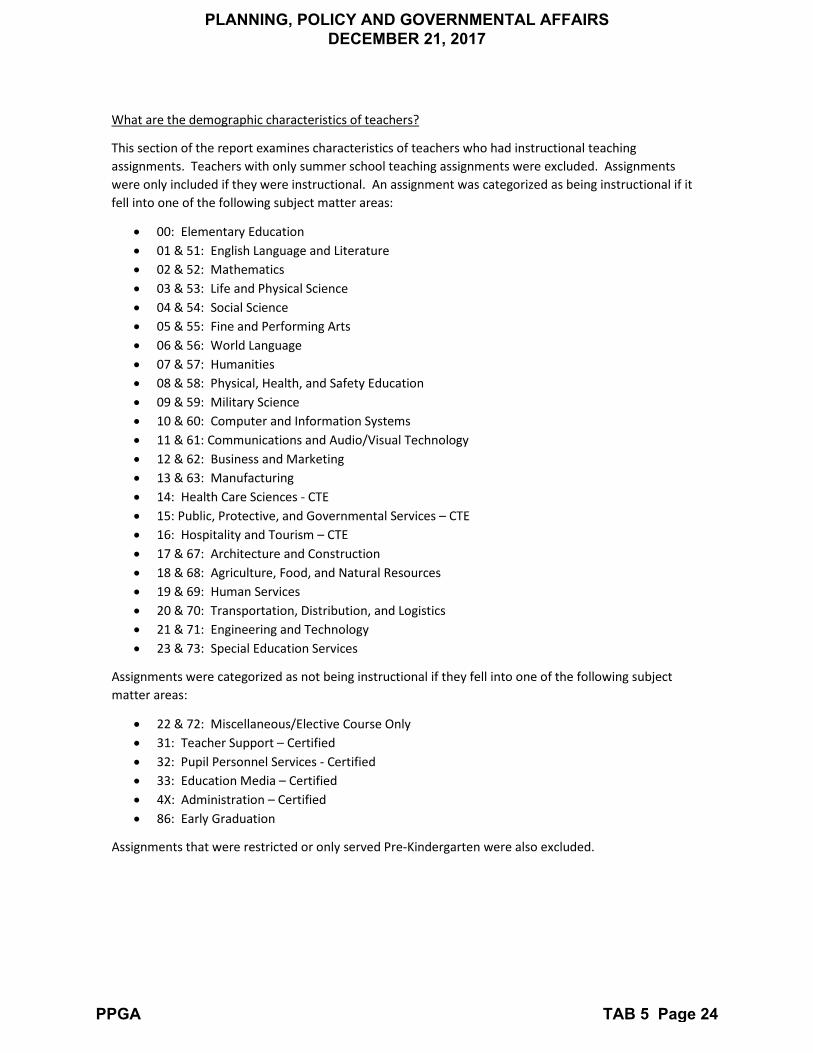
This section of the report examines characteristics of teachers who had instructional teaching assignments. Teachers with only summer school teaching assignments were excluded. Assignments were only included if they were instructional. An assignment was categorized as being instructional if it fell into one of the following subject matter areas:
• 00: Elementary Education • 01 & 51: English Language and Literature • 02 & 52: Mathematics • 03 & 53: Life and Physical Science • 04 & 54: Social Science • 05 & 55: Fine and Performing Arts • 06 & 56: World Language • 07 & 57: Humanities • 08 & 58: Physical, Health, and Safety Education • 09 & 59: Military Science • 10 & 60: Computer and Information Systems • 11 & 61: Communications and Audio/Visual Technology • 12 & 62: Business and Marketing • 13 & 63: Manufacturing • 14: Health Care Sciences - CTE • 15: Public, Protective, and Governmental Services – CTE • 16: Hospitality and Tourism – CTE • 17 & 67: Architecture and Construction • 18 & 68: Agriculture, Food, and Natural Resources • 19 & 69: Human Services • 20 & 70: Transportation, Distribution, and Logistics • 21 & 71: Engineering and Technology • 23 & 73: Special Education Services
Assignments were categorized as not being instructional if they fell into one of the following subject matter areas:
• 22 & 72: Miscellaneous/Elective Course Only • 31: Teacher Support – Certified • 32: Pupil Personnel Services - Certified • 33: Education Media – Certified • 4X: Administration – Certified • 86: Early Graduation
Assignments that were restricted or only served Pre-Kindergarten were also excluded.
PLANNING, POLICY AND GOVERNMENTAL AFFAIRS DECEMBER 21, 2017
PPGA TAB 5 Page 24
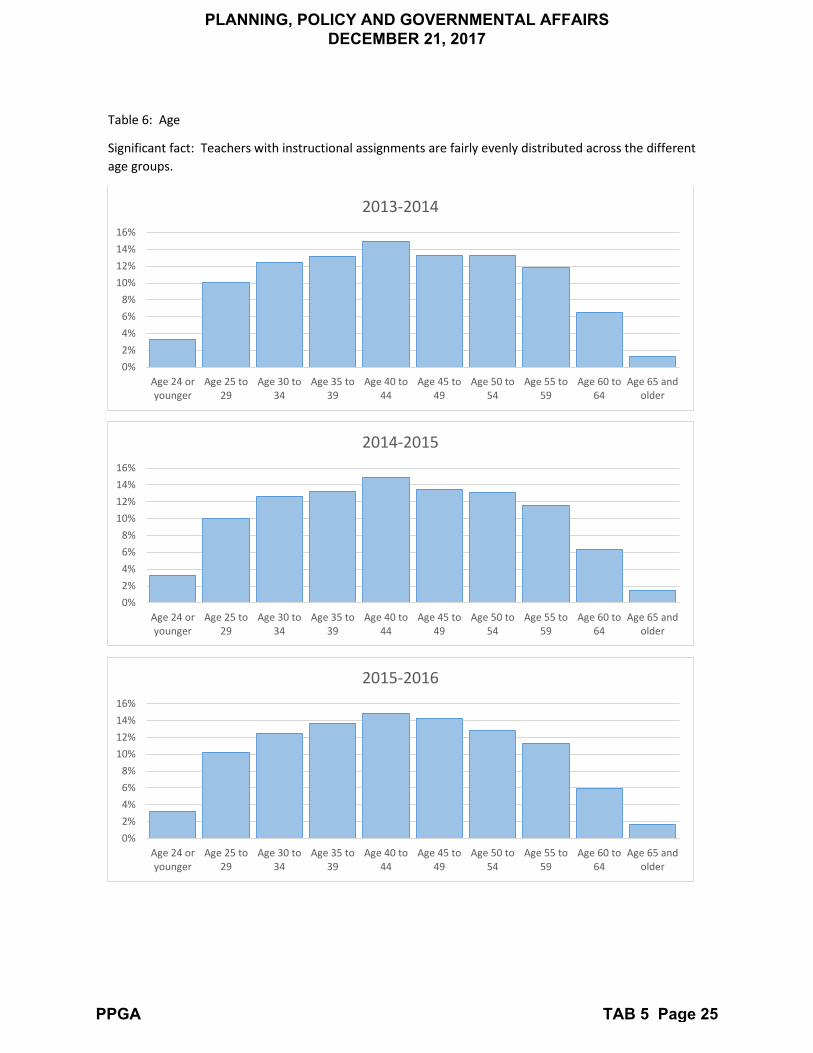
Table 6: Age
Significant fact: Teachers with instructional assignments are fairly evenly distributed across the different age groups.
0%2%4%6%8%
10%12%14%16%
Age 24 oryounger
Age 25 to29
Age 30 to34
Age 35 to39
Age 40 to44
Age 45 to49
Age 50 to54
Age 55 to59
Age 60 to64
Age 65 andolder
2013-2014
0%2%4%6%8%
10%12%14%16%
Age 24 oryounger
Age 25 to29
Age 30 to34
Age 35 to39
Age 40 to44
Age 45 to49
Age 50 to54
Age 55 to59
Age 60 to64
Age 65 andolder
2014-2015
0%2%4%6%8%
10%12%14%16%
Age 24 oryounger
Age 25 to29
Age 30 to34
Age 35 to39
Age 40 to44
Age 45 to49
Age 50 to54
Age 55 to59
Age 60 to64
Age 65 andolder
2015-2016
PLANNING, POLICY AND GOVERNMENTAL AFFAIRS DECEMBER 21, 2017
PPGA TAB 5 Page 25
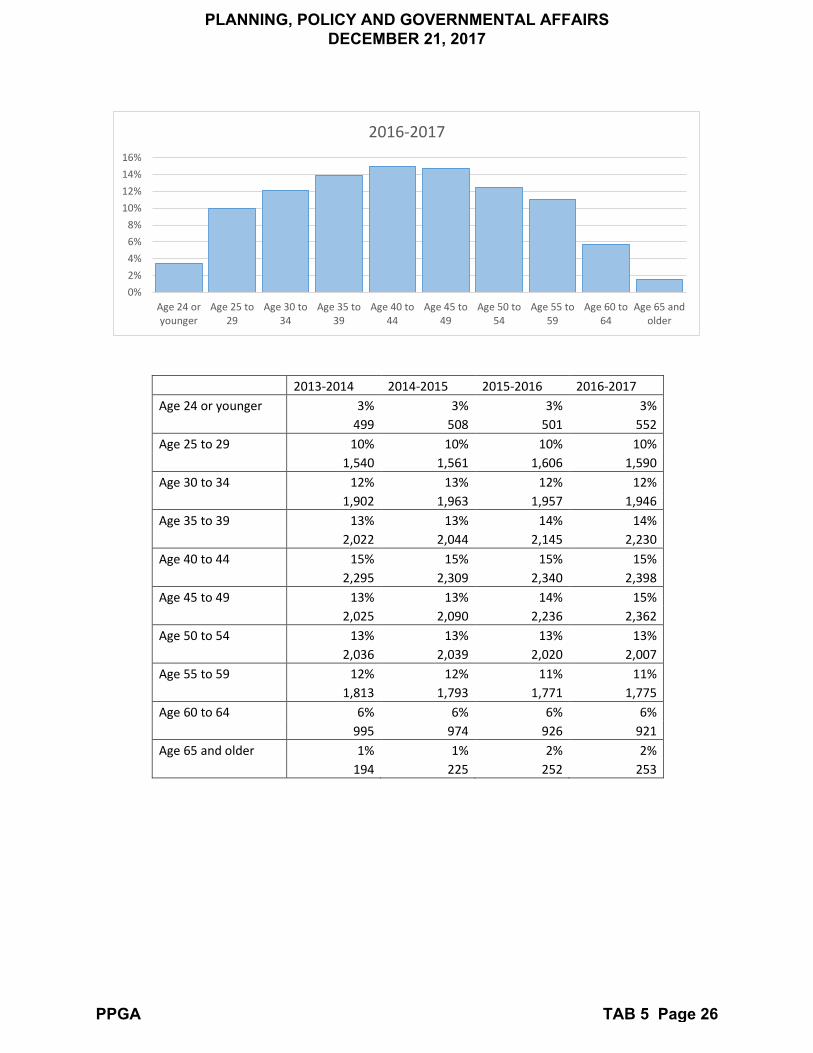
2013-2014 2014-2015 2015-2016 2016-2017 Age 24 or younger 3% 3% 3% 3%
499 508 501 552 Age 25 to 29 10% 10% 10% 10%
1,540 1,561 1,606 1,590 Age 30 to 34 12% 13% 12% 12%
1,902 1,963 1,957 1,946 Age 35 to 39 13% 13% 14% 14%
2,022 2,044 2,145 2,230 Age 40 to 44 15% 15% 15% 15%
2,295 2,309 2,340 2,398 Age 45 to 49 13% 13% 14% 15%
2,025 2,090 2,236 2,362 Age 50 to 54 13% 13% 13% 13%
2,036 2,039 2,020 2,007 Age 55 to 59 12% 12% 11% 11%
1,813 1,793 1,771 1,775 Age 60 to 64 6% 6% 6% 6%
995 974 926 921 Age 65 and older 1% 1% 2% 2%
194 225 252 253
0%2%4%6%8%
10%12%14%16%
Age 24 oryounger
Age 25 to29
Age 30 to34
Age 35 to39
Age 40 to44
Age 45 to49
Age 50 to54
Age 55 to59
Age 60 to64
Age 65 andolder
2016-2017
PLANNING, POLICY AND GOVERNMENTAL AFFAIRS DECEMBER 21, 2017
PPGA TAB 5 Page 26
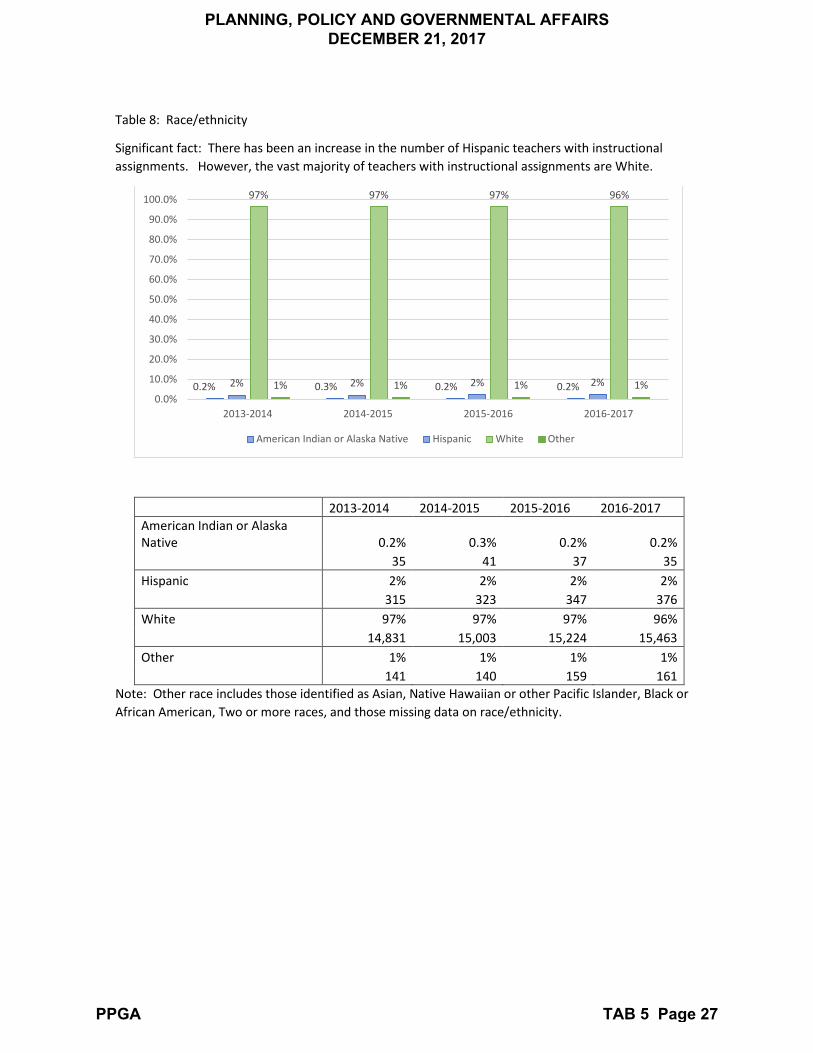
Table 8: Race/ethnicity
Significant fact: There has been an increase in the number of Hispanic teachers with instructional assignments. However, the vast majority of teachers with instructional assignments are White.
2013-2014 2014-2015 2015-2016 2016-2017 American Indian or Alaska Native 0.2% 0.3% 0.2% 0.2% 35 41 37 35 Hispanic 2% 2% 2% 2% 315 323 347 376 White 97% 97% 97% 96% 14,831 15,003 15,224 15,463 Other 1% 1% 1% 1% 141 140 159 161
Note: Other race includes those identified as Asian, Native Hawaiian or other Pacific Islander, Black or African American, Two or more races, and those missing data on race/ethnicity.
0.2% 0.3% 0.2% 0.2%2% 2% 2% 2%
97% 97% 97% 96%
1% 1% 1% 1%0.0%
10.0%
20.0%
30.0%
40.0%
50.0%
60.0%
70.0%
80.0%
90.0%
100.0%
2013-2014 2014-2015 2015-2016 2016-2017
American Indian or Alaska Native Hispanic White Other
PLANNING, POLICY AND GOVERNMENTAL AFFAIRS DECEMBER 21, 2017
PPGA TAB 5 Page 27

Table 9: Highest Degree Earned
Significant fact: The vast majority of teachers with instructional assignments have either a Bachelor or a Master degree. Over the past four years, there has been a steady decrease in the share with a Master degree and a corresponding increase in the share with a Bachelor degree.
2013-2014 2014-2015 2015-2016 2016-2017 Associate or less 0.5% 0.5% 0.6% 0.7% 72 77 93 118 Bachelor 61% 62% 63% 65% 9,274 9,604 9,985 10,378 Master 37% 36% 35% 33% 5,704 5,578 5,449 5,312 Ph.D. 2% 2% 2% 1% 272 248 240 226
0.5% 0.5% 0.6% 0.7%
61% 62% 63% 65%
37% 36% 35% 33%
2% 2% 2% 1%0.0%
10.0%
20.0%
30.0%
40.0%
50.0%
60.0%
70.0%
2013-2014 2014-2015 2015-2016 2016-2017
Associate or less Bachelor Master Ph.D.
PLANNING, POLICY AND GOVERNMENTAL AFFAIRS DECEMBER 21, 2017
PPGA TAB 5 Page 28
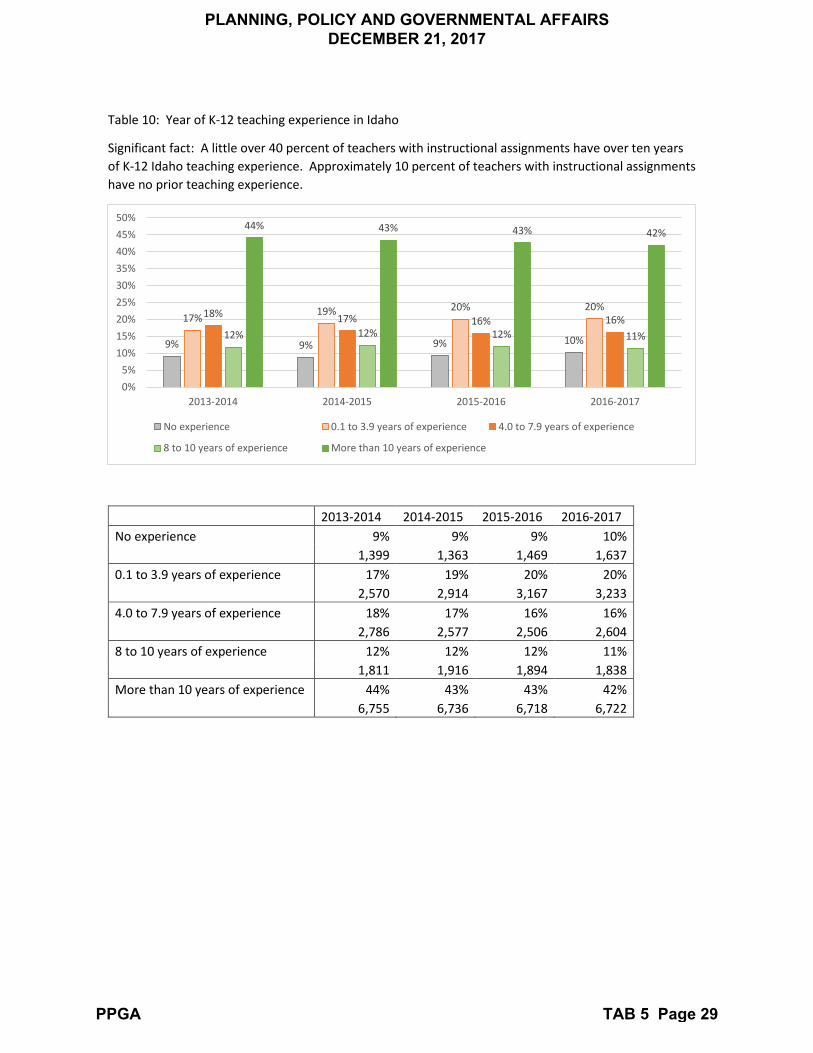
Table 10: Year of K-12 teaching experience in Idaho
Significant fact: A little over 40 percent of teachers with instructional assignments have over ten years of K-12 Idaho teaching experience. Approximately 10 percent of teachers with instructional assignments have no prior teaching experience.
2013-2014 2014-2015 2015-2016 2016-2017 No experience 9% 9% 9% 10% 1,399 1,363 1,469 1,637 0.1 to 3.9 years of experience 17% 19% 20% 20% 2,570 2,914 3,167 3,233 4.0 to 7.9 years of experience 18% 17% 16% 16% 2,786 2,577 2,506 2,604 8 to 10 years of experience 12% 12% 12% 11% 1,811 1,916 1,894 1,838 More than 10 years of experience 44% 43% 43% 42% 6,755 6,736 6,718 6,722
9% 9% 9% 10%
17% 19% 20% 20%18% 17% 16% 16%12% 12% 12% 11%
44% 43% 43% 42%
0%5%
10%15%20%25%30%35%40%45%50%
2013-2014 2014-2015 2015-2016 2016-2017
No experience 0.1 to 3.9 years of experience 4.0 to 7.9 years of experience
8 to 10 years of experience More than 10 years of experience
PLANNING, POLICY AND GOVERNMENTAL AFFAIRS DECEMBER 21, 2017
PPGA TAB 5 Page 29
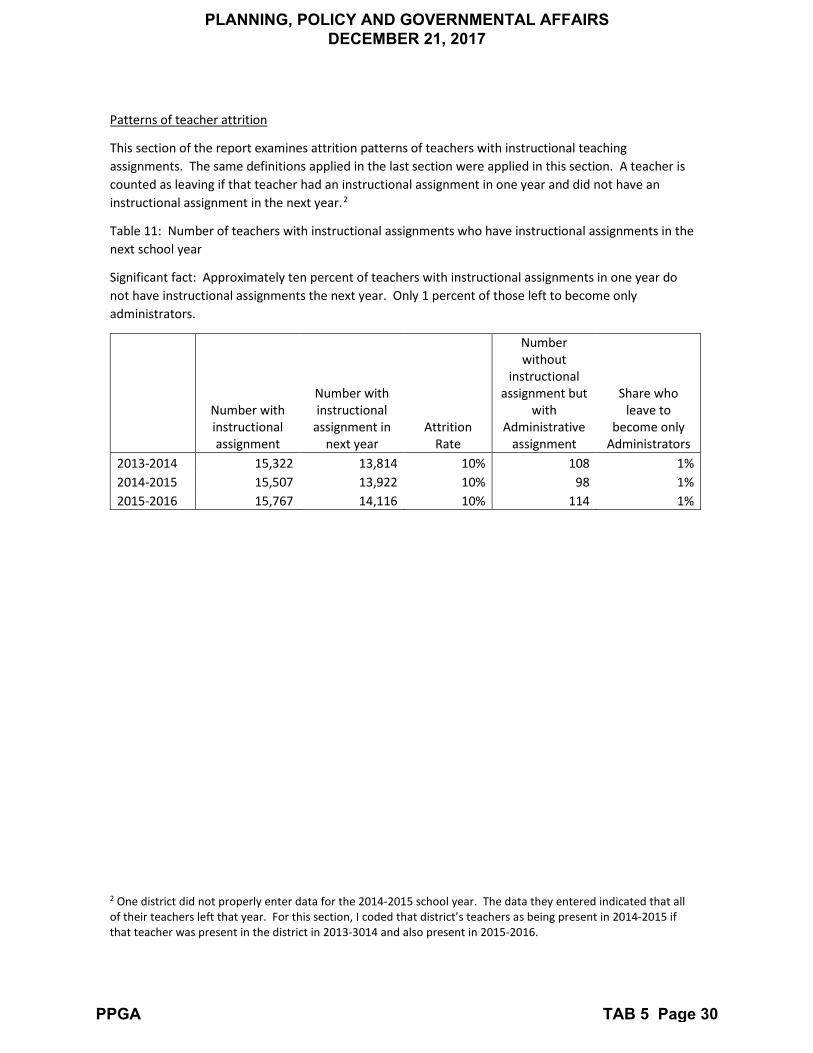
Patterns of teacher attrition
This section of the report examines attrition patterns of teachers with instructional teaching assignments. The same definitions applied in the last section were applied in this section. A teacher is counted as leaving if that teacher had an instructional assignment in one year and did not have an instructional assignment in the next year.2
Table 11: Number of teachers with instructional assignments who have instructional assignments in the next school year
Significant fact: Approximately ten percent of teachers with instructional assignments in one year do not have instructional assignments the next year. Only 1 percent of those left to become only administrators.
Number with instructional assignment
Number with instructional
assignment in next year
Attrition Rate
Number without
instructional assignment but
with Administrative
assignment
Share who leave to
become only Administrators
2013-2014 15,322 13,814 10% 108 1% 2014-2015 15,507 13,922 10% 98 1% 2015-2016 15,767 14,116 10% 114 1%
2 One district did not properly enter data for the 2014-2015 school year. The data they entered indicated that all of their teachers left that year. For this section, I coded that district’s teachers as being present in 2014-2015 if that teacher was present in the district in 2013-3014 and also present in 2015-2016.
PLANNING, POLICY AND GOVERNMENTAL AFFAIRS DECEMBER 21, 2017
PPGA TAB 5 Page 30

Table 12: Number of teachers with instructional assignments who have instructional assignments in the next school year, by age
Significant fact: Attrition rates are highest for those under the age of 35 and those over the age of 54.
Attrition Rate - Share with an assignment in base year but without
assignment in next year 2013-2014 2014-2015 2015-2016 Age 24 or younger 16% 18% 18% Age 25 to 29 11% 13% 14% Age 30 to 34 10% 9% 11% Age 35 to 39 7% 8% 7% Age 40 to 44 7% 6% 6% Age 45 to 49 5% 6% 7% Age 50 to 54 6% 7% 6% Age 55 to 59 13% 13% 14% Age 60 to 64 23% 28% 24% Age 65 and older 31% 35% 36% Overall 10% 11% 10%
Note: Age is measured as of base year. Rates lower than the overall rate are highlighted.
Table 13: Number of teachers with instructional assignments who have instructional assignments in the next school year, by years of experience
Significant fact: Approximately 15 percent of new teachers leave after the first year.
Attrition Rate - Share with an assignment in base year but without assignment in next
year
2013-2014
2014-2015
2015-2016
No prior experience 14% 17% 15% 0.1 to 3.9 years of experience 10% 12% 11% 4.0 to 7.9 years of experience 10% 9% 11% 8 to 10 years of experience 7% 8% 8% More than 10 years of experience 10% 10% 10% Overall 10% 11% 10%
Note: Experience is measured as of base year. Attrition rates higher than the overall rate are highlighted. Years of experience only includes years of teaching K-12 in Idaho.
PLANNING, POLICY AND GOVERNMENTAL AFFAIRS DECEMBER 21, 2017
PPGA TAB 5 Page 31

Table 14: Share of new teacher cohort who leave in subsequent years
Significant fact: Approximately 70 percent of teachers who started teaching in 2013-2014 were still teaching in 2016-2017. The trends look similar for teachers who started teaching in 2014-2015.
2013-2014 (Base Year) 2014-2015 2015-2016 2016-2017
Had instructional assignment 1,399 1,207 1,065 963 Returned from break in service 17 14 Did not have instructional assignment 192 317 422
2014-2015 (Base Year) 2015-2016 2016-2017
Had instructional assignment 1,363 1,131 1,002 Returned from break in service 28 Did not have instructional assignment 232 333
Note: This only includes teachers with 0 years of teaching experience in the base year.
100%86%
76% 69%
1%1%
14% 23% 30%
0%
20%
40%
60%
80%
100%
2013-2014 (Base Year) 2014-2015 2015-2016 2016-2017
2013-2014 New Teacher Cohort
Had instructional assignment Returned from break in service Did not have instructional assignment
100%83% 74%
2%
17% 24%
0%
20%
40%
60%
80%
100%
2014-2015 (Base Year) 2015-2016 2016-2017
2014-2015 New Teacher Cohort
Had instructional assignment Returned from break in service Did not have instructional assignment
PLANNING, POLICY AND GOVERNMENTAL AFFAIRS DECEMBER 21, 2017
PPGA TAB 5 Page 32

This section of the report examines attrition patterns of teachers with instructional teaching assignments by district. Most of the same definitions applied in the last section were applied in this section. A teacher is counted as leaving if that teacher had an instructional assignment in one year in a district and did not have an instructional assignment in the next year in that same district. Therefore, this measures attrition both from the teaching profession as well as from the individual district.
The number of teachers with teaching assignment in each group is tabulated as well as the number of teachers from that group who left the district. Some teachers appear in more than one district. For instance, in the 2013-2014 school year, 906 teachers appeared in more than one district. Of those, 861 were in 2 districts, 33 were in 3 districts, 2 were in 4 districts, 1 was in 5 districts, and 9 were in 6 districts. Therefore the total teachers in each school year will not match the total teachers in earlier graphs and figures.
Table 15: District-level attrition rates by locale
Significant fact: Districts in rural locales have more turnover than districts in urban locales.
2013-2014 2014-2015 2015-2016
Number of teachers with instructional assignments
District-level Attrition Rate
Number of teachers with instructional assignments
District-level Attrition Rate
Number of teachers with instructional assignments
District-level Attrition Rate
Urban 12,732 13% 12,981 14% 13,047 13% Rural, Fringe & Distant 2,059 17% 2,026 18% 2,057 16% Rural, Remote 1,079 16% 1,070 15% 1,075 16% Virtual 412 12% 453 10% 484 11%
Note: Locale was determined using categories defined by the National Center for Education Statistics (NCES).
Table 16: District-level attrition rates by region
Significant fact: Regions 4 and 6 consistently have among the highest district-level attrition rates although there is not a lot of variation between regions.
2013-2014 2014-2015 2015-2016
Region
Number of teachers with instructional assignments
District-level Attrition Rate
Number of teachers with instructional assignments
District-level Attrition Rate
Number of teachers with instructional assignments
District-level Attrition Rate
1 1,736 12% 1,764 13% 1,779 13% 2 977 11% 927 11% 940 13% 3 6,867 14% 6,964 14% 7,058 13% 4 2,268 14% 2,307 17% 2,310 15% 5 1,438 8% 1,480 17% 1,438 13% 6 2,584 16% 2,635 16% 2,654 16%
Virtual 412 12% 453 10% 484 11%
PLANNING, POLICY AND GOVERNMENTAL AFFAIRS DECEMBER 21, 2017
PPGA TAB 5 Page 33

Table 17: One-year district-level attrition for first-year teachers
Significant fact: There is not a clear pattern of differences in district-level attrition for first-year teachers by locale.
2013-2014 2014-2015 2015-2016
Number of first-year teachers with instructional assignments
District-level Attrition Rate
Number of first-year teachers with instructional assignments
District-level Attrition Rate
Number of first-year teachers with instructional assignments
District-level Attrition Rate
Urban 1,090 22% 1,120 24% 1,232 19% Rural, Fringe & Distant 223 21% 207 20% 181 33% Rural, Remote 124 27% 90 23% 89 20% Virtual 58 14% 27 26% 31 19%
Note: This measures attrition following the first-year of teaching for teachers with instructional assignments.
PLANNING, POLICY AND GOVERNMENTAL AFFAIRS DECEMBER 21, 2017
PPGA TAB 5 Page 34
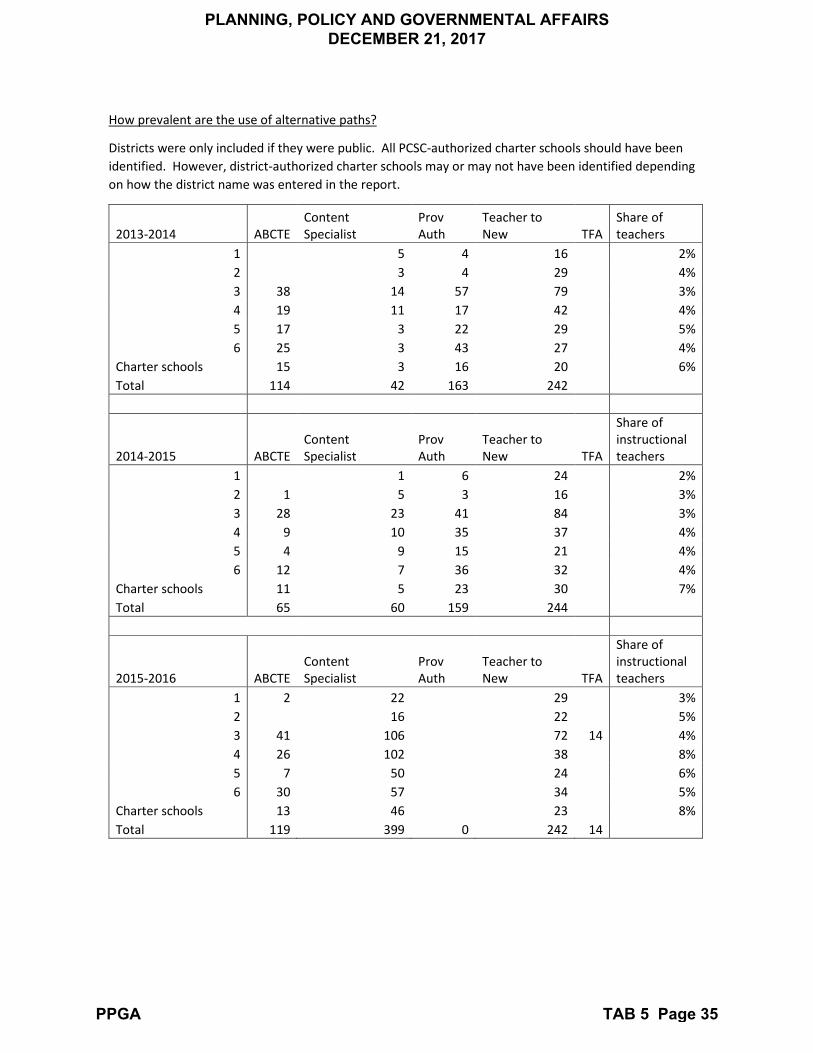
How prevalent are the use of alternative paths?
Districts were only included if they were public. All PCSC-authorized charter schools should have been identified. However, district-authorized charter schools may or may not have been identified depending on how the district name was entered in the report.
2013-2014 ABCTE Content Specialist
Prov Auth
Teacher to New TFA
Share of teachers
1 5 4 16 2% 2 3 4 29 4% 3 38 14 57 79 3% 4 19 11 17 42 4% 5 17 3 22 29 5% 6 25 3 43 27 4%
Charter schools 15 3 16 20 6% Total 114 42 163 242
2014-2015 ABCTE Content Specialist
Prov Auth
Teacher to New TFA
Share of instructional teachers
1 1 6 24 2% 2 1 5 3 16 3% 3 28 23 41 84 3% 4 9 10 35 37 4% 5 4 9 15 21 4% 6 12 7 36 32 4%
Charter schools 11 5 23 30 7% Total 65 60 159 244
2015-2016 ABCTE Content Specialist
Prov Auth
Teacher to New TFA
Share of instructional teachers
1 2 22 29 3% 2 16 22 5% 3 41 106 72 14 4% 4 26 102 38 8% 5 7 50 24 6% 6 30 57 34 5%
Charter schools 13 46 23 8% Total 119 399 0 242 14
PLANNING, POLICY AND GOVERNMENTAL AFFAIRS DECEMBER 21, 2017
PPGA TAB 5 Page 35

2013-2014 ABCTE Content Specialist
Prov Auth
Teacher to New TFA
Share of instructional teachers
Urban 85 31 108 136 3% Rural, Fringe & Distant 7 5 16 42 4% Rural, Remote 7 3 23 44 8% Total 114 42 163 242
2014-2015 ABCTE Content Specialist
Prov Auth
Teacher to New TFA
Share of instructional teachers
Urban 41 43 102 135 3% Rural, Fringe & Distant 7 5 21 48 5% Rural, Remote 6 7 13 31 6% Total 65 60 159 244
2015-2016 ABCTE Content Specialist
Prov Auth
Teacher to New TFA
Share of instructional teachers
Urban 88 251 129 14 4% Rural, Fringe & Distant 11 57 54 7% Rural, Remote 7 45 36 9% Total 119 399 0 242 14
PLANNING, POLICY AND GOVERNMENTAL AFFAIRS DECEMBER 21, 2017
PPGA TAB 5 Page 36

Appendix I: Classification of endorsements
Classification of endorsements to assignment areas
Mathematics 7300 Mathematics (6-12)
7320 Mathematics - Basic (6-12)
7400 Computer Science (6-12) 7990 Engineering (6-12) 8300 Mathematics (5-9) 8320 Mathematics - Basic (5-9)
Life and Physical Science 7400 Computer Science (6-12) 7420 Natural Science (6-12) 7421 Biological Science (6-12) 7430 Physical Science (6-12) 7440 Chemistry (6-12) 7450 Physics (6-12) 7451 Earth and Space Science (6-12) 7452 Geology (6-12) 7990 Engineering (6-12) 8420 Natural Science (5-9) 8421 Biological Science (5-9) 8430 Physical Science (5-9) 8440 Chemistry (5-9) 8450 Physics (5-9) 8451 Earth and Space Science (5-9) 8452 Geology (5-9)
PLANNING, POLICY AND GOVERNMENTAL AFFAIRS DECEMBER 21, 2017
PPGA TAB 5 Page 37
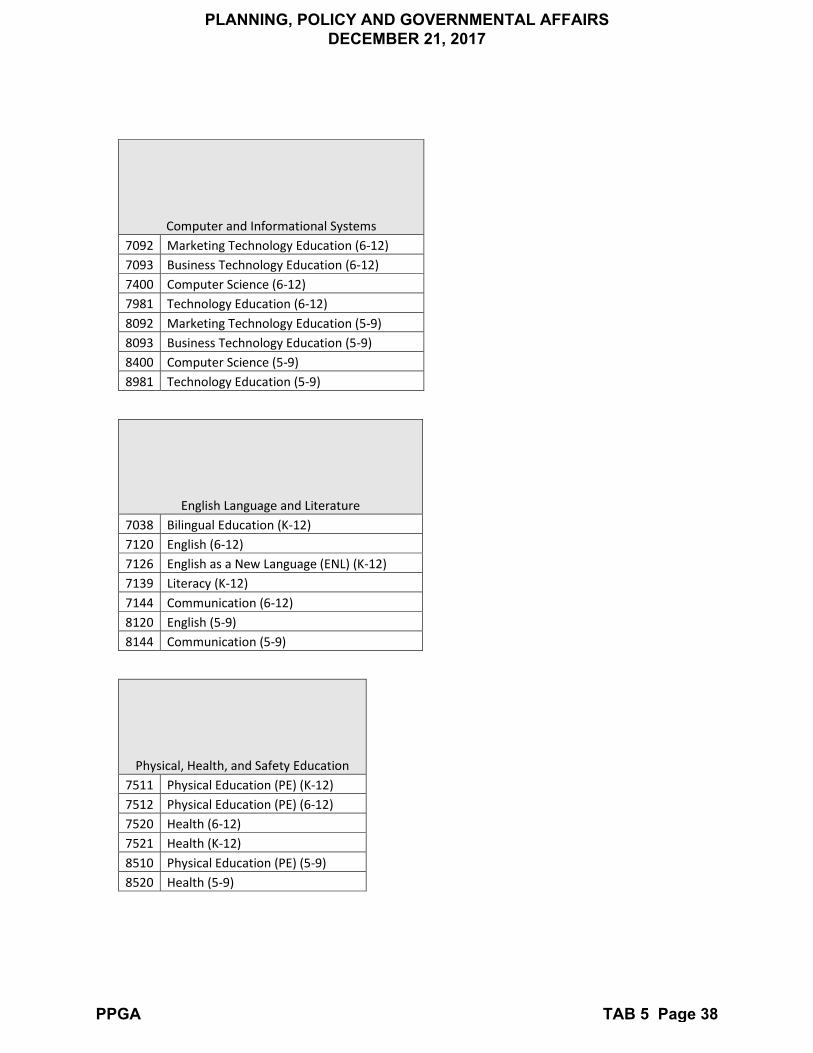
Computer and Informational Systems 7092 Marketing Technology Education (6-12) 7093 Business Technology Education (6-12) 7400 Computer Science (6-12) 7981 Technology Education (6-12) 8092 Marketing Technology Education (5-9) 8093 Business Technology Education (5-9) 8400 Computer Science (5-9) 8981 Technology Education (5-9)
English Language and Literature 7038 Bilingual Education (K-12) 7120 English (6-12) 7126 English as a New Language (ENL) (K-12) 7139 Literacy (K-12) 7144 Communication (6-12) 8120 English (5-9) 8144 Communication (5-9)
Physical, Health, and Safety Education 7511 Physical Education (PE) (K-12) 7512 Physical Education (PE) (6-12) 7520 Health (6-12) 7521 Health (K-12) 8510 Physical Education (PE) (5-9) 8520 Health (5-9)
PLANNING, POLICY AND GOVERNMENTAL AFFAIRS DECEMBER 21, 2017
PPGA TAB 5 Page 38

World Language 7700 World Language (6-12) 7701 World Language - American Sign Language (K-12) 7702 World Language - American Sign Language (6-12) 7710 World Language (K-12) 7711 World Language - Spanish (K-12) 7712 World Language - French (K-12) 7713 World Language - German (K-12) 7714 World Language - Russian (K-12) 7715 World Language - Chinese (K-12) 7720 World Language - Spanish (6-12) 7730 World Language - French (6-12) 7740 World Language - German (6-12) 7750 World Language - Latin (K-12) 7760 World Language - Russian (6-12) 7770 American Indian Language (6-12) 7779 World Language - Greek (6-12) 7780 World Language - Greek (K-12) 7781 World Language - Arabic (6-12) 7782 World Language - Arabic (K-12) 7789 World Language - Persian (6-12) 7790 World Language - Persian (K-12) 7791 World Language - Portuguese (K-12) 7792 World Language - Japanese (K-12) 7793 World Language - Italian (K-12) 7794 World Language - Hebrew (K-12) 7795 World Language - Korean (K-12) 7796 World Language - Chinese (6-12) 7797 World Language - Slovak (K-12) 7798 World Language - Czech (K-12) 8700 World Language (5-9) 8702 World Language - American Sign Language (5-9) 8720 World Language - Spanish (5-9) 8740 World Language - German (5-9) 8760 World Language - Russian (5-9) 8781 World Language - Arabic (5-9) 8790 World Language - Persian (5-9) 8796 World Language - Chinese (5-9) 8830 World Language - French (5-9)
PLANNING, POLICY AND GOVERNMENTAL AFFAIRS DECEMBER 21, 2017
PPGA TAB 5 Page 39
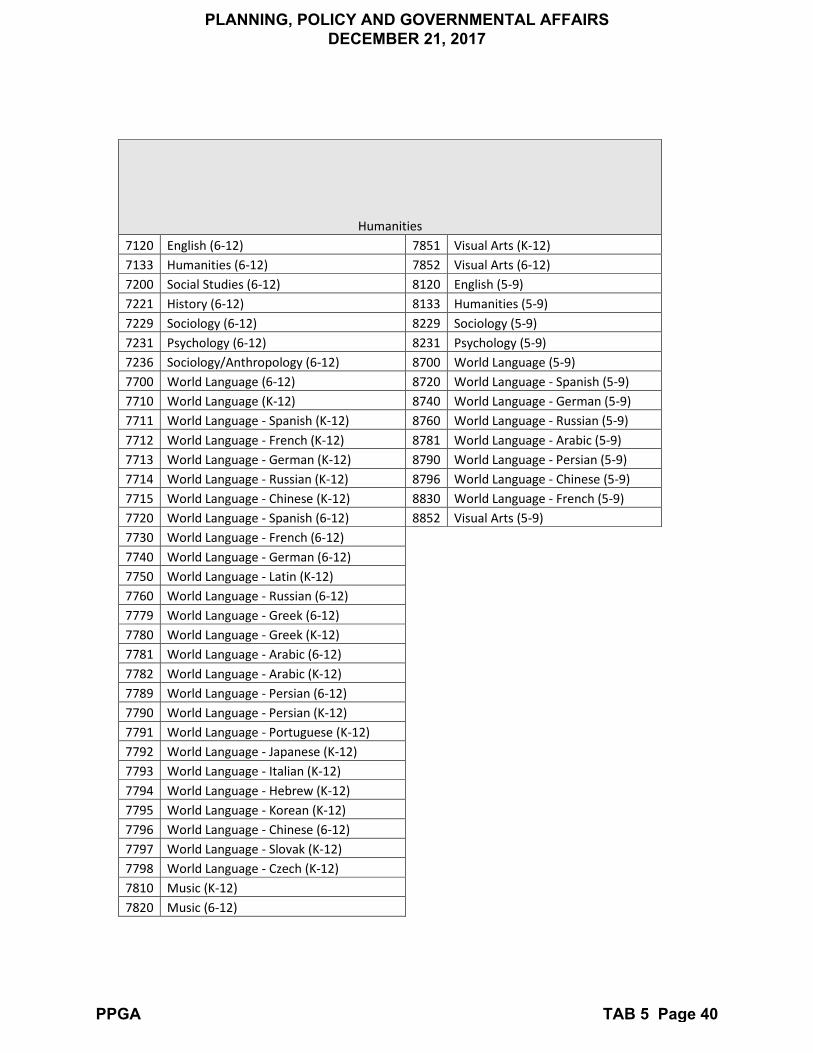
Humanities 7120 English (6-12) 7851 Visual Arts (K-12) 7133 Humanities (6-12) 7852 Visual Arts (6-12) 7200 Social Studies (6-12) 8120 English (5-9) 7221 History (6-12) 8133 Humanities (5-9) 7229 Sociology (6-12) 8229 Sociology (5-9) 7231 Psychology (6-12) 8231 Psychology (5-9) 7236 Sociology/Anthropology (6-12) 8700 World Language (5-9) 7700 World Language (6-12) 8720 World Language - Spanish (5-9) 7710 World Language (K-12) 8740 World Language - German (5-9) 7711 World Language - Spanish (K-12) 8760 World Language - Russian (5-9) 7712 World Language - French (K-12) 8781 World Language - Arabic (5-9) 7713 World Language - German (K-12) 8790 World Language - Persian (5-9) 7714 World Language - Russian (K-12) 8796 World Language - Chinese (5-9) 7715 World Language - Chinese (K-12) 8830 World Language - French (5-9) 7720 World Language - Spanish (6-12) 8852 Visual Arts (5-9) 7730 World Language - French (6-12) 7740 World Language - German (6-12) 7750 World Language - Latin (K-12) 7760 World Language - Russian (6-12) 7779 World Language - Greek (6-12) 7780 World Language - Greek (K-12) 7781 World Language - Arabic (6-12) 7782 World Language - Arabic (K-12) 7789 World Language - Persian (6-12) 7790 World Language - Persian (K-12) 7791 World Language - Portuguese (K-12) 7792 World Language - Japanese (K-12) 7793 World Language - Italian (K-12) 7794 World Language - Hebrew (K-12) 7795 World Language - Korean (K-12) 7796 World Language - Chinese (6-12) 7797 World Language - Slovak (K-12) 7798 World Language - Czech (K-12) 7810 Music (K-12) 7820 Music (6-12)
PLANNING, POLICY AND GOVERNMENTAL AFFAIRS DECEMBER 21, 2017
PPGA TAB 5 Page 40

Social Science 7200 Social Studies (6-12) 7221 History (6-12) 7222 American Government/Political Science (6-12) 7226 Geography (6-12) 7228 Economics (6-12) 7229 Sociology (6-12) 7231 Psychology (6-12) 7236 Sociology/Anthropology (6-12) 8200 Social Studies (5-9) 8221 History (5-9) 8222 American Government/Political Science (5-9) 8226 Geography (5-9) 8228 Economics (5-9) 8229 Sociology (5-9) 8231 Psychology (5-9) 8236 Sociology/Anthropology (5-9)
Fine and Performing Arts 7134 Journalism (6-12) 7137 Theater Arts (6-12) 7511 Physical Education (PE) (K-12) 7512 Physical Education (PE) (6-12) 7810 Music (K-12) 7820 Music (6-12) 7851 Visual Arts (K-12) 7852 Visual Arts (6-12) 8134 Journalism (5-9) 8137 Theater Arts (5-9) 8510 Physical Education (PE) (5-9) 8820 Music (5-9) 8852 Visual Arts (5-9)
PLANNING, POLICY AND GOVERNMENTAL AFFAIRS DECEMBER 21, 2017
PPGA TAB 5 Page 41

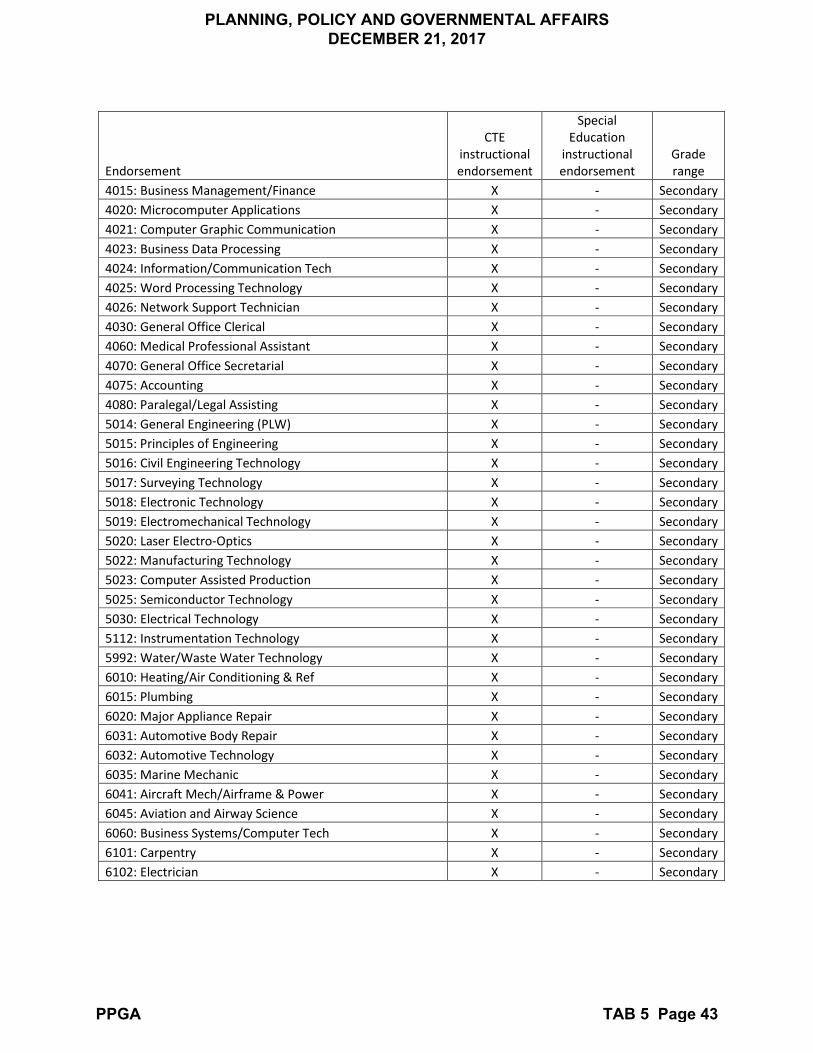
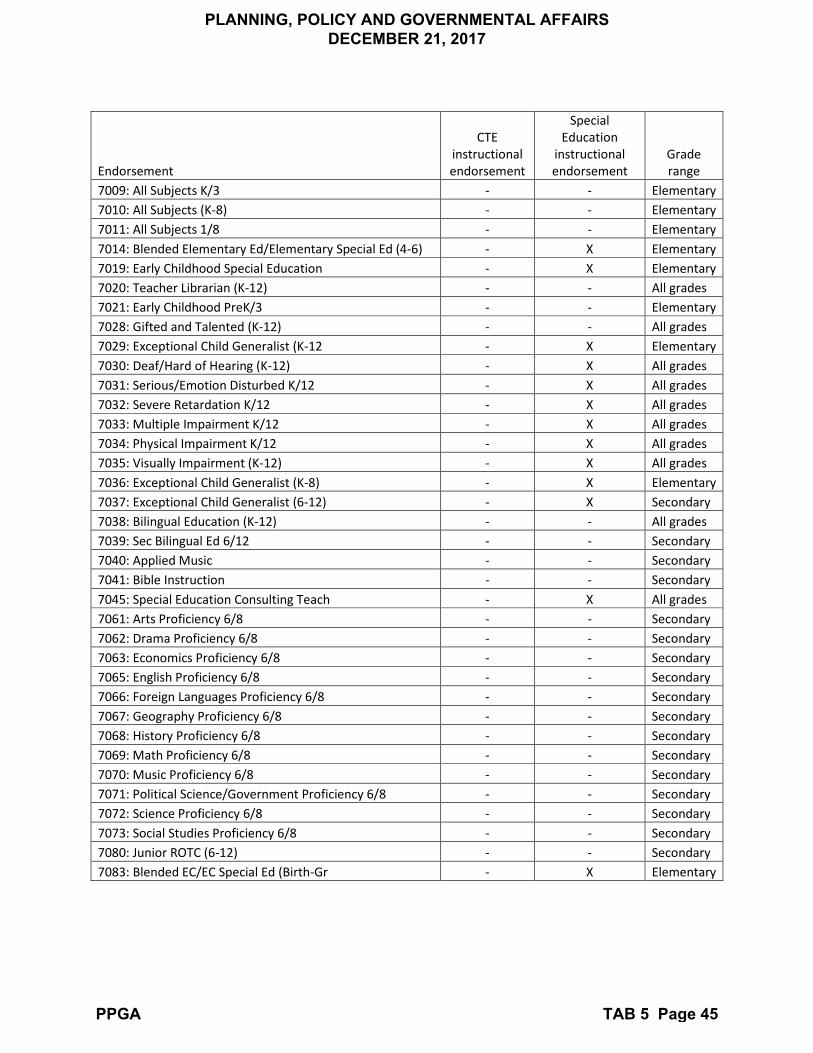
Classification of endorsements: CTE, Special Education, Grade Range
Endorsement
CTE instructional endorsement
Special Education
instructional endorsement
Grade range
1010: Marketing X - Secondary 108: Animal Health & Veterinary Sci X - Secondary 1080: Sales X - Secondary 1085: Hospitality X - Secondary 109: Agriculture Business & Mgm X - Secondary 110: Agriculture Production X - Secondary 114: Farm & Ranch Management X - Secondary 130: Agricultural Power Machinery X - Secondary 150: Horticulture X - Secondary 161: Aquaculture X - Secondary 170: Forestry X - Secondary 174: Natural Resource Management X - Secondary 2000: Orientation Health Occupations X - Secondary 2011: Dental Assisting X - Secondary 2013: Dental Laboratory Technology X - Secondary 2015: Dental Hygiene X - Secondary 2030: Dietitian X - Secondary 2032: Practical Nursing X - Secondary 2033: Nursing Assistant X - Secondary 2035: Surgical Technology X - Secondary 2050: Rehab/Therapeutic Services X - Secondary 2060: Radiology Technology X - Secondary 2080: Mental Health Technology X - Secondary 2085: Emergency Medical Technician X - Secondary 2093: Respiratory Therapy X - Secondary 2094: Medical Assisting X - Secondary 2095: Pharmacy Assisting X - Secondary 2096: Medical Administrative Assisting X - Secondary 2097: Health Informatics X - Secondary 2098: Sports Medicine/Athletic Train X - Secondary 2099: Personal Trainer X - Secondary 3020: Child Dev Care & Guidance X - Secondary 3023: Food Service X - Secondary 3025: Culinary Arts X - Secondary 3030: Fashion and Interiors 6/12 X - Secondary 4010: Bookkeeping X - Secondary
PLANNING, POLICY AND GOVERNMENTAL AFFAIRS DECEMBER 21, 2017
PPGA TAB 5 Page 42
Endorsement
CTE instructional endorsement
Special Education
instructional endorsement
Grade range
4015: Business Management/Finance X - Secondary 4020: Microcomputer Applications X - Secondary 4021: Computer Graphic Communication X - Secondary 4023: Business Data Processing X - Secondary 4024: Information/Communication Tech X - Secondary 4025: Word Processing Technology X - Secondary 4026: Network Support Technician X - Secondary 4030: General Office Clerical X - Secondary 4060: Medical Professional Assistant X - Secondary 4070: General Office Secretarial X - Secondary 4075: Accounting X - Secondary 4080: Paralegal/Legal Assisting X - Secondary 5014: General Engineering (PLW) X - Secondary 5015: Principles of Engineering X - Secondary 5016: Civil Engineering Technology X - Secondary 5017: Surveying Technology X - Secondary 5018: Electronic Technology X - Secondary 5019: Electromechanical Technology X - Secondary 5020: Laser Electro-Optics X - Secondary 5022: Manufacturing Technology X - Secondary 5023: Computer Assisted Production X - Secondary 5025: Semiconductor Technology X - Secondary 5030: Electrical Technology X - Secondary 5112: Instrumentation Technology X - Secondary 5992: Water/Waste Water Technology X - Secondary 6010: Heating/Air Conditioning & Ref X - Secondary 6015: Plumbing X - Secondary 6020: Major Appliance Repair X - Secondary 6031: Automotive Body Repair X - Secondary 6032: Automotive Technology X - Secondary 6035: Marine Mechanic X - Secondary 6041: Aircraft Mech/Airframe & Power X - Secondary 6045: Aviation and Airway Science X - Secondary 6060: Business Systems/Computer Tech X - Secondary 6101: Carpentry X - Secondary 6102: Electrician X - Secondary
PLANNING, POLICY AND GOVERNMENTAL AFFAIRS DECEMBER 21, 2017
PPGA TAB 5 Page 43

Endorsement
CTE instructional endorsement
Special Education
instructional endorsement
Grade range
6103: Masons & Tile Setters X - Secondary 6105: Cabinetmaking & Millwork X - Secondary 6108: Building Trades Construction X - Secondary 6109: Indust Maintenance Mechanics X - Secondary 6110: Paint&Wallcover/Building Maint X - Secondary 6112: Digital Home Technology X - Secondary 6120: Diesel Engine Mechanics X - Secondary 6130: Drafting X - Secondary 6131: Architectural Drafting Tech X - Secondary 6132: Mechanical Drafting Tech X - Secondary 6142: Lineworker X - Secondary 6145: Environmental Control Tech X - Secondary 6148: Alternative Energy Technology X - Secondary 6151: Communications Technology X - Secondary 6152: Industrial Electronics X - Secondary 6153: Networking Technologies X - Secondary 6155: Computer Science/Information Techn X - Secondary 6157: Computer Science PLTW 6/12 X - Secondary 6180: Graphic Arts/Journalism X - Secondary 6190: Graphic/Printing Communication X - Secondary 6192: Photography X - Secondary 6195: Television Prod/Broadcasting X - Secondary 6200: Nuclear Power & Radiation Tech X - Secondary 6203: Chemical Technology X - Secondary 6204: Environmental & Pollution Con X - Secondary 6232: Machining Technologist X - Secondary 6236: Welding X - Secondary 6241: Quality Control Technology X - Secondary 6262: Cosmetology X - Secondary 6280: Fire Control/Safety Technology X - Secondary 6282: Law Enforcement X - Secondary 6283: Security X - Secondary 6310: Small Engine Repair X - Secondary 6350: Upholstering X - Secondary 6506: Meat Cutter X - Secondary 6898: Truck and Bus Driving X - Secondary
PLANNING, POLICY AND GOVERNMENTAL AFFAIRS DECEMBER 21, 2017
PPGA TAB 5 Page 44
Endorsement
CTE instructional endorsement
Special Education
instructional endorsement
Grade range
7009: All Subjects K/3 - - Elementary 7010: All Subjects (K-8) - - Elementary 7011: All Subjects 1/8 - - Elementary 7014: Blended Elementary Ed/Elementary Special Ed (4-6) - X Elementary 7019: Early Childhood Special Education - X Elementary 7020: Teacher Librarian (K-12) - - All grades 7021: Early Childhood PreK/3 - - Elementary 7028: Gifted and Talented (K-12) - - All grades 7029: Exceptional Child Generalist (K-12 - X Elementary 7030: Deaf/Hard of Hearing (K-12) - X All grades 7031: Serious/Emotion Disturbed K/12 - X All grades 7032: Severe Retardation K/12 - X All grades 7033: Multiple Impairment K/12 - X All grades 7034: Physical Impairment K/12 - X All grades 7035: Visually Impairment (K-12) - X All grades 7036: Exceptional Child Generalist (K-8) - X Elementary 7037: Exceptional Child Generalist (6-12) - X Secondary 7038: Bilingual Education (K-12) - - All grades 7039: Sec Bilingual Ed 6/12 - - Secondary 7040: Applied Music - - Secondary 7041: Bible Instruction - - Secondary 7045: Special Education Consulting Teach - X All grades 7061: Arts Proficiency 6/8 - - Secondary 7062: Drama Proficiency 6/8 - - Secondary 7063: Economics Proficiency 6/8 - - Secondary 7065: English Proficiency 6/8 - - Secondary 7066: Foreign Languages Proficiency 6/8 - - Secondary 7067: Geography Proficiency 6/8 - - Secondary 7068: History Proficiency 6/8 - - Secondary 7069: Math Proficiency 6/8 - - Secondary 7070: Music Proficiency 6/8 - - Secondary 7071: Political Science/Government Proficiency 6/8 - - Secondary 7072: Science Proficiency 6/8 - - Secondary 7073: Social Studies Proficiency 6/8 - - Secondary 7080: Junior ROTC (6-12) - - Secondary 7083: Blended EC/EC Special Ed (Birth-Gr - X Elementary
PLANNING, POLICY AND GOVERNMENTAL AFFAIRS DECEMBER 21, 2017
PPGA TAB 5 Page 45
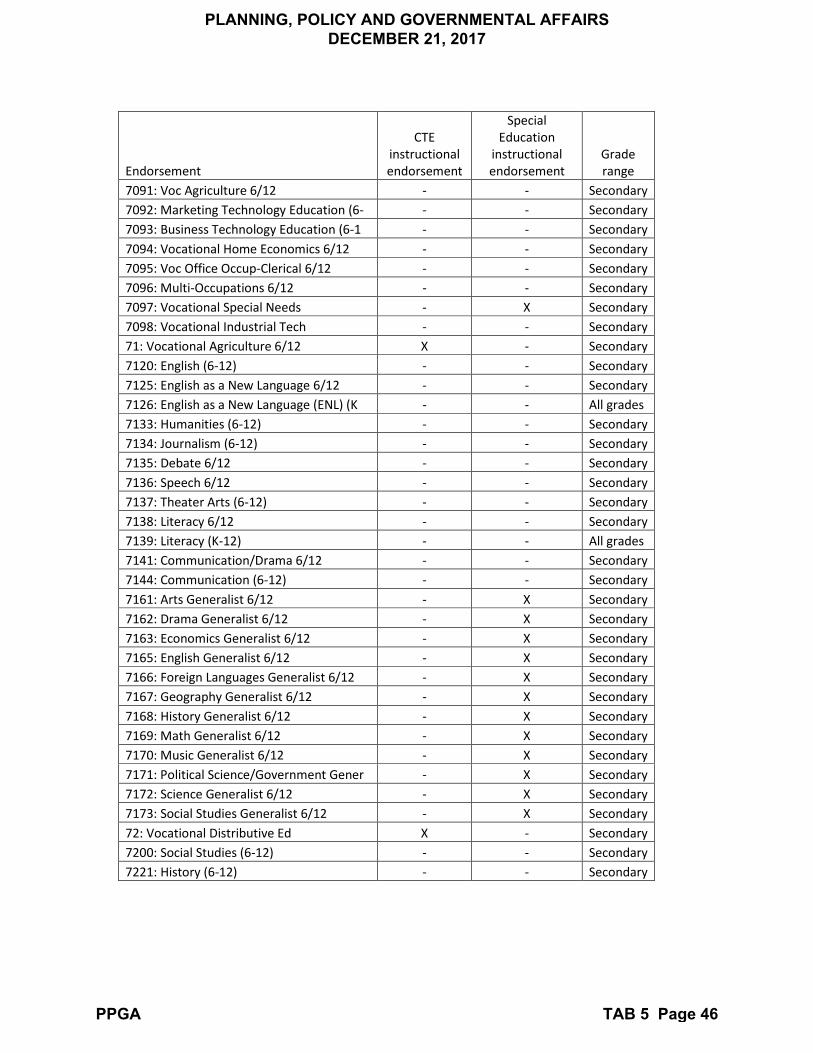
Endorsement
CTE instructional endorsement
Special Education
instructional endorsement
Grade range
7091: Voc Agriculture 6/12 - - Secondary 7092: Marketing Technology Education (6- - - Secondary 7093: Business Technology Education (6-1 - - Secondary 7094: Vocational Home Economics 6/12 - - Secondary 7095: Voc Office Occup-Clerical 6/12 - - Secondary 7096: Multi-Occupations 6/12 - - Secondary 7097: Vocational Special Needs - X Secondary 7098: Vocational Industrial Tech - - Secondary 71: Vocational Agriculture 6/12 X - Secondary 7120: English (6-12) - - Secondary 7125: English as a New Language 6/12 - - Secondary 7126: English as a New Language (ENL) (K - - All grades 7133: Humanities (6-12) - - Secondary 7134: Journalism (6-12) - - Secondary 7135: Debate 6/12 - - Secondary 7136: Speech 6/12 - - Secondary 7137: Theater Arts (6-12) - - Secondary 7138: Literacy 6/12 - - Secondary 7139: Literacy (K-12) - - All grades 7141: Communication/Drama 6/12 - - Secondary 7144: Communication (6-12) - - Secondary 7161: Arts Generalist 6/12 - X Secondary 7162: Drama Generalist 6/12 - X Secondary 7163: Economics Generalist 6/12 - X Secondary 7165: English Generalist 6/12 - X Secondary 7166: Foreign Languages Generalist 6/12 - X Secondary 7167: Geography Generalist 6/12 - X Secondary 7168: History Generalist 6/12 - X Secondary 7169: Math Generalist 6/12 - X Secondary 7170: Music Generalist 6/12 - X Secondary 7171: Political Science/Government Gener - X Secondary 7172: Science Generalist 6/12 - X Secondary 7173: Social Studies Generalist 6/12 - X Secondary 72: Vocational Distributive Ed X - Secondary 7200: Social Studies (6-12) - - Secondary 7221: History (6-12) - - Secondary
PLANNING, POLICY AND GOVERNMENTAL AFFAIRS DECEMBER 21, 2017
PPGA TAB 5 Page 46
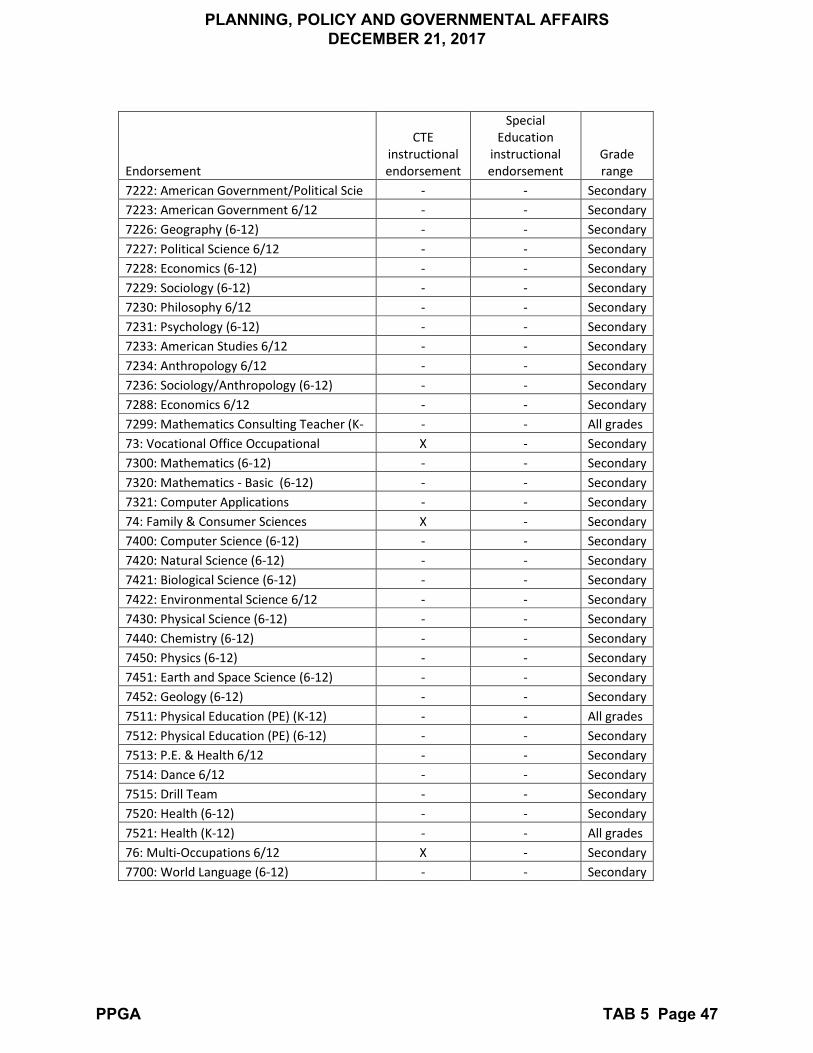
Endorsement
CTE instructional endorsement
Special Education
instructional endorsement
Grade range
7222: American Government/Political Scie - - Secondary 7223: American Government 6/12 - - Secondary 7226: Geography (6-12) - - Secondary 7227: Political Science 6/12 - - Secondary 7228: Economics (6-12) - - Secondary 7229: Sociology (6-12) - - Secondary 7230: Philosophy 6/12 - - Secondary 7231: Psychology (6-12) - - Secondary 7233: American Studies 6/12 - - Secondary 7234: Anthropology 6/12 - - Secondary 7236: Sociology/Anthropology (6-12) - - Secondary 7288: Economics 6/12 - - Secondary 7299: Mathematics Consulting Teacher (K- - - All grades 73: Vocational Office Occupational X - Secondary 7300: Mathematics (6-12) - - Secondary 7320: Mathematics - Basic (6-12) - - Secondary 7321: Computer Applications - - Secondary 74: Family & Consumer Sciences X - Secondary 7400: Computer Science (6-12) - - Secondary 7420: Natural Science (6-12) - - Secondary 7421: Biological Science (6-12) - - Secondary 7422: Environmental Science 6/12 - - Secondary 7430: Physical Science (6-12) - - Secondary 7440: Chemistry (6-12) - - Secondary 7450: Physics (6-12) - - Secondary 7451: Earth and Space Science (6-12) - - Secondary 7452: Geology (6-12) - - Secondary 7511: Physical Education (PE) (K-12) - - All grades 7512: Physical Education (PE) (6-12) - - Secondary 7513: P.E. & Health 6/12 - - Secondary 7514: Dance 6/12 - - Secondary 7515: Drill Team - - Secondary 7520: Health (6-12) - - Secondary 7521: Health (K-12) - - All grades 76: Multi-Occupations 6/12 X - Secondary 7700: World Language (6-12) - - Secondary
PLANNING, POLICY AND GOVERNMENTAL AFFAIRS DECEMBER 21, 2017
PPGA TAB 5 Page 47

Endorsement
CTE instructional endorsement
Special Education
instructional endorsement
Grade range
7701: World Language - American Sign Lan - - All grades 7702: World Language - American Sign Language (6-12) - - Secondary 7710: World Language (K-12) - - All grades 7711: World Language - Spanish (K-12) - - All grades 7712: World Language - French (K-12) - - All grades 7713: World Language - German (K-12) - - All grades 7714: World Language - Russian (K-12) - - All grades 7715: World Language - Chinese (K-12) - - All grades 7720: World Language - Spanish (6-12) - - Secondary 7730: World Language - French (6-12) - - Secondary 7740: World Language - German (6-12) - - Secondary 7750: World Language - Latin (K-12) - - All grades 7760: World Language - Russian (6-12) - - Secondary 7770: American Indian Language (6-12) - - Secondary 7779: World Language - Greek (6-12) - - Secondary 7780: World Language - Greek (K-12) - - All grades 7781: World Language - Arabic (6-12) - - Secondary 7782: World Language - Arabic (K-12) - - All grades 7789: World Language - Persian (6-12) - - Secondary 7790: World Language - Persian (K-12) - - All grades 7791: World Language - Portuguese (K-12) - - All grades 7792: World Language - Japanese (K-12) - - All grades 7793: World Language - Italian (K-12) - - All grades 7794: World Language - Hebrew (K-12) - - All grades 7795: World Language - Korean (K-12) - - All grades 7796: World Language - Chinese (6-12) - - Secondary 7797: World Language - Slovak (K-12) - - All grades 7798: World Language - Czech (K-12) - - All grades 7810: Music (K-12) - - All grades 7820: Music (6-12) - - Secondary 7823: Vocal Choral Music - - Secondary 7825: Music Specialist K/8 - - Elementary 7851: Visual Arts (K-12) - - All grades 7852: Visual Arts (6-12) - - Secondary 7853: Arts & Crafts 6/12 - - Secondary 7870: Photography 6/12 - - Secondary
PLANNING, POLICY AND GOVERNMENTAL AFFAIRS DECEMBER 21, 2017
PPGA TAB 5 Page 48
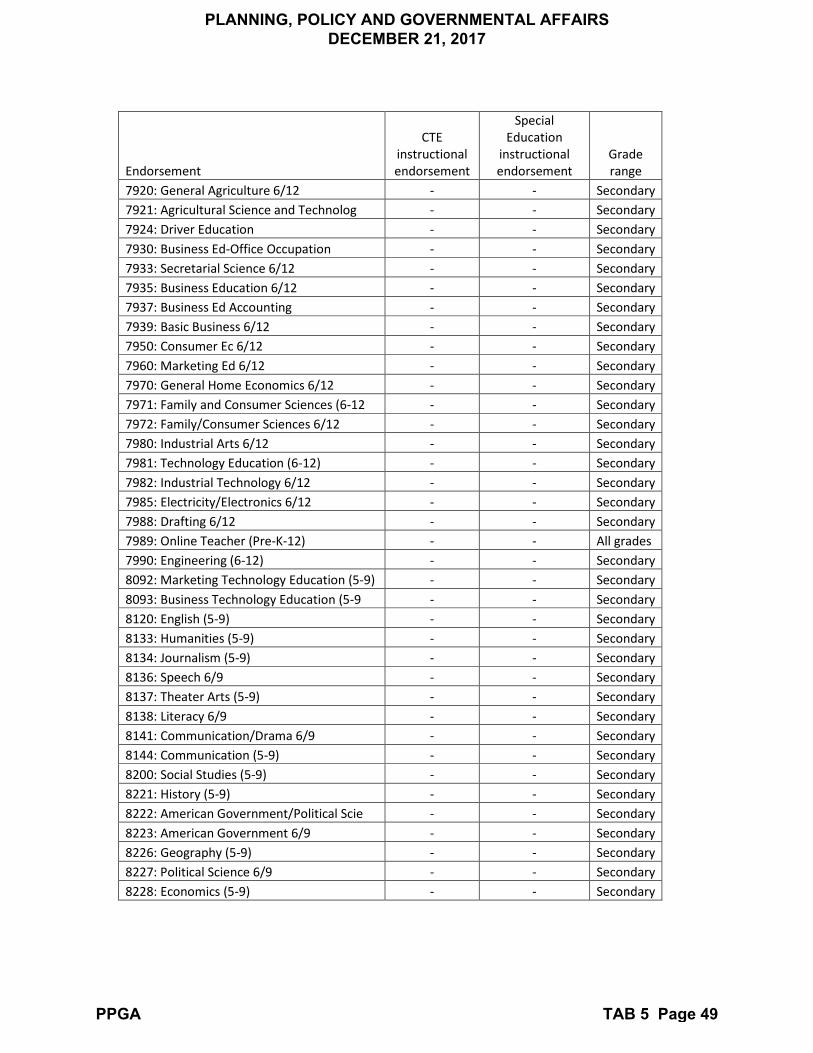
Endorsement
CTE instructional endorsement
Special Education
instructional endorsement
Grade range
7920: General Agriculture 6/12 - - Secondary 7921: Agricultural Science and Technolog - - Secondary 7924: Driver Education - - Secondary 7930: Business Ed-Office Occupation - - Secondary 7933: Secretarial Science 6/12 - - Secondary 7935: Business Education 6/12 - - Secondary 7937: Business Ed Accounting - - Secondary 7939: Basic Business 6/12 - - Secondary 7950: Consumer Ec 6/12 - - Secondary 7960: Marketing Ed 6/12 - - Secondary 7970: General Home Economics 6/12 - - Secondary 7971: Family and Consumer Sciences (6-12 - - Secondary 7972: Family/Consumer Sciences 6/12 - - Secondary 7980: Industrial Arts 6/12 - - Secondary 7981: Technology Education (6-12) - - Secondary 7982: Industrial Technology 6/12 - - Secondary 7985: Electricity/Electronics 6/12 - - Secondary 7988: Drafting 6/12 - - Secondary 7989: Online Teacher (Pre-K-12) - - All grades 7990: Engineering (6-12) - - Secondary 8092: Marketing Technology Education (5-9) - - Secondary 8093: Business Technology Education (5-9 - - Secondary 8120: English (5-9) - - Secondary 8133: Humanities (5-9) - - Secondary 8134: Journalism (5-9) - - Secondary 8136: Speech 6/9 - - Secondary 8137: Theater Arts (5-9) - - Secondary 8138: Literacy 6/9 - - Secondary 8141: Communication/Drama 6/9 - - Secondary 8144: Communication (5-9) - - Secondary 8200: Social Studies (5-9) - - Secondary 8221: History (5-9) - - Secondary 8222: American Government/Political Scie - - Secondary 8223: American Government 6/9 - - Secondary 8226: Geography (5-9) - - Secondary 8227: Political Science 6/9 - - Secondary 8228: Economics (5-9) - - Secondary
PLANNING, POLICY AND GOVERNMENTAL AFFAIRS DECEMBER 21, 2017
PPGA TAB 5 Page 49

Endorsement
CTE instructional endorsement
Special Education
instructional endorsement
Grade range
8229: Sociology (5-9) - - Secondary 8230: Philosophy 6/9 - - Secondary 8231: Psychology (5-9) - - Secondary 8234: Anthropology 6/9 - - Secondary 8236: Sociology/Anthropology (5-9) - - Secondary 8244: Motel/Hotel Management X - Secondary 8300: Mathematics (5-9) - - Secondary 8320: Mathematics - Basic (5-9) - - Secondary 8321: Computer App 6/9 - - Secondary 8400: Computer Science (5-9) - - Secondary 8420: Natural Science (5-9) - - Secondary 8421: Biological Science (5-9) - - Secondary 8430: Physical Science (5-9) - - Secondary 8440: Chemistry (5-9) - - Secondary 8450: Physics (5-9) - - Secondary 8451: Earth and Space Science (5-9) - - Secondary 8452: Geology (5-9) - - Secondary 8510: Physical Education (PE) (5-9) - - Secondary 8520: Health (5-9) - - Secondary 8556: Office Procedures - - Secondary 8700: World Language (5-9) - - Secondary 8702: World Language - American Sign Language (5-9) - - Secondary 8720: World Language - Spanish (5-9) - - Secondary 8740: World Language - German (5-9) - - Secondary 8760: World Language - Russian (5-9) - - Secondary 8781: World Language - Arabic (5-9) - - Secondary 8790: World Language - Persian (5-9) - - Secondary 8796: World Language - Chinese (5-9) - - Secondary 8820: Music (5-9) - - Secondary 8830: World Language - French (5-9) - - Secondary 8852: Visual Arts (5-9) - - Secondary 8921: Agricultural Science and Technology (5-9) - - Secondary 8935: Business Ed 6/9 - - Secondary 8960: Marketing Ed 6/9 - - Secondary 8971: Family and Consumer Sciences (5-9) - - Secondary 8981: Technology Education (5-9) - - Secondary 8990: Engineering (5-9) - - Secondary 98: Related Subjects X - Secondary
PLANNING, POLICY AND GOVERNMENTAL AFFAIRS DECEMBER 21, 2017
PPGA TAB 5 Page 50
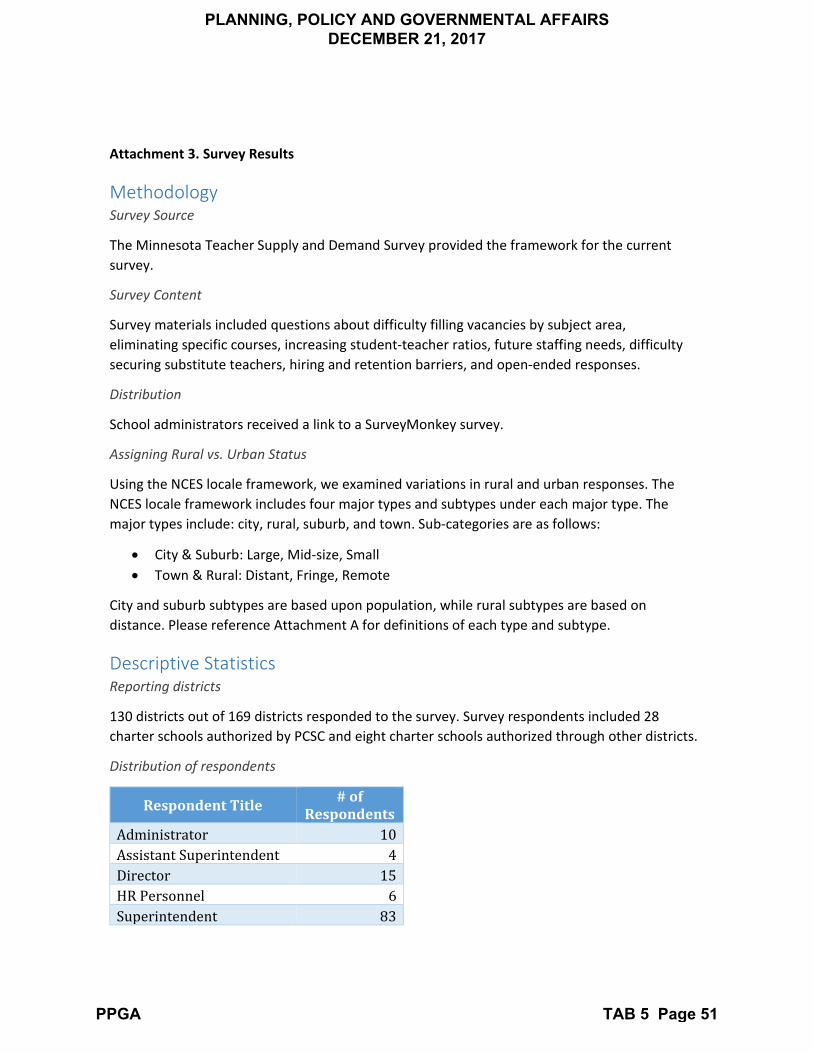
Attachment 3. Survey Results
Methodology Survey Source
The Minnesota Teacher Supply and Demand Survey provided the framework for the current survey.
Survey Content
Survey materials included questions about difficulty filling vacancies by subject area, eliminating specific courses, increasing student-teacher ratios, future staffing needs, difficulty securing substitute teachers, hiring and retention barriers, and open-ended responses.
Distribution
School administrators received a link to a SurveyMonkey survey.
Assigning Rural vs. Urban Status
Using the NCES locale framework, we examined variations in rural and urban responses. The NCES locale framework includes four major types and subtypes under each major type. The major types include: city, rural, suburb, and town. Sub-categories are as follows:
• City & Suburb: Large, Mid-size, Small• Town & Rural: Distant, Fringe, Remote
City and suburb subtypes are based upon population, while rural subtypes are based on distance. Please reference Attachment A for definitions of each type and subtype.
Descriptive Statistics Reporting districts
130 districts out of 169 districts responded to the survey. Survey respondents included 28 charter schools authorized by PCSC and eight charter schools authorized through other districts.
Distribution of respondents
Respondent Title # of Respondents
Administrator 10 Assistant Superintendent 4 Director 15 HR Personnel 6 Superintendent 83
PLANNING, POLICY AND GOVERNMENTAL AFFAIRS DECEMBER 21, 2017
PPGA TAB 5 Page 51

Principal/Head of School 9 Other 3
Table 1. Number of respondents with each title.
Table 2. Number of districts that did not respond vs. number of districts that did respond, broken down by NCES locale type and subtype. Charters not authorized through PCSC were excluded.
Responding Districts
Unresponsive Districts
Distribution of Responsive & Unresponsive Districts by Urban-Centric Locale Type
Percentage of Responsive and Unresponsive Districts by Region
Table 3. Percentage of districts that did not respond vs. percentage of districts that did respond, broken down by region. Data does not include Idaho Department of Correction districts. Virtual region is comprised of virtual schools.
Responding Districts
Unresponsive Districts
Region
PLANNING, POLICY AND GOVERNMENTAL AFFAIRS DECEMBER 21, 2017
PPGA TAB 5 Page 52
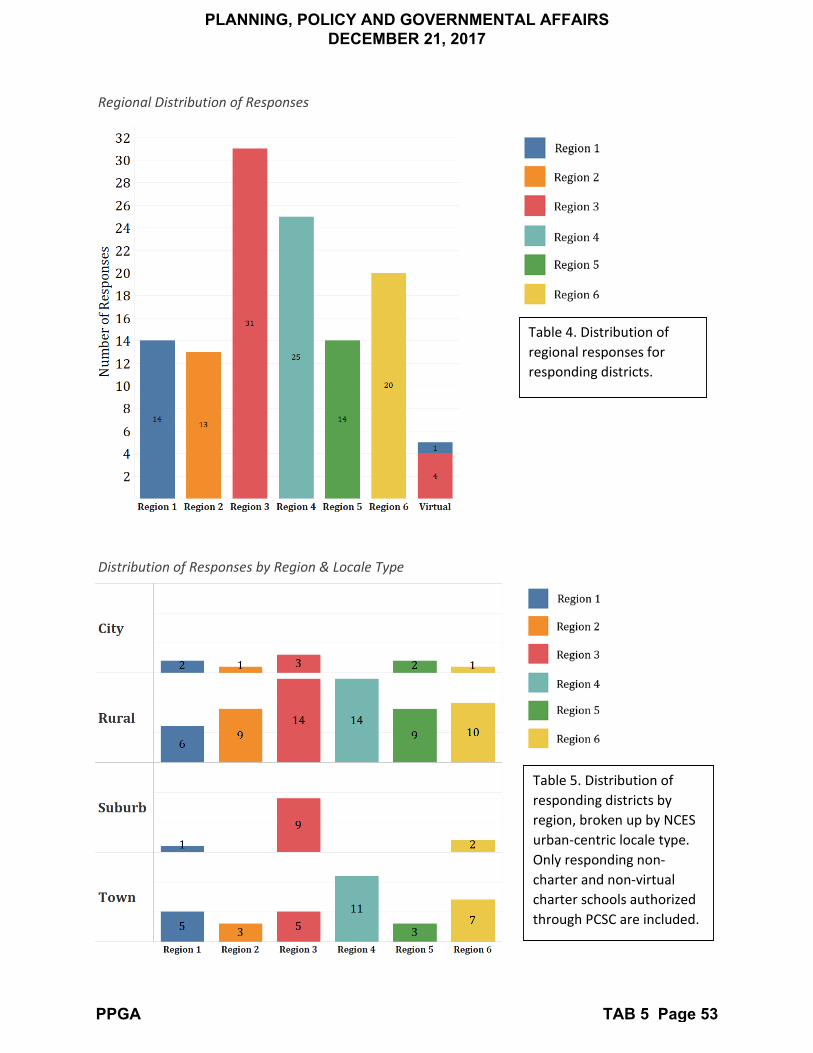
Table 5. Distribution of responding districts by region, broken up by NCES urban-centric locale type. Only responding non-charter and non-virtual charter schools authorized through PCSC are included.
Distribution of Responses by Region & Locale Type
Table 4. Distribution of regional responses for responding districts.
Regional Distribution of Responses
PLANNING, POLICY AND GOVERNMENTAL AFFAIRS DECEMBER 21, 2017
PPGA TAB 5 Page 53
Distribution of Urban-Centric Locale Type Responses
Survey Limitations Following presentation of preliminary data, several limitations of the survey emerged. Weaknesses include:
Absence of an “I don’t know” selection.
Without the presence of an “I don’t know” selection for some questions, some answers might have resulted from a lack of options rather than truly reflecting the opinion of the survey taker.
• Afflicted questions:o “How easy or difficult was it to fill vacancies for the 2016–17 and/or 2017–18
school years in each of the following fields?”o “Next, consider your staffing needs for the next five years. In general, how easy
or difficult do you think it will be for you to fill the teacher vacancies in yourdistrict with applicants in each of the following fields? For needs other thanthose listed below, please use the “Other” category and specify any otherstaffing needs you anticipate.” Answers included: “No need for this position in district/charter,” “Easy,”
“Somewhat Difficult,” “Very Difficult,” “Had to/anticipate having to hirenon-certificated staff (alternate route or provisional route),” and “Couldnot fill all vacancies”
o Without an “I don’t know” option, administrators thatwere unsure about the difficulty of filling positions mighthave devalued the “Easy” option.
PLANNING, POLICY AND GOVERNMENTAL AFFAIRS DECEMBER 21, 2017
PPGA TAB 5 Page 54

Results
Responses to “How easy or difficult was it to fill vacancies for the 2016–17 and/or 2017–18 school years in each of the following fields?”
Potential Answers
• No need for this position in district/charter• Easy• Somewhat difficult• Very difficult• Had to/anticipate having to hire non-certificated staff (alternate route or provisional
route)• Could not fill all vacancies
Figure 1. Number of times each answer appeared as a percentage of the entire region. Only non-charter and charter schools authorized through PCSC are included.
Distribution of Responses by Region for “How easy or difficult was it to fill vacancies for the 2016-2017 and/or 2017-18 school years in each of the following fields?”
y
Easy
Somewhat difficult
Very difficult
Had to/anticipate having to hire non-certified staff (alternate route or provisional route)
Could not fill all vacancies
PLANNING, POLICY AND GOVERNMENTAL AFFAIRS DECEMBER 21, 2017
PPGA TAB 5 Page 55
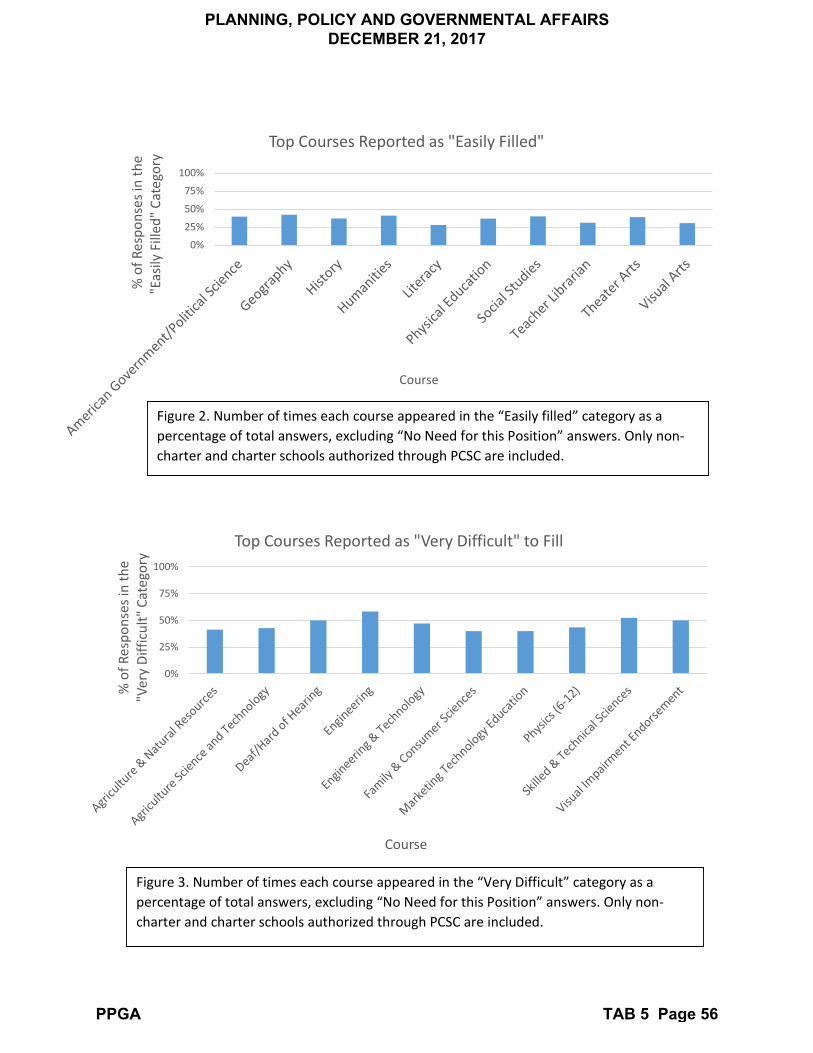
0%
25%
50%
75%
100%
% o
f Res
pons
es in
the
"Eas
ily F
illed
" Cat
egor
y
Course
Top Courses Reported as "Easily Filled"
Figure 2. Number of times each course appeared in the “Easily filled” category as a percentage of total answers, excluding “No Need for this Position” answers. Only non-charter and charter schools authorized through PCSC are included.
0%
25%
50%
75%
100%
% o
f Res
pons
es in
the
"Ver
y Di
fficu
lt" C
ateg
ory
Course
Top Courses Reported as "Very Difficult" to Fill
Figure 3. Number of times each course appeared in the “Very Difficult” category as a percentage of total answers, excluding “No Need for this Position” answers. Only non-charter and charter schools authorized through PCSC are included.
PLANNING, POLICY AND GOVERNMENTAL AFFAIRS DECEMBER 21, 2017
PPGA TAB 5 Page 56
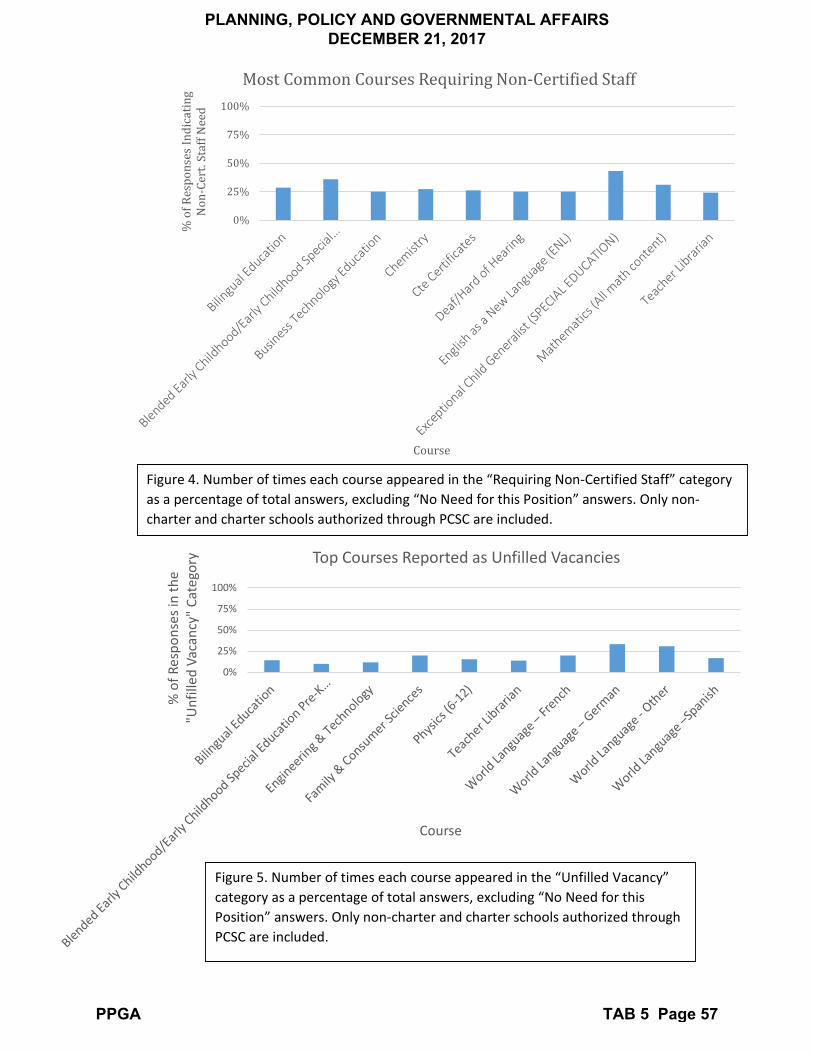
0%
25%
50%
75%
100%
% o
f Res
pons
es In
dica
ting
Non
-Cer
t. St
aff N
eed
Course
Most Common Courses Requiring Non-Certified Staff
Figure 4. Number of times each course appeared in the “Requiring Non-Certified Staff” category as a percentage of total answers, excluding “No Need for this Position” answers. Only non-charter and charter schools authorized through PCSC are included.
Figure 5. Number of times each course appeared in the “Unfilled Vacancy” category as a percentage of total answers, excluding “No Need for this Position” answers. Only non-charter and charter schools authorized through PCSC are included.
0%
25%
50%
75%
100%
% o
f Res
pons
es in
the
"Unf
illed
Vac
ancy
" Ca
tego
ry
Course
Top Courses Reported as Unfilled Vacancies
PLANNING, POLICY AND GOVERNMENTAL AFFAIRS DECEMBER 21, 2017
PPGA TAB 5 Page 57

Responses to, “Has your district increased student-teacher ratios due to lack of qualified teaching staff (but not due to changes in enrollment) for the 2016-17 or 2017-18 academic years?”
When excluding responses from charters not authorized through PCSC, 22.95% of all respondents indicated that they had increased student-teacher ratios due to a lack of qualified teaching staff.
Distribution of Responses by Region
Yes
No
Figure 6. Responses to “Has your district increased student-teacher ratios due to lack of qualified teaching staff (but not due to changes in enrollment) for the 2016-17 or 2017-18 academic years?” as a percentage of total regional answers. Only non-charters and charters authorized through PCSC are included.
Regional and Urban-Centric Locale Break-Down for Districts Reporting Increased Student-Teacher Ratios due to a Lack of Qualified Teaching Staff
Figure 7. Districts reporting increased student-teacher ratios as a percentage of each locale by region. Only non-charters and non-virtual charters authorized through PCSC are included.
PLANNING, POLICY AND GOVERNMENTAL AFFAIRS DECEMBER 21, 2017
PPGA TAB 5 Page 58
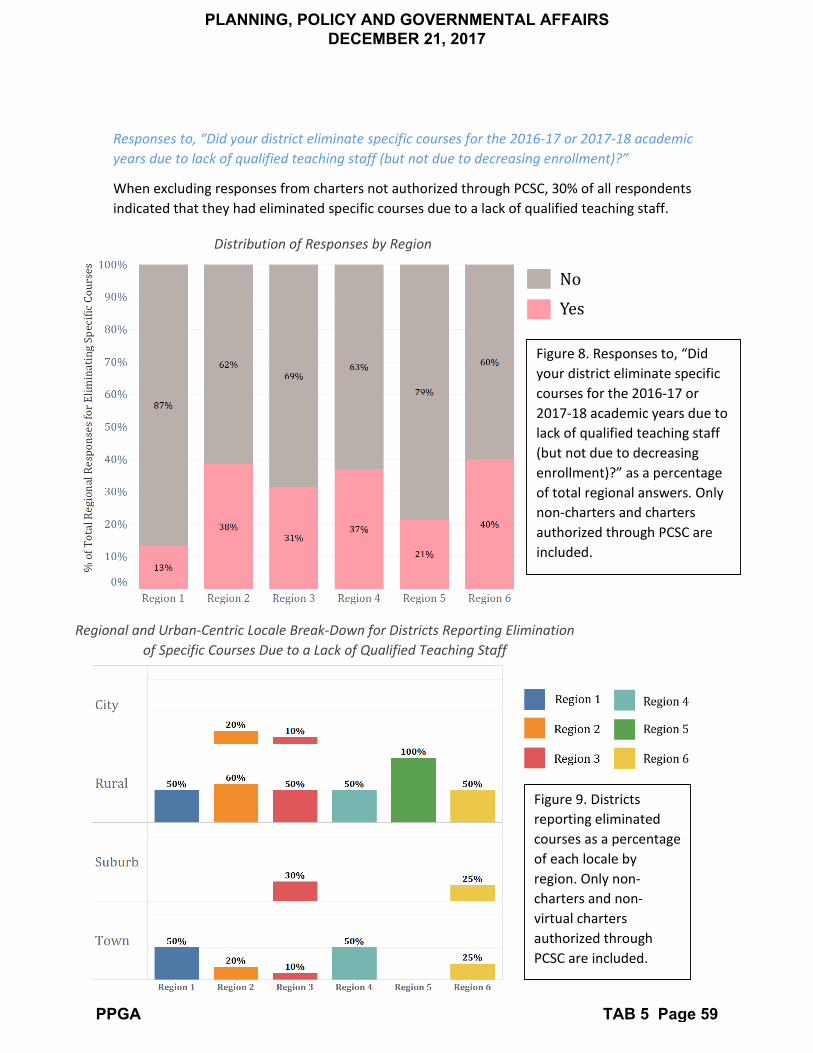
Responses to, “Did your district eliminate specific courses for the 2016-17 or 2017-18 academic years due to lack of qualified teaching staff (but not due to decreasing enrollment)?”
When excluding responses from charters not authorized through PCSC, 30% of all respondents indicated that they had eliminated specific courses due to a lack of qualified teaching staff.
Yes
No
Distribution of Responses by Region
Figure 8. Responses to, “Did your district eliminate specific courses for the 2016-17 or 2017-18 academic years due to lack of qualified teaching staff (but not due to decreasing enrollment)?” as a percentage of total regional answers. Only non-charters and charters authorized through PCSC are included.
Regional and Urban-Centric Locale Break-Down for Districts Reporting Elimination of Specific Courses Due to a Lack of Qualified Teaching Staff
Figure 9. Districts reporting eliminated courses as a percentage of each locale by region. Only non-charters and non-virtual charters authorized through PCSC are included.
PLANNING, POLICY AND GOVERNMENTAL AFFAIRS DECEMBER 21, 2017
PPGA TAB 5 Page 59
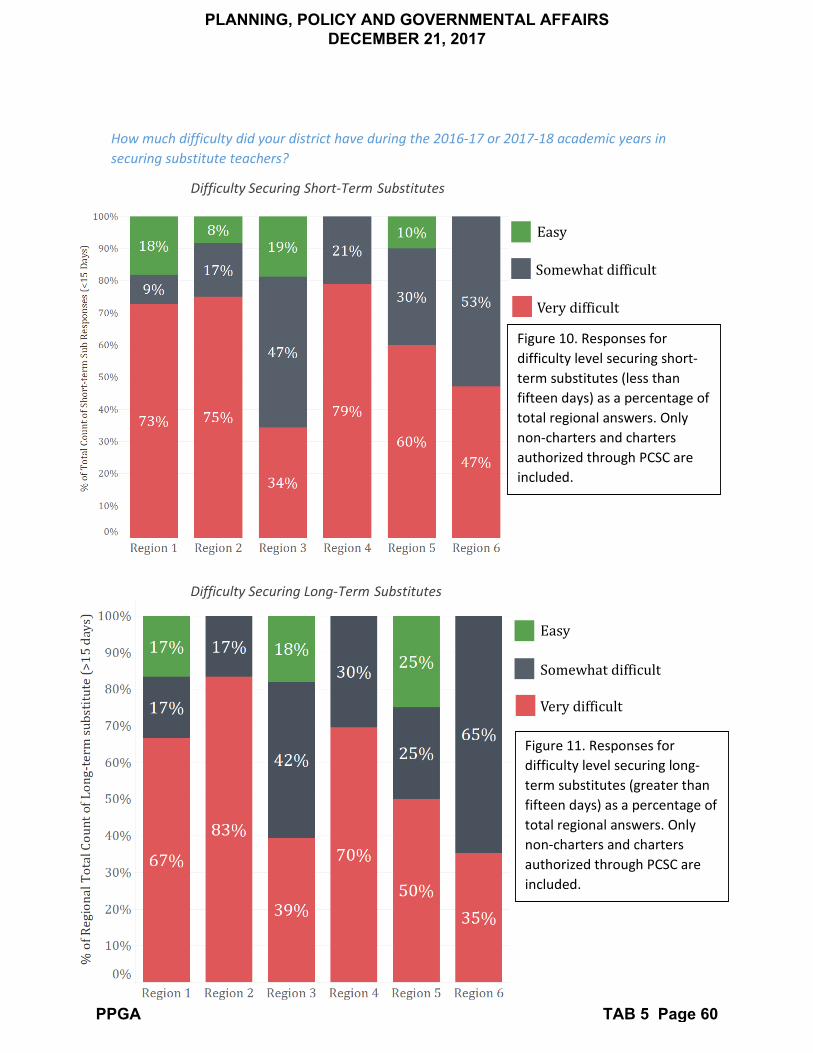
Difficulty Securing Short-Term Substitutes
Difficulty Securing Long-Term Substitutes
How much difficulty did your district have during the 2016-17 or 2017-18 academic years in securing substitute teachers?
Easy
Somewhat difficult
Very difficult
Easy
Somewhat difficult
Very difficult
Figure 10. Responses for difficulty level securing short-term substitutes (less than fifteen days) as a percentage of total regional answers. Only non-charters and charters authorized through PCSC are included.
Figure 11. Responses for difficulty level securing long-term substitutes (greater than fifteen days) as a percentage of total regional answers. Only non-charters and charters authorized through PCSC are included.
PLANNING, POLICY AND GOVERNMENTAL AFFAIRS DECEMBER 21, 2017
PPGA TAB 5 Page 60
Urban (Urbanized Areas, Urban Clusters) and Rural
The Census Bureau’s urban areas represent densely developed territory, and encompass residential, commercial, and other non-residential urban land uses. The boundaries of this urban footprint have been defined using measures based primarily on population counts and residential population density, but also through criteria that account for non-residential urban land uses, such as commercial, industrial, transportation, and open space that are part of the urban landscape. The Census Bureau delineates urban areas after each decennial census. Since the 1950 Census, the Census Bureau has reviewed and revised the urban criteria, as necessary, for each decennial census. These changes are discussed in Section 6.0 of the Locale Boundaries User’s Manual.
Urban area boundaries are constructed from qualifying census tracts and census blocks. To qualify as an urban area, the territory must encompass at least 2,500 people, at least 1,500 of which reside outside institutional group quarters. Urban areas that contain 50,000 or more people are designated as Urbanized Areas (UAs); urban areas that contain at least 2,500 and less than 50,000 people are designated as Urban Clusters (UCs). The term “urban area” refers to both UAs and UCs. The term “rural” encompasses all population, housing, and territory not included within an urban area.
Attachment 4. NCES Urban-Centric Locale Definitions and District Examples
Principal City
Principal Cities are incorporated places with a large population of residents and workers located within a Core Based Statistical Area (CBSA). More specifically, the Principal City (or Cities) of a CBSA include:
(a) the largest incorporated place with a population of at least 10,000 in the CBSA or, if no incorporatedplace with at least 10,000 population is present in the CBSA, the largest incorporated place or Censusdesignated place (CDP) in the CBSA;
(b) any additional incorporated place or CDP with a population of at least 250,000 or in which 100,000 ormore persons work;
(c) any additional incorporated place or CDP with a population of at least 50,000, but less than 250,000, andin which the number of workers working in the place meets or exceeds the number of workers living in theplace;
(d) any additional incorporated place or CDP with a population of at least 10,000, but less than 50,000, andat least one-third the population size of the largest place, and in which the number of workers working inthe place meets or exceeds the number of workers living in the place.
All definitions and data come from the Locale Boundaries User’s Manual or other NCES sources
PLANNING, POLICY AND GOVERNMENTAL AFFAIRS DECEMBER 21, 2017
PPGA TAB 5 Page 61

NCES Locale Classifications and Criteria
The NCES locale framework is composed of four basic types (City, Suburban, Town, and Rural) that each contains three subtypes. It relies on standard urban and rural definitions developed by the U.S. Census Bureau, and each type of locale is either urban or rural in its entirety. The NCES locales can be fully collapsed into a basic urban–rural dichotomy, or expanded into a more detailed collection of 12 distinct categories. These subtypes are differentiated by size (in the case of City and Suburban assignments) and proximity (in the case of Town and Rural assignments).
City – Large (11): Territory inside an Urbanized Area and inside a Principal City with population of 250,000 or more.
City – Midsize (12): Territory inside an Urbanized Area and inside a Principal City with population less than 250,000 and greater than or equal to 100,000.
City – Small (13): Territory inside an Urbanized Area and inside a Principal City with population less than 100,000.
Suburban – Large (21): Territory outside a Principal City and inside an Urbanized Area with population of 250,000 or more.
Suburban – Midsize (22): Territory outside a Principal City and inside an Urbanized Area with population less than 250,000 and greater than or equal to 100,000.
Suburban – Small (23): Territory outside a Principal City and inside an Urbanized Area with population less than 100,000.
Town – Fringe (31): Territory inside an Urban Cluster that is less than or equal to 10 miles from an Urbanized Area.
Town – Distant (32): Territory inside an Urban Cluster that is more than 10 miles and less than or equal to 35 miles from an Urbanized Area.
Town – Remote (33): Territory inside an Urban Cluster that is more than 35 miles from an Urbanized Area.
Rural – Fringe (41): Census-defined rural territory that is less than or equal to 5 miles from an Urbanized Area, as well as rural territory that is less than or equal to 2.5 miles from an Urban Cluster.
Rural – Distant (42): Census-defined rural territory that is more than 5 miles but less than or equal to 25 miles from an Urbanized Area, as well as rural territory that is more than 2.5 miles but less than or equal to 10 miles from an Urban Cluster.
Rural – Remote (43): Census-defined rural territory that is more than 25 miles from an Urbanized Area and also more than 10 miles from an Urban Cluster.
PLANNING, POLICY AND GOVERNMENTAL AFFAIRS DECEMBER 21, 2017
PPGA TAB 5 Page 62
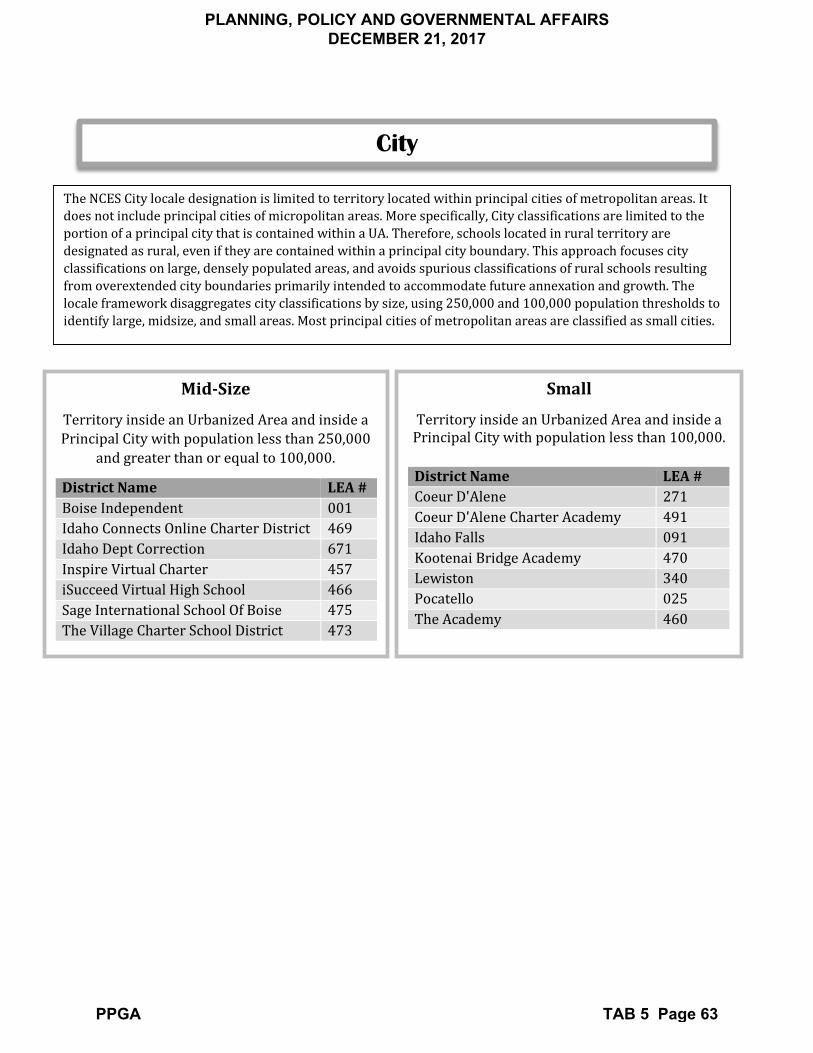
Mid-Size
Territory inside an Urbanized Area and inside a Principal City with population less than 250,000
and greater than or equal to 100,000.
District Name LEA # Boise Independent 001 Idaho Connects Online Charter District 469 Idaho Dept Correction 671 Inspire Virtual Charter 457 iSucceed Virtual High School 466 Sage International School Of Boise 475 The Village Charter School District 473
Small
Territory inside an Urbanized Area and inside a Principal City with population less than 100,000.
District Name LEA # Coeur D'Alene 271 Coeur D'Alene Charter Academy 491 Idaho Falls 091 Kootenai Bridge Academy 470 Lewiston 340 Pocatello 025 The Academy 460
City
The NCES City locale designation is limited to territory located within principal cities of metropolitan areas. It does not include principal cities of micropolitan areas. More specifically, City classifications are limited to the portion of a principal city that is contained within a UA. Therefore, schools located in rural territory are designated as rural, even if they are contained within a principal city boundary. This approach focuses city classifications on large, densely populated areas, and avoids spurious classifications of rural schools resulting from overextended city boundaries primarily intended to accommodate future annexation and growth. The locale framework disaggregates city classifications by size, using 250,000 and 100,000 population thresholds to identify large, midsize, and small areas. Most principal cities of metropolitan areas are classified as small cities.
PLANNING, POLICY AND GOVERNMENTAL AFFAIRS DECEMBER 21, 2017
PPGA TAB 5 Page 63

Remote Census-defined rural territory that is more than 25 miles
from an Urbanized Area and also more than 10 miles from an Urban Cluster.
District Name LEA # Avery 394 Bear Lake 033 Bliss 234 Bruneau-Grand View Joint School District 365 Butte County 111 Camas County 121 Cambridge Joint District 432 Cascade District 422 Challis 181 Clark County 161 Cottonwood 242 Council District 013 Dietrich 314 Garden Valley District 071 Glenns Ferry 192 Kamiah 304 Mackay 182 Mccall-Donnelly Jt. School District 421 Meadows Valley District 011 Midvale District 433 Murtaugh 418 Nezperce 302 North Gem 149 Oneida 351 Pleasant Valley Elem Dist 364 Potlatch 285 Prairie Elem. District 191 Richfield 316 Rockland 382 Salmon River 243 Shoshone 312 South Lemhi 292 Swan Valley 092 Teton County 401 Three Creek 416 Valley 262 West Jefferson 253 Whitepine 288
Rural
The NCES rural locale assignments rely on the Census Bureau’s designation of non-urban territory as rural. This category accounts for the overwhelming majority of U.S. land area, and it includes a considerable range of settlement patterns and land uses. Some rural areas where school-age children live are extremely remote and difficult to access, while rural areas just outside large urban cores may have relatively easy access to a broad range of specialized goods and services typically associated with suburban and city schools. Metropolitan areas can contain both urban and rural territory. Because counties serve as the building blocks of metropolitan areas, and the extent of some metropolitan counties is quite large, some rural portions of metropolitan areas may be farther from urban cores than rural territory outside metropolitan areas. Therefore, the traditional metropolitan-based urban-suburban-rural framework poses difficulties for rural classifications as well.
The NCES rural locale provides fringe, distant, and remote subtypes that differentiate rural locations based on the distance and size of the nearest urban area. Distance thresholds applied for UCs (2.5 miles and 10 miles) are shorter than the distances used for UAs (5 miles and 25 miles) to reflect potential differences in the functional relationship between rural and urban areas. These criteria assume that families served by a rural school located 10 miles from a town of 10,000 are likely to have different options than families served by a rural school located 10 miles from an urban core with a population of 110,000. Therefore the rural locale criteria take into consideration not only distance, but also distance from which type of urban core.
The basic unit for these distance indicators (2.5 miles) was borrowed from the Census Bureau’s criterion for connecting densely settled noncontiguous territory to a qualifying core of an urbanized area (UA) or a UC during the urban delineation process, officially referred to as a “jump.” Distances used to define locale subtypes are simple multiples of the basic distance unit (i.e., 1x, 2x, 4x, and 10x for Rural; 4x and 14x for Towns).
PLANNING, POLICY AND GOVERNMENTAL AFFAIRS DECEMBER 21, 2017
PPGA TAB 5 Page 64

Fringe
Census-defined rural territory that is less than or equal to 5 miles from an Urbanized Area, as well as rural
territory that is less than or equal to 2.5 miles from an Urban Cluster.
District Name LEA # American Heritage Charter 482 Buhl Joint 412 Chief Tahgee 483 Fremont County 215 Gooding 231 Idaho Dept Juvenile Correction 709 Jefferson County 251 Kellogg 391 Ktec - Kootenai Tech Ed Campus 641 Liberty Charter 458 North Idaho Stem Charter Academy 480 North Star Charter 493 Notus District 135 Snake River 052 Taylors Crossing Chrt 461 Victory Charter School 451 Wendell 232 Xavier Charter 462
Rural
Distant Census-defined rural territory that is more than 5
miles but less than or equal to 25 miles from an Urbanized Area, as well as rural territory that is more than 2.5 miles but less than or equal to 10 miles from
an Urban Cluster.
District Name LEA # Aberdeen 058 Arbon Elem 383 Basin School District 072 Canyon-Owyhee School Service Agency (Cossa)
555
Castleford 417 Culdesac 342 Firth 059 Genesee 282 Grace 148 Hagerman 233 Hansen 415 Highland 305 Horseshoe Bend School District 073 Kendrick 283 Kootenai 274 Lapwai 341 Marsh Valley 021 Marsing Joint District 363 Melba Joint District 136 Mullan 392 New Plymouth District 372 Parma District 137 Plummer-Worley 044 Ririe 252 Troy 287 West Bonner 083 West Side 202 Wilder District 133
PLANNING, POLICY AND GOVERNMENTAL AFFAIRS DECEMBER 21, 2017
PPGA TAB 5 Page 65
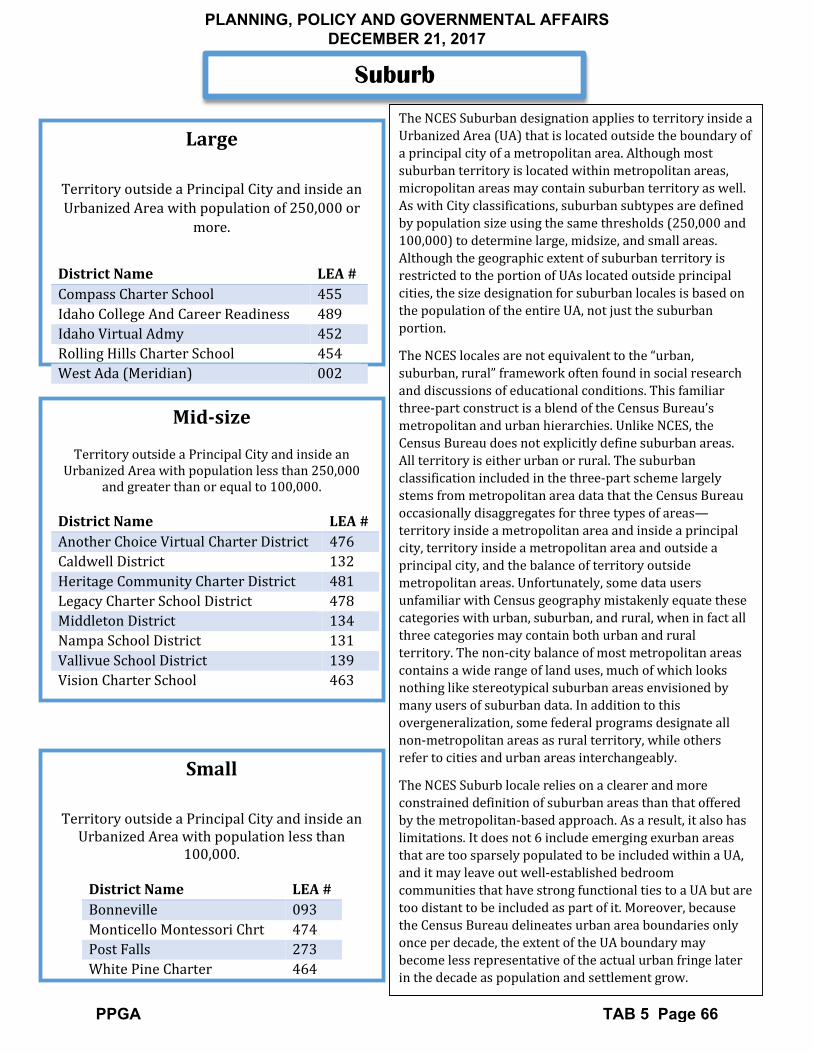
Mid-size
Territory outside a Principal City and inside an Urbanized Area with population less than 250,000
and greater than or equal to 100,000.
District Name LEA # Another Choice Virtual Charter District 476 Caldwell District 132 Heritage Community Charter District 481 Legacy Charter School District 478 Middleton District 134 Nampa School District 131 Vallivue School District 139 Vision Charter School 463
Large
Territory outside a Principal City and inside an Urbanized Area with population of 250,000 or
more.
District Name LEA # Compass Charter School 455 Idaho College And Career Readiness 489 Idaho Virtual Admy 452 Rolling Hills Charter School 454 West Ada (Meridian) 002
Small
Territory outside a Principal City and inside an Urbanized Area with population less than
100,000.
District Name LEA # Bonneville 093 Monticello Montessori Chrt 474 Post Falls 273 White Pine Charter 464
Suburb
The NCES Suburban designation applies to territory inside a Urbanized Area (UA) that is located outside the boundary of a principal city of a metropolitan area. Although most suburban territory is located within metropolitan areas, micropolitan areas may contain suburban territory as well. As with City classifications, suburban subtypes are defined by population size using the same thresholds (250,000 and 100,000) to determine large, midsize, and small areas. Although the geographic extent of suburban territory is restricted to the portion of UAs located outside principal cities, the size designation for suburban locales is based on the population of the entire UA, not just the suburban portion.
The NCES locales are not equivalent to the “urban, suburban, rural” framework often found in social research and discussions of educational conditions. This familiar three-part construct is a blend of the Census Bureau’s metropolitan and urban hierarchies. Unlike NCES, the Census Bureau does not explicitly define suburban areas. All territory is either urban or rural. The suburban classification included in the three-part scheme largely stems from metropolitan area data that the Census Bureau occasionally disaggregates for three types of areas—territory inside a metropolitan area and inside a principal city, territory inside a metropolitan area and outside a principal city, and the balance of territory outside metropolitan areas. Unfortunately, some data users unfamiliar with Census geography mistakenly equate these categories with urban, suburban, and rural, when in fact all three categories may contain both urban and rural territory. The non-city balance of most metropolitan areas contains a wide range of land uses, much of which looks nothing like stereotypical suburban areas envisioned by many users of suburban data. In addition to this overgeneralization, some federal programs designate all non-metropolitan areas as rural territory, while others refer to cities and urban areas interchangeably.
The NCES Suburb locale relies on a clearer and more constrained definition of suburban areas than that offered by the metropolitan-based approach. As a result, it also has limitations. It does not 6 include emerging exurban areas that are too sparsely populated to be included within a UA, and it may leave out well-established bedroom communities that have strong functional ties to a UA but are too distant to be included as part of it. Moreover, because the Census Bureau delineates urban area boundaries only once per decade, the extent of the UA boundary may become less representative of the actual urban fringe later in the decade as population and settlement grow.
PLANNING, POLICY AND GOVERNMENTAL AFFAIRS DECEMBER 21, 2017
PPGA TAB 5 Page 66

Distant
Territory inside an Urban Cluster that is more than 10 miles and less than or equal to 35 miles from an
Urbanized Area.
District Name LEA # American Falls 381 Blackfoot 055 Blackfoot Chrt Comm Lrng Cntr 477 Emmett Independent Dist 221 Fruitland District 373 Homedale Joint District 370 Idaho Science & Tech Chrt 468 Idaho Stem Academy Dba Bingham Academy Charter Dis
485
Lake Pend Oreille 084 Madison 321 Moscow 281 Mountain Home District 193 Orofino 171 Palouse Prairie Charter 472 Payette Joint District 371 Preston 201 Richard Mckenna Charter High School
453
St Maries 041 Sugar-Salem 322
The NCES locale framework classifies all Urban Clusters (UCs) as towns. As with the city classification, town locale assignments are based on the extent of the UC boundary rather than the extent of a place boundary (though a UC and place may share the same name). Therefore, schools in rural portions of an incorporated place or CDP are considered rural, while schools located inside a UC are identified as town—regardless of whether the area is contained within an incorporated place or CDP.
Unlike city and suburban subclassifications that are based on population size, town subtypes are identified based on the town’s proximity to a UA. UCs located within 10 miles of a UA are identified as fringe, while those more than 10 miles but less than 35 miles away are designated as distant. UCs located more than 35 miles away from a UA are categorized as remote. All proximity thresholds for town and rural classifications are based on geodesic distance between the vertices of the UC and UA polygon boundaries.
Towns are commonly located near UAs, often radiating along major roadways that provide easy access to the larger population core. Although they range in size (from 2,500 to 49,999), most Towns have a population less than 10,000.
NCES town assignments differ considerably from the REAP town locale criteria. Likewise, NCES’s use of UCs for town assignments is not the same as that used by the Federal Communication Commission’s E-rate program. Although E-rate makes use of Census urban/rural definitions to determine discounts, the program reclassifies UCs with a population less than 25,000 as rural territory.
Town
PLANNING, POLICY AND GOVERNMENTAL AFFAIRS DECEMBER 21, 2017
PPGA TAB 5 Page 67
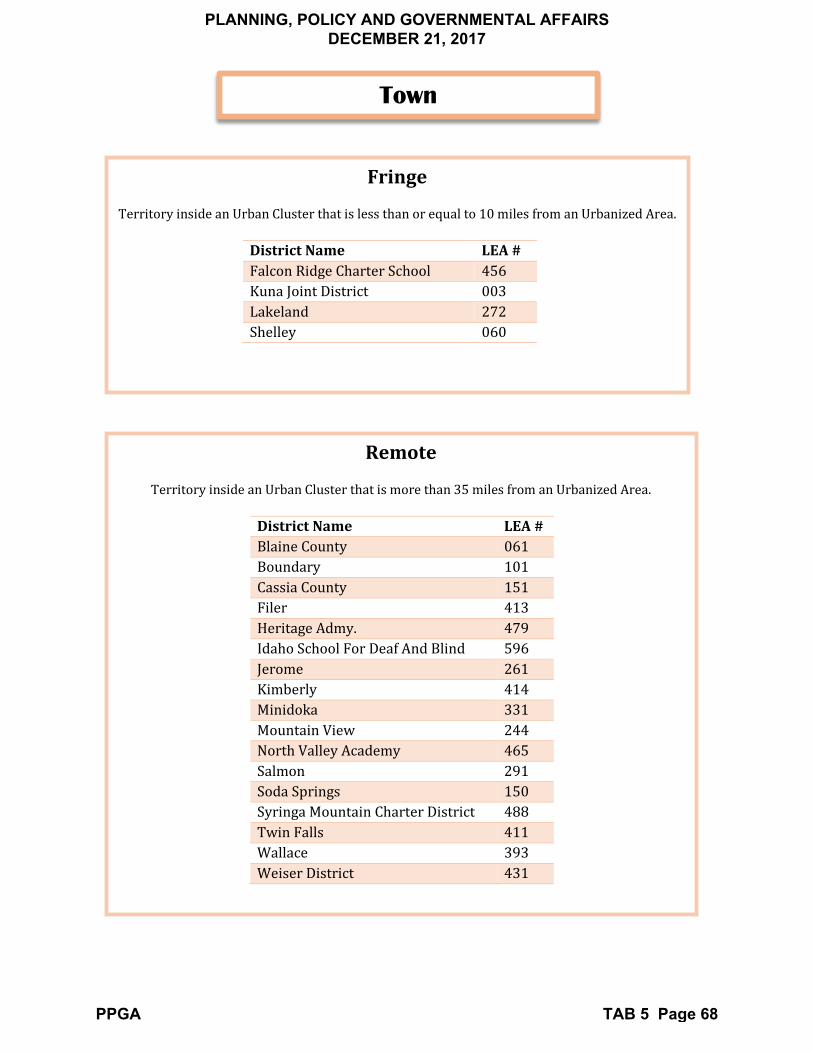
Fringe
Territory inside an Urban Cluster that is less than or equal to 10 miles from an Urbanized Area.
District Name LEA # Falcon Ridge Charter School 456 Kuna Joint District 003 Lakeland 272 Shelley 060
Remote
Territory inside an Urban Cluster that is more than 35 miles from an Urbanized Area.
District Name LEA # Blaine County 061 Boundary 101 Cassia County 151 Filer 413 Heritage Admy. 479 Idaho School For Deaf And Blind 596 Jerome 261 Kimberly 414 Minidoka 331 Mountain View 244 North Valley Academy 465 Salmon 291 Soda Springs 150 Syringa Mountain Charter District 488 Twin Falls 411 Wallace 393 Weiser District 431
Town
PLANNING, POLICY AND GOVERNMENTAL AFFAIRS DECEMBER 21, 2017
PPGA TAB 5 Page 68


![IDAHO SS.4.2015.HO.Antibacterials [Read-Only]...4/6/2015 1 ANTIBACTERIALS: Recent Releases & Pipeline Promises Idaho Society of Health-Systems Pharmacists Gerry Barber, RPh, MPH Department](https://static.fdocuments.in/doc/165x107/60da12c3f84d567ab30ba054/idaho-ss42015hoantibacterials-read-only-462015-1-antibacterials-recent.jpg)