
IDAHO DEPARTMENT OF FISH GAME · LIST OF TABLES (Continued) Page Table 5. Estimated initial oxygen...
133
IDAHO DEPARTMENT OF FISH & GAME Jerry M. Conley, Director Federal Aid to Fish and Wildlife Restoration Job Performance Report Project F-73-R-4 Subproject III: Lake and Reservoir Investigations Study V: Cascade Reservoir Fisheries Investigations Period Covered: 1 March 1981-28 February 1982 by Bruce Reininger Fishery Research Biologist Bruce Rieman Principal Fishery Research Biologist and Ned Horner Regional Fishery Biologist January 1983
-
Upload
nguyennhan -
Category
Documents
-
view
213 -
download
0
Transcript of IDAHO DEPARTMENT OF FISH GAME · LIST OF TABLES (Continued) Page Table 5. Estimated initial oxygen...

IDAHODEPARTMENT OF FISH & GAME
Jerry M. Conley, Director
Federal Aid to Fish and Wildlife Restoration
Job Performance Report
Project F-73-R-4
Subproject III: Lake and Reservoir Investigations
Study V: Cascade Reservoir Fisheries Investigations
Period Covered: 1 March 1981-28 February 1982
by
Bruce Reininger Fishery Research BiologistBruce Rieman
Principal Fishery Research Biologistand
Ned HornerRegional Fishery Biologist
January 1983

TABLE OF CONTENTS
Page
ABSTRACT ..............................................................................................................1
RECOMMENDATIONS ........................................................................................... 2
Water Level Management .............................................................................. 2Fishery Management ......................................................................................4
Rainbow Trout .......................................................................................4Coho Salmon ........................................................................................ 5Fall Chinook ..........................................................................................5Perch .....................................................................................................5
Tributary Management ................................................................................... 6
INTRODUCTION ..................................................................................................... 6Background .................................................................................................... 6Description of Study Area and Its Fishery.......................................................7
OBJECTIVES .......................................................................................................... 7
TECHNIQUES USED .............................................................................................11Minimum Conservation Pool Determination.................................................. 11
Dissolved Oxygen Measurement ........................................................ 11Oxygen Deficits ................................................................................... 11Development of the Model .................................................................. 13Parameter Estimates ...........................................................................14
Water Column Consumption ......................................................14Tributary Oxygen Inflow .............................................................15Oxygen Outflow ......................................................................... 15Sediment Oxygen Demand ...................................................... 15
Salmonid Stocking Program Evaluation ....................................................... 16Fish Marking ........................................................................................16Fish Recapture ....................................................................................16
Total Harvest Estimate ................................................................................. 16Creel Census ...................................................................................... 16
FINDINGS ..............................................................................................................19Limnological Description of the Reservoir..................................................... 19Oxygen Content of the Reservoir ................................................................. 22Parameter Estimates for the Model .............................................................. 22
Water Column Demand .......................................................................26Inflow ...................................................................................................26Outflow ................................................................................................ 26
i

TABLE OF CONTENTS (Continued)
Page
Sediment Oxygen Demand 33..................................................................
Model Output 33.................................................................................................Winter Severity 33...............................................................................................Winterkill Risk and Pool Elevation 38.................................................................
Salmonid Stocking Program 38..........................................................................Creel Census and Netting 38....................................................................Release Location 38................................................................................
Size at Release 38....................................................................................Spring Versus Fall Release 45...........................................................................
Total Harvest Estimate 45..................................................................................
DISCUSSION 49..........................................................................................................
Oxygen Content of the Reservoir 49..................................................................Development of the Model 50.............................................................................Winterkill Risk 52................................................................................................Summerkill Risk 52..............................................................................................Cascade Reservoir Fishery 53...........................................................................
ACKNOWLEDGEMENTS 54.......................................................................................
LITERATURE CITED .................. 55...........................................................................
LIST OF TABLES
Table 1. Important physical and morphometric dataof Cascade Reservoir and Dam,Cascade, Idaho 9....................................................................................
Table 2. Releases of hatchery rainbow trout, browntrout, coho salmon, and kokanee salmon intoCascade Reservoir, Idaho,from 1968-1981 10.................................................................................
Table 3. Marked rainbow trout and coho salmonreleased into Cascade Reservoir,Idaho, 1980 17........................................................................................
Table 4. Marked rainbow trout and coho salmonreleased into Cascade Reservoir,Idaho, 1981 18........................................................................................
ii

LIST OF TABLES (Continued)
Page
Table 5. Estimated initial oxygen content (g/m2) following icecover for Cascade Reservoir,Idaho ..................................................................................................27
Table 6. Oxygen demand of three points in the water column (mg/l/day) estimated by BOD samplesfor Cascade Reservoir in 1981 and 1982 .......................................... 29
Table 7. Estimated water column oxygen demandduring ice cover on Cascade Reservoir,Idaho ..................................................................................................30
Table 8. Estimated meanaoxygen input due to tributaryinflow on Cascade Reservoir,Idaho ..................................................................................................31
Table 9. Estimated meana oxygen outflow for thefirst 30 days and after 30 days ofwinter stagnation on Cascade Reservoir,Idaho ..................................................................................................32
Table 10. Estimated time (days) to reach anoxia andoxygen limiting conditions for salmonidsduring winter stagnation in CascadeReservoir, Idaho ................................................................................ 34
Table 11. Estimated oxygen content (g/m2) resulting in limitingconditions for salmonids inCascade Reservoir, Idaho ................................................................. 35
Table 12. The percentage of various fish species caught byanglers in Cascade Reservoir,Idaho, May 1980 to November 1981 ................................................. 40
Table 13. The percentage of various fish species caught in gilland fyke nets in Cascade Reservoir, Idaho, inJune, August, andOctober 1980, and January and August 1981 ...................................41
Table 14. The number of fluorescent grit-markedcoho salmon (released in 1980) observedin angler creels and gill nets fromCascade Reservoir, June 1980 to April 1982 .................................... 42
iii

LIST OF TABLES (Continued)
Page
Table 15. The number of fluorescent grit-marked cohosalmon (released in 1981) observed inangler creels and gill nets from CascadeReservoir, Idaho, June 1981 to April 1982 43..........................................
Table 16. The number of various types of rainbow trout (released in1980 and 1981) observed in angler creels and gill netsfrom Cascade Reservoir, Idaho, May 1980 to April1982. (RV-spring release; LV-fall release; no dorsal-catchables released in prior years; bent ray-catchables or fingerlings released in prior years; gooddorsal-native orfingerling release origin) 44.....................................................................
Table 17. Catch and catch rate (fish/hour) of fin-clippedcatchable rainbow trout released in April and Mayand September during1980 and 1981 in Cascade Reservoir 47................................................
Table 18. Total estimated catch and percentage ofrainbow trout, coho salmon, and yellowperch caught by anglers in CascadeReservoir, December through April 1982 48...........................................
LIST OF FIGURES
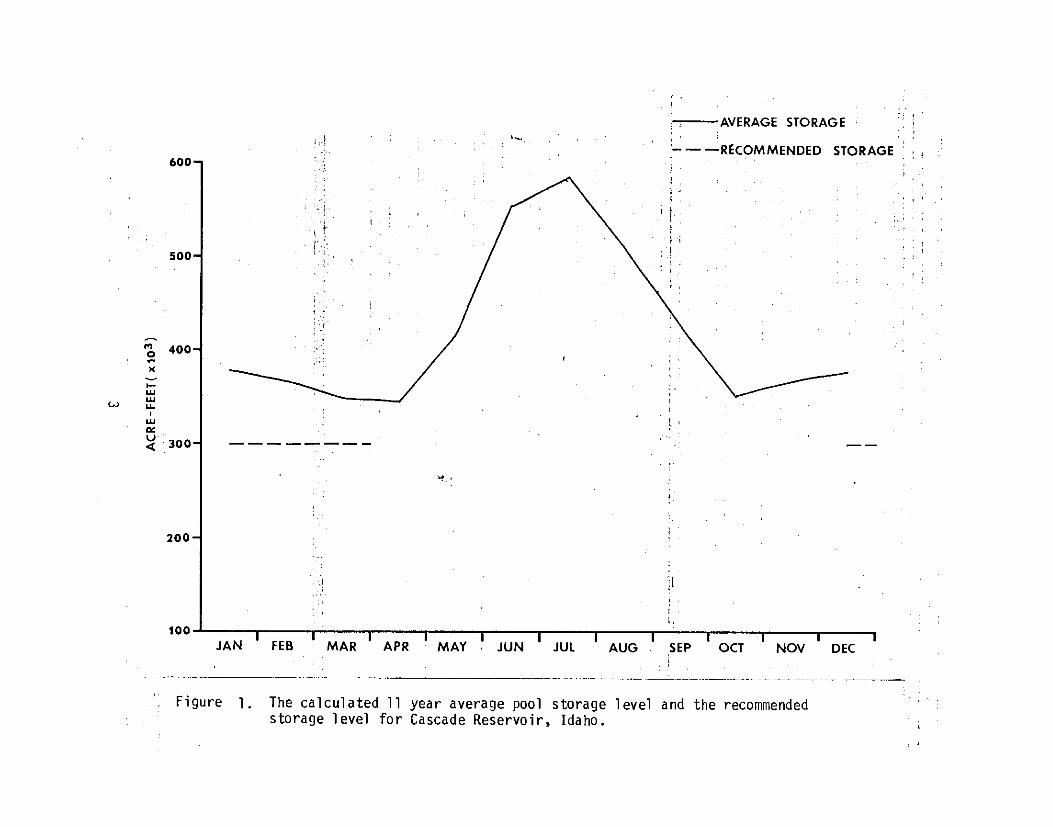
Figure 1. The calculated 11 year average pool storagelevel and the recommendedstorage level for Cascade Reservoir, Idaho 3.........................................
Figure 2. Cascade Reservoir, Idaho 8..........................................................................Figure 3. The location of 16 dissolved oxygen and
temperature sampling stations (A-H),creel census and gill netting Areas I,II, and III in Cascade Reservoir, Idaho 12................................................
Figure 4. Seasonal cycle of mean dissolved oxygen(mg/1) at Cascade Reservoir, March 1980through March 1982. Blackened areasindicate period of ice cover 20................................................................
Figure 5. Seasonal cycle of mean water temperatures( C) at Cascade Reservoir, May 1980 throughMarch 1982. Blackened areas indicate periodof ice cover 21.........................................................................................
iv
LIST OF FIGURES (Continued)
Page
Figure 6. Mean monthly Secchi disc measurementsfrom Cascade Reservoir, May throughNovember 1980 and April throughNovember 1981 ................................................................................ 23
Figure 7. Oxygen content of the hypolimnionduring 1980 and 1981 in CascadeReservoir. The length of each lineindicates those points included inthe regression ................................................................................... 24
Figure 8. Oxygen content of Cascade Reservoir duringwinter ice cover (g/m2 ) and snow depth (cm) in 1981 and 1982. The length of theregression line indicates those pointsincluded inthe regression ................................................................................... 25
Figure 9. Estimated water column demand (mg/1)in the top strata, mid-strata, andnear bottom in Cascade Reservoir,April 1981 to April 1982 .....................................................................28
Figure 10. Reservoir snow depth (cm) versus theBOR snow gauge readings (cm) during1982. Arrow indicates outlying pointeliminated from regression ................................................................36
Figure 11. Winter severity index (frequency of 30 cm ormore of snow for acontinuous period of time) for CascadeReservoir (line fitted by inspection). (Datafrom Climatological Data-Idaho NationalOceanic and Atmospheric Administration,National Climatic Center, Ashville,N. C.) .................................................................................................37
Figure 12. The probability of reaching limiting and anoxicconditions (upper figure) and the time requiredto reach oxygen limitation (lower figure) for agivenpool elevation on Cascade Reservoir................................................ 39
v
LIST OF FIGURES (Continued)
Page
Figure 13. The appearance of dorsal fins on rainbow troutclassified as "no dorsal," "bentray," or "good dorsal" .........................................................................46
LIST OF APPENDIX
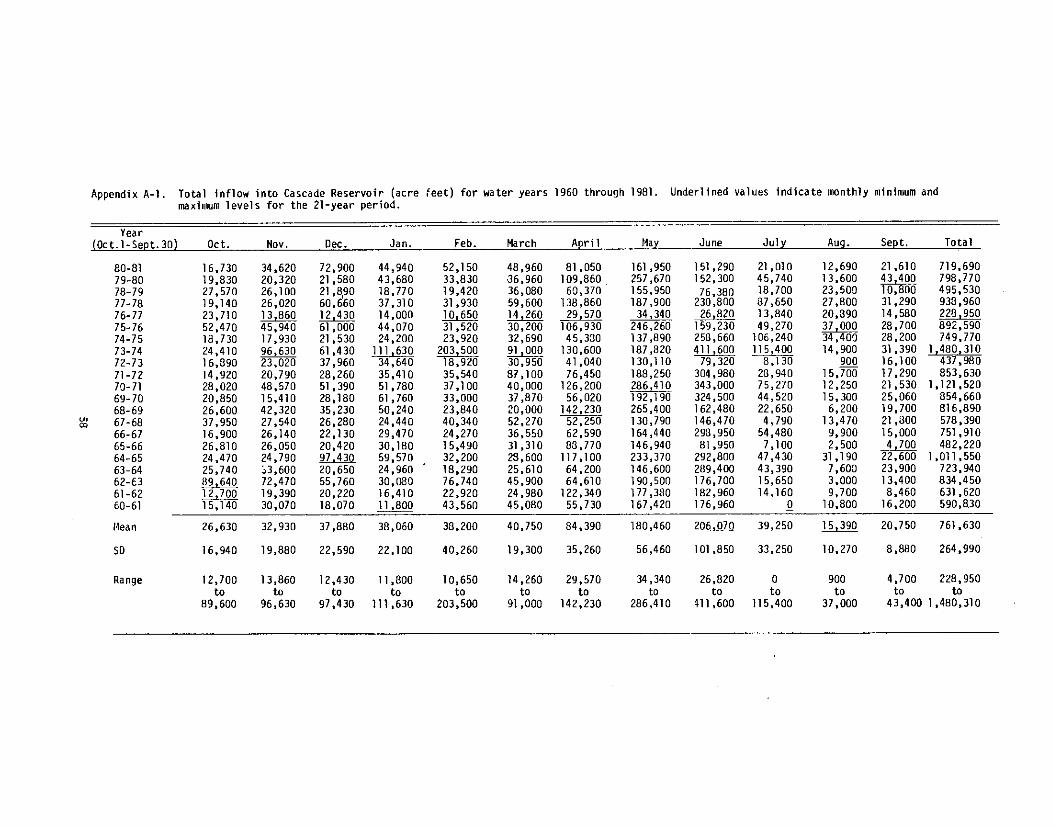
Appendix A-1. Total inflow into Cascade Reservoir (acrefeet) for water years 1960 through 1981.Underlined values indicate monthly minimumand maximumlevels for the 21-year period ....................................................58
Appendix A-2. Morphometric characteristic ofCascade Reservoir, Idaho .......................................................59
Appendix A-3. The average, maximum, and minimummonthly water storage levels (acrefeet) in Cascade Reservoir, Idaho,for water years 1972 through 1982 ......................................... 60
Appendix B-1. Catch rates (fish/hour), estimated angleruse (numbers of fishermen), estimatedangler hours, and total estimated catch ofrainbow trout and coho salmon taken byanglers from Area I and Area III of CascadeReservoir, Idaho, from December 1981to April 1982 ............................................................................ 62
Appendix B-2. Catch rates (fish/hour), estimated. angler use (numbers of fishermen),
estimated angler hours, and totalestimated catch of yellow perch,squawfish, and sucker taken by anglersfrom Area I and Area III of CascadeReservoir, Idaho, fromDecember 1981 to April 1982 ................................................. 63
Appendix C-1. Location descriptions for creel censusAreas I, II, and III on CascadeReservoir, Idaho, andthe description of various marked andunmarked groups of rainbow trout andcoho salmon released into CascadeReservoir during1980 and 1981. These descriptionsapply to all tables in Appendix C ............................................. 64
vi
LIST OF APPENDIX (Continued)
Page
Appendix C-2. The catch, catch rate (fish/hr) andpercentage of various fish species caughtby boat and bank anglers in CascadeReservoir and spillway,Cascade, Idaho, May, 1980......................................................65
Appendix C-3. The catch, catch rate (fish/hr) andpercentage of various fish species caughtby boat and bank anglers in CascadeReservoir and spillway,Cascade, Idaho, June 1980......................................................67
Appendix C-4. The catch, catch rate (fish/hr) and percentage ofvarious species caught by boat and bankanglers in Cascade Reservoir and spillway,Cascade,Idaho, July 1980 ...................................................................... 69
Appendix C-5. The catch, catch rate (fish/hr) and percentage ofvarious species caught by boat and bankanglers in Cascade Reservoir and spillway,Cascade,Idaho, August 1980 ................................................................. 71
Appendix C-6. The catch, catch rate (fish/hr) and percentage ofvarious species caught by boat and bankanglers in Cascade Reservoir and spillway,Cascade,Idaho, September 1980 ........................................................... 73
Appendix C-7. The catch, catch rate (fish/hr) andpercentage of various fish species caughtby boat and bank anglers in CascadeReservoir and spillway,Cascade, Idaho, October 1980 ................................................75
Appendix C-8. The catch, catch rate (fish/hr) andpercentage of various fish species caughtby boat and bank anglers in CascadeReservoir and spillway,Cascade, Idaho, November 1980.............................................77
vii

LIST OF APPENDIX (Continued)
Page
Appendix C-9. The catch, catch rate (fish/hr) andpercentage of various fish speciescaught by ice and bank anglers inCascade Reservoir and spillway,Cascade, Idaho, December 1980.............................................79
Appendix C-10. The catch, catch rate (fish/hr) andpercentage of various fish speciescaught by ice and bank anglers inCascade Reservoir and spillway,Cascade, Idaho, January 1981 ................................................81
Appendix C-11. The catch, catch rate (fish/hr) andpercentage of various fish speciescaught by ice and bank anglers inCascade Reservoir and spillway,Cascade, Idaho, February 1981 ..............................................83
Appendix C-l2. The catch, catch rate (fish/hr) andpercentage of various fish speciescaught by ice anglers in CascadeReservoir, Idaho, March 1981 ................................................. 85
Appendix C-13. The catch, catch rate (fish/hr) and percentage ofvarious fish species caught by boat andbank anglers inCascade Reservoir, March 1981 .............................................87
Appendix C-14. The catch, catch rate (fish/hr), and percentage ofvarious fish species caught by boat and bankanglers inCascade Reservoir, April 1981 ................................................91
Appendix C-15. The catch, catch rate (fish/hr) and percentage ofvarious fish species caught by boat andbank anglers inCascade Reservoir, May 1981 ................................................ 95
Appendix C-16. The catch, catch rate (fish/hr) and percentage ofvarious fish species caught by boat andbank anglers in Cascade Reservoir andspillway,June 1981 ................................................................................99
viii

LIST OF APPENDIX (Continued)
Page
Appendix C-17. Catch, catch rate (fish/hr) and percentage ofvarious fish species caught by boat andbank anglers in Cascade Reservoir andspillway,July 1981 ...............................................................................103
Appendix C-18. Catch, catch rate (fish/hr) and percentage ofvarious fish species caught by boat andbank anglers in Cascade Reservoir andspillway,August 1981 ..........................................................................107
Appendix C-19. Catch, catch rate (fish/hr) and percentage ofvarious fish species caught by boat andbank anglers in Cascade Reservoir andspillway,September 1981 ....................................................................111
Appendix C-20. Catch, catch rate (fish/hr) andpercentage of various fish speciescaught by anglers in CascadeReservoir and spillway, October 1981 .................................. 115
Appendix C-21. Catch, catch rate (fish/hr) andpercentage of various fish speciescaught by anglers in CascadeReservoir and spillway, November 1981 ...............................119
ix
JOB PERFORMANCE REPORT
State of: Idaho
Project: F-73-R-4
Subproject: III
Study: V
Name: LAKE AND RESERVOIR INVESTIGATIONS
Title: Cascade Reservoir FisheriesInvestigations
Period Covered: 1 March 1981 - 28 February 1982
ABSTRACT
A mathematical model to predict the risk of winterkill at different pool storagelevels was developed for Cascade Reservoir to provide a basis for a minimum poolreservation. The work was based on a model where time-to-oxygen depletion ispredicted from initial oxygen storage.
Results indicate that the risk of oxygen limitation ranges from 0% at higherpool volumes (475x103 acre feet) to approximately 58% at lower volumes (84x10acre feet). The risk increases rapidly with initial reduction in storage, but approachesan upper asymptote at the low volumes. A minimum pool reservation of at least300x10 acre feet should result in a winterkill risk of less than 10%.
Yellow perch were the most abundant fish species in the reservoir, andcomprised 85 and 72% of the total angler catch in 1980 and 1981, respectively.
Spring releases of rainbow trout catchables provided a higher return to thecreel than did fall-released catchables. Fingerling releases of rainbow trout werealmost nonexistent in the catch.
Coho salmon fingerlings released in the central and southern portions ofthe reservoir reflected significantly better survival than did those released at thenorth end of Cascade Reservoir.
Authors:
Bruce Reininger
Fishery Research Biologist
Bruce RiemanPrincipal Fishery Research Biologist
and
Ned HornerRegional Fishery Biologist
1

RECOMMENDATIONS
Water Level Management
1. A threat of serious oxygen limitation for fish exists in Cascade Reservoirduring the winter period of ice cover and stagnation. The risk is inversely relatedto pool storage volume. A significant risk (>10%) exists for any reservoirmanagement program that results in a pool volume of less than 300,000 acrefeet during the period from mid-December through 31 March. For that reason,we recommend that a reservoir pool management plan be established forCascade Reservoir. The plan should incorporate a minimum conservation poolof 300,000 acre feet total storage during the period 15 December through 31March of each winter.
An 11 year average of monthly pool storage levels indicates the current watermanagement program generally maintains the Cascade Reservoir pool storageabove 300,000 acre feet during this period (Fig. 1). The lowest averagepool storage calculated for the 15 December-31 March period was about 349,000 acre feet (Appendix A-3).
In only two of the last 11 years (1977-73, 1979-80), has the winter storagelevel (15 December-31 March) been less than the recommended 300,000acre feet.
A water management program which calls for maintaining pool storage asclose to 300,000 acre feet as possible through the winter period would notonly yield an acceptable winterkill risk, but also provide a buffer for highspring inflows, thus reducing the need for releasing water over the spillwayduring April and May.
2. The yellow perch fishery in Cascade Reservoir is considered one of thebest and most popular fisheries in the state. Since the critical spawning periodfor this species extends from 15 April to 15 May, we recommend no drawdownduring this period. A lowering of the water level at this time could result in theexposure and desiccation of eggs deposited along shoreline areas causinggreater fluctuations in year-class strength.
3. Releasing water through the radial gates has resulted in losses of cohosalmon and other fish species from Cascade Reservoir. To prevent theselosses, we suggest that a dead storage buffer be maintained during criticalperiods capable of absorbing extreme or unusual runoff events to eliminatethe need to release water through the radial gates. Since a "no spill" watermanagement policy could be unsuccessful or impractical, we also recommendinvestigating the feasibility of screening the radial gates.
2

4. Because of the importance of Cascade Reservoir as a recreational area, andsince the potential for a summer fish kill exists, we recommend maintaining thereservoir's summer pool level as high as possible. A water managementprogram which would keep all major boat ramps functional would provide forgood fishing access and for other water-based recreational activities.
Management of nutrient sources to the reservoir provide the best means ofreducing the threat of a summer fish kill. A high summer pool could reduceproblems by diluting high nutrient concentrations responsible for algalblooms, a key factor contributing to summer fish kills.
Fishery Management
1. Rainbow Trout
A. Catchable rainbow trout released in the spring in Cascade Reservoirprovided a better return to the creel than did those released in the fall.Because of this and the fact that the south end of the reservoir and thearea around Sugarloaf Island receive the greatest fishing pressure, werecommend the following stocking program for catchable rainbow trout:
1) Approximately 40% of the total annual supply of rain-bow destinedfor Cascade Reservoir should be released at the Cabarton boatramp, 40% should be released at the Sugarloaf boat ramp, and theremaining 20% should be released at Tamarack Falls Bridge. Allrainbow should be stocked in the spring.
2) We should utilize a stock of fish that matures at an older age toproduce trophy-sized fish.
B. Because rainbow trout released as fingerlings provided essentially no return,we recommend discontinuing fingerling releases of this species except onan experimental basis to test the performance of alternate strains.
C. To enhance the contribution of "wild" rainbow trout to the fishery, werecommend that Cascade Reservoir tributariesbe managed to protect spawning stocks of rainbow, but still allow forstream fisheries.
4

2. Coho Salmon
A. Coho salmon released as fingerlings in the south end of the reservoir andat Sugarloaf boat ramp provided the best return to the creel. Therefore,we recommend that of the total annual supply of coho destined forCascade Reservoir, 50% be released at the Cabarton boat ramp and50% be released at Sugarloaf boat ramp.
B. The coho population in Cascade Reservoir exhibits a high percentageof precocial fish which effectively reduces their life span by one year.We recommend investigating ways to reduce this loss of potential fishbiomass. Experiments involving the release of different sizes offingerlings or heat sterilization of green eggs may provide a solutionto this problem.
3. Fall Chinook
A. Fall chinook salmon introductions also have the potential for providing atrophy fish for anglers in Cascade Reservoir. We should evaluate fallchinook growth rates, food habits, and catchability to build a data basefor this species.
B. We should continue to evaluate the effect (if any) of fall chinookintroductions on the other important fisheries in the reservoir.
4. Perch
A. The yellow perch fishery on Cascade Reservoir is one of the most popular inthe state. In an effort to maintain this fishery, we should furtherinvestigate perch life history and population dynamics in CascadeReservoir to shed light on potential management techniques and optionsfor this important consumptive fishery.
5

Tributary Management
1. The potential for increased salmonid production exists in several of CascadeReservoir's major tributaries. There is currently a direct loss of fish to irrigationcanals, and elimination of important spawning and rearing habitat by streamdewatering. Additionally, irrigation waste water is a major source of nutrient inputto Cascade Reservoir. These conditions could be improved by implementing the "Best Management Practices" described in the Idaho Agricultural PollutionAbatement Plan, 1980 (available from Idaho Department of Health and Welfare).
2. To allow up-and-downstream passage for migrating fish and preventlosses, the Gold Fork diversion should be laddered and the canal
inlet screened. The irrigation diversions and canal inlets onLake Fork Creek and Boulder Creek should be identified and modifiedto decrease fish losses.
INTRODUCTION
Background
When Cascade Dam and Reservoir were completed in the late 1940's, the storedwater was primarily reserved for irrigation and future power development. Over the yearsa very popular recreational and fishing resource developed, and these uses continue toexpand. A portion of the stored water has not been allocated for any specific use. TheBureau of Reclamation is currently conducting a multi-purpose study of the PayetteRiver Basin. Cascade Reservoir is the major storage facility in the basin.
Cascade Reservoir is considered to be a culturally eutrophied system.Blooms of blue-green algae are common during late summer, and fish kills havebeen observed during winter and summer. The extent of the fish kills and theirrelationship to reservoir draw-down is not completely understood, but they areprobably associated with oxygen deficiencies.
The primary objective of this study is to investigate the relationship betweenpool storage and dissolved oxygen (DO) content in the reservoir. These data willprovide information on how pool storage affects fishery habitat, particularlyoverwinter habitat,and will eventually lead to a "minimum conservation pool" recommendation.
Dissolved oxygen may decline to low levels in Cascade Reservoir duringstratification or following periods of high production because of its relatively shallowbasin, additional organic load (allocthonous sources), and relatively high productivity.There is some evidence that a "low" winter pool may increase the potential for awinterkill. A reduction in water volume may reduce the ratio of lake volume to bottomarea, thereby reducing the quantity of oxygen available for
6

the decomposition of organic matter in the sediments. Several other factors may alsoaffect the amount of oxygen produced and consumed, including the extent and durationof snow and ice cover, water exchange and dilution, and primary (algal) production.
Other aspects of this study included an evaluation of the salmonid stockingprogram, fish losses through outlet structures, and the potential for salmonid productionin Cascade tributaries.
Description of the Study Area and Its Fishery
Cascade Reservoir, a Bureau of Reclamation water storage project, is located onthe North Fork of the Payette River, tributary of the Snake River, in the mountains ofwest central Idaho near the town of Cascade (Fig. 2). The reservoir is one of the largestbodies of waterin Idaho when full (Table 1). Cascade is fed by three major tributaries: the North Fork of thePayette River, Gold Fork River, Lake Fork Creek, and many minor tributaries. Theaverage monthly total inflow from these tributaries from 1960 through 1981 ranged from15,390 acre feet in August, to 206,070 acre feet in June (Appendix A-1).
Cascade Reservoir began to fill in 1948, and reached capacity by 1957 (Casey1962). Fishing was very good for large rainbow trout (Salmo gairdneri) and kokaneesalmon (Oncorhynchus nerka) for the first few years. Northern squawfish (Ptychocheilusoregonensis) soon became a dominant and troublesome species (Casey 1962).Spawning runs of squawfish were eradicated in Cascade Reservoir tributaries withrotenone and squoxin between 1958 and 1974 until their numbers were greatly reduced(Welsh 1975). After squawfish were controlled, the fishery was largely supported byreleases of hatchery rainbow trout and coho salmon (Oncorhynchus kisutch) (Table 2),and an expanding yellow perch (Perca flavescens population (Welsh 1976).
OBJECTIVES
1. Determine the minimum reservoir level that will be sufficient to sustainfish life in Cascade Reservoir.
2. Evaluate the hatchery-release program for coho and rainbow trout inCascade Reservoir in relation to release location, release time, and sizeat release.
7


Table 1. Important physical and morphometric data of Cascade Reservoir and Dam, Cascade, Idaho.
Parameter Full pool Dead storage
Reservoir
Elevation 1,472 m (4,828 ft) 1,459 m (4,787 ft)
Surface area 11,450 ha (28,300 ac) 2,064 ha (5,100 ac)
Volume 875.2 x 10⁶m3 (703,200 ac ft) 62.2 x 10⁶m3 (50,000 ac ft)
Length 27.4 km (17 mi) 9.4 km (6 mi)
Max. Width 6.4 km (4 mi) 4 km (2.5 mi)
Max. depth 20 m (66 ft) 7 m (23 ft)
Mean depth 7.6 m (25 ft) 3 m (10 ft)
Dam
32.6 m (107 ft)Height
Width top 10.7 m (35 ft)
base 192.0 m (630 ft)
Crest length 239.3 m (785 ft)
9

Table 2 Releases of hatchery rainbow trout, brown trout, coho salmon, and kokanee salmon into Cascade Reservoir,Idaho, from 1968 to 1981.
Rainbow trout Brown trout Coho salmonYear Catchables Fingerlings Fry Fingerlings Fingerlings Fry Kokanee Fry
1968 51,500 279,000 - - 480,000 - -
1969 50,000 - - - 437,000 - -1970 50,000 - - - 365,000 - -
1971 50,000 - - - 380,000 - 124,000
1972 59,200 - - - 171,400 - 100,8001973 52,300 35,400 - - 228,900 - -
1974 58,000 21,200 - - 465,200 - 27,0001975 49,000 63,000 - - 369,800 - 139,9001976 49,700 45,600 - - 634,900 - -
1977 41,800 14,900 28,800 - - 57,500 -1978 48,500 - 262,900 - - 430,200 -1979 56,300 - 64,800 - 425,200 104,100 -1q80 80,000 143,000 - - 500,000 - -1981 81,510 45,570 - 114,956 448,900 - 180,944
TECHNIQUES USED
Minimum Conservation Pool Determination
Dissolved Oxygen Measurement
Oxygen-temperature profiles were recorded at one m intervals from the surface tothe bottom of the reservoir with a YSI model 57 dissolved oxygen/temperature meter.Calibration of the meter was done by Winkler titration. Secchi transparency wasrecorded with each profile (except those taken through the ice) using a standard 20 cmdisk.
The sampling program was initiated in May 1980 after preliminary data werecollected in February and March. Sixteen stations were selected to represent thereservoir (Fig. 3). We sampled all stations on a monthly basis during the spring and fall,and biweekly during the summer. One to nine stations were sampled weeklythroughout that period. During winter ice cover, six stations were sampled weekly.Surface elevation of the reservoir was noted to the nearest meter at each sampling,and data were recorded by elevation rather than depth. The mean oxygenconcentration of each one m strata was calculated from all samples.
Oxygen Deficits
Morphometric data on Cascade were generated from a U. S. Bureau ofReclamation area-volume table, and contour map of the reservoir (Appendix A-2).
We calculated oxygen content of the hypolimnion on an aerial basis. To dothat, the mean oxygen concentration of each strata below an upper hypolimnial limitwas weighted by the relative total volume of the strata. Oxygen was expressed on anareal basis by multiplying by the mean thickness of the hypolimnion. The upper limitof the hypolimnion was selected as the elevation which most closely approximatedthe level of the thermoclinethroughout the period of stagnation. We estimated theareal hypolimnetic oxygen deficit (AHOD) as the rate of decline of hypolimnialoxygen content during stagnation (Hutchinson 1975). The rate of decline was calcu-lated as the slope of a regression of oxygen content against the julian date (Lasenby1975). The period for the regression analysis was selected as the time during whichoxygen content declined continuously (stagnation). The winter oxygen deficit (WOD)was estimated in the same manner as the AHOD, except that the oxygen contentwas calculated for the entire reservoir rather than just that below the thermocline.
11


Salmonid Stocking Program Evaluation Fish
Marking
Rainbow and coho fingerlings were marked with three different colors offluorescent grit (Tables 3 and 4) in 1980 and 1981, and released at three locations inCascade Reservoir (Fig. 2) to evaluate different release locations. The fingerlingswere dipped out of a raceway onto a screen, and the grit was applied with a high-pressure spray gun. Mortality was very low, and mark retention good. The grit markwas generally detectable with the unaided eye in the fins or eyes of the fish, andwas checked with a blacklight whenever practical.
We marked two groups of catchable rainbow with ventral fin clips (Tables3 and 4) in 1980 and 1981 to evaluate the size at release (catchable versusfingerling) and spring (right ventral clip) versus fall (left ventral clip) release.The abundanceand distribution of all marked groups was evaluated by creel census andgill netting.
Fish Recapture
A creel census was conducted from May 1980 through November 1981 (Horner and Rieman 1981). Gill and fyke nets were fished during June, August,and October of 1980, and July and August of 1981 (Horner and Rieman 1981).
Total Harvest Estimate
Creel Census
From December 1981 through April 1982, we conducted a creel census toestimate total angler effort and total harvest of various fish species during a given timeinterval. The total time period was stratified into nine 2-week intervals. We selected atrandom one Saturday, one Sunday, two weekdays, and all holidays for angler countsduring each two-week interval. Anglers were counted at three randomly-selected timeperiods during each census day, and interviewed for catch and catch rates in-betweencounts, and whenever possible during noncount days. We determined the total hoursfished by multiplying the average number of anglers per day, times the number ofdaylight hours, times the number of days in a two-week interval (i.e., ten weekdays andfour weekend days). Total harvest was estimated for each species by multiplying catchrates by total hours fished.
16

Table 3. Marked rainbow trout and coho salmon released into Cascade Reservoir, Idaho, 1980.
Size (cm) Release Number ReleaseSpecies Mean Range Date Released Mark Location Comments
RainbowCatchable 27 - 5/5 40,000 Right Vent Tamarack Falls & 2.1/lb
Catchable 23 - 9/22 40,000
Clip
Left Vent
Lake Fork Cr. Bridges
Tamarack Falls & 3.2/lb
Fingerling
7.1 4.5-10
5/30 83,600
Clip
Green
Sugarloaf Boatramp
Tamarack Falls 50% markGrit retention
Fingerling9.2
7-11 6/11 22,000 Red Sugarloaf Boatramp 100% markGrit retention
Fingerling8.9 6.5-11
6/13 22,000 Yellow Cabarton Boatramp 99% markGrit retention
CohoFingerling 7.3 3.5-11.5 5/22 133,100 Green Tamarack Falls 95% mark
Grit retention
Fingerling8.3 4.5-12
5/22&23 112,600 Red Sugarloaf Boatramp 93% markGrit retention
Fingerling8.7
3.5-11.5 5/28 122,850 Yellow City Boatramp 95% markGrit retention

Table 4. Marked rainbow trout and coho salmon released into Cascade Reservoir, Idaho, 1981.
Release Number ReleaseSpecies Size Range (cm) Date Released Mark Location Comments
Rainbow
Catchable 15-30 4/23 & 24 41,300 Right Vent Sugarloaf Boat Ramp 3/5/16
Catchable 15-30 9/21 & 23 29,010
Clip
Left Vent Sugarloaf Boat Ramp 2.5-4.0/16
Fingerling 7.6-15.2 5/7 45,570
Clip
Red Sugarloaf Boat Ramp 2/lb
Coho
Grit
Fingerling 5.5-11.3 5/7 115,600 Green Tamarack Falls 66/lb 95% markGrit retention
Fingerling 4.9-11.3 5/7 115,200 Red Sugarloaf Boat Ramp 64/lb 98% markGrit retention
Fingerling 5.6-11.7 5/7 118,800 Yellow Cabarton Boat Ramp 66/lb 94% markGrit retention

FINDINGS
Limnological Description of the Reservoir
During the period May 1980 through March 1982, reservoir elevation variedfrom 1,467 m to 1,472 m (full pool). The lowest elevations were generally observedduring early spring (March) prior to runoff, and again in the fall (October) at the end ofthe irrigation season. Full pool was reached in early June 1980, and in early May1981. The reservoir was ice-free from mid-April until the end of November in 1980,and from the end of March until mid-December 1981. Because of the heavier snowpack and persistence of cold temperatures during the spring of 1982, ice remainedon the reservoir until early May.
Maximum mean surface DO (12-14 mg/1) was observed under the ice inFebruary and March of 1980 and 1981 (Fig. 4). Levels were down somewhat (10-11 mg/1) during the winter of 1982. Dissolved oxygen was nearly uniform fromsurface to bottom during spring mixing (April-May) when the water column washomothermos. Generally by mid-May, DO levels began declining with depth, withmean surface measurements of 8-9 mg/1 and mean bottom measurements of 5-8mg /i . Vertical DO profiles were strongly clinograde by early July of both years, andpersisted through early October 1980, and mid-September 1981. Duringstagnation, mean DO values near 0 mg/l were recorded near the bottom from Julythrough September, and again in February and March. Dissolved oxygen wasagain uniform from surface to bottom during October of both years (Fig. 4).
Cascade Reservoir was homothermos in early May 1980 andearly April 1981, with surface and bottom temperatures varying from 8-10 C in 1980and a temperature of 4 C in 1981 (Fig. 5). Surface warming typically began aboutmid-May, but due to unstable spring weather patterns in the Cascade area, mixingoccurred periodically during late May and June. Thermal stratification was evidentfrom late June through early September in 1980, and from early June through mid-September in 1981 (Fig. 5). Maximum mean summer temperatures ranged from20-23 C at the surface, and 12-14 C near the bottom. During mid-July, the surfaceof the metalimnion was about 5-6 m below the reservoir surface and dropped toabout 8 m below the surface by mid-August. Metalimnion thickness was about 5-6m in mid-July, and 3-4 m in mid-August. Homothermy was again observed in lateSeptember and early October, but the temperature of maximum density (4 C) didnot occur until mid-to-late November (Fig. 5).
19


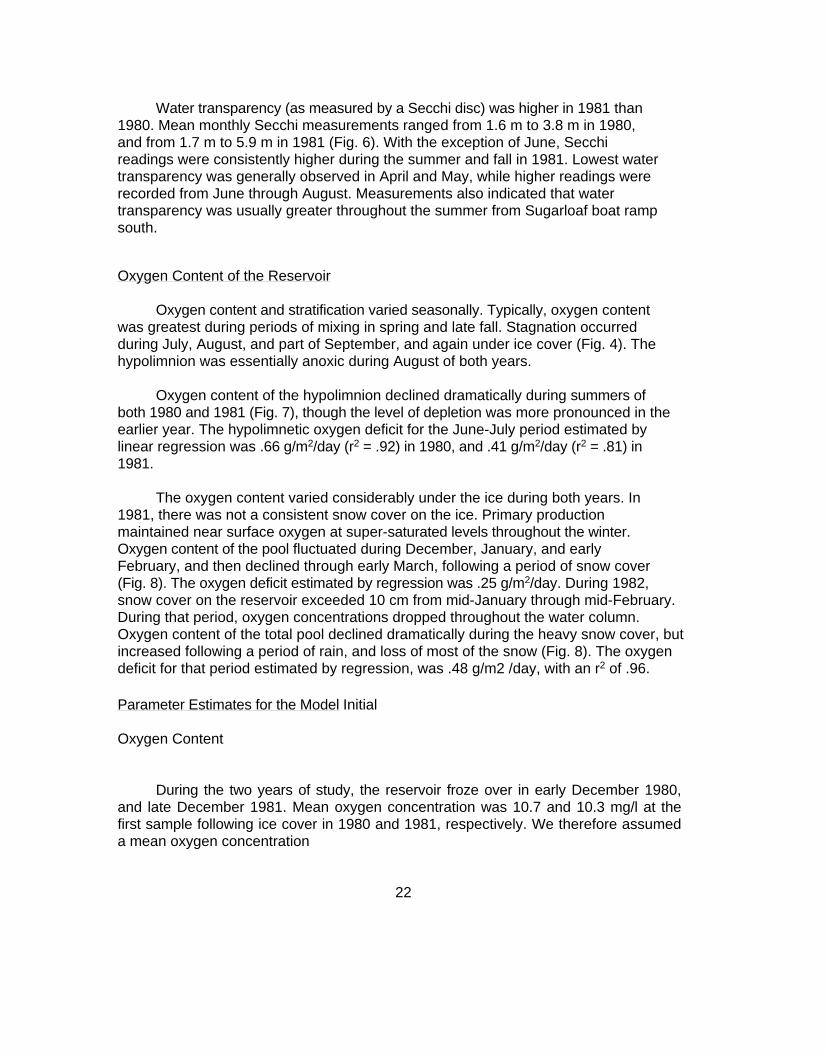
Water transparency (as measured by a Secchi disc) was higher in 1981 than1980. Mean monthly Secchi measurements ranged from 1.6 m to 3.8 m in 1980,and from 1.7 m to 5.9 m in 1981 (Fig. 6). With the exception of June, Secchireadings were consistently higher during the summer and fall in 1981. Lowest watertransparency was generally observed in April and May, while higher readings wererecorded from June through August. Measurements also indicated that watertransparency was usually greater throughout the summer from Sugarloaf boat rampsouth.
Oxygen Content of the Reservoir
Oxygen content and stratification varied seasonally. Typically, oxygen contentwas greatest during periods of mixing in spring and late fall. Stagnation occurredduring July, August, and part of September, and again under ice cover (Fig. 4). Thehypolimnion was essentially anoxic during August of both years.
Oxygen content of the hypolimnion declined dramatically during summers ofboth 1980 and 1981 (Fig. 7), though the level of depletion was more pronounced in theearlier year. The hypolimnetic oxygen deficit for the June-July period estimated bylinear regression was .66 g/m2/day (r2 = .92) in 1980, and .41 g/m2/day (r2 = .81) in1981.
The oxygen content varied considerably under the ice during both years. In1981, there was not a consistent snow cover on the ice. Primary productionmaintained near surface oxygen at super-saturated levels throughout the winter.Oxygen content of the pool fluctuated during December, January, and earlyFebruary, and then declined through early March, following a period of snow cover(Fig. 8). The oxygen deficit estimated by regression was .25 g/m2/day. During 1982,snow cover on the reservoir exceeded 10 cm from mid-January through mid-February.During that period, oxygen concentrations dropped throughout the water column.Oxygen content of the total pool declined dramatically during the heavy snow cover, butincreased following a period of rain, and loss of most of the snow (Fig. 8). The oxygendeficit for that period estimated by regression, was .48 g/m2 /day, with an r2 of .96.
Parameter Estimates for the Model Initial
Oxygen Content
During the two years of study, the reservoir froze over in early December 1980,and late December 1981. Mean oxygen concentration was 10.7 and 10.3 mg/l at thefirst sample following ice cover in 1980 and 1981, respectively. We therefore assumeda mean oxygen concentration
22


Table 5. Estimated initial oxygen content (g/m2) following ice cover for Cascade Reservoir,Idaho.
Reservoir Elevation (m) Oxygen Content (g/m2)
146972.0
1468 67.5
1467 61.0
1466 56.4
1465 51.0
1464 45.5
1463 40.8
1462 36.4
1461 32.2
27


Table 6 . Oxygen demand of three points in the water column (mg/1/day) estimated by BOD samples for CascadeReservoir in 1981 and 1982.
Date 4/2/81 5/17/81 6/20/81 7/15/81 9/11/81 10/5/81 10/27/81 12/31/81 1/19/82 2/15/82
Near Surface(mean of 3)
0.03 0.12 0.05 0.05 0.05 0.05 0.06 0.05 0.07 0.0
Mid-Depth(mean of 3)
0.00 0.07 0.04 0.06 0.00 0.05 0.07 0.02 0.00 0.0
Near Bottom(mean of 3)
0.00 0.03 0.04 0.06 0.07 0.05 0.06 0.02 0.00 0.0
X
0.01 0.07 0.04 0.06 0.04 0.05 0.06 0.03 0.02 0.0
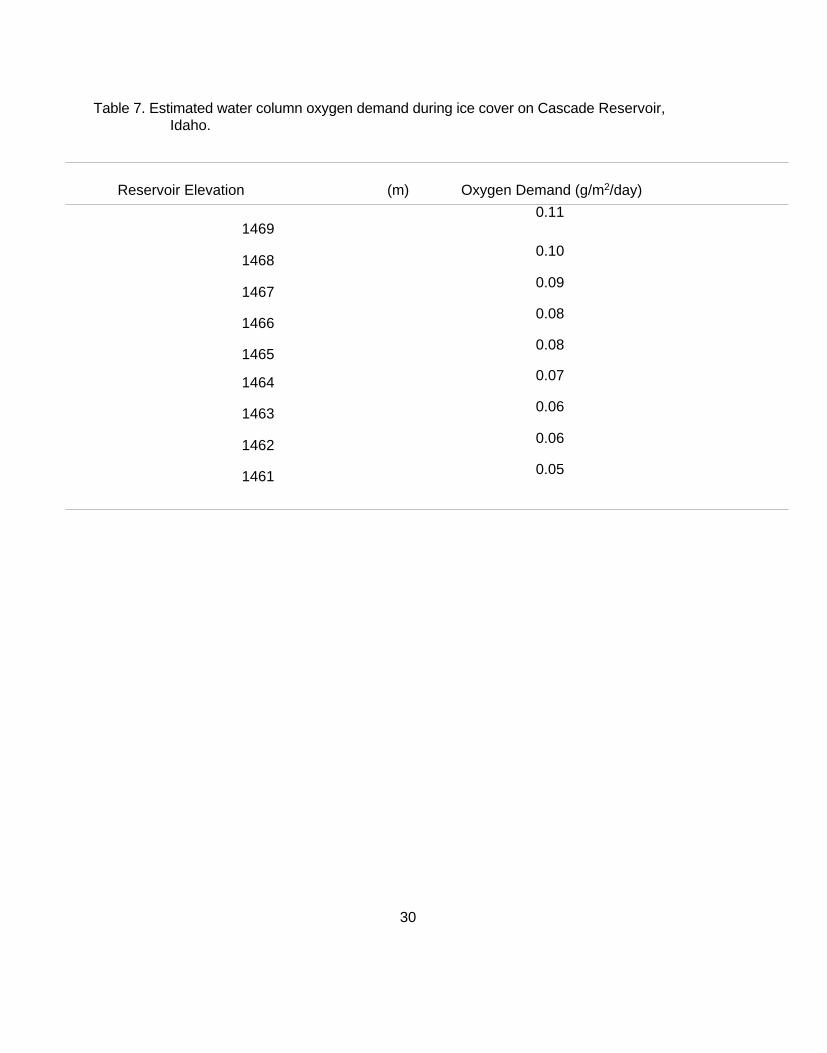
Table 7. Estimated water column oxygen demand during ice cover on Cascade Reservoir,Idaho.
Reservoir Elevation (m) Oxygen Demand (g/m2/day)
14690.11
1468 0.10
1467 0.09
1466 0.08
1465 0.08
1464 0.07
1463 0.06
1462 0.06
1461 0.05
30
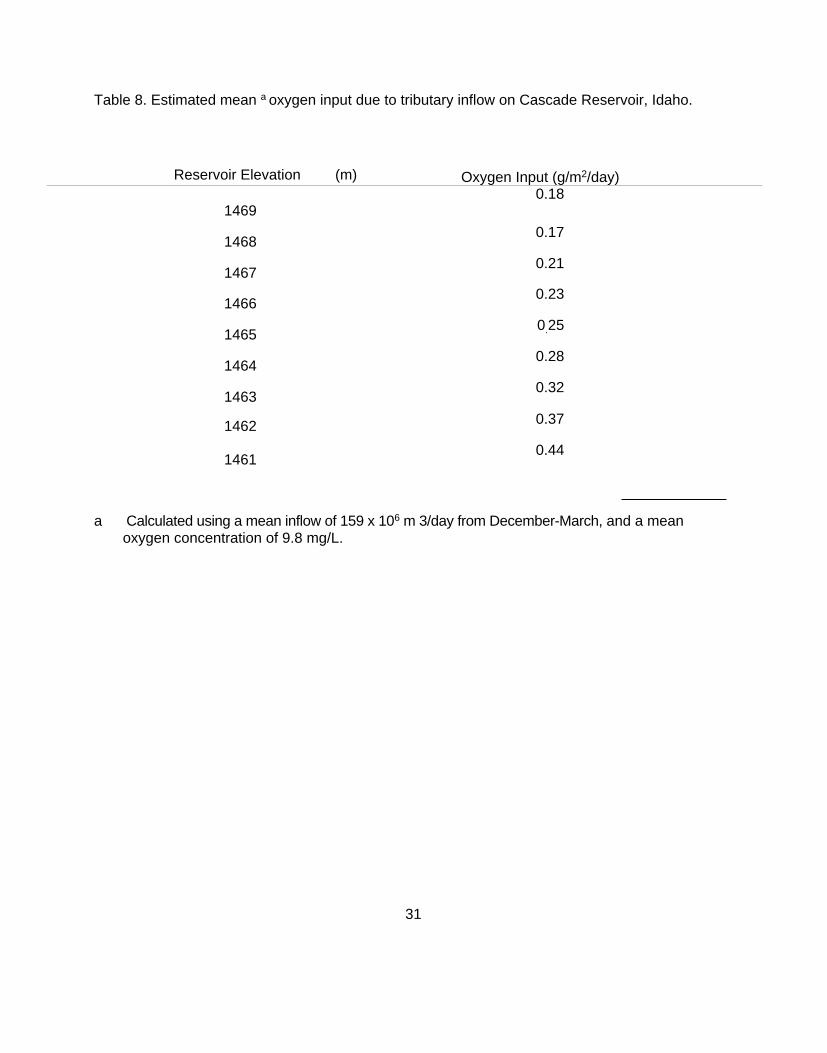
Table 8. Estimated mean a oxygen input due to tributary inflow on Cascade Reservoir, Idaho.
Reservoir Elevation (m) Oxygen Input (g/m2/day)
14690.18
1468 0.17
1467 0.21
1466 0.23
1465 0.25
1464 0.28
1463 0.32
1462 0.37
1461 0.44
a Calculated using a mean inflow of 159 x 106 m 3/day from December-March, and a meanoxygen concentration of 9.8 mg/L.
31

Table 9. Estimated mean a oxygen outflow for the first 30 days and after 30 days of winterstagnation on Cascade Reservoir, Idaho.
Reservoir ElevationOutflow First 30 Days
g/m2/dayOutflow After 30 Days
g/m2/day
14690.16 0.13
14680.17 0.14
1467 0.17 0.14
1466 0.19 0.16
1465 0.21 0.17
1464 0.24 0.20
1463 0.28 0.23
1462 0.30 0.25
1461 0.37 0.30
a Calculated as a mean oxygen concentration of the entire water column in the forebayarea.
32
Sediment Oxygen Demand
Sediment oxygen demand estimated from total oxygen demand, watercolumn demand, and inflow and outflow estimates for the period of winterstagnation in 1982 was 0.40 g/m2/day. Sediment demand should not vary withpool volume and was, therefore, assumed to be stable for all reservoirelevations in the model.
Model Output
Using the preceeding parameter estimates, the model was used toestimate the number of days of winter stagnation (adequate ice and snow toeliminate primary production) necessary for the reservoir to approach acompletely anoxic condition. The estimated times ranged from 154 days at areservoir elevation of 1,469 m to 92 days at an elevation of 1,461 m (Table 10).We also used the model to calculate the time necessary under stagnation toreach conditions that would be considered seriously limiting for salmonids.Calculated oxygen content under these conditions ranged from 158 g/m2 at anelevation of 1,469 m, to 80 g/m2 at an elevation of 1,461 m (Table 11). Theestimated time to reach these conditions under stagnation ranged from 119 daysat a reservoir elevation of 1,469 m, to 68 days at an elevation of 1,461 m (Table10).
Winter Severity
Snow depth on the reservoir was recorded 11 times during the 1982 periodof ice cover. If a single point is eliminated, a strong correlation exists (r = .81)between reservoir snow depths and BOR snow gauge depths (Fig.10). A linearregression fit to the data had a slope of 0.4, indicating that snow depth at the BORgauge was generally 2.5 times that on the reservoir. When the regression line wasforced through the origin, a slope of 0.33 was obtained (gauge depth = three timesreservoir depth). To calculate the severity index, we assumed the three-folddifference. We, therefore, assumed a threshold snow depth of 30 cm at the BORgauge to be indicative of stagnation conditions (10 cm snow, and no primaryproduction) on the reservoir. From 31 years of snow records at the BOR gauge (NOAA 1950-1981), the frequency of stagnation conditions ranged from 80% for aperiod of 20 days, to 0% for a period of 120 days (Fig. 11). In other words, 80% ofthe years of record had 30 cm or more snow on the ground for at least 20 days,o% of the years of record for 120 days.
33

Table 10. Estimated time (days) to reach anoxia and oxygen limiting conditions for salmonidsduring winter stagnation in Cascade Reservoir, Idaho.
Reservoir elevation (m) Days to anoxiaDays to limiting
conditions
1469 154 119
1468 151 117
1467 139 105
1466 134 100
1465 125 93
1464 113 81
1463 109 78
1462 100 71
1461 92 68
34

Table 11. Estimated oxygen content (g/m2) resulting in limiting conditions for salmonids inCascade Reservoir, Idaho.a
Reservoir elevation (m) Oxygen content (g/m2)
146915.8
1468 15.4
1467 15.0
1466 14.5
1465 13.8
1464 12.6
1463 11.0
1462 10.0
1461 8.0
a Assumes normal stratification with maximum oxygen concentration of 4 mg/L near thesurface.
35


Winterkill Risk and Pool Elevation
By combining the winter severity data and output from the oxygen model, itis possible to estimate the frequency or risk of reaching anoxic or oxygen "limiting"conditions on the reservoir for a given pool elevation. By interpolating from Figure12, we estimate that winter stagnation conditions should occur (did occur in the last31 years) long enough for the reservoir to become totally anoxic at a poolelevation of 1,461 m 30% of the time (Fig. 12). Anoxia should not occur atelevations of 1,465 m and higher. Oxygen-limiting conditions should occur 57% ofthe time at an elevation of 1,461 m, but only 1% of the time at 1,468 m.
Salmonid Stocking Program
Creel Census and Netting
Numbers and species of fish caught and catch rates are expressed inAppendix C-1 through C-21. Generally, yellow perch were harvested in greaterabundance than any other fish speciein the reservoir. Perch comprised 85 and 72% of the total angler catch during1980 and 1981, respectively, and 53% of the total net catch (Tables 12 and 13).Coho and rainbow were harvested in respectively fewer numbers.
Release Location
Coho released at the Cabarton and Cascade City boat ramps had thebest apparent survival of the six groups of coho fingerlings released during 1980and 1981 (Tables 14 and 15). Of 894 recaptured grit-marked coho released in1980, 36.8% were fish released at the Cabarton and Cascade City boat ramps,while the remaining 34.1% and 29.1% were fish released at Sugarloaf boatramp and Tamarack Falls Bridge, respectively. Similarly, coho released at theCabarton boat ramp in 1981 comprised 46.3% of grit-marked fish returned to thecreel (Table 16). Fish released at Sugarloaf boat ramp and Tamarack FallsBridge comprised 32.6% and 21.1%, respectively, of the angler catch. So fewgrit-marked rainbow fingerlings were observed that an evaluation of stockinglocation is not practical (Table 16).
Size at Release
Rainbow trout released as catchables in 1980 and 1981 provided thelargest percentage of the total rainbow harvest ' (53.0%), whereas rainbowsreleased as fingerlings were almost nonexistent in both the angler harvest andnet catches (1.3%) (Table 16). An additional 36.9% of the rainbow harvestfrom
38


Table 12. The percentage of various fish species caught by anglers in CascadeReservoir, Idaho, May 1980 to November 1981.
Month Percentage of species caught by anglers(1980) Rainbow Coho Perch Bullhead Squawfish Sucker
May 18.6 23.2 39.2 2.7 15.2 1.1
June 12.6 1.9 76.5 3.0 5.0 1.0
July 4.0 1.1 90.9 1.4 2.4 0.2
August 1.5 1.0 95.4 1.0 1.0 0.1
September 15.7 4.0 74.3 1.5 2.9 1.6
October 29.8 13.1 53.9 2.1 0.9 0.2
November 95.7 3.1 1.2 - - -December 4.8 65.9 29.3 - - -
Mean a 7.2 4.1 84.6 1.4 2.3 0.4
Month(1981) Rainbow Coho Perch Bullhead Squawfish Sucker
January 5.0 43.6 51.2 - 0.2 -
February 9.6 27.5 61.2 - 1.7 -March 4.4 7.0 86.9 0.3 1.4 -April 47.7 3.4 29.2 5.7 - 10.6 3.4
May 12.1 38.2 37.5 3.6 7.8 0.8
June 6.3 17.6 73.1 0.3 2.3 0.4
July 3.2 14.8 78.5 0.6 2.7 0.2
August 2.4 8.3 84.1 1.4 2.7 1.1
September 6.3 9.9 81.7 0.2 1.4 0.5 .October 48.0 31.0 2.0 16.0 3.0 -
'November 76.5 14.4 7.6 - - 1.5
Mean 6.6 17.0 72.2 0.9 2.8 0.5a Means calculated from overall catch, not monthly percentages.
40
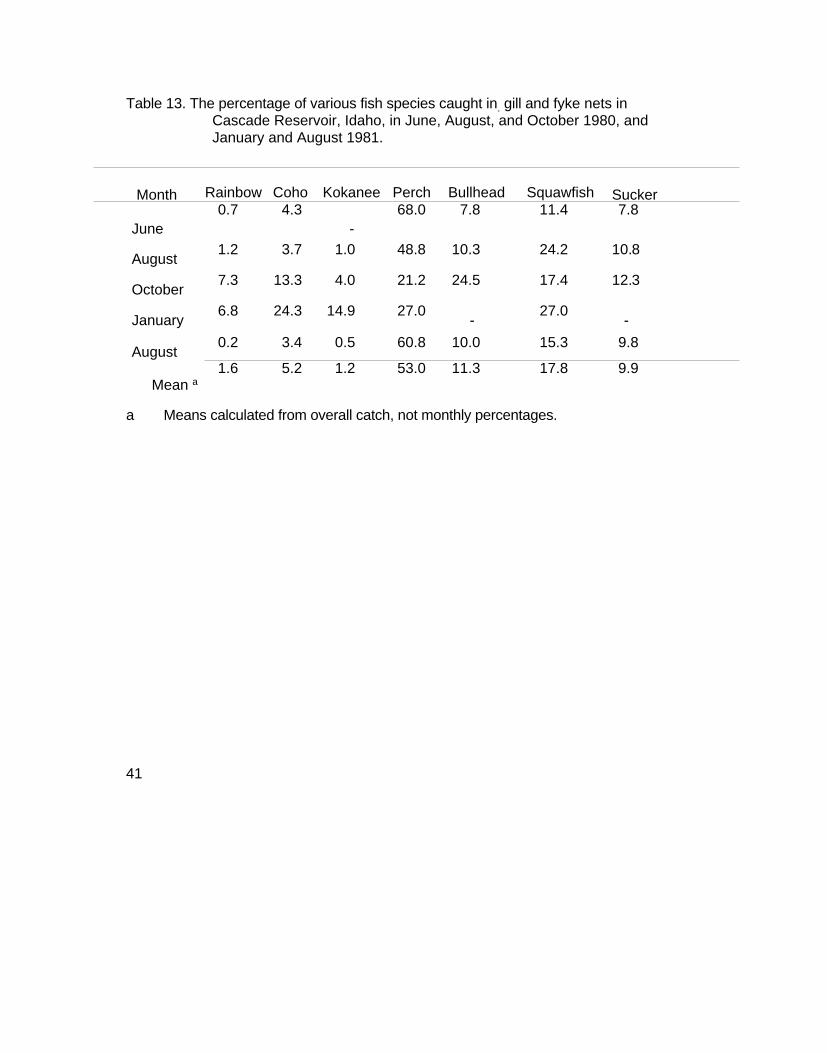
Table 13. The percentage of various fish species caught in. gill and fyke nets inCascade Reservoir, Idaho, in June, August, and October 1980, andJanuary and August 1981.
Month Rainbow Coho Kokanee Perch Bullhead Squawfish Sucker
June0.7 4.3
-68.0 7.8 11.4 7.8
August 1.2 3.7 1.0 48.8 10.3 24.2 10.8
October 7.3 13.3 4.0 21.2 24.5 17.4 12.3
January 6.8 24.3 14.9 27.0 - 27.0 -
August 0.2 3.4 0.5 60.8 10.0 15.3 9.8
Mean a1.6 5.2 1.2 53.0 11.3 17.8 9.9
a Means calculated from overall catch, not monthly percentages.
41

Table 14. The number of fluorescent grit marked coho salmon (released in 1980) observed inangler creels and gill nets from Cascade Reservoir, June 1980 to April 1982.
TamarackFalls
Sugarloaf City/CabartonBoat Ramp Boat Ramp
Color Green Red Yellow
Number released 133,100 112,600 122,850
Weighting factor 1.18 1.00 1.09
Angler catch 248 244 288
Net catch 35 37 42
Grand total 283 281 330
Weighted value 240 281 303
Percentage 29.1 34.1 36.8
X2 value 7.470 (significant at p= 0.05)
42

Table 15. The number of fluorescent grit marked coho salmon (released in 1981) observedin angler creels and gill nets from Cascade Reservoir, Idaho, June 1981 toApril 1982.
TamarackFalls
SugarloafBoat ramp
CabartonBoat
Color Green Red Yellow
Number released 115,600 115,200 118,800
Weighting factor 1.00 1.00 1.03
Angler catch 23 33 62
Net catch 8 15 8
Grand total 31 48 70
Weighted value 31 48 68
Percentage 21.1 32.6 46.3
x2 value 14.008 (significant at p = 0.05)
43

Table 16 The number of various types of rainbow trout (released in 1980 and 1981) observed in angler creels and gill nets fromCascade Reservoir, Idaho, May 1980 to April 1982. (RV-spring release; LV-fall release; no dorsal-catchablesreleased in prior years; bent ray-catchables or fingerlings released in prior years; good dorsal-native or fingerlingrelease origin.)
Marked CatchablesMarked Fingerlings Unmarked Rainbow
Red NoDorsal
BentRay
GoodDorsal81 LV 80 LV 81 RV 80 RV Green 80 81 Yellow
AnglerCatch 98 275 437 688 3 4 12 9 314 710 247
Percentage 3.5 9.8 15.6 24.6 0.1 0.1 0.4 0.3 11.2 25.4 8.8
Net Catch 0 10 0 10 2 2 2 3 13 19 4
Percentage 0 15.4 0 15.4 3.1 3.1 3.1 4.6 20.0 29.2 6.1
Grand Total 98 285 437 698 5 6 14 12 327 729 251
Percentage 3.4 10.0 15.3 24.4 0.2 0.2 0.5 0.4 11.4 25.5 8.8
May 1980 to April 1982 was comprised of unmarked fish which were probablyreleased as catchables in prior years (Table 16), as most appeared to havehatchery-deformed dorsal fins (Fig. 13). Unmarked rainbow with "good" dorsalfins which were either native or of fingerling release origin comprisedapproximately 9% of the rainbow harvest.
Spring Versus Fall Release
Catchable rainbow released in the spring provided better catches andcatch rates than fall-released catchables (Table 17). After 20 months residencein Cascade Reservoir, 672 spring-released catchables (1980) were returned tothe creel, whereas only 275 fall-released fish were taken in the same amount oftime. Similarly, after eight months in the reservoir, 203 rainbow from spring 1981releases were harvested, compared to only 98 fall-released fish (Table 17).
Total Harvest Estimate
During the winter ice fishery, 26 December 1981 through 23 April1982, anglers fished an estimated 29,223 hours in Area I and 10,604 hoursin Area III (Appendix B-1 and B-2). Angler use was higher in the southernend of the reservoir at 8,590 fishermen compared to 3,182 anglers in thenorthern end. Very few anglers fish in Area II during the ice fishery.
Yellow perch were harvested in greater numbers than any other fishspecies in the reservoir (Table 18). From December through January, mostperch were harvested in the northernend of the reservoir. After January, however, greater numbersof perch were taken in the southern end of the reservoir. Angler effort wasconsistently higher in Area I (Appendix B-1 and B-2), and catch rates for perchranged from 0.03-0.91 fish/hr in Area I, and 0.62-1.89 fish/hr in Area III. Anestimated 29,186 perch were harvested from the reservoir during this period,59% of which were from Area I.
Rainbow trout were caught in consistently greater numbers from Area I ofCascade Reservoir. Rainbow caught from mid-March through April (Intervals 7-9)constituted 68% of the fish caught in Area I, and 58% of the total estimatednumber of rainbow harvested from the entire reservoir during this period (Table 18).Catch rates in Area I ranged from 0.06-0.31 fish/hr, and from 0.02-0.16 fish/hr inArea III (Appendix B-1 and B-2). A total of 4,662 rainbow were harvested during thecensus period, 85% of which came from Area I (Table 8).
45
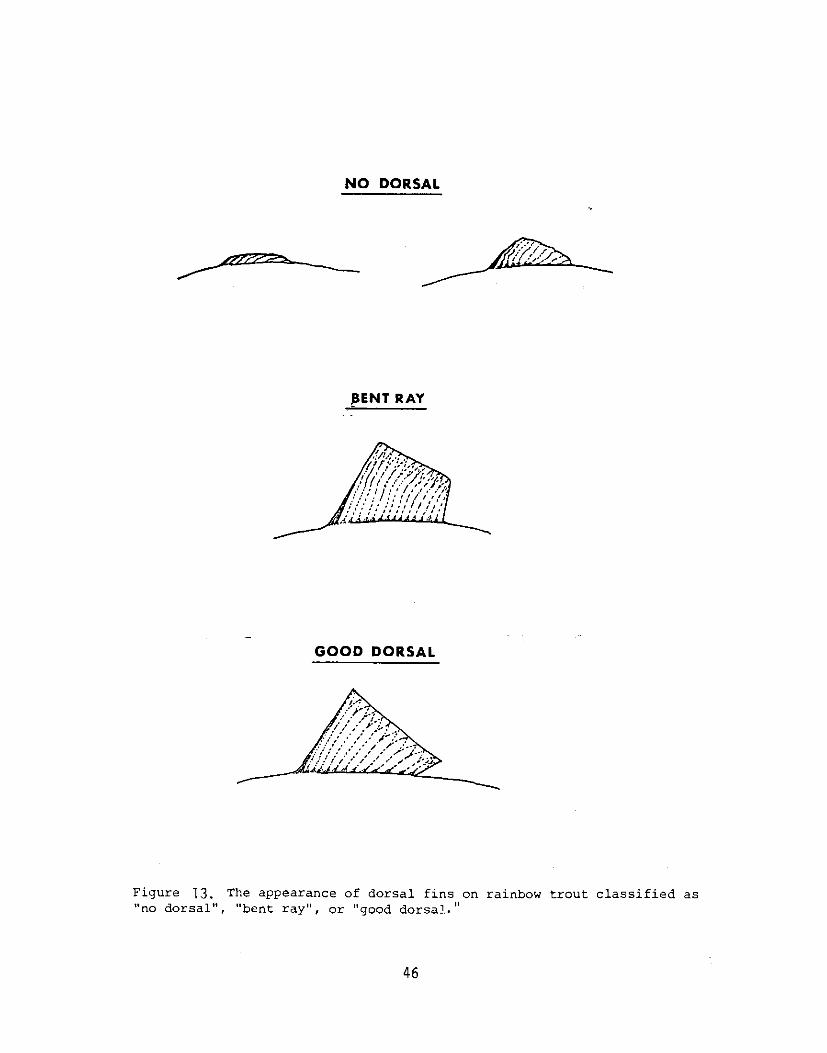

Table 17. Catch and catch rate (fish/hour) of fin clipped catchable rainbow trout released in Apriland May and September during 1980 and 1981 in Cascade Reservoir.
Spring Release Fall Release
Month/Year1980 1981 1980 1981
Catch Catch Rate Catch Catch Rate Catch Catch Rate Catch Catch Rate
5/80 42 .063 - - - - - -6/80 67 .024 - - - - - -7/80 139 .021 - - - - - -8/80 40 .012 - - - - - -9/80 60 .021 - - 67 .023 - -
10/80 69 .031 - - 66 .028 - -11/80 42 .070 - - 37 061 - -
12/80 8 .015 - - 7 .013 - -1/81 11 .022 - - 4 .008 - -2/81 9 .068 - - 3 .022 - -3/81 4 .046 - - 4 .046 - -4/81 92 .075 3 .002 _ 3 .002 - -5/81 20 .014 11 .008 14 .010 - -6/81 41 .010 57 .014 21 .005 - -7/81 15 .003 62 .010 15 .002 - -8/81 0 - 21 .015 2 .001 - -9/81 2 - .004 16 .035 0 - 0 -
10/81 3 .007 10 .025 1 .007 1 .00911/81 4 .007 23 .042 12 .022 12 .02212/81 4 .022 9 .050 4 .022 1 .006
1/82 4 .003 57 .038 6 .004 21 .0142/82 0 - 36 .037 2 .002 8 .0083/82 4 .003 68 .048 2 .001 30 .0214/82 8 .008 64 .069 5 .005 25 .027
Total 688 - 437 - 275 - 98 -
Mean 28.7 .023 33.6 .030 13.8 .014 12.2 .013
47
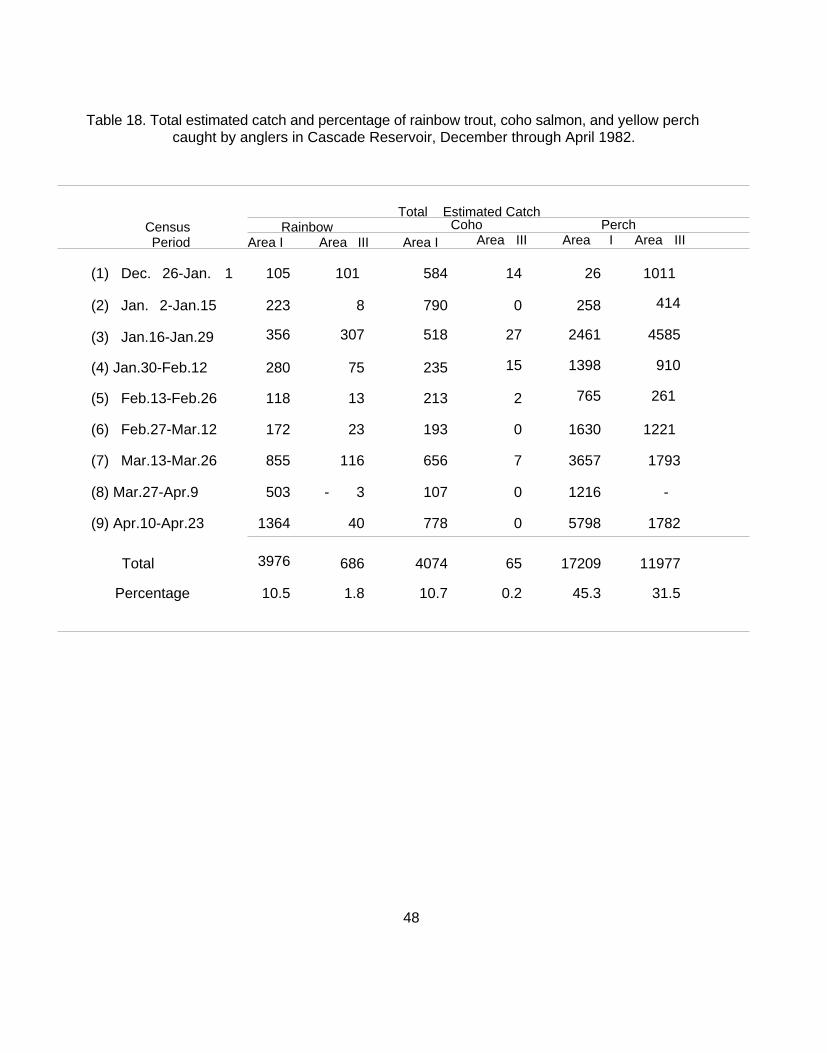
Table 18. Total estimated catch and percentage of rainbow trout, coho salmon, and yellow perchcaught by anglers in Cascade Reservoir, December through April 1982.
Total Estimated CatchCensus Rainbow Coho PerchPeriod Area I Area III Area I Area III Area I Area III
(1) Dec. 26-Jan. 1 105 101 584 14 26 1011
(2) Jan. 2-Jan.15 223 8 790 0 258 414
(3) Jan.16-Jan.29 356 307 518 27 2461 4585
(4) Jan.30-Feb.12 280 75 235 15 1398 910
(5) Feb.13-Feb.26 118 13 213 2 765 261
(6) Feb.27-Mar.12 172 23 193 0 1630 1221
(7) Mar.13-Mar.26 855 116 656 7 3657 1793
(8) Mar.27-Apr.9 503 - 3 107 0 1216 -
(9) Apr.10-Apr.23 1364 40 778 0 5798 1782
Total 3976 686 4074 65 17209 11977
Percentage 10.5 1.8 10.7 0.2 45.3 31.5
48

Coho salmon were harvested in lowest numbers compared to perch andrainbow (Table 18). Of the estimated 4,139 coho harvested, 98% were taken fromArea I in the southern end of the reservoir. Catch rates for coho ranged from 0.06-0.61fish/hr in Area I and 0.004-0.02 fish/hr in Area III. Catch rates were highest fromDecember through January (Intervals 1-3) and during March and April (Intervals 7 and9, respectively). The majority of coho taken were Age 0+ fish.
DISCUSSION
Oxygen Content of the Reservoir -
There is a large volume of literature examining oxygen deficits and theirmeasurement. A considerable effort has gone into developing the ability to predictoxygen consumption for different lakes and reservoirs (Hutchinson 1957, Mathias andBarica 1980, Charlton 1930, Hargrave 1972, Cornett and Rigler 1979, Lasenby 1975,Welch et al 1976, Welch 1974, Cornett and Rigler 1980). The oxygen deficit hasgenerally been estimated on an areal basis and has been shown to be related to manyfactors, including temperature, phosphorous retention, hypolimnetic thickness, meandepth, and basin morphometry. The oxygen deficit does not vary consistently as afunction of these factors, though it is generally much higher in productive lakes thanunproductive ones. It does appear that within a single body of water, the winter oxygendeficit may be fairly consistent from one year to the next (Barica and Mathias 1979). It isreasonable to assume then, that once the deficit has been estimated, it can be used foraccurately estimating future oxygen conditions with a water body.
Cascade Reservoir exhibited a pronounced oxygen deficit during both summerand winter periods of stagnation. Estimates of the summer oxygen deficit (AHOD) of.66 g/m2 /day and .41 g/m2/day are well within the range of those reported foreutrophic waters (Hutchinson 1957, Mathias and Barica 1980), but the true oxygendemand may be even higher. The summer estimates based on regression ofhypolimnetic oxygen content over time may acutally underestimate the actual oxygendemand in the reservoir. Cascade did not stratify strongly and unstable periods ofmixing were common throughout the summer. It is likely that entrainment of oxygeninto the hypolimnion occurred throughout the summer, masking actual oxygenconsumption. Estimates of oxygen deficits over short periods of stratification wereoften much greater and the actual summer demand might more closely approximate 1.0 g/m2/day (Horner and Rieman 1982).
49

The estimates of winter oxygen demand differed dramatically in 1981 (0.25g/m2 /day) and 1982 (0.48 g/m2 /day). During 1981, there was little snow cover onthe reservoir, and significant oxygen production probably occurred under the icethroughout the winter. We consistently observed supersaturation of oxygen justunder the ice during winter sampling in 1981. During 1982, there was a muchgreater snow cover on the reservoir. Measured snow depths exceeded the 10 cmthreshold that should eliminate any oxygen production due to photosynthesis (Barica and Mathias 1979) for approximately one month. A consistent oxygendeficit of .48 g/m2/day was observed throughout that period, and is probably anaccurate estimate of the actual winter oxygen demand in Cascade Reservoir.
Development of the Model
Barica and Mathias (1979) used winter oxygen deficits to predict winterkillrisk in lakes. Their model used oxygen content at freeze-up (g 02/m2), and theestimated oxygen deficit(9 02/m2/day) to predict the number of days to completely anoxic conditions:
Initially, our model was similar, incorporating only reservoir volume and theoxygen deficit to predict the time to anoxic conditions (Horner and Rieman 1982).We originally assumed that sediment oxygen demand was the only significantcomponent of the winter oxygen deficit. However, our data indicates that watercolumn oxygen consumption may contribute up to 22% of the total oxygen demandand that net oxygen input due to tributary inflow may reduce the deficit by as muchas 10%. Because of the significant contribution of both tributary inflow and watercolumn demand, it was necessary to incorporate both into the model. Recent work (Charlton 1980, Cornett and Rigler 1979, Mathias and Barica 1980, Welch et al1976) has shown that oxygen deficits calculated on an areal basis (as ours) mayvary with mean depth of the water body. The inclusion of water column demand (which normally was considered insignificant) may explain that phenonmenon. Sincethe water column demand calculated on an areal basis declines with mean depth ofthe reservoir, and since we are considering a fluctuating rather than a stable body ofwater, it must be included.
50

Barica and Mathias (1979) also did not incorporate winter conditions intheir model, using it only as a tool for prediction of relative winterkill potential. Inthe Cascade area, winter severity can vary considerably. As an example, snowand ice conditions in 1981 were not adequate to result in elimination of primaryproduction and measurement of the oxygen deficit to quantify the actual risk of awinterkill. On Cascade, it was necessary to incorporate a winter severity index topredict the frequency of winterkill conditions. Barica and Mathias (1979)indicated that 10 cm of snow was adequate to eliminate oxygen production andresult in stagnation. Our 1982 data (Fig. 7)show that the maximum oxygen deficit occurred only during the period when snowdepth on the reservoir exceeded 10 cm, confirming their observations. Snowconditions at the BOR weather station did not coincide with our measurements ofsnow on the reservoir, but the two did show a stong positive correlation. The datafrom the weather station can be used to estimate past snow conditions on thereservoir. Assuming that climatic conditions during the last 31years can be used to estimate the frequency of given winter conditions at the station,the data should also provide a useful indication of the frequency of stagnationconditions on Cascade Reservoir.
Initially, we assumed that total anoxia was necessary for winterkill. Obviously,some oxygen limitation may occur at higher concentrations. Percids and ictaluridshave been reported to survive oxygen concentrations as low as 0.7 mg/1 (Moss andScott 1961). Other authors (Burdick et al 1957, Moore 1942) report DO levels in therange of 0.7 to 1.5 mg/1 to be lethal for yellow perch. Minimum oxygen requirementsfor salmonids are generally considered to be 5 mg/1, and anything below saturationmay cause some adverse effects on growth, reproductive activity, or otherphysiological functions (Wedemeyer et al 1976). It is likely, then, that significantdamage may occur to the Cascade fish community at DO levels well above anoxia. Itis difficult to predict the actual level where severe limitation may occur, particularlysince vulnerability may vary by species. Since oxygen depletion tends to developfrom the bottom of the reservoir, the ability of fish to move to oxygenated waters andtheir actual oxygen requirements will dictate the critical level of oxygen depeltion.During our summer sampling, we saw an obvious avoidance of anoxic waters byperch, the fish moving inshore as oxygen in deep water was depleted. Salmonidswere generally found higher in the water column where the greatest oxygenconcentrations exist. During winter stagnation, it is likely that all species would befound in the upper strata of the water column where maximum oxygenconcentrations would be found. For that reason, we estimated the final minimumoxygen content of the reservoir to be that level where near-surface oxygenconcentrations would definitely be considered limiting. For salmonids we assumedthat to be 4 mg/l. Since other species are more tolerant, the prediction of "oxygenlimiting" conditions by the model should be considered in reference to the salmonidpopulations.
51

Winterkill Risk
The final product of the modeling is the development of an estimated risk foroxygen limitation at different winter storage levels, with the objective of recommendinga minimum conservation pool. Our analysis indicates that a significant risk (> 12%chance) may occur when the reservoir is held below a pool level of 1,466 m (290,000acre feet) during the period of winter stagnation. The analysist assumes that thereservoir elevation is stable and remains at that level for an extended period of time.For example, at an elevation of 1,466 m, it would require between 90 and 100 daysfor the reservoir to reach limiting conditions. The BOR does not have a standardoperation procedure for maintenance of the winter pool level, and pool elevation hasrarely been held stable during the period of winter stagnation. In light of fairly erraticchanges in reservoir volume during this period, a minimum pool reservation alone isnot too meaningful since the reservoir might be drawn below an elevation of 1,466,but not for a period of time approaching that necessary for oxygen limitation. Anyrecommendation of a minimum conservation pool should also incorporate a timerestriction. Figure 12 incorporates the estimates of risk and the time necessary toreach oxygen limitation at given pool elevations (and volumes). For example, there isa 40% risk of oxygen limitations at an elevation of 1,464 m (192,000 acre feet). Thelower graph shows that it would require approximately 80 days to reach thoseconditions. An appropriate recommendation is that during winter stagnation (December-March), the reservoir not be allowed to drop below 1,464 m for a period oftime approaching 80 days. Similarly, to reduce the risk below 12%, the reservoirshould not be allowed to drop below an elevation of 1,466 m (290,000 acre feet) for aperiod approaching 90-100 days.
Summerkill Risk
The development of a summer oxygen deficit during the periodof thermal stratification did not appear to pose a serious potential for summerkill onCascade in 1980 or 1981. A substantial amount of habitat was eliminated from use byanoxic and low oxygen conditions, but it appeared that all species were able torespond to declinging oxygen by moving to areas of higher concentration. Salmonidhabitat was further restricted by warm surface temperatures. Although surfacetemperatures did occasionally reach 24-25 C (often considered lethal to salmonids [Scott and Crossman 1973]), the extent and duration of these conditions was notenough to cause a kill of salmonids during the summer of 1980 or 1981. Thepotential for summerkill due to normal stagnation could be accentuated by a lowsummer pool and/or a long, hot summer.
52

The serious potential for summerkill in Cascade Reservoir lies in the apparenthigh productivity and potential for massive algal blooms. The collapse of algalblooms can result in a massive oxygen demand and complete oxygen depletion in avery short period of time (Barica 1975, Papst et al 1980). It appears that a period ofthermal instability (mixing) coincidental with a bloom collapse is necessary to createa summerkill situation (Papst et al 1980). We did not observe conditions of thisnature in Cascade during 1980 or 1981, but it is obvious that each of theprerequisites necessary to develop those conditions exists within the reservoir.Reported nutrient levels, particularly phosphorous, are high in Cascade (Clark andWroten 1976, U. S. Bureau of Reclamation 1975), and large algal blooms haveoccurred in some years. Our observations of thermal stratification also show thereservoir to be relatively unstable. Occasionally, the conditions for a massive algaebloom and its collapse and mixing will occur simultaneously. Summer fish kills havebeen observed. The potential for more frequent and massive summer fish kills isalso present. Increased nutrient loading will increase the frequency of algal blooms.A high summer pool could reduce problems by diluting nutrient concentrations andproviding a high initial oxygen volume, but the real problem lies in excessivenutrient loading. Management of nutrient sources to the reservoir provide the bestmeans of reducing the threat of summer losses.
Cascade Reservoir Fishery
Cascade's fishery at present is mostly supported by a self-sustaining yellowperch population and hatchery releases of rain-bow trout and coho salmon.Limnological conditions of the reservoir favor the continuation of yellow perch andnongame species and make salmonid survival marginal at times.
Coho released at Cabarton and the Cascade City boat ramps showed thebest apparent survival of the six groups of coho fingerlings released during 1980and 1981. Reasons for the better survival are likely food and/or predator related. Thesouthern end of the reservoir is typically 1-2 C warmer than the north end, and maysupport a greater zooplankton population. Also, the squawfish population in thesouth end (based upon catch rates) is lowest of any other area of the reservoirduring May and June when coho fingerlings are released.
53

The rainbow trout fishery appears to be almost totally supported by releases ofcatchable-size fish. Virtually no rainbow released as fingerlings are recovered. Thepoor survival of fingerling rainbow compared to similar-sized coho fingerlings releasedat similar times and places suggests some behavioral difference between rainbow andcoho fingerlings. Catchable rainbows released in the spring provided better catchesand catch rates than fall-released catchables. Spring-released fish have the advantageof adjusting from a hatchery environment to the lacustrine environment during a periodof mild water temperatures and an abundant food supply prior to the onset of harshwinter conditions.
An estimated 12,000 anglers fished 40,000 hours on Cascade Reservoir duringthe 1981-82 winter ice fishery. Yellow perch were harvested in greater numbers thanany other fish species. A seasonal horizontal displacement was observed with yellowperch, rainbow trout, and coho salmon. Generally, all three species were harvested ingreater numbers in the south end of Cascade Reservoir.
ACKNOWLEDGEMENTS
The following personnel played a significant part in this project:
Don Anderson made the early contacts that helped initiate this project andassisted with field work as needed;
Mark Bivens, Larry Dunsmoor, and Bob Griswold assisted with collectionand analysis of fishery and limnological data;
Mc Call Hatchery personnel (Larry Wimer, Bill Hutchinson, and PatChapman) provided the use of the Mc Call Hatchery facilities and provided helpas needed;
Curtis Carney and John Rogers of the Bureau of Reclamation providedflow and storage data for Cascade Reservoir on an "as needed" basis;
Jack Hanson of the Bureau of Reclamation provided historical flows andstorage records for Cascade Reservoir;
Roy Heberger of the U. S. Fish and Wildlife Service provided technicalassistance and limnological survey and an analysis;
Carl Kotner of the U. S. Fish and Wildlife Service assisted with thecollection and analysis of limnological data.
54
LITERATURE CITED
Barica, J. 1975. Summerkill risk in prairie ponds and possibilities of its prediction.Jour. Fish. Res. Board Canada. 32:1283-1288.
and J. A. Mathias. 1979. Oxygen depletion and winterkill risk in small prairielakes under extended ice cover. Jour. Fish. Res. Board Canada. 36:980-986.
Burdick, G. E., H. J. Dean, and E. J. Harris. 1957. Lethal oxygen concentrations foryellow perch. N. Y. Fish and Game J., 4(1):92-101.
Casey, O. E. 1962. The life history of the northern squawfish in Cascade Reservoir. M.S.Thesis, Univ. of Idaho, 52 pp.
Charlton, M. N. 1980. Hypolimnion oxygen consumption in lakes: Discussion ofproductivity and morphometry effects. Canadian Jour. Fish. Aquat. Sci. 37:1531-1539.
Clark, W. H. and J. W. Wroten. 1975. Water quality status report CascadeReservoir, Valley County, Idaho. Idaho Dept. of Health and Welfare Division ofEnvironment. Water Quality Series No. 20.
Cornett, R. J. and F. H. Rigler. 1979. Hypolimnetic oxygendeficits: Their prediction and interpretation. Science 205:580-581.
and F. H. Rigler. 1980. The areal hypolimnetic oxygen deficit: An empericaltest of the model. Limnology and Oceanography. 25:672-679.
Graneli, W. 1978. Sediment oxygen uptake in South Swedish lakes. Oikos 30:7-16.
Hargrave, B. T. 1969. Similarity of oxygen uptake by benthic communities. Limnology andOceanography. 14:801-805.
. 1972. A comparison of sediment oxygen uptake, hypolimnetic oxygendeficit and primary production in Lake Esrom, Denmark. Verh. Internat.Verein. Limnol. 18:134-139.
Horner, N. and B. Rieman. 1981. Cascade Reservoir FisheriesInvestigations. Idaho Dept. of Fish and Game, Project No. F-73-R-3.
Hutchinson, G. E. 1957. A treatise on limnology. Volume I. Geography, Physics andChemistry. John Wiley and Sons. New York.
55
LITERATURE CITED (Continued)
Lasenby, D. C. 1975. Development of oxygen deficits in 14 southern Ontario Lakes.Limnology and Oceanography. 20:993-999.
Mathias, J. A. and J. Barica. 1980. Factors controlling oxygen depletion in ice-covered lakes. Canadian Jour. Fish. Aquat. Sci. 37:185-194.
Moore, W. G. 1942. Field studies on the oxygen requirements of certainfreshwater fishes. Ecology 23(3):319-329.
Moss, D. D. and D. C. Scott. 1961. Dissolved oxygen requirements of three speciesof fish. Trans. Amer. Fish. Soc. 90:377-393.
National Oceanic and Atmospheric Administration, Climatological Data-Idaho1950-1981. Environmental Data and Information Service, NationalClimatic Center, Ashville, N. C.
Papst, M. H. et al. 1980. Relationship between thermal stability and summer oxygendepletion in a prairie pothole lake. Canadian Jour. Fish. Aquat. Sci. 37:1433-1438.
Scott, W. B. and E. J. Crossman. 1973. Freshwater fishes of Canada.Fisheries Research Board of Canada. Bulletin 184.
U. S. Bureau of Reclamation. 1975. Water quality studies Payette River Basin andCascade Reservoir. Region soil and water laboratory, Bureau ofReclamation Southwest Idaho Water Management Study.
Wedemeyer, G. A. et al. 1976. Environmental stress and fish diseases. T. F.H. Publications, Inc. Ltd., New Jersey. 192 pp.
Welch, H. E. 1974. Metabolic rates of arctic lakes. Limnology andOceanography. 19:65-73.
et al. 1976. Factors affecting winter respiration in Ontario Lakes. Jour. FishRes. Board Canada. 33:1809-1815.
Welsh, T. L. 1975. Distribution, survival, and growth of game fish at CascadeReservoir (research). Idaho Fish and Game Dept., Job II-b, F-53-R-10.p. 7-27
1976. Distribution, survival, and growth of game fish at CascadeReservoir (research). Idaho Dept. of Fish and Game, Job II-b, F-53-R-11.p. 2-23.
56

A P P E N D I X
57


Appendix B-1 . Catch rates ( f i s h / h o u r ) , estimated angler use (numbers of fishermen), estimated angler hours, and to ta lestimated catch of rainbow trout and coho salmon taken by anglers from Area I and Area I I I of CascadeReservoir, Idaho, from December 1981 to April 1982.
Rainbow trout Coho SalmonArea I Area I I I Area I Area I I I Area I Area I I I
Angler Angler Angler Angler Catch Total Catch Total Catch Total Catch TotalCensus Period Use Hours Use Hours Rate Harvest Rate Harvest Rate Harvest Rate Harvest
(1) Dec.26-Jan.1 -958.5
-628.2 0.110
1050.160
1010.609
5840.023
14(2) Jan.2-Jan.15 963 1926.0 73 219.0 0.160 223 0.037 8 0.410 790 - 0(3) Jan.16-Jan.29 1408 6476.0 688 2977.0 0.055 356 0.103 307 0.080 518 0.009 27(4) Jan.30-Feb.12 1626 3789.8 612 1468.8 0.074 280 0.051 75 0.062 235 0.010 15(5) Feb.13-Feb.26 382 1234.0 32 186.0 0.096 118 0.071 13 0.173 213 0.009 2(6) Feb.27-Mar.12 395 1791.0 256 1196.0 0.096 172 0.019 23 0.108 193 - 0(7) Mar.13-Mar.26 729 4623.8 613 1839.0 0.185 855 0.063 116 0.142 656 0.004 7(8) Mar.27-Apr.9 1571 1602.6 73 87.2 0.314 503 0.032 3 0.067 107 - 0(9) Apr.10-Apr.23 1516 6821.6 835 2002.8 0.20 1364 0.020 40 0.114 778 - 0
Total 8590 29223.3 3182 10604.0 - 3976 - 686 - 4074 - 65Mean 1074 3247.0 393 1178.2 0.143 442 0.062 76 0.196 453 0.006 7
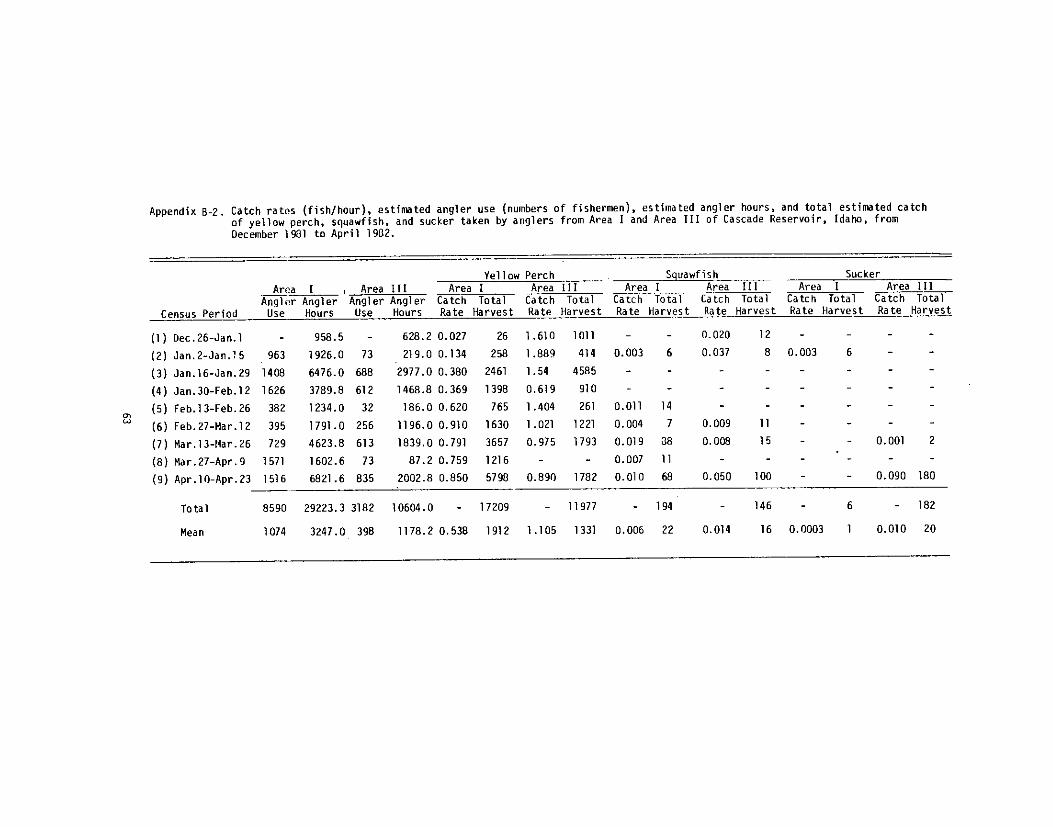

Appendix C-1. Location descriptions for creel census Areas I, II and III on Cascade Reservoir,Idaho, and the description of various marked and unmarked groups of rainbowtrout and coho salmon released into Cascade Reservoir during 1980 and 1981.These descriptions apply to all tables in Appendix C.
Area I - From the south end of the reservoir north to a transect running due west from CrownPoint to French Creek,
Area II - From the Crown Point/French Creek transect north to a transect running due west from theSugarloaf Boatramp.
Area III - From the Sugarloaf Boatramp transect north.
LV - Left ventral fin clipped catchable rainbow released at Tamarack Falls and SugarloafBoatramp in September.
RV - Right ventral fin clipped catchable rainbow released at Tamarack Falls and Lake Fork CreekBridges in May.
No dorsal - Catchable rainbow released in prior years.
Bent ray - Rainbow released as fingerlings or catchables in prior years. Good dorsal -
Rainbow of either native or fingerling release origin.
Green - Fluorescent grit marked rainbow and coho fingerlings released at Tamarack Falls.
Red - Fluorescent grit marked rainbow and coho fingerlings released at Sugarloaf Boa tramp.
Yellow - Fluorescent grit marked rainbow and coho fingerlings released at City and CabartonBoatramps.
Unknown mark - Fingerling coho released in 1980 and 1981 with no visible mark. No mark - Coho
released as fingerlings in prior years.
64

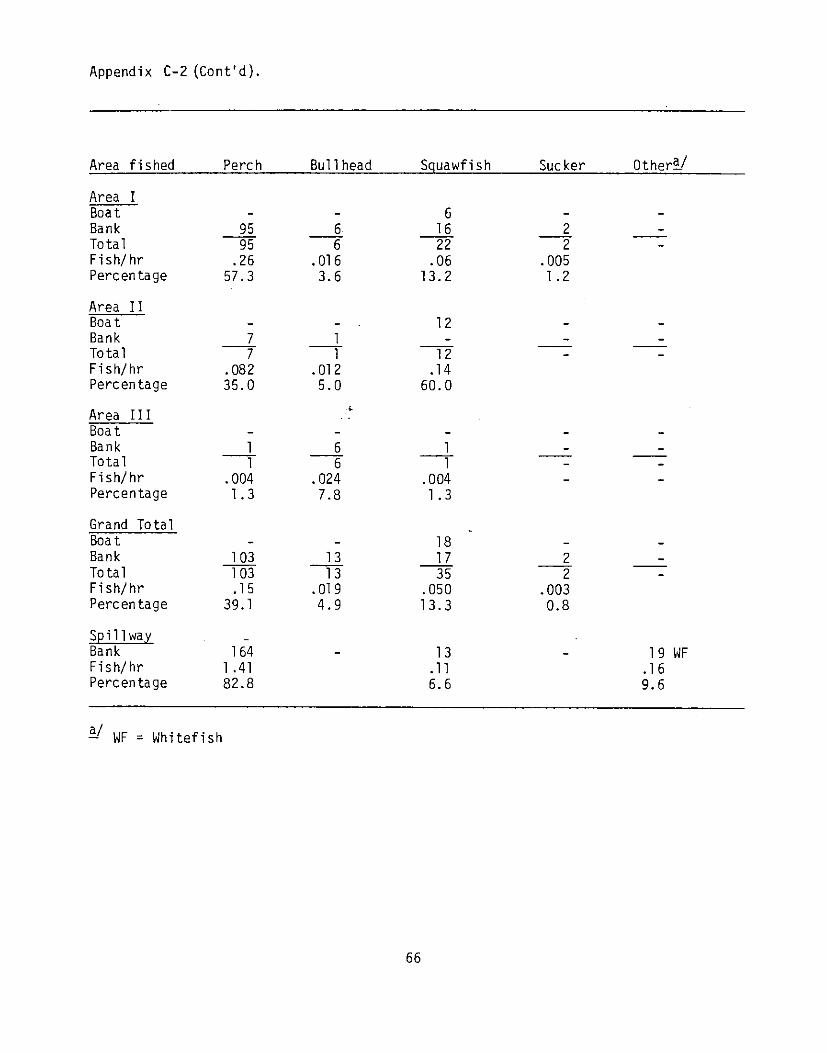


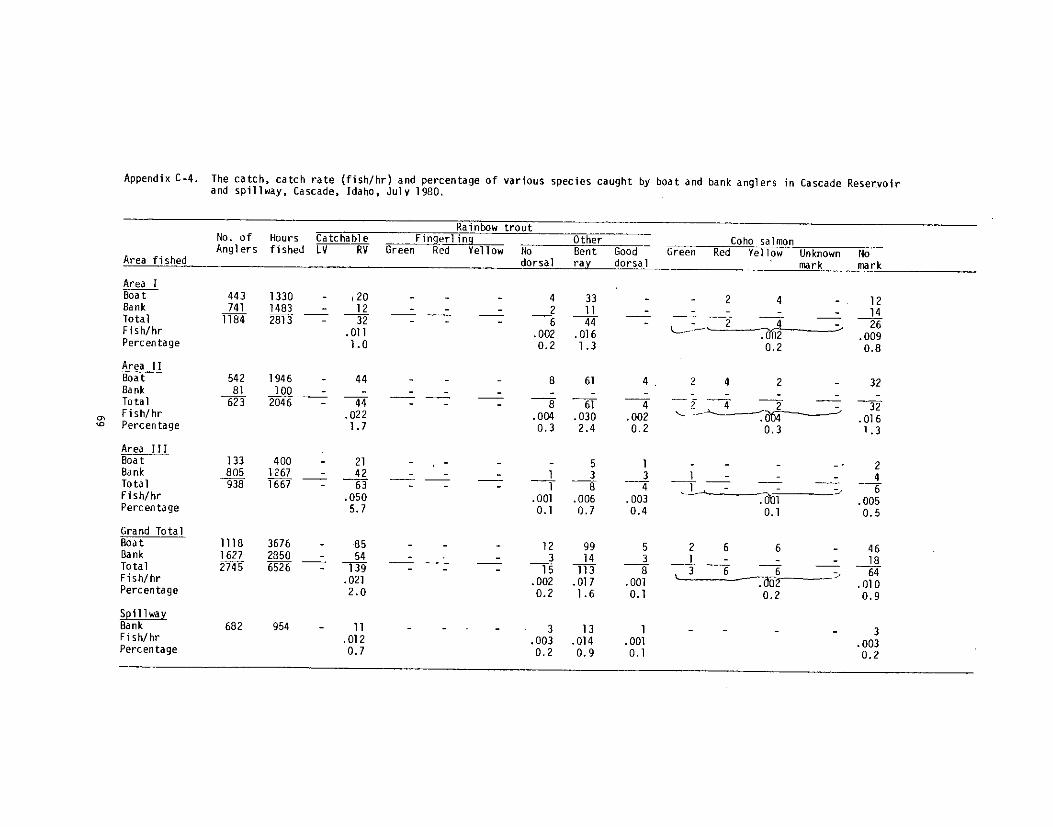


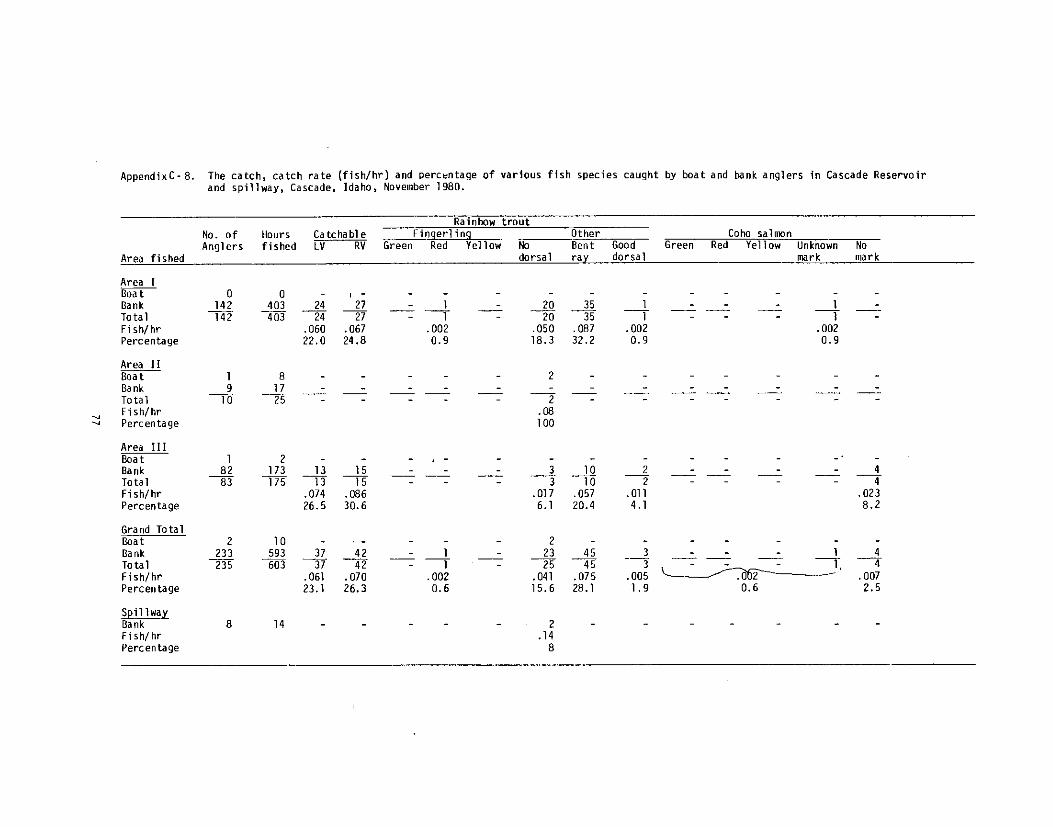


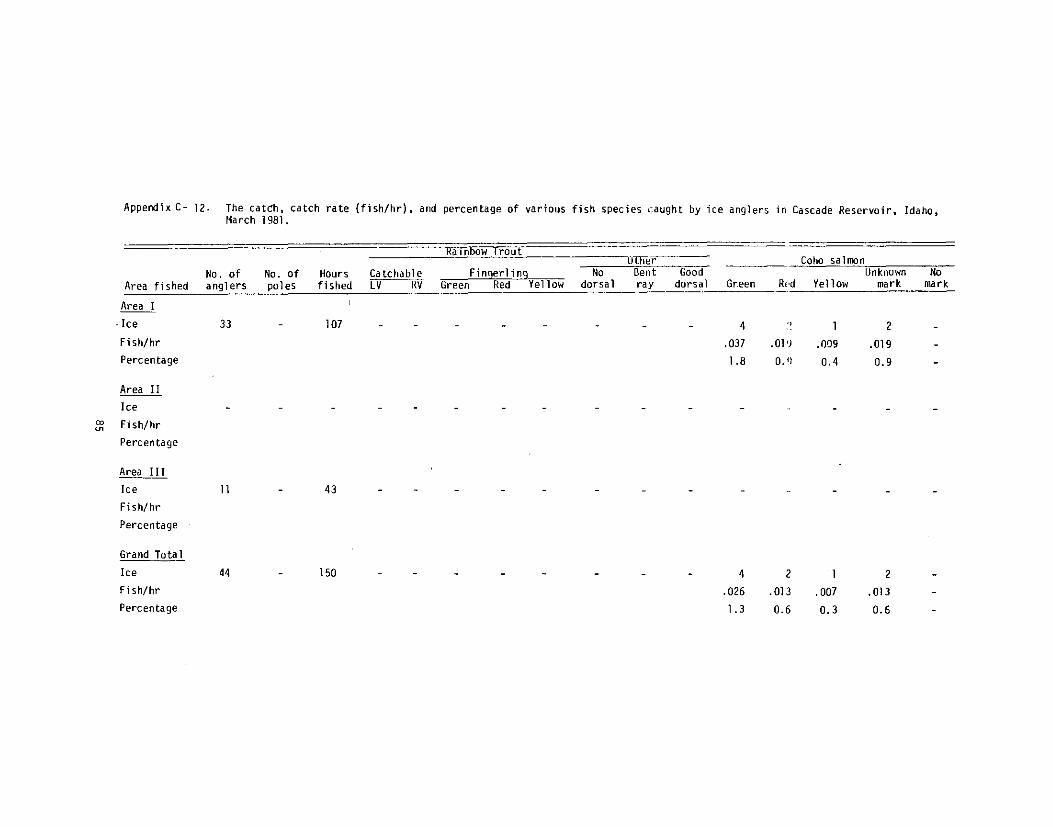


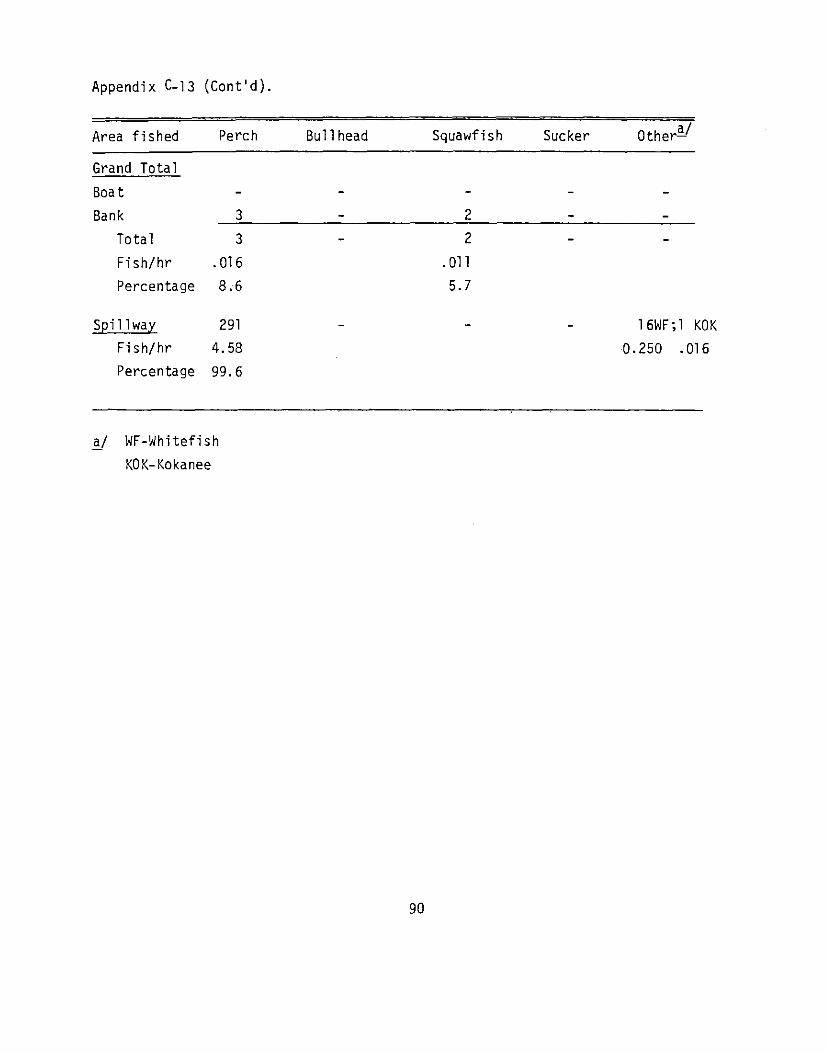


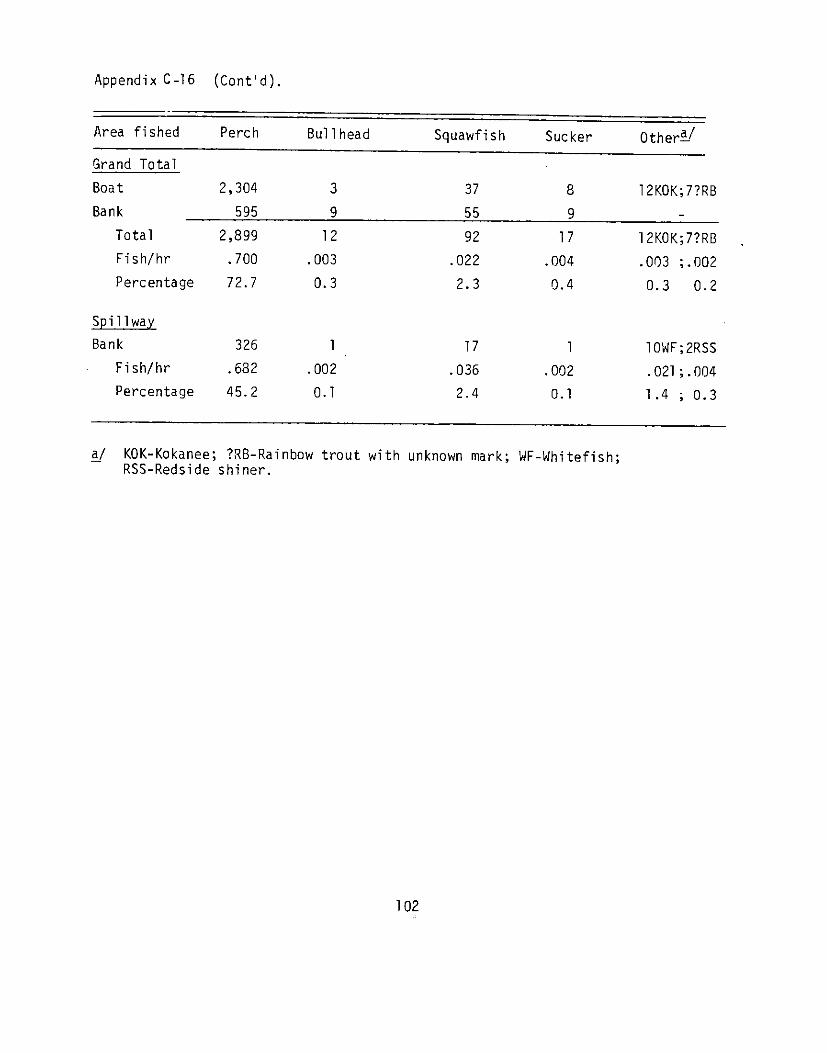


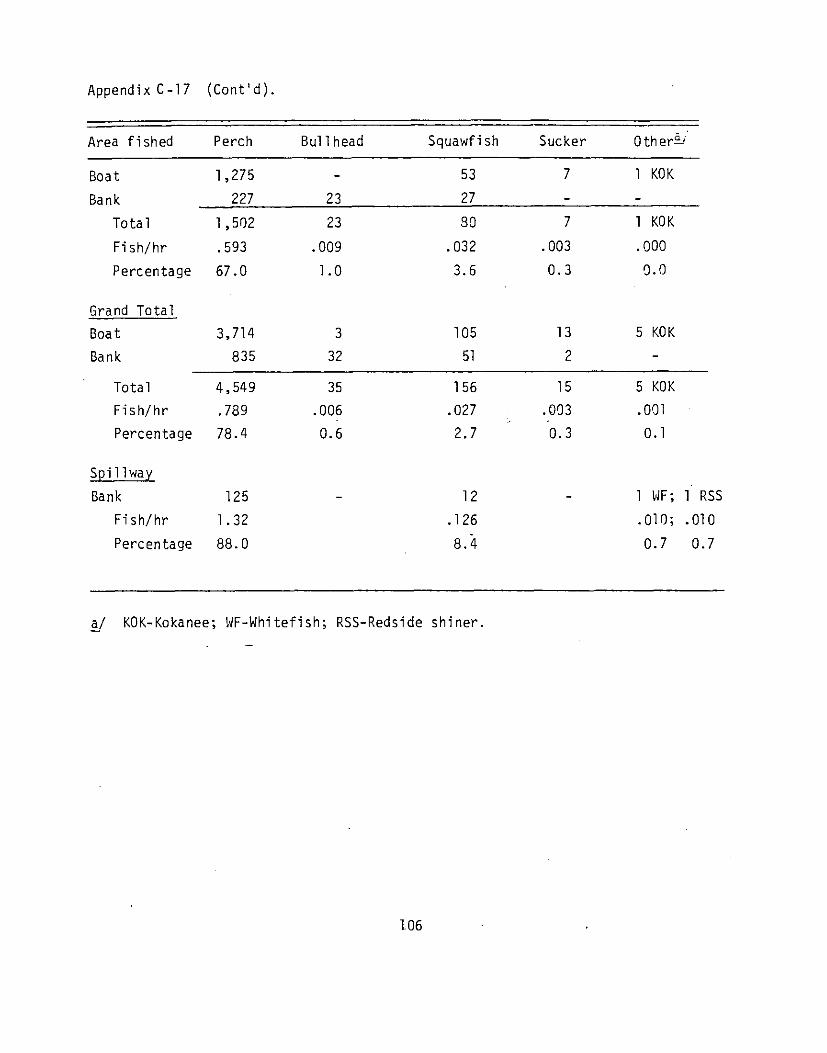
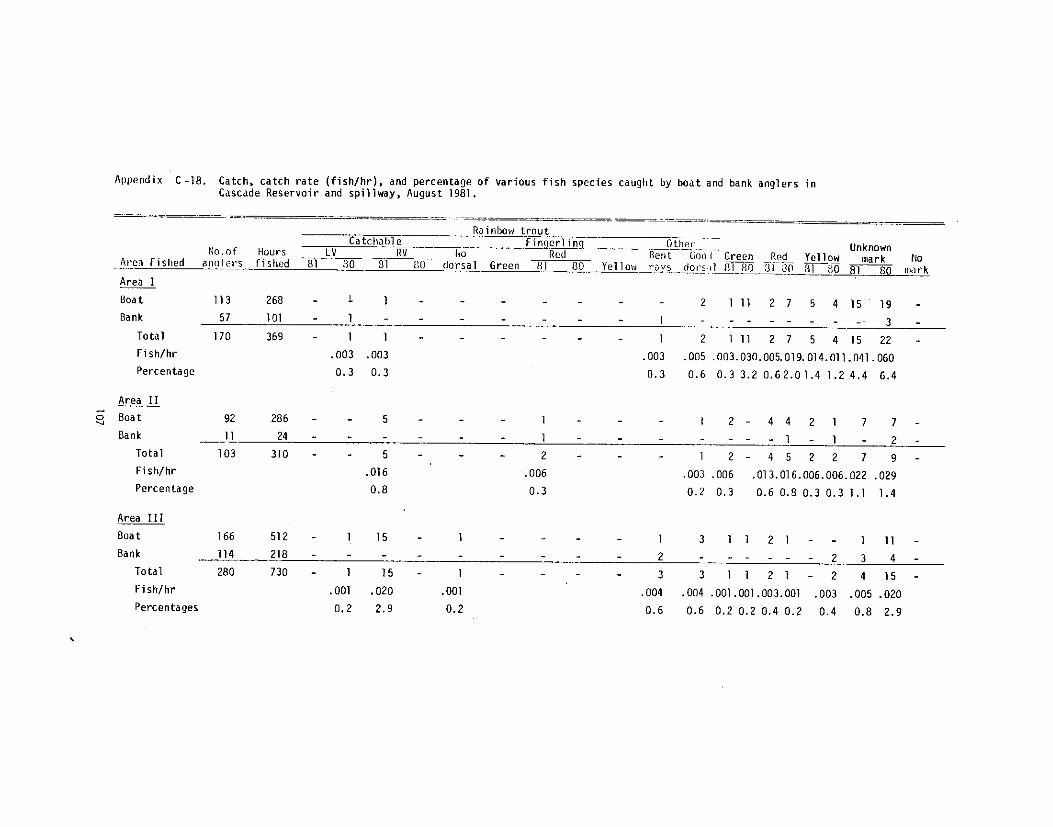

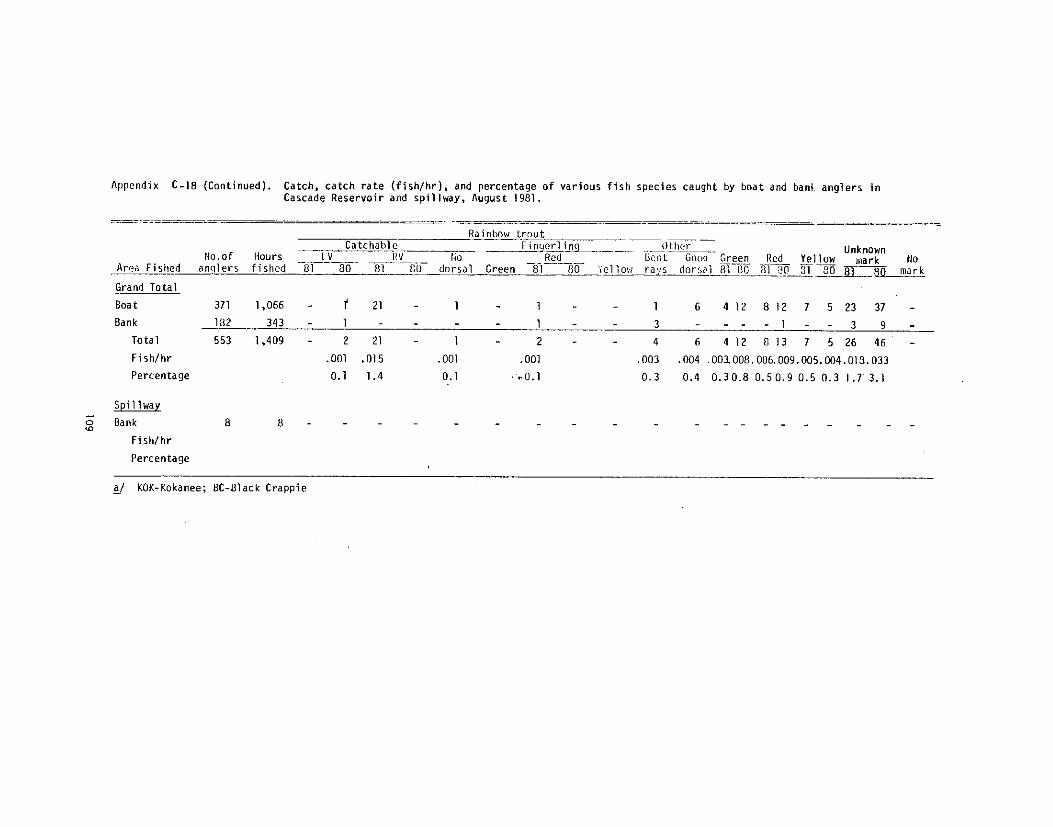
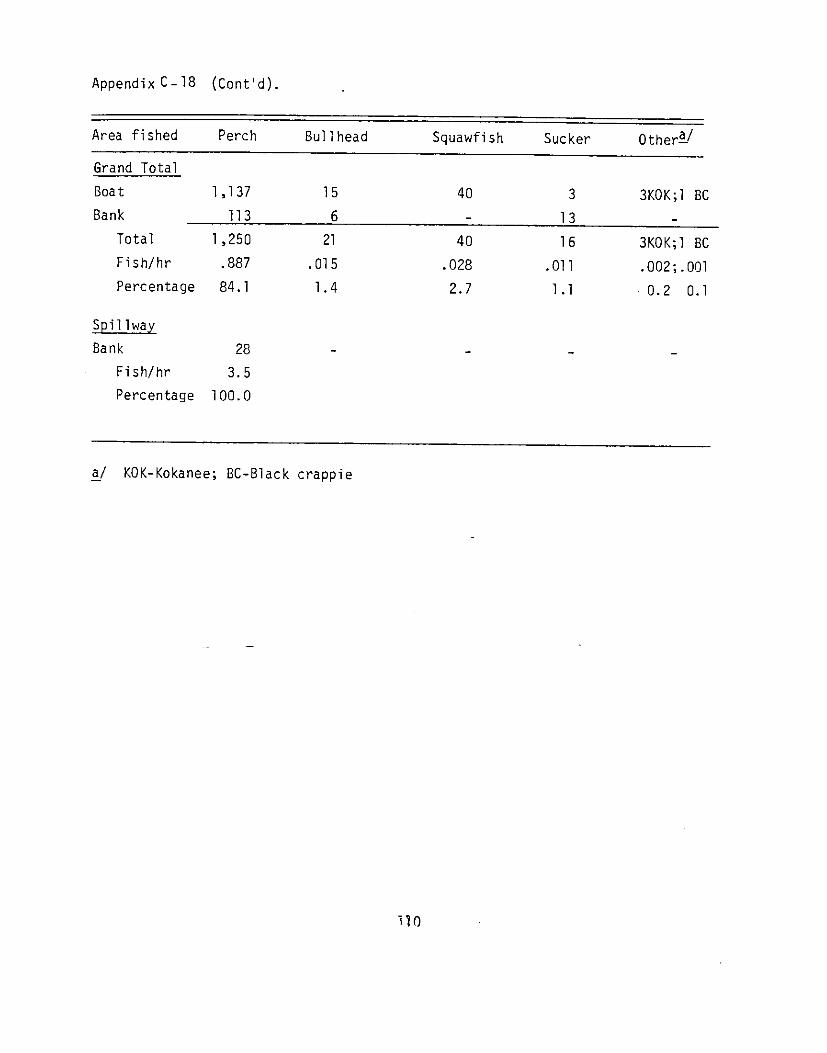
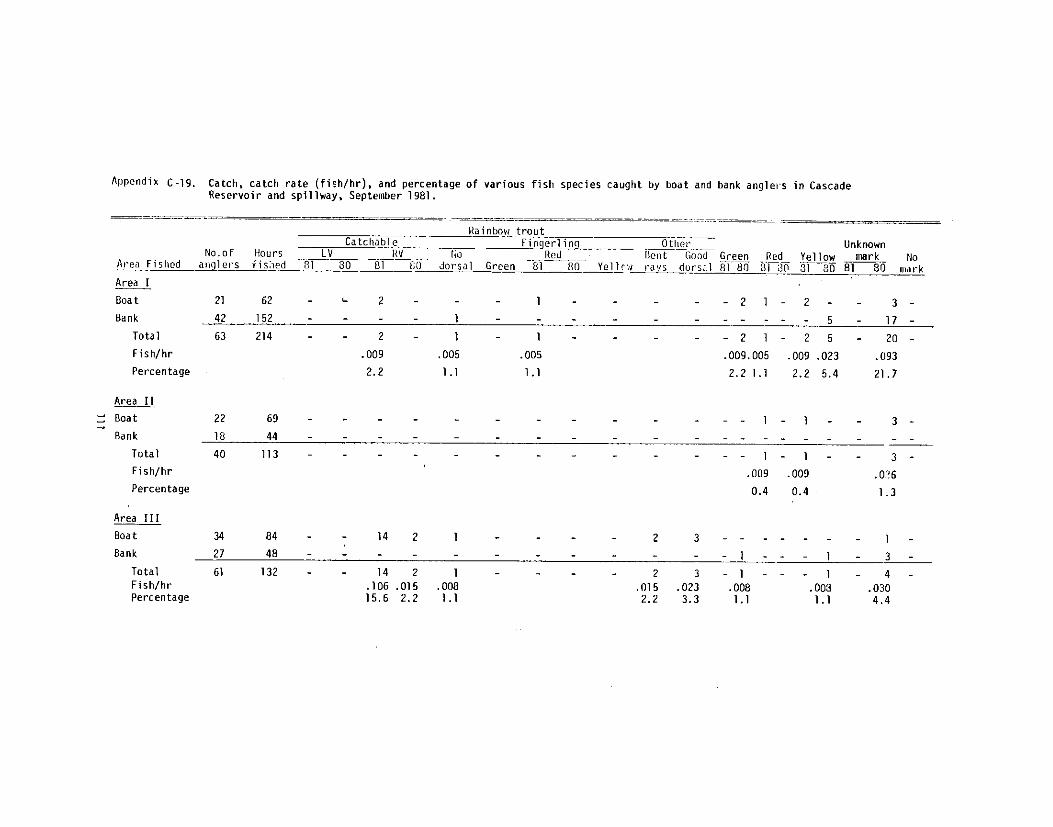

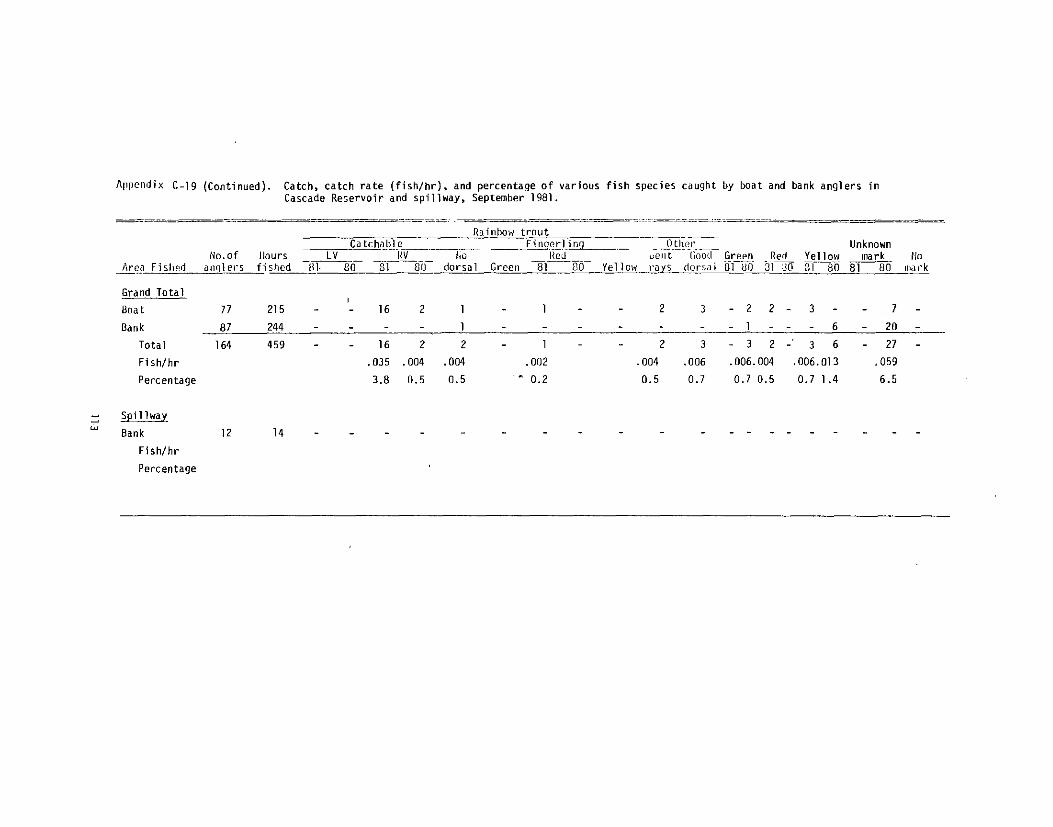

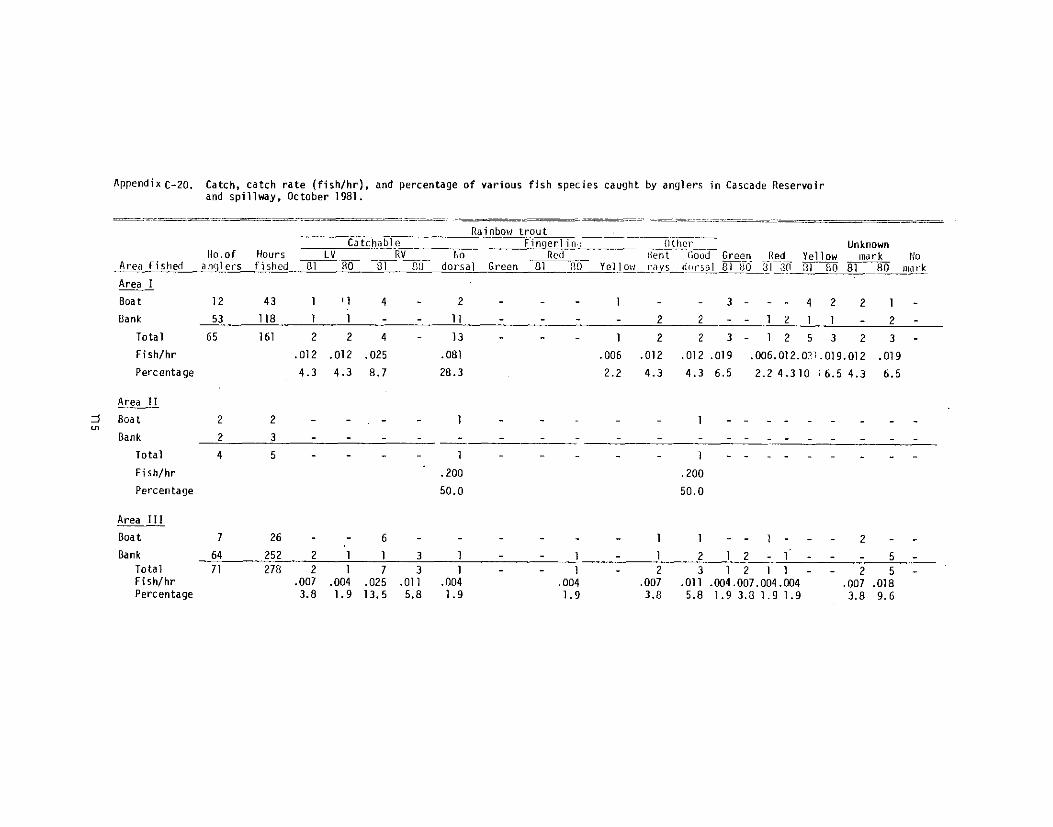
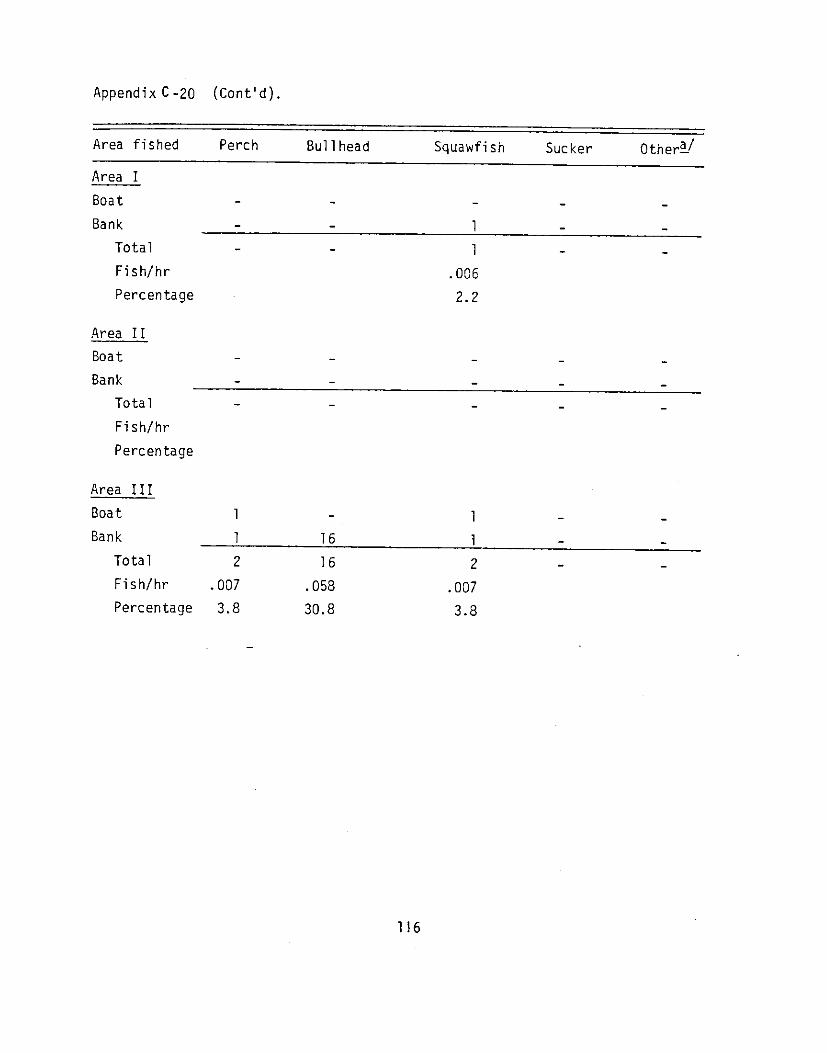


Submitted by: Approved by:
IDAHO DEPARTMENT OF FISH AND GAME
Bruce ReiningerFishery Research Biologist
Bruce RiemanPrincipal Fishery Research Biologist
and
Ned HornerRegional Fishery Biologist


![2011Economic!Impact!of! ï Whitewater!Park!in!Cascade,!Idaho!...Aug 15, 2018 · Acknowledgements.! Withthankstothe 2011!teamat < o o Ç [ t Z ] Á !Park!for!their!hospitality! andcooperation:](https://static.fdocuments.in/doc/165x107/60ded1746d7f5d04bb785bed/2011economicimpactof-whitewaterparkincascadeidaho-aug-15-2018-.jpg)