IDAHO DEPARTMENT OF FISH AND GAME Department of Fish and Game, PO ... 72 hours and make arrangements...
31
IDAHO DEPARTMENT OF FISH AND GAME Virgil Moore, Director Project W-170-R-35 Progress Report FURBEARER Study III, Job 1 July 1, 2010 to June 30, 2011 Prepared by: Summer Crea .......................................................................... Technical Records Specialist Compiled and edited by: Craig White, Wildlife Staff Biologist September 2011 Boise, Idaho
-
Upload
phungquynh -
Category
Documents
-
view
217 -
download
3
Transcript of IDAHO DEPARTMENT OF FISH AND GAME Department of Fish and Game, PO ... 72 hours and make arrangements...

IDAHO DEPARTMENT OF FISH AND GAME
Virgil Moore, Director
Project W-170-R-35
Progress Report
FURBEARER
Study III, Job 1
July 1, 2010 to June 30, 2011 Prepared by: Summer Crea .......................................................................... Technical Records Specialist
Compiled and edited by: Craig White, Wildlife Staff Biologist
September 2011 Boise, Idaho

Findings in this report are preliminary in nature and not for publication without permission of the Director of the Idaho Department of Fish and Game. The Idaho Department of Fish and Game adheres to all applicable state and federal laws and regulations related to discrimination on the basis of race, color, national origin, age, gender, or handicap. If you feel you have been discriminated against in any program, activity, or facility of the Idaho Department of Fish and Game, or if you desire further information, please write to: Idaho Department of Fish and Game, PO Box 25, Boise, ID 83707; or the Office of Human Resources, U.S. Fish and Wildlife Service, Department of the Interior, Washington, DC 20240. This publication will be made available in alternative formats upon request. Please contact the Idaho Department of Fish and Game for assistance.

W-170-R-35 Furbearer PR11.doc i
TABLE OF CONTENTS
STUDY OBJECTIVES ....................................................................................................................1
PROCEDURES AND ACCOMPLISHMENTS..............................................................................1
ABSTRACT .....................................................................................................................................1
METHODS ......................................................................................................................................2
MANDATORY TRAPPER HARVEST REPORTS .................................................................2
CITES EXPORT TAGS ............................................................................................................2
NON-TARGET CATCHES.......................................................................................................3
STATEWIDE RESULTS ................................................................................................................4
TRAPPING LICENSE SALES .................................................................................................4
CATCH-PER-UNIT-EFFORT ..................................................................................................4
MANDATORY TRAPPER HARVEST REPORTS .................................................................4
MANDATORY BOBCAT TAGGING AND HARVEST REPORTS .....................................5
MANDATORY RIVER OTTER TAGGING AND HARVEST REPORTS ............................5
REPORTED NON-TARGET CATCHES .................................................................................5
FURBEARER DEPREDATION ...............................................................................................5
ADMINISTRATIVE ACTIVITIES AND COORDINATION .................................................6
MANAGEMENT ACTIONS ....................................................................................................6
LITERATURE CITED ....................................................................................................................7
6BAPPENDIX A ................................................................................................................................19
LIST OF TABLES
Table 1. Trapping license sales and usable harvest reports received from trappers, 1983-1994 through 2010-2011. .......................................................................................................8
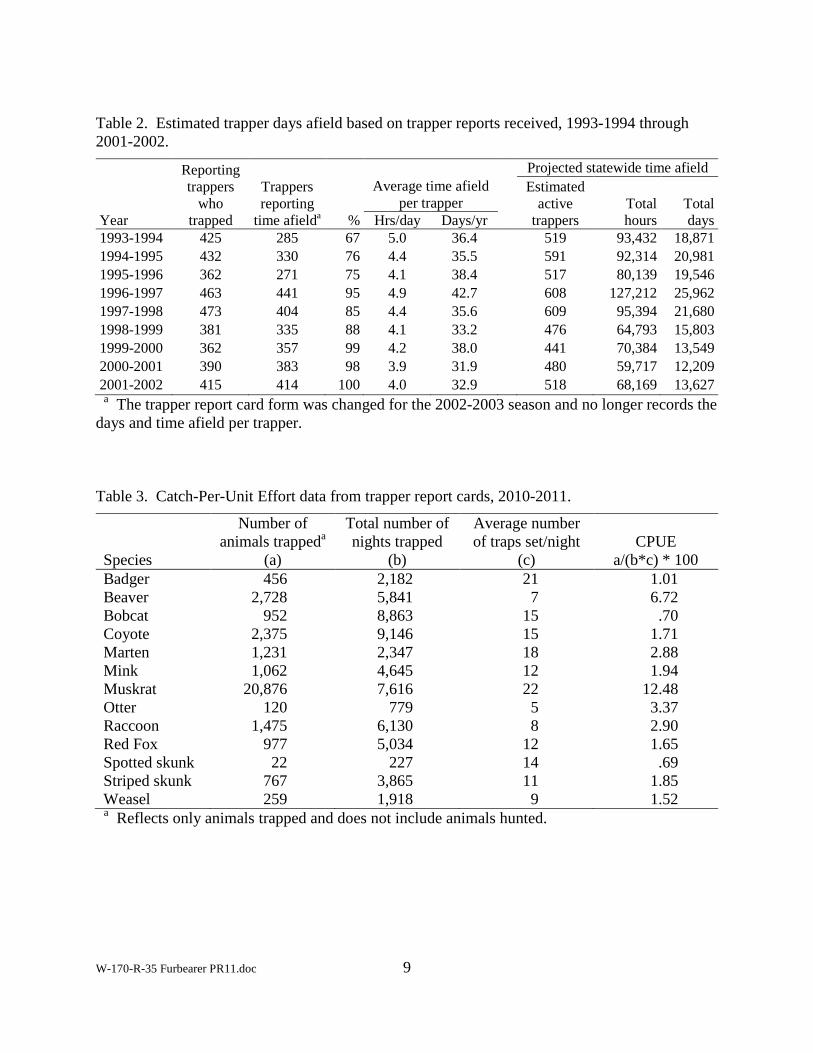
Table 2. Estimated trapper days afield based on trapper reports received, 1993-1994 through 2001-2002. ..........................................................................................................................9
Table 3. Catch-Per-Unit Effort data from trapper report cards, 2010-2011. ..................................9
Table 4. Catch-Per-Unit Effort based on trappers reporting they trapped, 2002-2003 through 2010-2011. ........................................................................................................................10
Table 5. Statewide harvest and pelt value of furbearers trapped based on trappers who reported they trapped, 2010-2011. .................................................................................................11
Table 6. History of statewide rank by value for animals trapped. ................................................12

TABLE OF CONTENTS (Continued)
W-170-R-35 Furbearer PR11.doc ii
Table 7. Distribution of furbearer harvest in Idaho by county, as reported by trappers, 2010-2011. .....................................................................................................................................13
Table 8. Bobcat and lynx pelts tagged with USFWS export tags by IDFG, 1983-1984 through 2010-2011. ........................................................................................................................15
Table 9. Bobcat harvest by method of take reported by Region, 2010-2011. ..............................16
Table 10. Sex and age of harvested bobcats, based on examination of canines and cementum analyses, 1989-1990 through 1999-2000. ....................................................................16
Table 11. Summary of river otters trapped and tagged in Idaho, 2010-2011. ..............................17
Table 12. Sex distribution of river otters harvested in Idaho, 2010-2011. ...................................17
Table 13. Fisher and otter caught accidentally by trappers and turned in for a reward, 1992-1993 through 2010-2011. .....................................................................................................18
W-170-R-35 Furbearer PR11.doc 1
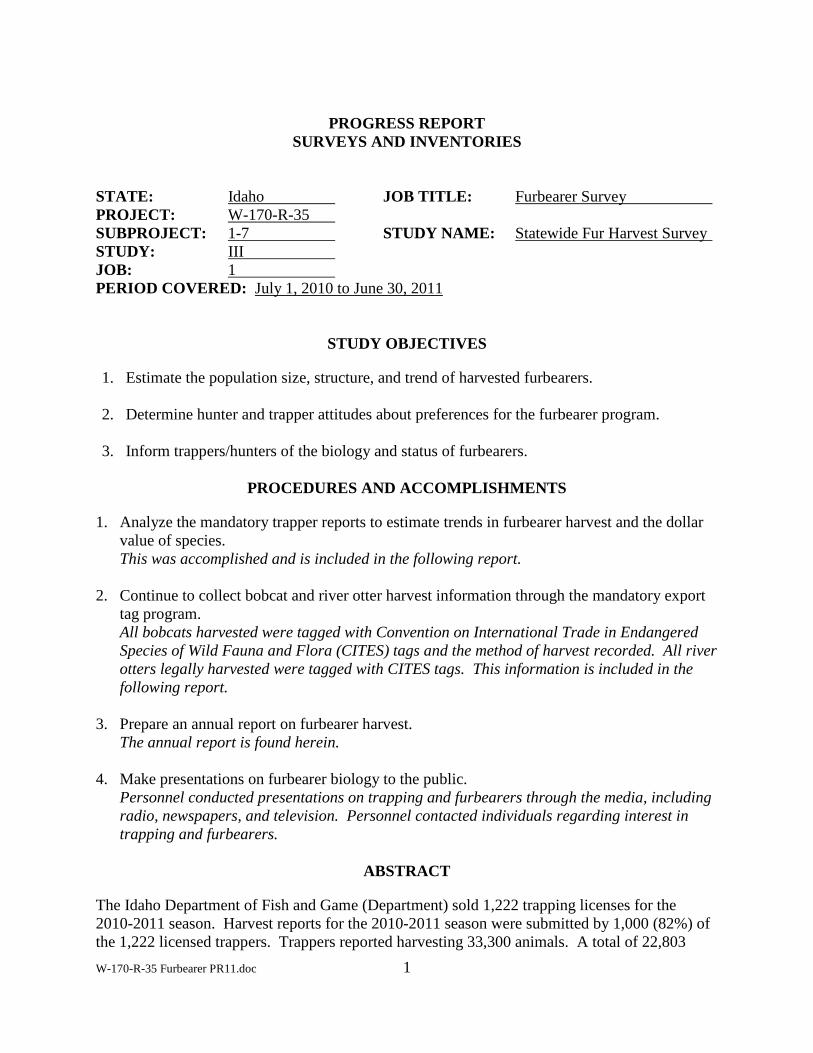
PROGRESS REPORT SURVEYS AND INVENTORIES
STATE: UIdaho U JOB TITLE: UFurbearer Survey PROJECT: UW-170-R-35 SUBPROJECT: U1-7 U STUDY NAME: UStatewide Fur Harvest Survey STUDY: UIII JOB: U1 PERIOD COVERED: UJuly 1, 2010 to June 30, 2011
STUDY OBJECTIVES
1. Estimate the population size, structure, and trend of harvested furbearers. 2. Determine hunter and trapper attitudes about preferences for the furbearer program.
3. Inform trappers/hunters of the biology and status of furbearers.
PROCEDURES AND ACCOMPLISHMENTS
1. Analyze the mandatory trapper reports to estimate trends in furbearer harvest and the dollar value of species. This was accomplished and is included in the following report.
2. Continue to collect bobcat and river otter harvest information through the mandatory export tag program. All bobcats harvested were tagged with Convention on International Trade in Endangered Species of Wild Fauna and Flora (CITES) tags and the method of harvest recorded. All river otters legally harvested were tagged with CITES tags. This information is included in the following report.
3. Prepare an annual report on furbearer harvest. The annual report is found herein.
4. Make presentations on furbearer biology to the public. Personnel conducted presentations on trapping and furbearers through the media, including radio, newspapers, and television. Personnel contacted individuals regarding interest in trapping and furbearers.
ABSTRACT
The Idaho Department of Fish and Game (Department) sold 1,222 trapping licenses for the 2010-2011 season. Harvest reports for the 2010-2011 season were submitted by 1,000 (82%) of the 1,222 licensed trappers. Trappers reported harvesting 33,300 animals. A total of 22,803

W-170-R-35 Furbearer PR11.doc 2
pelts were sold for a value of $490,071.51. Beaver, muskrat, coyote, bobcat, and raccoon, respectively, were the most frequently trapped species. Price per pelt for all harvested species ranged from an average of $319.58 for bobcats to $4.66 for weasels. The top 5 furbearers based upon total dollar value of pelts sold were bobcat, muskrat, coyote, beaver and marten. Bobcat trappers and hunters checked 1,430 animals, up from 971 animals the previous season. The lynx season remained closed. The Department affixed CITES tags to harvested bobcats and otters. A voluntary trapper education program has been developed.
METHODS
Mandatory Trapper Harvest Reports
By Idaho law, licensed trappers are required to report to the Department the number of wild animals they catch, kill, and pelt during the open season (Appendix A) and the amount received for the sale of these pelts. The report must be submitted by 31 July. Any trapper failing to send in a report by this date can be refused a trapper’s license the following year. Until the 1996-1997 season, this information appeared on the back of the trapping license. Once the Department switched to point-of-sale machines for the purchase of licenses, this option was no longer available. A mandatory trapper report card has been used since the 1996-1997 season. This self-addressed, postage-paid folding card is sent to trappers each spring so they may conform to Idaho law. Starting with the 2005-2006 season, trappers were also able to fill out and electronically submit their trapper report card via the Department’s website. Mandatory trapper reports are used to estimate the statewide harvest of furbearers by licensed trappers, the distribution of the harvest, and the market value of the state’s furbearer harvest. Previously, questions on how many days the trapper spent afield scouting and setting/checking traps, and how many hours, on average, the trapper spent afield each day was included. These questions were initially included in the mandatory report beginning with the 1993-1994 trapping season and were used to gather information on trapping effort. Results of this information were then projected to estimate the statewide trapping effort both in total hours and days afield. Beginning with the 2002-2003 trapping season, these questions were changed to include Catch-Per-Unit-Effort (CPUE). CPUE measures the harvest per unit of time and will be useful in predicting population trends. CPUE is based on the premise that as populations decline, fewer animals are available to be trapped; therefore, CPUE should decline, or vice versa, as populations increase, CPUE would increase. CPUE is calculated by multiplying the total number of nights trapped by the average number of traps set per night (for a given species) and then dividing the number of animals trapped by this number. CPUE is recorded as animals trapped per 100 trap nights.
CITES Export Tags
By Commission rule, trappers and hunters are required to have all bobcats tagged with CITES export tags by the Department within 10 days after the close of the trapping/hunting season. During the period 1977-1978 through 1980-1981, CITES export tags were made available to trappers and hunters, but they were not mandatory. Mandatory reporting has been in effect since

W-170-R-35 Furbearer PR11.doc 3
the 1981-1982 season. During the 1979-1980 and 1980-1981 seasons, it was not mandatory to turn in jaws, but the Department issued export tags only when jaws were submitted. Starting with the 2000-2001 season, the Commission directed that it was not mandatory to turn in bobcat jaws. It is unlawful to possess raw, untagged bobcat pelts after 10 days following close of season, and to sell, offer for sale, purchase, or offer to purchase any raw bobcat pelt which does not have an official export tag attached. Trappers and hunters are required to present the pelts of all bobcats to a regional office or official checkpoint to obtain the appropriate pelt tag and complete a harvest report. Information on the harvest report includes the animal’s sex, harvest location, date harvested, method of take (trapping, calling/hunting, with hounds, incidental hunting) and beginning with the 2002-2003 season, CPUE. Mandatory harvest report data continue to be used to estimate the total statewide bobcat harvest by Department administrative region and big game management unit (GMU). The first river otter trapping season since 1972 was authorized during the 2000-2001 trapping season. The Commission originally approved a quota of 100 otters statewide. Once the regional quota was reached, trappers had 48 hours in which to have additional otters tagged, with a maximum allowable harvest statewide set at 121 otters. The harvest quota was changed to 102 animals for the 2002-2003 and 2003-2004 trapping seasons; the individual trapper’s quota was decreased from 5 to 2 river otters. Regional quotas for Magic Valley and Upper Snake were increased to 30 and 15 otters, respectively, for the 2008-2009 and 2009-2010 seasons. Harvest quotas for all Regions except Southeast remained the same for the 2010-2011 and 2011-2012 seasons. Southeast’s quota was increased to 5 otters and the overall state quota was increased to 125 otters for the 2010-2011 and 2011-2012 seasons. By Commission rule, trappers are required to have all river otters tagged with CITES export tags within 72 hours of harvest (Appendix A). Trappers unable to comply with tagging requirements due to special or unique circumstances must report their harvest to the appropriate regional office or field personnel within 72 hours and make arrangements for tagging at the regional office in the region in which the animal was harvested. The otter season for a region closes 72 hours after the harvest quota is met. Trappers are allowed to keep otters within this 72-hour period, provided their personal quota of 2 has not been reached, which may cause the total harvest to exceed harvest quotas. River otters harvested after the season is closed, or otters in excess of the trapper’s personal quota of 2 are surrendered to the Department. Pelts from non-target or incidentally-captured river otters are either processed and used for educational purposes within the regions or sold at the state fur auction.
Non-target Catches
By Commission rule, any trapper who captures and kills a non-target species (any species for which the season is closed) must notify the Department through the local conservation officer or regional office within 72 hours to make arrangements for Department personnel to retrieve the animal. The regulation has been in effect since the 1988-1989 season. Beginning with the 1990-1991 trapping season, the Department paid trappers $5.00 for each accidentally-caught fisher and

W-170-R-35 Furbearer PR11.doc 4
river otter turned in to the Department. Beginning with the 1996-1997 season, trappers also received $5.00 for each accidentally caught lynx or wolverine. Beginning with the 2004-2005 trapping season, the payment increased to $10.00 and included bobcat. Most non-target animals turned in are sold at the Department’s annual fur and horns auction. Since 1991, the proceeds have been earmarked for use in trapper education and trapping management.
STATEWIDE RESULTS
Trapping License Sales
One thousand two hundred and twenty-two trapping licenses (Table 1) were sold for the 2010-2011 season, including 1,213 residents (1,082 adult and 131 junior residents under 18 years-of-age) and 9 non-residents. The number of licenses sold increased by 10% from the previous season.
Catch-Per-Unit-Effort
Questions on how many days the trapper spent afield scouting and checking traps, and how many hours, on average, the trapper spent afield each day, were collected from the 1993-1994 season through the 2001-2002 season (Table 2). Trappers trapped more muskrat and beaver per 100 trap-nights than other species (Table 3) during the 2010-2011 season. Statewide population trends, based upon animals trapped per 100 trap-nights (Table 4), have been declining since implementing the CPUE method. Statewide population trends over the last five years are stable to increasing for muskrat, otter, and spotted skunk. Statewide population trends over the last five years were stable to slightly decreasing for badger, bobcat, coyote, and mink. Trends over the last five years were down for beaver, marten, raccoon, red fox, stripped skunk, and weasel. Badger, skunks, and weasel are usually trapped incidentally to trapping for other species. Some trappers trap specifically for otter, but otters are also trapped incidental to beaver trapping. Many trappers, who report harvest of badger, skunks, weasel, and sometimes otter, do not report trap nights or traps set for these four species since they are trapping for other species. They are not setting traps specifically for these species, thus, CPUE may not be an accurate reflection of population trend for badger, otter, skunks, and weasel.
Mandatory Trapper Harvest Reports
Harvest reports were submitted by 1,000 (82%) of the 1,222 licensed trappers for the 2010-2011 season. The fur harvest, based on 764 reporting trappers who trapped, was 33,300 animals (Table 5), up from 29,491 the previous trapping season. Of this total, 22,803 pelts (68%) were sold for a value of $490,071.51. Trappers sold their pelts for an average of $21.49 each, compared to $14.28 the previous year. Trappers harvested an average of 44 pelts per trapper and sold an average of 30 pelts. Based on an average pelt price of $21.49 and 30 pelts sold per trapper, trappers earned an average income of $644.70, up from $428.40 the previous season.

W-170-R-35 Furbearer PR11.doc 5
The estimated harvest for all trappers, including those who did not submit a report, was 41,799 animals taken and 27,809 pelts sold. The estimated statewide pelt value of pelts sold is $907,742.44, up from $628,968.84 in the previous season. The beaver, muskrat, coyote, bobcat and raccoon, respectively, were the most frequently harvested species. Price per pelt for all harvested species ranged from an average of $319.58 for bobcats ($245.07 in 2009-2010) to $4.66 for weasels ($6.23 in 2009-2010). The top 5 furbearers based upon value of pelts sold were bobcat, muskrat, coyote, beaver and marten (Table 6). Species harvested within a county (Table 7) may be indicative of areas with higher furbearer populations. However, harvest distribution is also partly a function of where trappers live and trap.
Mandatory Bobcat Tagging and Harvest Reports
Trappers and hunters checked 1,430 bobcats (Table 8). The lynx season remained closed. Trappers reported no accidental captures of lynx. More bobcats were harvested from the Southwest Region (25%) than any other region (Table 9). Trapping accounted for 72% of the statewide bobcat harvest, followed by the use of hounds (20%). Submission of bobcat jaws for age analysis (Table 10) was reassessed when the Commission reviewed trapping regulations during spring 2004 and the Commission decided to no longer require mandatory submission of bobcat jaws.
Mandatory River Otter Tagging and Harvest Reports
The Department affixed CITES tags to 117 legally harvested otters, including incidental captures, during the 2010-2011 trapping season (Table 11). Region quotas were not filled in the Southwest, Magic Valley, Upper Snake and Salmon regions. Sex ratio of harvested river otters (Table 12), including incidental captures, was 61% male, 34% female, and sex of 5% were not identified.
Reported Non-target Catches
Trappers were paid $10.00 each for 15 otters (Table 13) and 5 fisher surrendered to the Department for reimbursement. Since the 1990-1991 trapping season, 31 fisher and 432 otter have been turned in for reimbursement. Many of these animals were sold at the Department’s annual auction with proceeds earmarked for trapper education and related projects. Other animals’ pelts are processed and used for educational purposes.
Furbearer Depredation
Beaver continue to be trapped in several regions to address damage complaints. When feasible, these animals are live-trapped and translocated to other areas in attempts to improve riparian habitat or increase the local beaver population. Department conservation officers frequently

W-170-R-35 Furbearer PR11.doc 6
issue Furbearer Depredation Control Permits (Form WL-2) to individuals as a valuable tool in handling beaver and other furbearer damage complaints quickly and efficiently. Beginning in January 1995, Department administrative regions were required to keep accurate records on the number of permits issued and the number of animals removed. Beaver are typically the most common species in which kill permits are issued, followed by muskrat and raccoon.
Administrative Activities and Coordination
Public input on proposed 2010-2011 and 2011-2012 furbearer seasons was collected at regional offices and the state office via a survey on the Department’s website. In January 2010, the Commission set furbearer harvest rules for the 2010-2011 and 2011-2012 seasons. In April 2006, a questionnaire survey on trapper knowledge and use of trapping best management practices (BMPs) was mailed to all trappers (n = 1,197). Fifty-two percent (n = 621) of the trappers responded to the survey. Of the trappers responding to the survey, 52% were familiar with BMPs. Approximately 43% (n = 266) used BMPs during the 2006-2007 trapping season, whereas 14% (n = 86) did not use BMPs, 3% (n = 17) did not trap in 2006-2007 season, and 41% (n = 252) did not respond to the question. Of the trappers using BMPs in the 2006-2007 season, 61% used BMPs for bobcats, 64% for coyotes, 37% for red fox, 32% for raccoon, and 5% said they used BMPs but did not list what species. Of the trappers using BMPs in the 2006-2007 season, 9% used padded jaws, 70% used off-set jaws, 31% used laminated jaws, 26% used wide jaws, 51% used snare loop size, 28% used snare break-away device, and 5% did not select a BMP from the list provided. Sixty-three percent (n = 394) of trappers responding to the survey requested a trapping BMP CD be mailed to them. Twelve percent (n = 74) of trappers were interested in applying to become an instructor for the trapper education program being developed. Department personnel wrote newspaper articles on trapping and furbearers. Personnel responded to information requests by phone, e-mail, or letter regarding interest in trapping and furbearer species. The Department has developed a voluntary trapper education program. A Department trapper education manual was written based upon the trapper education manual prototype developed by the Association of Fish and Wildlife Agencies. A pilot trapper education class was conducted during fall 2007 in the Upper Snake Region. The Department held 3 classes between July 2010- July 2011 and certified 32 individuals. Currently the Department has 45 Certified Trapper Education Instructors.
Management Actions
1. The Southwest region continued to investigate and encourage beaver release sites. 2. Potential beaver relocation sites are being investigated in the Magic Valley Region. 3. The Clearwater Region is studying fisher ecology. From 2006-2010, the Clearwater
Region placed 33 Argos telemetry collars on 26 fishers. Data collected from the fishers constitute the single largest dataset to date on movements and habitat use of fishers in the Northern Rocky Mountains. The Department is working on completing the analysis of

W-170-R-35 Furbearer PR11.doc 7
the data, focusing on 3 topics: habitat selection at the landscape level, habitat selection at the intra-home range level, and implications for forest management and fisher conservation. IDFG is also collaborating with the Rocky Mountain Research Station to explore how fisher genetics are influenced by landscape pattern.
4. Public interviews with presentations were given by regional furbearer coordinators and state coordinator.
5. Public surveys were conducted and input provided by trappers, hunters, and the general public regarding future furbearer harvest seasons.
6. Furbearer habitat improvements are a secondary benefit of the Department’s Habitat Improvement Program (HIP). The HIP objective is to provide technical and financial assistance to private landowners and public land managers who want to enhance upland game bird and waterfowl habitat. HIP projects also benefit many of Idaho’s furbearers. In state fiscal year 2011, 23 HIP projects improved 250 acres of upland, riparian, and wetland habitat.
LITERATURE CITED
Johnson, N. F., B. A. Brown, and J. C. Bosomworth. 1981. Age and sex characteristics of bobcat canines and their use in population assessment. The Wildlife Society Bulletin 9 (3):203-206.

W-170-R-35 Furbearer PR11.doc 8
Table 1. Trapping license sales and usable harvest reports received from trappers, 1983-1994 through 2010-2011.
Licenses Sold Reporting trappers who
trapped
Estimated active
trappersa Season Adult
resident Junior
resident Non-
resident Total Reports
received % % 1983-1984 1,559 15 1,574 930 59 1984-1985 1,485 23 1,508 664 44 1985-1986 1,370 23 1,393 1,071 77 1986-1987 1,473 24 1,497 1,112 73 1987-1988 1,564 30 1,594 1,338 86 1988-1989 1,266 22 1,288 1,045 81 1989-1990 921 17 938 722 77 1990-1991 636 7 643 508 79 1991-1992 678 8 686 478 70 1992-1993 666 7 673 525 78 1993-1994 588 8 596 489 82 425 87 518 1994-1995 738 10 748 547 73 432 79 591 1995-1996 631 7 638 445 70 362 81 518 1996-1997 772 7 779 590 76 463 78 610 1997-1998 740 130 12 752 586 78 473 81 609 1998-1999 612 110 14 626 502 80 381 76 476 1999-2000 451 98 9 558 459 82 362 79 441 2000-2001 504 97 6 607 492 81 390 79 480 2001-2002 546 91 10 647 519 80 415 80 518 2002-2003 690 126 8 824 657 80 513 78 643 2003-2004 835 130 10 975 791 81 615 78 761 2004-2005 871 137 14 1,022 749 73 590 79 807 2005-2006 858 131 12 1,001 733 73 580 79 791 2006-2007 1,042 132 26 1,200 839 70 662 79 948 2007-2008 1,015 112 23 1,150 919 80 649 71 817 2008-2009 1,091 112 15 1,218 864 71 643 74 901 2009-2010 992 111 11 1,114 843 76 658 78 869 2010-2011 1,082 131 9 1,222 1,000 82 764 76 929 a Estimated active trappers is determined by multiplying the number of licenses sold by the percent of trappers who reported that they actually trapped, based on the total number of reports received.
W-170-R-35 Furbearer PR11.doc 9
Table 2. Estimated trapper days afield based on trapper reports received, 1993-1994 through 2001-2002.
Year
Reporting trappers
who trapped
Trappers reporting
time afielda %
Average time afield
per trapper
Projected statewide time afield Estimated
active trappers
Total hours
Total days Hrs/day Days/yr
1993-1994 425 285 67 5.0 36.4 519 93,432 18,871 1994-1995 432 330 76 4.4 35.5 591 92,314 20,981 1995-1996 362 271 75 4.1 38.4 517 80,139 19,546 1996-1997 463 441 95 4.9 42.7 608 127,212 25,962 1997-1998 473 404 85 4.4 35.6 609 95,394 21,680 1998-1999 381 335 88 4.1 33.2 476 64,793 15,803 1999-2000 362 357 99 4.2 38.0 441 70,384 13,549 2000-2001 390 383 98 3.9 31.9 480 59,717 12,209 2001-2002 415 414 100 4.0 32.9 518 68,169 13,627 a The trapper report card form was changed for the 2002-2003 season and no longer records the days and time afield per trapper. Table 3. Catch-Per-Unit Effort data from trapper report cards, 2010-2011.
Species
Number of animals trappeda
(a)
Total number of nights trapped
(b)
Average number of traps set/night
(c) CPUE
a/(b*c) * 100 Badger 456 2,182 21 1.01 Beaver 2,728 5,841 7 6.72 Bobcat 952 8,863 15 .70 Coyote 2,375 9,146 15 1.71 Marten 1,231 2,347 18 2.88 Mink 1,062 4,645 12 1.94 Muskrat 20,876 7,616 22 12.48 Otter 120 779 5 3.37 Raccoon 1,475 6,130 8 2.90 Red Fox 977 5,034 12 1.65 Spotted skunk 22 227 14 .69 Striped skunk 767 3,865 11 1.85 Weasel 259 1,918 9 1.52
a Reflects only animals trapped and does not include animals hunted.

W-170-R-35 Furbearer PR11.doc 10
Table 4. Catch-Per-Unit Effort based on trappers reporting they trapped, 2002-2003 through 2010-2011.
CPUE by species
Year Badger Beaver Bobcat Coyote Marten Mink Muskrat Otter Raccoon Red Fox
Spotted skunk
Striped skunk Weasel
2002-2003 1.88 8.41 .81 2.09 4.14 2.47 20.86 2.98 2.46 3.40 .94 3.50 1.53 2003-2004 3.14 9.50 1.00 3.15 3.72 3.29 11.96 2.62 4.45 3.00 2.24 5.53 4.57 2004-2005 1.64 8.21 .68 2.46 4.64 1.98 12.97 2.60 3.34 2.84 2.04 4.01 1.72 2005-2006 .85 8.39 .70 2.10 4.09 1.96 15.42 2.17 2.78 3.05 .98 3.69 2.71 2006-2007 1.12 8.00 .85 2.23 4.07 2.23 11.70 2.13 3.24 2.26 .51 2.69 2.24 2007-2008 1.10 7.04 .58 1.19 2.87 1.25 10.92 1.71 2.66 2.05 0 1.90 1.04 2008-2009 1.30 6.32 .42 2.18 2.74 1.62 13.11 1.71 2.35 1.93 .93 2.75 .78 2009-2010 .83 5.28 .47 1.76 3.04 1.30 11.97 .60 1.78 1.87 .36 1.89 1.55 2010-2011 1.01 6.72 .70 1.71 2.88 1.94 12.48 3.37 2.90 1.65 .69 1.85 1.52

W-170-R-35 Furbearer PR11.doc 11
Table 5. Statewide harvest and pelt value of furbearers trapped based on trappers who reported they trapped, 2010-2011.
Species
Trappers reporting a harvest
Animals trapped
Pelts/ trappera
Animals harvested
Total Animals
trapped & harvested
(a)
Animals sold (b)
% Sold (b / a)
Money received
(c)
Price/ Peltb
(c / b = d)
Total value
(b x d = e)
Estimated statewide pelt valuec
(e / .82) % of total
value Badger 88 456 5 45 501 328 66% $8,407.97 $25.63+ $12,840.63 $15,659.30 1.73% Beaver 363 2,728 8 0 2,728 1,421 52% $21,173.08 $14.90- $40,647.20 $49,569.76 5.46% Bobcatd 297 952 3 48 1,000 708 71% $226,260.36 $319.58+ $319,570.00 $389,719.51 42.93% Coyote 336 2,375 7 722 3,097 1,661 54% $59,483.47 $35.81+ $110,934.54 $135,286.02 14.90% Marten 98 1,231 13 0 1,231 912 74% $29,828.56 $32.71+ $40,266.01 $49,104.89 5.41% Mink 217 1,062 5 0 1,062 645 61% $8,054.95 $12.49+ $13,264.38 $16,176.07 1.78% Muskrat 356 20,876 59 0 20,876 15,625 75% $112,633.24 $7.21+ $150,515.96 $183,556.05 20.22% Otterd 74 120 2 0 120 22 18% $1,323.28 $60.15+ $7,218.00 $8,802.44 .97% Raccoon 279 1,475 5 44 1,519 615 41% $6,442.10 $10.47+ $15,903.93 $19,395.04 2.14% Red Fox 200 977 5 66 1,043 597 57% $14,727.38 $24.67+ $25,730.81 $31,379.04 3.46% Spotted Skunk 9 22 2 0 22 0 0% $0.00 $0.00 $0.00 0.00% Striped Skunk 132 767 6 42 809 160 20% $1,228.78 $7.68- $6,213.12 $7,576.98 0.83% Weasel 69 259 4 8 267 109 41% $508.34 $4.66- $1,244.22 $1,517.34 0.17%
Actual Total (82%) 33,300 -- 975 34,275 22,803 -- $490,071.51 $21.49+ $744,348.80 -- -- Estimated Total (100%) 40,160 -- 1,189 41,799 27,809 -- $597,648.18 -- -- $907,742.44 100.00%
a Pelts/trapper is determined by animals trapped only. b Plus and minus reflects upward or downward trends in pelt value. c Estimated totals and statewide pelt values were determined based on the assumption that the harvest reported by trappers
represented 82% of actual harvest if all active trappers had submitted a harvest report. d Reflects only the number reported by trappers on the mandatory report card.

W-170-R-35 Furbearer PR11.doc 12
Table 6. History of statewide rank by value for animals trapped.
Speciesa
Season Badger Beaver Bobcat Coyote Marten Mink Muskrat Otterb Raccoon Red fox
Spotted skunk
Striped skunk Weasel
1992-1993 9 3 2 1 7 6 5 8 4 10 1993-1994 9 3 4 1 6 7 5 8 2 10 1994-1995 10 3 4 2 6 7 5 8 1 9 11 1995-1996 9 3 5 4 7 8 2 6 1 11 10 1996-1997 9 2 3 4 8 7 1 6 5 12 10 11 1997-1998 9 1 3 5 8 7 2 6 4 12 10 11 1998-1999 9 1 2 5 8 7 4 6 3 12 10 11 1999-2000 9 2 1 5 10 7 4 8 3 12 6 11 2000-2001 11 3 1 4 6 9 5 8 7 2 13 10 12 2001-2002 11 3 1 4 10 8 5 7 6 2 9 12 2002-2003 11 4 1 3 6 10 5 8 7 2 12 9 13 2003-2004 8 4 1 2 6 11 5 9 7 3 13 10 12 2004-2005 11 3 1 2 6 9 5 8 7 4 10 12 2005-2006 11 3 1 2 5 7 4 8 9 6 13 10 12 2006-2007 9 4 1 2 5 8 3 10 7 6 13 11 12 2007-2008 8 3 1 2 4 9 5 10 6 7 11 12 2008-2009 10 2 1 4 5 8 3 9 7 6 13 11 12 2009-2010 10 4 1 3 5 8 2 9 7 6 13 11 12 2010-2011 9 4 1 3 5 8 2 10 7 6 13 11 12
a Non-target “other” species trapped are excluded from this ranking. b Otter was not included on the trapper report card until 2000-2001.

W-170-R-35 Furbearer PR11.doc 13
Table 7. Distribution of furbearer harvest in Idaho by county, as reported by trappers, 2010-2011.
Species
County Badger Beaver Bobcat Coyote Marten Mink Muskrat Otter Raccoon Red Fox
Spotted skunk
Striped skunk Weasel
Ada 52 131 5 60 102 654 83 51 2 132 1 Adams 15 16 46 13 3 2 1 19 14 1 Bannock 42 4 70 28 419 3 33 13 24 1 Bear Lake 1 100 18 39 99 1259 1 84 8 19 67 Benewah 120 9 35 7 444 10 2 6 Bingham 4 108 41 31 40 454 4 77 13 18 Blaine 1 128 14 24 6 1 44 1 16 10 1 Boise 2 27 12 5 92 2 2 35 2 Bonner 138 25 16 18 13 120 2 22 1 7 12 Bonneville 1 198 5 16 46 15 517 49 11 1 6 Boundary 67 39 11 22 2 306 8 6 14 5 Butte 13 38 80 14 Camas 17 14 104 41 30 151 50 1 Canyon 131 150 2 39 178 3884 1 76 97 75 1 Caribou 12 290 2 113 61 1013 29 28 5 46 57 Cassia 7 13 18 212 5 33 30 2 8 14 1 28 2 Clark 1 20 7 47 100 7 9 Clearwater 41 29 20 10 7 64 3 14 11 15 Custer 198 48 37 147 6 114 6 30 36 2 Elmore 38 89 24 214 65 12 556 9 15 144 5 34 6 Franklin 11 35 10 38 54 1260 149 15 14 1 Fremont 2 45 11 112 9 226 3 73 27 9 12 Gem 3 49 1 26 34 368 2 11 6 2 Gooding 36 82 10 91 71 1562 3 123 40 2 47 Idaho 1 15 131 76 30 16 87 27 33 8 17 1 Jefferson 26 4 9 8 6 511 28 3 7 6 Jerome 2 10 1 27 Kootenai 53 31 42 13 569 4 30 3 1 Latah 50 8 61 5 163 9 24 34 13

Table 7. Continued.
W-170-R-35 Furbearer PR11.doc 14
Species
County Badger Beaver Bobcat Coyote Marten Mink Muskrat Otter Raccoon Red Fox
Spotted skunk
Striped skunk Weasel
Lemhi 2 62 29 157 111 18 1033 5 47 76 27 5 Lewis 2 7 4 5 28 15 5 Lincoln 16 44 17 91 3 336 5 3 9 Madison 71 12 59 8 1014 2 30 4 1 2 Minidoka 1 25 6 60 28 352 1 21 37 23 Nez Perce 30 20 49 2 38 2 35 1 21 Oneida 8 5 1 41 4 Owyhee 4 34 266 98 27 1301 6 141 28 6 11 1 Payette 102 55 25 68 579 6 23 1 2 Power 8 4 32 8 179 40 1 Shoshone 39 13 5 25 1 92 1 8 2 14 Teton 3 25 39 158 25 281 3 7 34 7 3 Twin Falls 3 14 26 183 32 433 4 27 4 12 Valley 21 7 33 263 13 195 1 4 37 3 14 Washington 1 28 8 8 7 241 4 3 8

W-170-R-35 Furbearer PR11.doc 15
Table 8. Bobcat and lynx pelts tagged with USFWS export tags by IDFG, 1983-1984 through 2010-2011.
Pelts tagged Year Bobcata Lynxb
1983-1984 1,242 0 1984-1985 1,025 0 1985-1986 752 0 1986-1987 1,034 0 1987-1988 1,035 0 1988-1989 738 0 1989-1990 952 1 1990-1991 523 0 1991-1992 640 2 1992-1993 754 0 1993-1994 533 0 1994-1995 794 0 1995-1996 421 0 1996-1997 1,018 0 1997-1998 929 0 1998-1999 715 0 1999-2000 885 0 2000-2001 1,026 0 2001-2002 959 0 2002-2003 1,277 0 2003-2004 1,977 0 2004-2005 1,887 0 2005-2006 1,721 0 2006-2007 2,404 0 2007-2008 1,452 0 2008-2009 1,013 0 2009-2010 971 0 2010-2011 1,430 0
a Pelts confiscated by IDFG are included in the bobcat totals for 2000-2001 (3), 2001-2002 (6), 2002-2003 (2), 2003-2004 (1), 2004-2005 (2), 2005-2006 (1), 2007-2008 (2), and 2008-2009 (9). b Lynx harvest was closed following the 1995-1996 season.

W-170-R-35 Furbearer PR11.doc 16
Table 9. Bobcat harvest by method of take reported by Region, 2010-2011.
Method of Takea
Region Total
harvest % Trapping % Calling % With
hounds % Incidental hunting %
Panhandle 297 21 179 17 4 12 102 35 12 16 Clearwater 319 22 164 16 5 15 142 49 8 10 Southwest 360 25 285 28 21 64 32 11 22 29 Magic Valley 175 12 164 16 1 3 0 10 13 Southeast 85 6 64 6 1 3 7 2 13 17 Upper Snake 109 8 102 10 1 3 3 1 3 4 Salmon 85 6 71 7 0 5 2 9 12 Total 1430 100 1029 72 33 2 291 20 77 5
a Percentages rounded to the nearest whole number. Table 10. Sex and age of harvested bobcats, based on examination of canines and cementum analyses, 1989-1990 through 1999-2000.
Year Teeth
examineda Adult
females %b Adult males %b
Juveniles & subadults
(<2 years)c %b 1989-1990 725 184 25 293 40 248 34 1990-1991 418 92 22 148 35 178 43 1991-1992 581 126 22 247 42 208 36 1992-1993 754 168 22 268 36 318 42 1993-1994 504 223 44 211 42 70 14 1994-1995 776 218 28 253 33 305 39 1995-1996 413 102 25 150 36 159 38 1996-1997 948 217 23 385 41 346 36 1997-1998 913 221 24 450 49 241 26 1998-1999 490d 164 33 152 31 173 35 1999-2000 782e 305 39 143 18 330 42 Total 7,304 2,020 2,700 2,576 Average 664 184 28 245 37 234 35
a Milk canines and those with open root canals were aged as juveniles; male canines with closed root canals were aged as adults; female canines with closed root canals were sectioned and the annuli counted, sex based on canines with closed canals was determined by measurement (Johnson et al. 1981). Sex of juveniles was not determined. Bobcat jaws were not collected after 1999-2000. b Percent is based on total number of teeth examined. c Age reflects age at last birthday, using April as the approximate date of birth. d The sex of 1 additional adult was not determined. e The sex of 4 additional adults was not determined.

W-170-R-35 Furbearer PR11.doc 17
Table 11. Summary of river otters trapped and tagged in Idaho, 2010-2011.
River otter harvest and quotas by region Region Harvest quota Date quota reached Total harvesteda
Panhandle 15 12/27/2010 15 Clearwater 15 12/31/2010 16 Southwest 30 not reached 28 Magic Valley 30 not reached 13 Southeast 5 1/2/2011 5 Upper Snake 15 not reached 11 Salmon 15 not reached 8 Total 125 96
a Total harvest may exceed harvest quota. The otter season closes in each region 72 hours after the harvest quota for that region is met. Trappers are allowed to keep otters within this 72-hour period provided their personal quota of 2 has not been reached. Table 12. Sex distribution of river otters harvested in Idaho, 2010-2011.
River otter harvesta Region Male Female Unknown Panhandle 11 10 Clearwater 12 5 1 Southwest 18 8 2 Magic Valley 1 7 Southeast 4 2 Upper Snake 7 5 1 Salmon 8 3 2 Total 71 40 6
a These figures include carcasses collected from river otters that were legally harvested and incidentally captured.

W-170-R-35 Furbearer PR11.doc 18
Table 13. Fisher and otter caught accidentally by trappers and turned in for a reward, 1992-1993 through 2010-2011.
Species Region where animal was trappeda Year 1 2 3 4 5 6 7 Unk. Total
Fisher 1992-1993 0 1 0 0 0 0 0 0 1 1993-1994 0 0 0 0 0 0 0 0 0 1994-1995 0 3 0 0 0 0 0 0 3 1995-1996 0 1 0 0 0 0 0 0 1 1996-1997 0 0 0 0 0 0 0 0 0 1997-1998 0 0 0 0 0 0 0 0 0 1998-1999 0 0 0 0 0 0 0 0 0 1999-2000 0 0 0 0 0 0 0 0 0 2000-2001 1 0 0 0 0 0 0 0 1 2001-2002 0 0 0 0 0 0 0 0 0 2002-2003 0 1 0 0 0 0 0 0 1 2003-2004 1 0 0 0 0 0 0 0 1 2004-2005 0 0 0 0 0 0 0 0 0 2005-2006 0 2 0 0 0 0 0 0 2 2006-2007 0 5 0 0 0 0 0 0 5 2007-2008 0 3 0 0 0 0 0 0 3 2008-2009 1 0 0 0 0 0 0 0 1 2009-2010 1 5 1 0 0 0 0 0 7 2010-2011 0 5 0 0 0 0 0 0 5 Total 4 26 1 0 0 0 0 0 31
Otterb 1992-1993 2 4 5 2 0 4 4 2 23 1993-1994 9 4 6 2 0 2 6 0 29 1994-1995 10 9 4 3 1 1 4 0 32 1995-1996 4 1 4 11 0 4 12 0 36 1996-1997 7 1 8 4 0 6 9 0 35 1997-1998 9 2 12 9 3 3 7 0 45 1998-1999 0 1 6 21 0 0 3 0 31 1999-2000 6 0 5 19 0 0 1 4 35 2000-2001 1 0 2 5 0 0 0 0 8 2001-2002 8 0 8 3 0 3 1 0 23 2002-2003 0 1 6 10 1 0 5 0 23 2003-2004 0 1 4 8 0 1 4 0 18 2004-2005 2 0 2 5 0 1 2 0 12 2005-2006 0 0 1 8 0 3 3 0 15 2006-2007 1 0 6 1 0 3 5 0 16 2007-2008 0 4 3 6 1 1 0 0 15 2008-2009 2 2 1 3 1 1 1 1 12 2009-2010 1 3 0 4 1 0 0 0 9 2010-2011 4 4 1 4 0 0 2 0 15 Total 66 37 84 128 8 33 69 7 432
a Figures do not include road-kills and other unknown mortalities. Figures only include non-targets that were surrendered to the Department. b 2000-2001 is the first season since 1972 that river otters could be legally trapped.

W-170-R-35 Furbearer PR11.doc 19
6BAPPENDIX A
IDAHO
2009-2010 SEASON
TRAPPING RULES

W-170-R-35 Furbearer PR11.doc 20

W-170-R-35 Furbearer PR11.doc 21

W-170-R-35 Furbearer PR11.doc 22

W-170-R-35 Furbearer PR11.doc 23

W-170-R-35 Furbearer PR11.doc
Submitted by: USummer Crea Technical Records Specialist Approved by: IDAHO DEPARTMENT OF FISH AND GAME Bradley Compton Assistant Chief, Bureau of Wildlife Federal Aid Coordinator Jeff Gould, Chief Bureau of Wildlife

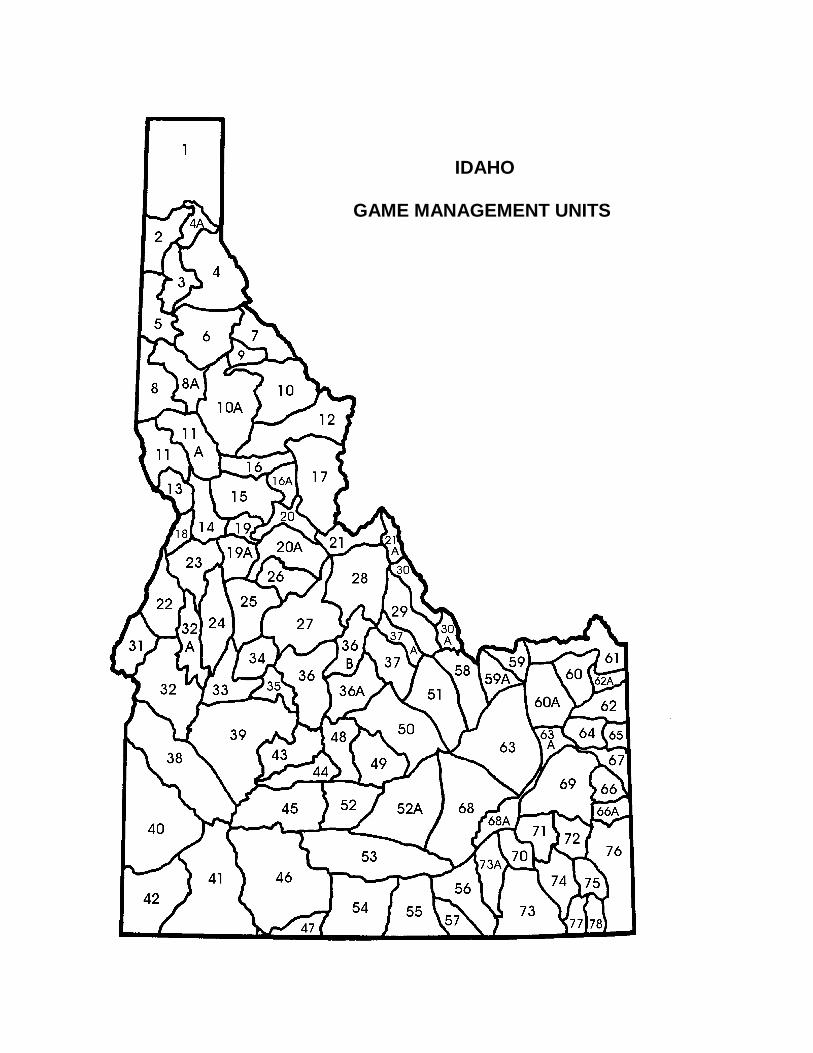
IDAHO
GAME MANAGEMENT UNITS

FEDERAL AID IN WILDLIFE RESTORATION
The Federal Aid in Wildlife Restoration Program consists of funds from a
10% to 11% manufacturer’s excise tax collected from the sale of
handguns, sporting rifles, shotguns, ammunition, and archery equipment.
The Federal Aid program then allots the funds back to states through a
formula based on each state’s
geographic area and the number of
paid hunting license holders in the
state. The Idaho Department of
Fish and Game uses the funds to
help restore, conserve, manage,
and enhance wild birds and
mammals for the public benefit.
These funds are also used to
educate hunters to develop the skills, knowledge, and attitudes necessary
to be responsible, ethical hunters. Seventy-five percent of the funds for
this project are from Federal Aid. The other 25% comes from license-
generated funds.