Broadband Development and Network Neutrality: Experiences and Challenges in Japan

ICT Policy in Japan- Broadband and Mobile -
April 16, 2009
Hiroyuki HISHINUMADirector for New Competition PolicyTelecommunications Policy DivisionTelecommunications Business DepartmentTelecommunications BureauMinistry of Internal Affairs and Communications (MIC) Japan
1.0 0.7 0.3 0.3 0.5 0.9 0.4 0.7 0.8 0.7 1.0
1.4
0.6
-2.4
-0.6
2.2
-0.7 -0.2
0.9
2.31.6
1.72.3
1.3
-2.1
-0.3
2.7
0.2 0.3
1.7
3.1
2.3 2.7
-4
-2
0
2
4
1996 1997 1998 1999 2000 2001 2002 2003 2004 2005 2006Other sectors ICT sector Real GDP growth rate
ICT Sector’s Contribution to Real GDP Growth
(Source) 2008 White paper, Information and Communications in Japan
The ICT industry leadsapproximately 40%
of the real GDP growth.
(%)
The contribution rate of the ICT industry in relation to the fluctuation of real GDP is very high.
ICT Economic Growth (40% Contribution)
→ ICT policy is important especially in such a situation as the current economic crisis. Broadband is the vital infrastructure for ICT activities.
1

Broadband Services

11.59 mil
0.01 mil
14.42 mil
4.08 mil
Progress Status of Broadband Deployment (Unit: 10K contracts)
Note: Reported numbers compiled by MIC in accordance with the provisions of the Rules for Reporting on Telecommunications Business.(Numbers compiled before the end of March 2004 were reported voluntarily by carriers)
FTTH overtakes DSL(June ’08)
DSL Number of contracts: 11.59 million Number of carriers: 48
Cable Internet Number of contracts: 4.08 million Number of carriers: 381
Wireless (FWA) Number of contracts: 0.01 million Number of carriers: 30
Optical Fibers (FTTH) Number of contracts: 14.42 million Number of carriers: 170
0
200
400
600
800
1 ,000
1 ,200
1 ,400
1 ,600Population: approx. 128 million (Census in Oct. 2008)Households: approx. 50 million (Census in 2005)IP Telephones: approx. 19 million (Sept. 2008)
3

Why has FTTH grown in popularity in Japan?
4
1. Competition Policy
2. Demand for faster broadband
3. Continuous investment by NTT
4. National target
5. Government support
6. Geographical features of Japan, etc.
DSL: 2,520
DSL: 2,938
FTTH: 5,460
FTTH: 2,625
ISP: 850
ISP: 1,050
ISP: 630
PSTN: 1,700(Tokyo)
PSTN: 1,700(Tokyo)
VoIP: 500
VoIP: 500
VoIP Router: 450
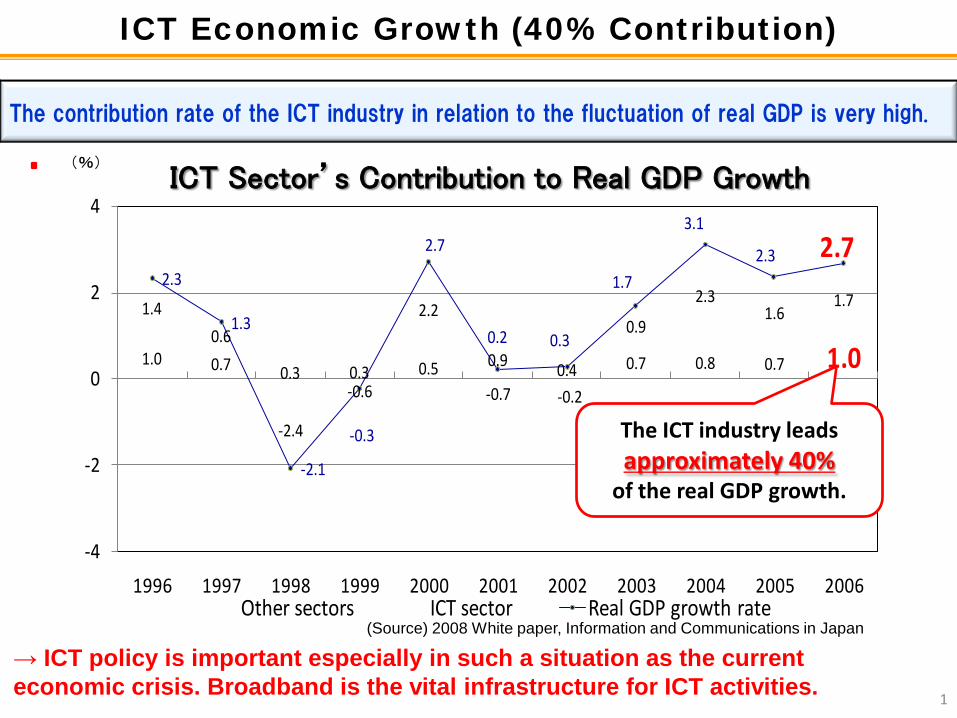
DSL 1 + PSTNMaximum 47 Mbps
NTT East + NTT Plala
DSL 2 + PSTNMaximum 50Mbps
Softbank BB + NTT East
FTTH + VoIP(Detached house)
Maximum 100MbpsNTT East + NTT Plala
FTTH + VoIP (Collective house)Maximum 100Mbps
NTT East + NTT Plala
5,070 yen (approx. 38 euros)
4,638 yen (approx. 35 euros)
7,010 yen (approx. 53 euros)
4,205 yen (approx. 32 euros)
User Charge for ADSL and FTTx
[Source] MIC research on March 31, 2008
5
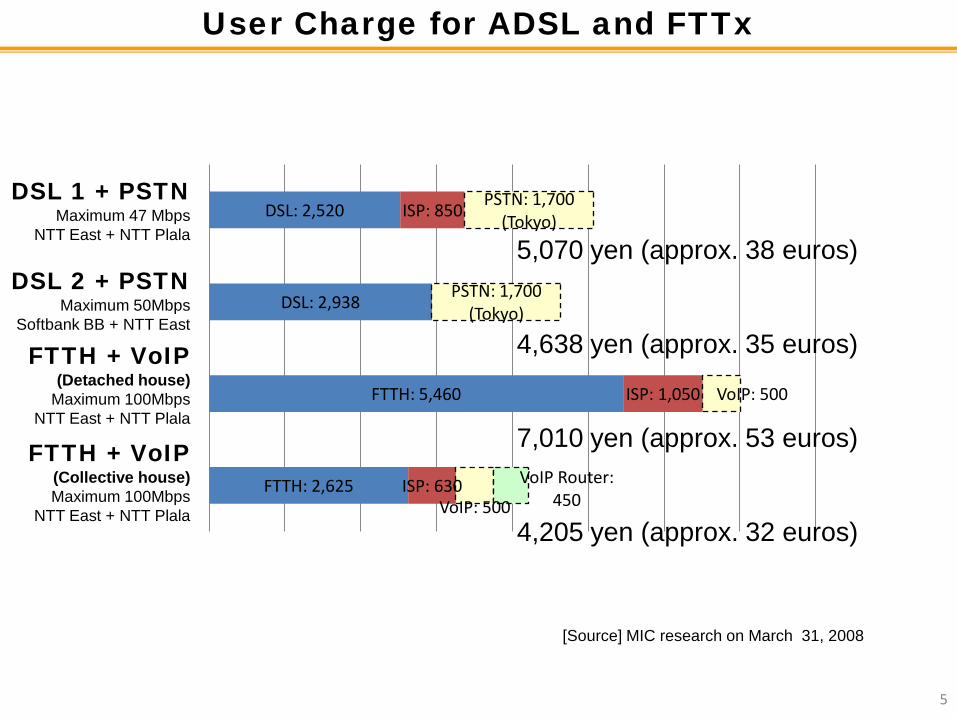
Interconnection Charge for ADSL and FTTx ADSLThe interconnection charge for line sharing, approved by MIC, is only for additional device and line managing costs because the cost of local loop is already paid by users as a basic telephone charge.
MDF
Splitter DSLAM
Telephone
NTT bldg
Local Switch
Equipment of competitive DSL operators
Subscriber’s houseISP
Telephone networkSP
Additional device = Extra MDF
[Interconnection charge for line sharing: less than 1 euro]
FTTxThe interconnection charge for FTTx service is for whole access line because the fiber access line is completely new and substitution for current metal access.[Interconnection charge for dark fiber: approximately 35 eurosfor detached house]
[Interconnection charge for dry copper: less than 10 euros]
6
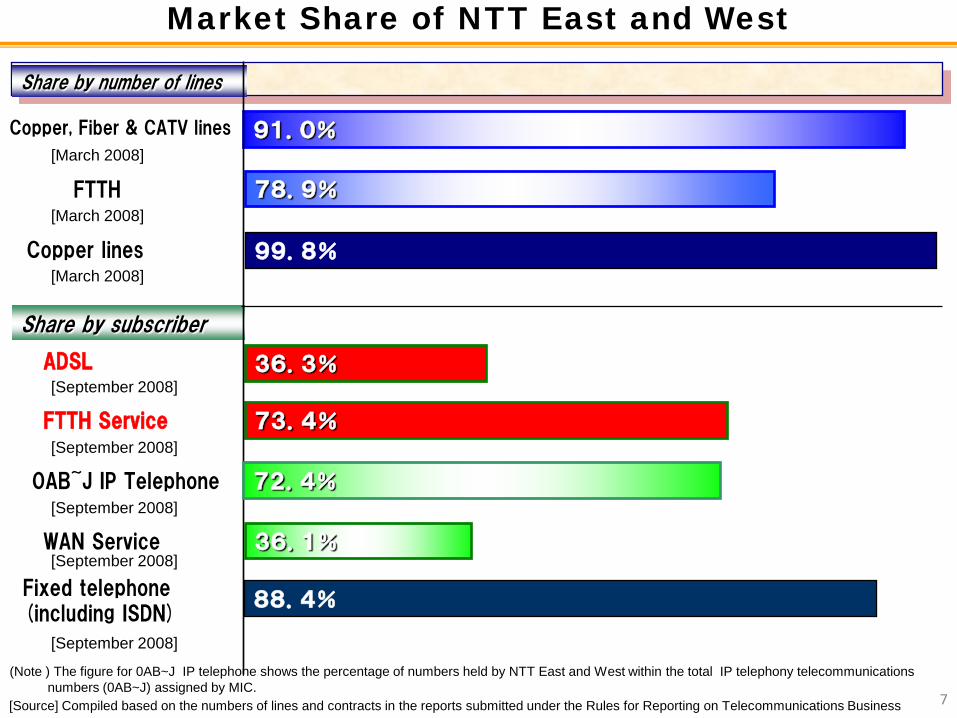
Market Share of NTT East and West
91.0%Copper, Fiber & CATV lines
78.9%FTTH
Fixed telephone(including ISDN)
88.4%
FTTH Service 73.4%
Share by number of lines
36.3%ADSL
Share by subscriber
0AB~J IP Telephone 72.4%
WAN Service 36.1%
[March 2008]
[March 2008]
99.8%Copper lines[March 2008]
[September 2008]
[September 2008]
[September 2008]
[September 2008]
[September 2008]
7
(Note ) The figure for 0AB~J IP telephone shows the percentage of numbers held by NTT East and West within the total IP telephony telecommunications numbers (0AB~J) assigned by MIC.
[Source] Compiled based on the numbers of lines and contracts in the reports submitted under the Rules for Reporting on Telecommunications Business

10,977
7,662
6,966
7,7547,969
8,8518,483
8,2358,650
1,490 1,640
2,370
3,3302,830
3,490 3,5603,280
3,010
0
2,000
4,000
6,000
8,000
10,000
12,000
2000 2001 2002 2003 2004 2005 2006 2007 2008
Total investment
Investment for fiber local loops
(unit: hundred million yen)
【Total investment and trend of investment for fiber local loop】
※The rate of coverage is the average of NTT East and West. The opticalization of access network means the ratio of opticalizedfeeder points of the all the feeder points.
Fiber unbundling has not affected NTT’s Investment in fiber so far
8

Bridging the Digital Divide in Building Broadband Facilities
Improvement of the Use Environment of Satellite Broadband
Expansion of the Local Information and Communications Infrastructure Development Grants (ICT Grants)
Draw Road Maps of Building Broadband Facilities
Broadband
Ultra-High-Speed Broadband (FTTH)
Elimination of All Broadband
Zero Areas
90%
FY2010 (Target)
98.3%
March 2008 (Current)
86.5%
9
Mobile Communications

0
10
20
30
40
50
60
70
80
90
100
Changes in the Mobile Phone Environment
86.1%N
umber of Internet connection subscribers
Num
ber of mobile phone subscribers
91.9%
Internet connection
2009.22007
1996
2006 Mobile phone with terrestrial TVDual mode (IMT-2000+GSM)Mobile Number Portability
2004 Osaifu-Keitai (Mobile phone
with electronic money
2001(Start of IMT-2000 service)Mobile phone with GPSMobile video phone
(million)
1999Start “i-Mode”, “EZ Web”, “J Sky Service”
2000Mobile phone with camera
1998
2002 Download music servicesE-mail with picture/movie services
2003
Feb. 2009 Number of subscribers- Mobile phones: Approx. 106,481,700 (83.5%)- Internet connection: Approx. 91,700,000 (71.9%)- IMT-2000: Approx. 97,892,400 (76.7%)
※Population (estimate) 127,590,000 (March, 2009)
2005 Flat rate data plan
Num
ber of IMT-2000 subscribers
IMT-2000
11

12
0 20,000,000 40,000,000 60,000,000 80,000,000 100,000,000 120,000,000
Total Subscribers
IMT-2000
Internet Connection
Camera
Digital TV (OneSeg)
GPS
Felica 55.2%
47.7%
35.6%
88.9%
86.1%
91.9%
(As of 2009 .2)
Penetration of various applications with mobile phone
106,481,700 units
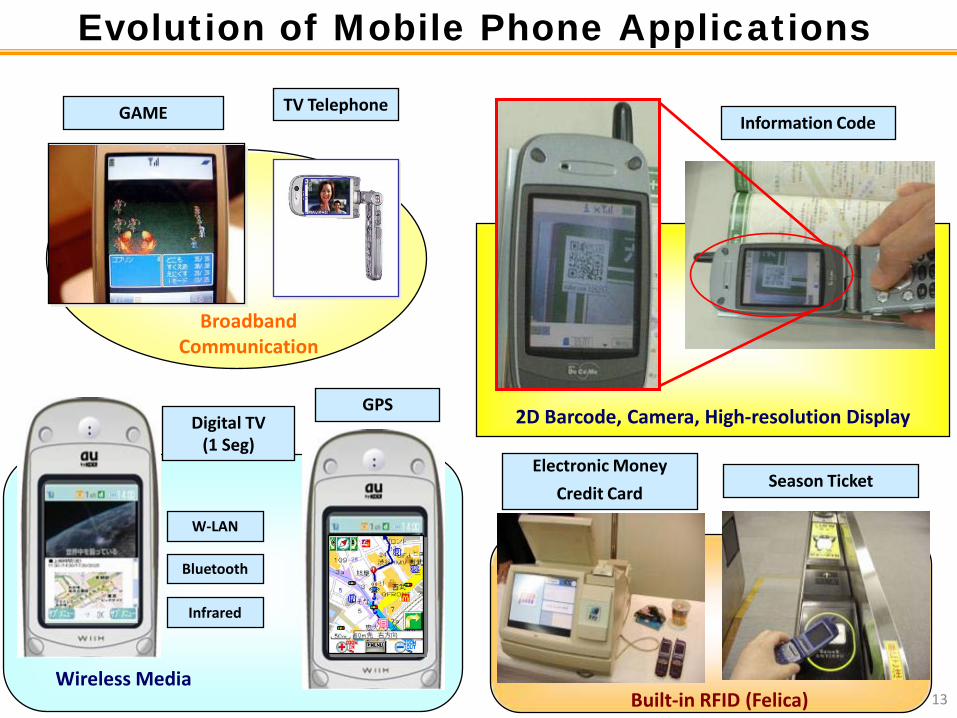
Evolution of Mobile Phone Applications
GAME
Season Ticket
TV Telephone
Electronic Money
Credit Card
Broadband Communication
2D Barcode, Camera, High-resolution Display
Built-in RFID (Felica)
Information Code
Wireless Media
GPSDigital TV
(1 Seg)
W-LAN
Bluetooth
Infrared
13
Competition policy for mobile communications
14
1. Mobile number portability
2. Promoting new entries of MVNOs
3. Improving interconnection regulations
Interconnection Rules Responsive to Changes in the Telecom Market (1/2)
•The fixed line broadband market saw FTTH surpassing DSL in their number of subscribers in June 2008.
•The mobile telephone market now exceeds 100 million subscribers with advanced handsets and is rapidly becoming a key infrastructure in business operations and everyday life in general. Also, Fixed-Mobile Convergence is expected to bloom in the near future.
• In response to these market changes in the last decade, the Japanese Government launched a comprehensive review of the interconnection policy for securing fair competition in the telecommunications marketon February 24, 2009.
15

1. Verification of current regulations(Unbundling policy, optimal cost for tariff rates, etc.)
2. Effective network infrastructure use (Facility sharing rules & roaming system establishment)
Interconnection Rules Responsive to Changes in the Telecom Market (2/2)
1. FTTx services
2. DSL services
3. Effective network infrastructure uses
1. Opening up telecom platform functions
2. Strengthening dispute settlement function, etc.
I. Development of fair competition environment in the mobile
communications market
II. Development of fair competition environment in the fixed-line
broadband market
III. Development of fair competition environment to boost entry in telecom
platform and content distribution markets 1. Issues in tariff rates calculation
2. Policy on future interconnection rules and underlying dominant carrier regulation)
IV. Policy on interconnection rules in the age of fixed-line and mobile
communications integration
1. Outline of review items
2. Tentative Schedule
Feb. 2009: Consultation with the Information and Communications CouncilJuly 2009: Invitation for comments on draft recommendationsSep. 2009: Recommendations from the Council (tentative date)
16