
ICPSR IRT 10 - Home Page | Jonathan Templin's Website · correlation r) depend on the ... • Test...
41
Equating Lecture #10 ICPSR Item Response Theory Workshop Lecture #10: 1 of 81 Lecture Overview • Test Score Equating Using IRT How do we get the results from separate calibrations onto the same scale, so that they can be compared? This afternoon we’ll discuss DIF in detail, which will be more relevant once you have a better understanding of the scale comparability issues Lecture #10: 2 of 81
Transcript of ICPSR IRT 10 - Home Page | Jonathan Templin's Website · correlation r) depend on the ... • Test...
Equating
Lecture #10ICPSR Item Response Theory Workshop
Lecture #10: 1 of 81
Lecture Overview
• Test Score Equating Using IRT How do we get the results from separate calibrations onto the same scale, so that they can be compared?
This afternoon we’ll discuss DIF in detail, which will be more relevant once you have a better understanding of the scale comparability issues
Lecture #10: 2 of 81
TEST SCORE EQUATING
Lecture #10: 3 of 81
Test Score Equating
• It is common for scores obtained from different forms of a test to be compared Just as if they came from the same test
• This can be problematic if tests differ: In difficulty, precision…content…
• Example: No one asks what year you took the GRE, only your score
Lecture #10: 4 of 81

CTT Weaknesses
• Item statistics (e.g., difficulty p and item/total correlation r) depend on the group of people used to estimate them Therefore do not generalize to a larger group
• Person ability estimates depend on the particular test items used Therefore do not generalize to anything but strictly parallel tests
Lecture #10: 5 of 81
A group of people with “average” ability can be made to look either not-so-smart or very smart, depending on the difficulty of the test being administered
Lecture #10: 6 of 81

A group of people “average ability” can be made to look either not-so-smart or very smart, depending on the difficulty of the test being administered.
Lecture #10: 7 of 81
A group of examinees with relatively average ability can be made to look either not-so-smart or very smart, depending on the difficulty of the test being administered.
Likewise, items will look easier or harder depending on the distribution of ability
Very Smart
Not-so-smart
Difficulty Lecture #10: 8 of 81

A group of examinees with relatively average ability can be made to look either not-so-smart or very smart, depending on the difficulty of the test being administered.
Likewise, items will look easier or harder depending on the distribution ability
Difficulty
Very Smart
Not-so-smart
Lecture #10: 9 of 81
Test Score Equating
• Test score equating is the process by which we ensure that comparisons across forms of a test are meaningful Multiple forms of a single test in a given administration…
Scores from tests administered across years
Lecture #10: 10 of 81

Purpose of Equating
• The purpose of equating is to adjust for differences in test form difficulty so that the forms can be used interchangeably
• After successful equating, people can be expected to earn the same score regardless of the test form administered
• Scores from various forms can be meaningfully compared
Lecture #10: 11 of 81
Importance of Equating
• Equating is important whenever: Scores from two or more tests are to be compared –and‐ The tests themselves are unequal in difficulty ‐and/or‐ The test score distributions are not equivalent to each other
• Examples of equated tests: Entrance exams: SAT, GRE, LSAT Credentialing exams: AICPA, NBME National, statewide standardized achievement tests: NAEP
Lecture #10: 12 of 81

Practical Importance…
• LOTS of decisions made based on student test scores, growth in student ability, etc.
• No Child Left Behind Act of 2001 calls for schools to show “adequate yearly progress”
• If we make decisions about changes in pass rates, there is a critical need to ensure scale comparability
Lecture #10: 13 of 81
Important Points
• To be considered “forms of a test,” forms must be developed from the same content and statistical specifications
• Forms built to different content or difficulty specifications can’t be equated
• You wouldn’t “equate” SAT and ACT scores, because the tests are built with different (though similar) purposes, and each is built to its own specifications
Lecture #10: 14 of 81
Important Points
• Equating is necessary, in practice, because it is essentially impossible to construct test forms that are precisely equal in overall difficulty
• So, if we want (or need) to have multiple forms of an exam, then we need to statistically equate the scores from these forms
Lecture #10: 15 of 81
Practical Sidebar
• There is almost always a need to equate forms, because tests very regularly change over time
• Many operational testing programs release items after score reporting …and they certainly can’t administer them again after that!
Lecture #10: 16 of 81

Related Issues
1) Equating: Convert scores from alternate forms to the same scale
2) Vertical Scaling: Place tests of different difficulty but closely related content on the same scale
3) Concordance: Place scores from different tests used for a particular purpose onto the same scale
Lecture #10: 17 of 81
Score Equivalence Issues
• Let’s say that for all people, we report the raw scores from the forms, regardless of their relative difficulty
• PROBLEMS: People administered an easier form are advantaged
People administered a harder form are disadvantaged
Trends in examinee ability over time are confounded with the test form difficulty
Lecture #10: 18 of 81

Score Equivalence Issues
• Let’s say we convert raw scores such that the ability distribution is always the same across forms (i.e., transform all scores to have the same mean and SD)
• PROBLEMS: People tested with a lower achieving group are advantaged
People tested with a higher achieving group are disadvantaged
Trends in examinee ability over time cannot be addressed using these scores
Lecture #10: 19 of 81
Score Equivalence Issues
• If we use equating and report equated scores, we adjust for differences in form difficulty and account for differences in groups, so that successfully equated scores are not affected by the previously mentioned problems
• PROBLEM: “Successful” equating depends on meeting assumptions; if not met…
Lecture #10: 20 of 81

Upcoming Topics
• Review some fundamentals, assumptions, and model features
• Steps in conducting IRT Equating Common persons, common items
Characteristics of Anchor Items
• Advantages of IRT Equating
• Examples…
Lecture #10: 21 of 81
Fundamentals
• We assume that the construct we are attempting to measure exists and influences test performance
• This “ability” or “trait” relates to item performance, and that relationship can be specified in an ICC
• This should be true regardless of whether an item is on any form (i.e., Form A or B)
Lecture #10: 22 of 81
Ability Scores
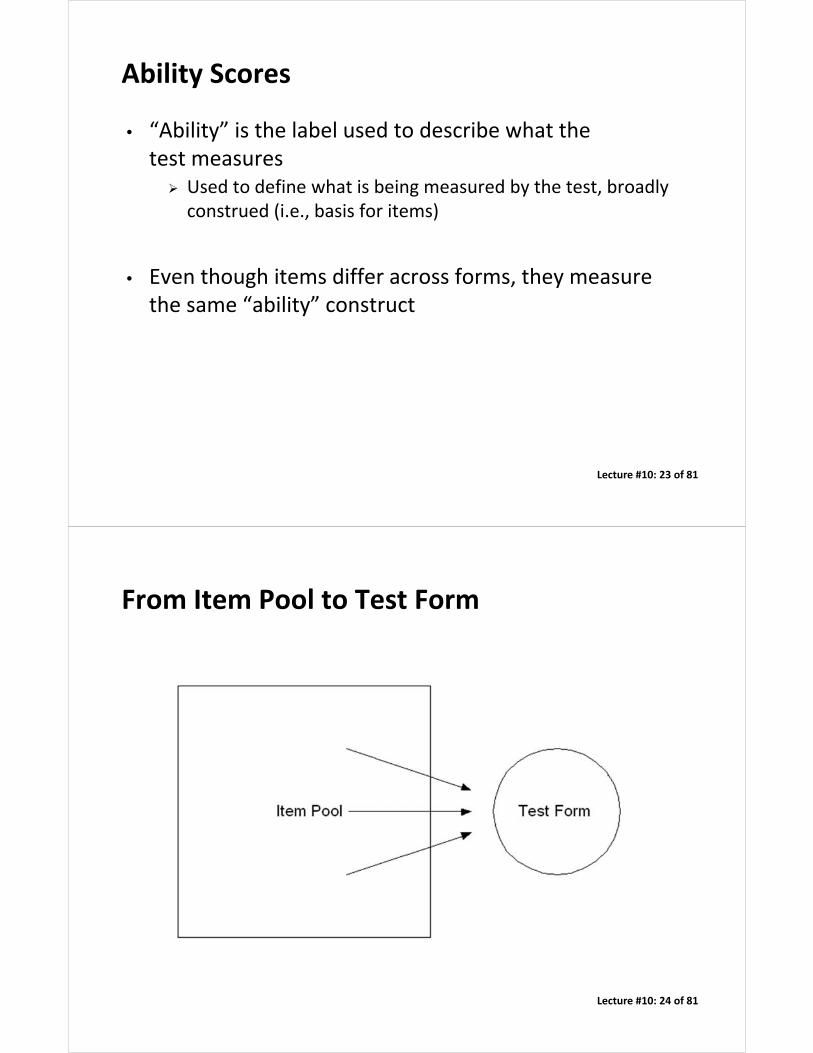
• “Ability” is the label used to describe what the test measures Used to define what is being measured by the test, broadly construed (i.e., basis for items)
• Even though items differ across forms, they measure the same “ability” construct
Lecture #10: 23 of 81
From Item Pool to Test Form
Lecture #10: 24 of 81
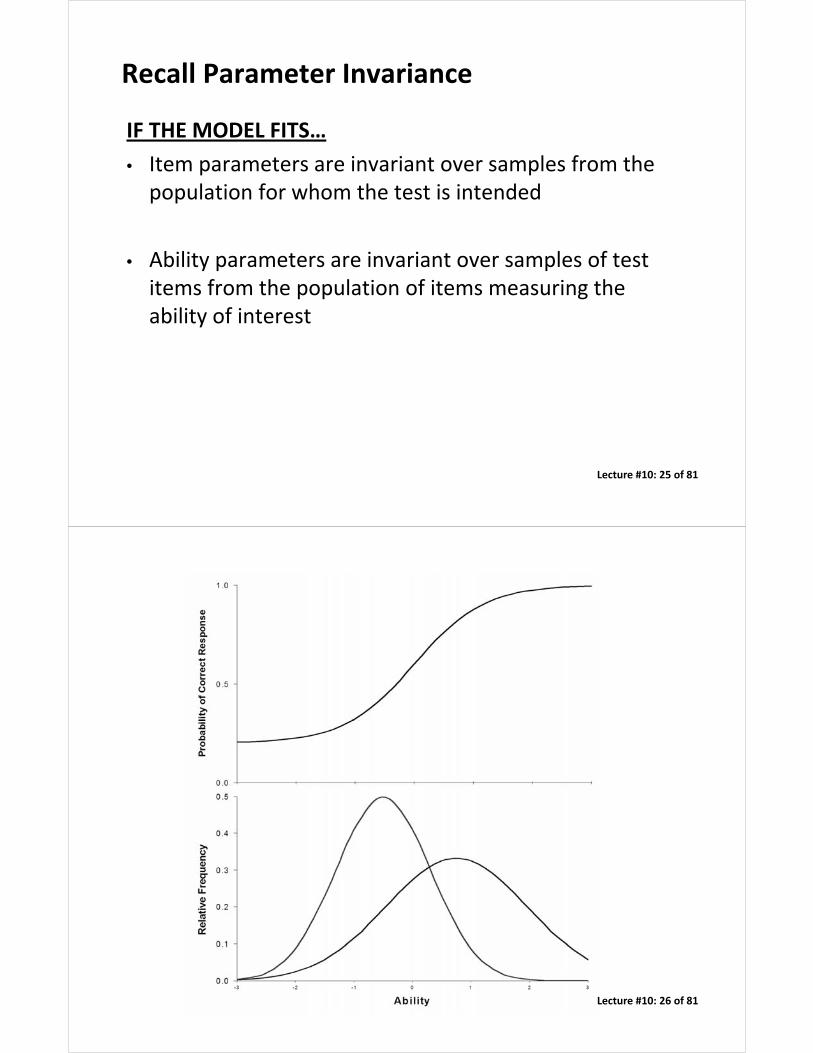
Recall Parameter Invariance
IF THE MODEL FITS…
• Item parameters are invariant over samples from the population for whom the test is intended
• Ability parameters are invariant over samples of test items from the population of items measuring the ability of interest
Lecture #10: 25 of 81
Lecture #10: 26 of 81

Arbitrariness of the Scale
• The scale chosen to identify a solution in IRT modeling is only defined up to a linear transformation
• Choosing a mean of 0 and SD of 1 identifies a scale for interpretation Determines the scale of item parameters
• Any linear transformation of theta (with a corresponding transformation for items) would provide the same ICC shape
Lecture #10: 27 of 81
Parameter Invariance
• Parameters are invariant up to a linear transformation, which accounts for the arbitrariness of the scale chosen to identify a solution
• Once the scale is chosen, this assumption can then be tested
Lecture #10: 28 of 81

These transformations preserve the probability:
Lecture #10: 29 of 81
Ability Scale
• Because response probabilities are maintained through a linear transformation, the ability scale can be (and often is) transformed after calibration to create a more convenient scale for interpretation, usage, and score reporting
• Example: GRE ( = 500, = 100) About to change…
Lecture #10: 30 of 81

Scale Transformations
• The ability or item scale can also be transformed after calibration to make it match the scale from another calibration, as long as there is some “link” across the forms which creates the basis for the transformation
• For this reason, equating is often referred to as “linking”
Lecture #10: 31 of 81
Steps in IRT Equating
1. Choose an equating design (includes data collection)
2. Place item parameter estimates from the tests being equated onto a common scale
3. Complete the equating according to the procedure chosen
Lecture #10: 32 of 81

CHOOSING AN EQUATING DESIGN
Lecture #10: 33 of 81
Data Collection Designs
• Single Group or Common Person
• Randomly Equivalent Groups
• Common Item Non‐equivalent Groups
Lecture #10: 34 of 81

Common Person Design
• The same group of examinees takes both test forms (Forms A & B)
• To minimize ordering effects, counterbalance administration order
• Link Ability (theta) should be the same for either form
Transform B to match A
Calculate corresponding transformation foritem parameters
Lecture #10: 35 of 81
Common Person Design
• Practical Problems Hard to control for practice and fatigue
Testing time is essentially doubled
Two or more administrations (days) are typically required
Lecture #10: 36 of 81
Random Groups Design
• Field test forms are distributed randomly to students in classrooms and schools Popular with states and test publishers
• Groups taking each form are treated as “randomly equivalent” Assumption is made of equal ability
• Do IRT analysis of each test, and use item statistics interchangeably
Lecture #10: 37 of 81
Random Groups Design
• Randomly equivalent groups or samples of people are administered one of the test forms
• With large samples, differences in test difficulties are attributed to tests, not samples, because samples are considered equivalent
• Preferable to a Single Group Design if samples are large because examinees take only a single test
Lecture #10: 38 of 81

Random Groups Design
• Gets around the problem of practice effects and unwillingness to participate
• Large samples minimize sampling errors in the equating
• Difficult assumption to test (equivalence)
Lecture #10: 39 of 81
Common Item Design
• Most common method of equating
• Often called “anchor test” design
• Common items are included on every test form, and parameters for those items are treated as equivalent across all forms
• Common items may be internal (scored) or external (not scored)
Lecture #10: 40 of 81

Common Item Design
• Popular design because it represents a common situation: Tests of unequal difficulty are administered to groups which may differ in ability It is assumed that they do differ
• Ability differences are assessed through anchor test (common items) and then adjustments are made for test difficulties
Lecture #10: 41 of 81
Practical Sidebar
• Because many operational testing programs release items after score reporting, external anchors are quite common…
• If the items weren’t used to determine scores, they don’t have to be released, and can therefore be used again on subsequent forms
Lecture #10: 42 of 81

Common Item Design
• Practical problem Administrative flexibility (people take only one test) gained at the expense of strong statistical assumptions needed to separate group and test differences
Common items must be ‘behave’ the same way on each form
Lecture #10: 43 of 81
Common Administration
• Forms administered via matrix sampling 1 Common scoring block X linking blocks X forms These blocks comprise the anchor test Blocks composed to match average difficulty, information from
the scoring test
• Forms are linked within a particular year based on common scoring items
• Forms are linked across years based on commonlinking blocks
• Subsequent years: new scoring items
Lecture #10: 44 of 81

Lecture #10: 45 of 81
Anchor Tests
• Anchor items should look like mini‐versions of the tests they are linking (same content and similar statistically)
• Better results obtained with more items (equating is more stable)
• Anchor items should occur approximately in the same place on each form
Lecture #10: 46 of 81

PLACING ITEM PARAMETERS ONTO A COMMON SCALE
Lecture #10: 47 of 81
Two Approaches
• Transformation procedures Following separate calibrations, determine a linear transformation that puts item parameters from one calibration on same scale as another
• Calibration procedures Scale equivalence is achieved through the actual calibration process
My preferred approach
Lecture #10: 48 of 81

Parameter Invariance
• This assumption basically states that parameters are invariant up to a linear transformation, Accounts for the arbitrariness of the scale chosen to identify the latent trait
• We can check parameter invariance of difficulty through crude scatter plots
Lecture #10: 49 of 81
Parameter Invarianceb-plot
Lecture #10: 50 of 81
Transformation Methods
• The argument is that the item parameter estimates (apart from sampling error) should be the same on both tests, regardless of the calibration sample They’re the same items…why not?
Really…why not?
• Systematic differences in item parameters are therefore a result of differences in the calibration samples
Lecture #10: 51 of 81
Transformation Methods
• A linear transformation can be found that will place the item parameters from common items on one test to the same scale as the other test Shift in mean b‐parameter: intercept
Accounts for mean difference in ability
Shift in scale of b‐parameters: slope Accounts for variability difference in ability
Lecture #10: 52 of 81

These transformations preserve the probability:
Lecture #10: 53 of 81
Achieving a Common Scale
• Determine the set of equating constants (x and y) to place the b‐parameter estimates from Form B onto the scale of Form A estimates
• These constants will contain some error Not every pair of values falls perfectly on a line
• Best solution: make anchor test and sample sizes as large as possible
Lecture #10: 54 of 81

May have to remove items:Parameter Drift
Lecture #10: 55 of 81
Transformation procedures
• Mean & Sigma (M‐S) After separate calibrations, determine the linear transformation that matches the mean and SD of anchor item b‐values across administrations
• Test Characteristic Curve (TCC) (Stocking & Lord, 1983) After separate calibrations, determine the linear transformation that minimizes the average squared difference between anchor item TCCs across administrations
Lecture #10: 56 of 81

Mean and Sigma Equating Method
• After separate calibrations, determine the linear transformation that matches the mean and SD of anchor item b‐values across administrations:
• This transformation places the scale of item parameters from “Form B” onto the scale of item parameters from “Form A”
Lecture #10: 57 of 81
Mean & Sigma Example
• 25 Linking items Form A: mb‐FormA = ‐0.06, sb‐FormA = 1.03
Form B: mb‐FormB = ‐0.25, sb‐FormB = 1.12 x = 1.03 / 1.12 = 0.92
y = ‐0.06 – (0.92 * ‐0.25) = 0.17
• bnew = x bold + y
• bnew = 0.92 bold + 0.17
Lecture #10: 58 of 81

M & S Transformation of Form B linking b-parameters
Intercept (y) is above zero (i.e., common items were easier).
This indicates that Group B had higher ability than Group A.
Lecture #10: 59 of 81
After item parameters are adjusted, the same transformation of b is done for all …now Group B will look more able (as they should).
Lecture #10: 60 of 81
Notes
• We DON’T simply do an OLS regression of b(B) on b(A) The solution is not symmetric
• If we just regressed b(B) on b(A): Different q estimates would be obtained depending on whether we equated A to B or B to A
• Mean & Sigma will produce equivalent results regardless of which form is the reference
Lecture #10: 61 of 81
Notes
• If Common Person instead of Common Item equating design was selected, then Mean & Sigma can be performed using instead of b.
• Recall that and b are on the same scale. Whatever transformation you do to , you do to b, and vice versa.
Lecture #10: 62 of 81

Mean & Sigma
• Two drawbacks: Only b‐values are used!
See TCC Method
Some b‐values may be better estimated than others See Robust Mean & Sigma
Lecture #10: 63 of 81
Test Characteristic Curve (TCC) Method
• After separate calibrations, determine the linear transformation that minimizes the average squared difference between anchor item TCCs across forms
“loss function”
Lecture #10: 64 of 81

Robust Mean & Sigma
• Proceed as with Mean & Sigma, but the contribution of each item to determining the equating constants is weighted by the standard errors of the b‐parameters
• The smaller the SE(bA) or SE(bB), the more weight that pair will have
Lecture #10: 65 of 81
Calibration Procedures
• Concurrent Calibration, single group Joint calibration of multiple administrations; one ability distribution
• Concurrent Calibration, multiple groups Joint calibration of multiple administrations; multiple ability distributions
• Fixed Common Item Parameter (FCIP) Separate calibration for base administration; anchor item parameters fixed for subsequent administrations
Lecture #10: 66 of 81

Calibration Procedures
• Concurrent Calibration, single groupResponse data from multiple forms are calibrated jointly
One ability distribution across administrations
Equivalent groups design
Lecture #10: 67 of 81
For a given year, we naturally assume that everyone in that administration comes from a single group.
Lecture #10: 68 of 81
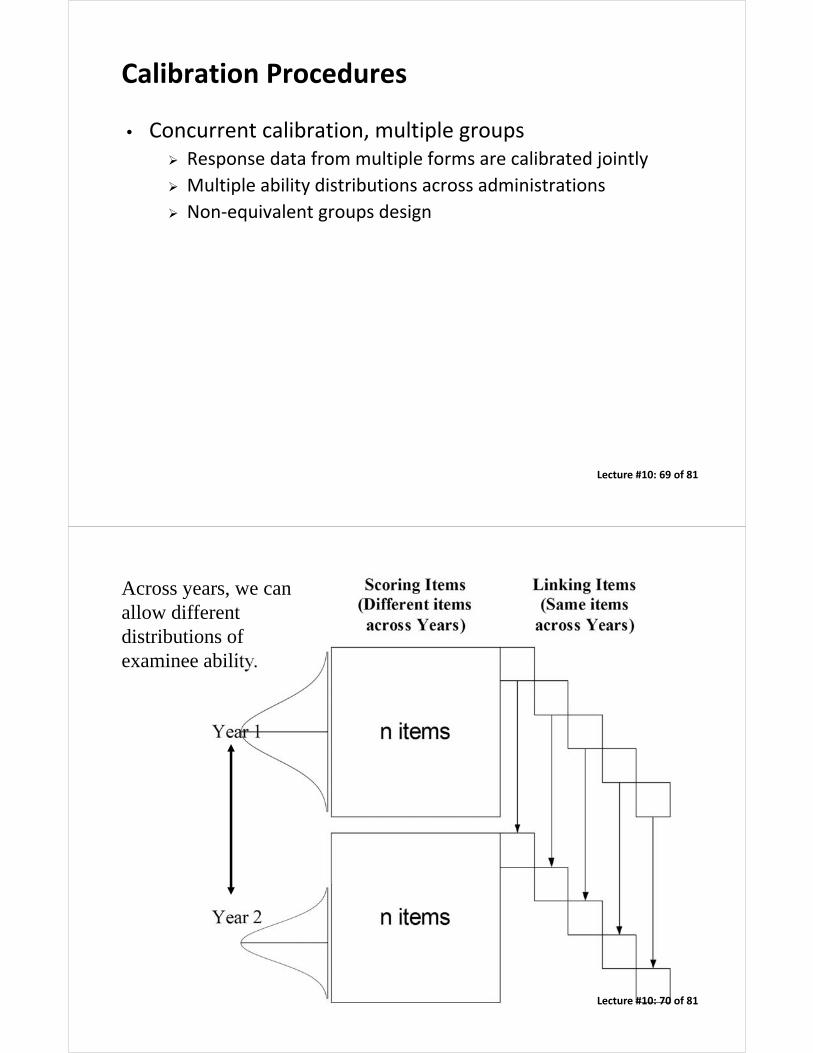
Calibration Procedures
• Concurrent calibration, multiple groups Response data from multiple forms are calibrated jointly
Multiple ability distributions across administrations
Non‐equivalent groups design
Lecture #10: 69 of 81
Across years, we can allow different distributions of examinee ability.
Lecture #10: 70 of 81
Calibration Procedures
• Fixed Common Item Parameter (FCIP) Separate calibration for base administration
Anchor item parameters for subsequent administrations are fixed at the values obtained in the base administration
This forces new item parameters to be estimated in relation to the fixed values, which are already on the same scale as the previous administration
Lecture #10: 71 of 81
PERFORMING THE EQUATING
Lecture #10: 72 of 81

Calibration Procedures
• Equating is already done!
• The ability (q) estimates you get from the different forms as a result of such calibrations will be on the same scale as each other
Lecture #10: 73 of 81
Linear Transformations
• After finding slope (x) and intercept (y):
Lecture #10: 74 of 81
Equated Scores
• Once the transformation or calibration is done, ability scores from two or more tests are comparable i.e., They’re equated
Lecture #10: 75 of 81
Conversions
• If a raw‐score to raw‐score conversion table is desired, then the TCC for each test (after equating) is needed to find comparable scores
• Example: A raw‐score of 29 on Form B may be equivalent to a raw score of 27 on Form A (Form B is easier than Form A)
• Often estimated true scores (expected number correct scores) are used in place of actual (observed) raw scores
Lecture #10: 76 of 81
Advantages of IRT Equating
• Theoretical: May be best when tests vary in difficulty and groups are of
unequal ability Equating results are independent of group or groups used to
obtain them
• Practical: Equating may be better at the extremes of the score distributions
(don’t need extreme scores to do equating) Equating many tests can be easily done once item parameter
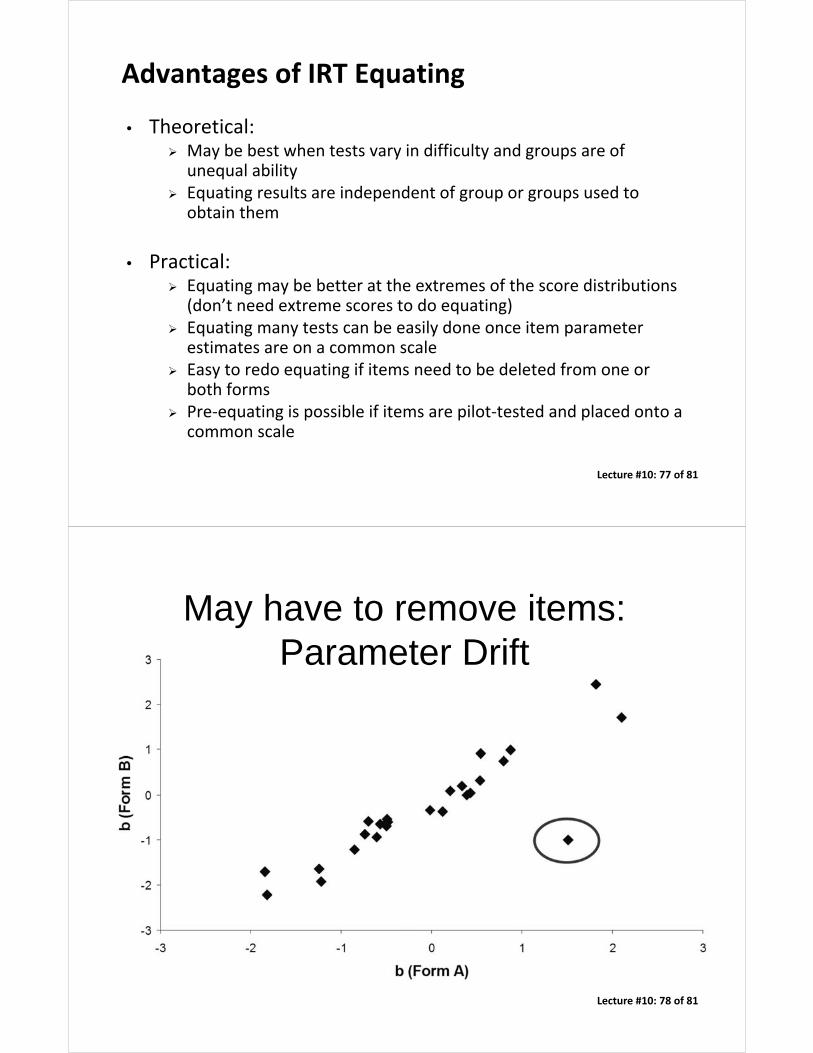
estimates are on a common scale Easy to redo equating if items need to be deleted from one or
both forms Pre‐equating is possible if items are pilot‐tested and placed onto a
common scale
Lecture #10: 77 of 81
May have to remove items:Parameter Drift
Lecture #10: 78 of 81

CONCLUDING REMARKS
Lecture #10: 79 of 81
Concluding Remarks
• Equating: the purpose of test score “equating” is to put separate calibrations (which are scale indeterminate) on a common metric
• This allows us to compare person score results from Form A to those Form B, or from Year 1 to Year 2
Lecture #10: 80 of 81

Up Next…
• Item and Test Bias
• Differential Item Functioning
Lecture #10: 81 of 81