ICP - Mass · PDF fileHouston, Texas, USA). In addition, citrate-stabilized 50 nm gold NPs...
4
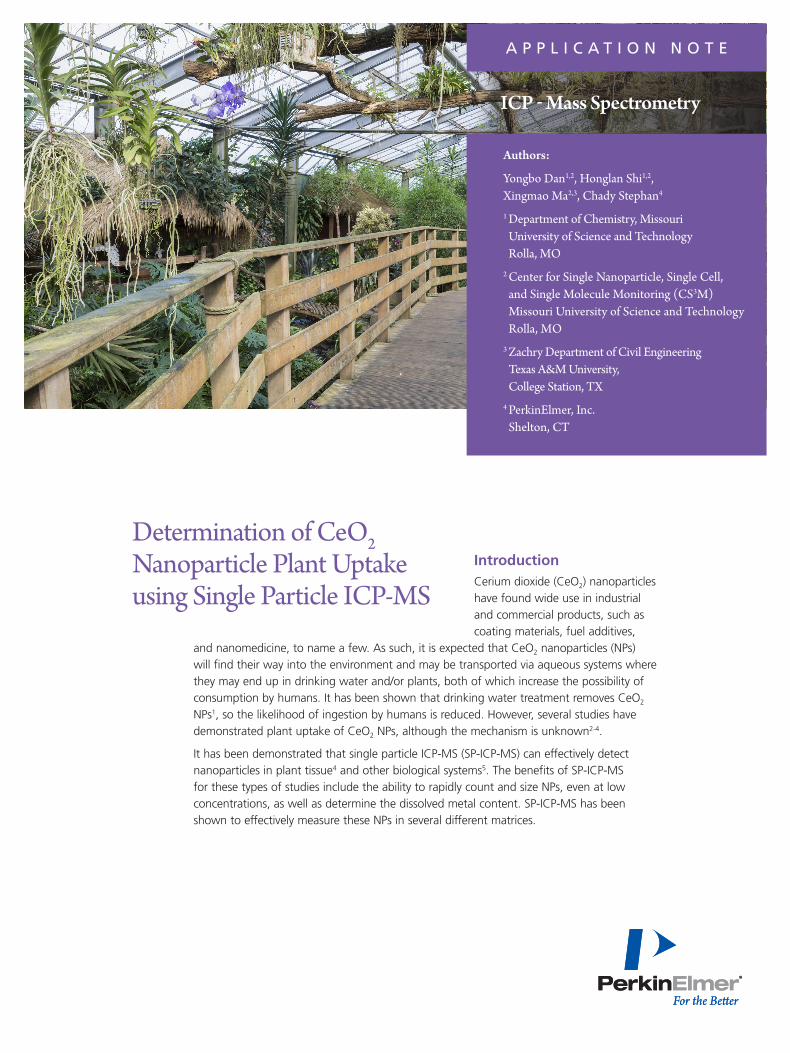
Introduction Cerium dioxide (CeO 2 ) nanoparticles have found wide use in industrial and commercial products, such as coating materials, fuel additives, and nanomedicine, to name a few. As such, it is expected that CeO 2 nanoparticles (NPs) will find their way into the environment and may be transported via aqueous systems where they may end up in drinking water and/or plants, both of which increase the possibility of consumption by humans. It has been shown that drinking water treatment removes CeO 2 NPs 1 , so the likelihood of ingestion by humans is reduced. However, several studies have demonstrated plant uptake of CeO 2 NPs, although the mechanism is unknown 2-4 . It has been demonstrated that single particle ICP-MS (SP-ICP-MS) can effectively detect nanoparticles in plant tissue 4 and other biological systems 5 . The benefits of SP-ICP-MS for these types of studies include the ability to rapidly count and size NPs, even at low concentrations, as well as determine the dissolved metal content. SP-ICP-MS has been shown to effectively measure these NPs in several different matrices. Determination of CeO 2 Nanoparticle Plant Uptake using Single Particle ICP-MS APPLICATION NOTE Authors: Yongbo Dan 1,2 , Honglan Shi 1,2 , Xingmao Ma 2,3 , Chady Stephan 4 1 Department of Chemistry, Missouri University of Science and Technology Rolla, MO 2 Center for Single Nanoparticle, Single Cell, and Single Molecule Monitoring (CS 3 M) Missouri University of Science and Technology Rolla, MO 3 Zachry Department of Civil Engineering Texas A&M University, College Station, TX 4 PerkinElmer, Inc. Shelton, CT ICP - Mass Spectrometry
Transcript of ICP - Mass · PDF fileHouston, Texas, USA). In addition, citrate-stabilized 50 nm gold NPs...
Introduction Cerium dioxide (CeO2) nanoparticles have found wide use in industrial and commercial products, such as coating materials, fuel additives,
and nanomedicine, to name a few. As such, it is expected that CeO2 nanoparticles (NPs) will find their way into the environment and may be transported via aqueous systems where they may end up in drinking water and/or plants, both of which increase the possibility of consumption by humans. It has been shown that drinking water treatment removes CeO2 NPs1, so the likelihood of ingestion by humans is reduced. However, several studies have demonstrated plant uptake of CeO2 NPs, although the mechanism is unknown2-4.
It has been demonstrated that single particle ICP-MS (SP-ICP-MS) can effectively detect nanoparticles in plant tissue4 and other biological systems5. The benefits of SP-ICP-MS for these types of studies include the ability to rapidly count and size NPs, even at low concentrations, as well as determine the dissolved metal content. SP-ICP-MS has been shown to effectively measure these NPs in several different matrices.
Determination of CeO2 Nanoparticle Plant Uptake using Single Particle ICP-MS
A P P L I C A T I O N N O T E
Authors:
Yongbo Dan1,2, Honglan Shi1,2, Xingmao Ma2,3, Chady Stephan4 1 Department of Chemistry, Missouri
University of Science and Technology Rolla, MO
2 Center for Single Nanoparticle, Single Cell, and Single Molecule Monitoring (CS3M) Missouri University of Science and Technology Rolla, MO
3 Zachry Department of Civil Engineering Texas A&M University, College Station, TX
4 PerkinElmer, Inc. Shelton, CT
ICP - Mass Spectrometry
2
The goals of this work are to develop a SP-ICP-MS method and to characterize the uptake and accumulation of CeO2 NPs in several different agricultural crops. The detailed results and discussion of this work have been published recently6, so only an overview will be given here.
Experimental
Materials and SamplesTwo different sizes of CeO2 NPs were used in this study: 30-50 nm (US Research Nanomaterials™, Houston, Texas, USA) and 50-100 nm (Nanostructured and Amorphous Materials Inc., Houston, Texas, USA). In addition, citrate-stabilized 50 nm gold NPs (nanoComposix™, San Diego, California, USA) were used to determine the transport efficiency of the SP-ICP-MS system. Other materials used included tomato, cucumber, pumpkin, and soybean seeds (Johnny’s Selected Seeds, Winslow, Maine, USA), Macroenzyme R-10 (bioWORLD™, Dublin, Ohio, USA) for enzymatic digestion of the plants, 1000 mg/L Ce standard (High Purity Standards™, Charleston, South Carolina, USA), and 2-(N-morpholino) ethanesulfonic acid (MES; Sigma-Aldrich™, St. Louis, Missouri, USA).
Plant Growth and CeO2 Nanoparticle ExposurePlants were grown from seeds under controlled conditions at 25 °C with 16 hours of light and eight hours of darkness per day. After 1.5-2.5 weeks, 7 mg/L of the 30-50 nm CeO2 NPs were added to the growing medium. The plants were then harvested for analysis after 19 days of exposure to the CeO2 NPs. Three replicate plants of each species, as well as controls (i.e. plants without CeO2 NPs dosed), were grown.
Enzymatic Digestion of Plant ShootsFor NP analysis, it is important to extract the NPs without dissolving them. For that to be accomplished, traditional acidic digestions cannot be used; instead, a recently developed enzymatic digestion method4 was used with slight modification. After harvesting, the shoots were separated from roots, washed, cut into small pieces, and homogenized in 20 mM MES at pH 5. Next, the enzyme solution (30 mg/mL of Macerozyme R-10 in 20 mM MES) was added, and the samples were agitated for 24 hours at 37 °C in a waterbath shaker. The samples were allowed to settle for 30-60 minutes before 0.1 mL of the supernatant was removed and diluted 100-fold with the MES for SP-ICP-MS analysis.
Instrumentation and AnalysisAll analyses were done on a PerkinElmer NexION® 350D ICP-MS using the conditions shown in Table 1. For SP-ICP-MS, all data collection and analysis was performed using the Syngistix™ Nano Application Software Module. Ce was monitored at m/z 140 for all measurements due to its high natural abundance (88.48%) and lack of interferences. Dissolved Ce prepared in diluted plant matrix was used to calibrate the particulate Ce as CeO2 and to quantify the dissolved Ce in plant shoots. The transport efficiency was determined using gold NPs in plant shoot matrices.
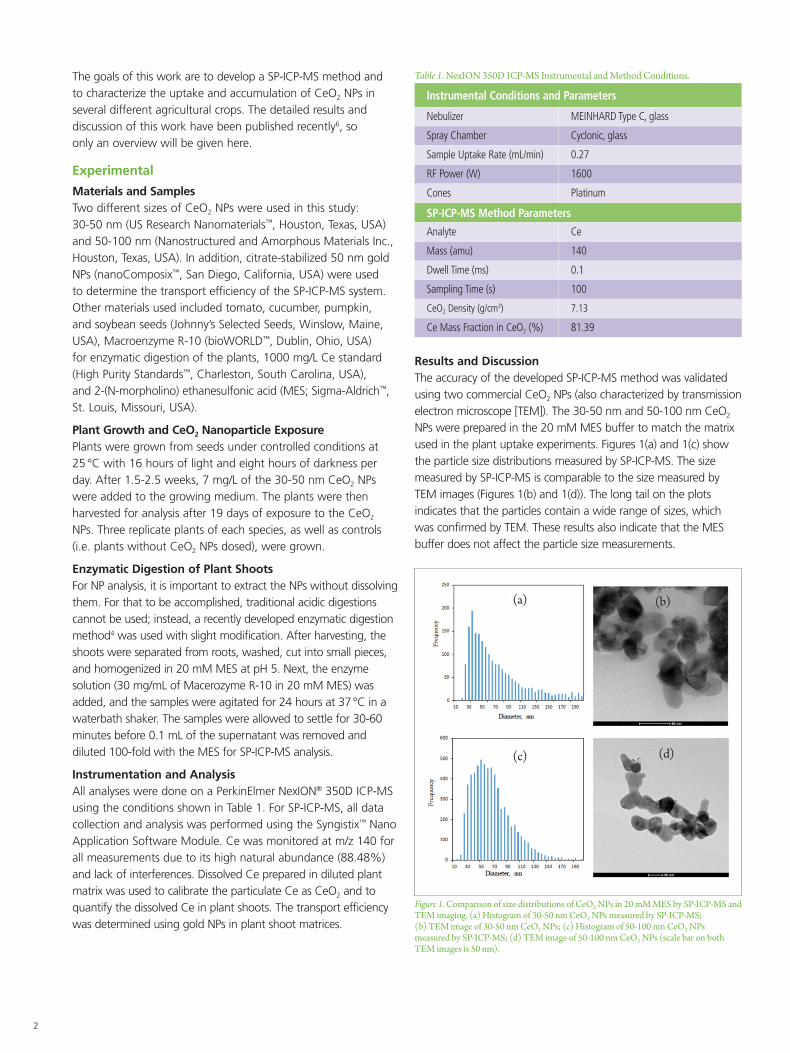
Figure 1. Comparison of size distributions of CeO2 NPs in 20 mM MES by SP-ICP-MS and TEM imaging. (a) Histogram of 30-50 nm CeO2 NPs measured by SP-ICP-MS; (b) TEM image of 30-50 nm CeO2 NPs; (c) Histogram of 50-100 nm CeO2 NPs measured by SP-ICP-MS; (d) TEM image of 50-100 nm CeO2 NPs (scale bar on both TEM images is 50 nm).
Table 1. NexION 350D ICP-MS Instrumental and Method Conditions.
Instrumental Conditions and Parameters
Nebulizer MEINHARD Type C, glass
Spray Chamber Cyclonic, glass
Sample Uptake Rate (mL/min) 0.27
RF Power (W) 1600
Cones Platinum
SP-ICP-MS Method Parameters
Analyte Ce
Mass (amu) 140
Dwell Time (ms) 0.1
Sampling Time (s) 100
CeO2 Density (g/cm3) 7.13
Ce Mass Fraction in CeO2 (%) 81.39
Results and DiscussionThe accuracy of the developed SP-ICP-MS method was validated using two commercial CeO2 NPs (also characterized by transmission electron microscope [TEM]). The 30-50 nm and 50-100 nm CeO2 NPs were prepared in the 20 mM MES buffer to match the matrix used in the plant uptake experiments. Figures 1(a) and 1(c) show the particle size distributions measured by SP-ICP-MS. The size measured by SP-ICP-MS is comparable to the size measured by TEM images (Figures 1(b) and 1(d)). The long tail on the plots indicates that the particles contain a wide range of sizes, which was confirmed by TEM. These results also indicate that the MES buffer does not affect the particle size measurements.
(a)
(c)
(b)
(d)

3
After the accuracy of the methodology was established, the 50-100 nm CeO2 NPs were spiked into the enzyme-digested shoot sample of each plant type after 100-fold dilution in the 20 mM MES buffer. The results of matching sizes indicate that the diluted plant matrix does not affect the SP-ICP-MS size measurements. One of the representative size distribution histograms is shown in Figure 2(a).
To explore the effect of the enzymatic digestion on CeO2 NP size measurement, two solutions of the 1 μg/L, 50-100 nm CeO2 NPs were made: one was measured immediately, while the other was digested with the enzyme for 24 hours, as described above. Figures 2(b) and 2(c) show the particle size distributions of three replicate measurements of each solution. Since the size distributions and measurements are the same for both solutions, it is established that enzyme digestion does not affect the CeO2 NPs. In addition, good reproducibility of the SP-ICP-MS measurements is also established.
To determine if CeO2 NP uptake by plants is occurring, samples of each plant grown both with and without exposure to CeO2 NPs were studied. The exposed plants were in contact with 7 mg/L of the 30-50 nm CeO2 NPs for 19 days hydroponically. Figure 3 shows the raw data plots (time vs. intensity) of the results for tomato shoots. Similar results were obtained from the other plant shoot samples. The data in Figure 3(a) is for the plant shoots which were not exposed to the CeO2 NPs, and the data in Figure 3(b) is for the plant shoots that had CeO2 NP exposure. No significant particulate Ce or dissolved Ce was seen for the plant without CeO2 NP exposure. The continuous signal shown in the Figure 3(b) indicates that dissolved Ce was present in the plant shoot after being exposed to CeO2 NPs for 19 days hydroponically. Selected samples were also filtered through Millipore™ 5 kDa Ultrafree®-MC centrifugal filters after enzymatic digestion. Continuous signal was still observed, which confirmed the presence of dissolved Ce in the plant shoot, and subsequently indicates CeO2 NPs had been biotransformed to dissolved Ce by the plants.
Figure 2. (a) Size distribution of the 50-100 nm CeO2 NPs spiked in the tomato plant digestates after 100-fold dilution in the 20 mM MES buffer; (b) The size distribution of 50-100 nm CeO2 NPs after 24-hour digestion in enzyme solution at 37 °C; (c) the size distribution of freshly prepared 50-100 nm CeO2 NPs in enzyme solution.
0
100
200
300
400
500
600
700
10 30 50 70 90 110
130
150
170
190
Freq
uenc
y
Diameter, nm
(a)
0
100
200
300
400
500
600
10 30 50 70 90 110
130
150
170
190
Freq
uenc
y
(b)
Replicate 1Replicate 2Replicate 3
0
100
200
300
400
500
600
10 30 50 70 90 110
130
150
170
190
Freq
uenc
y
(c)
Replicate 1Replicate 2Replicate 3
Diameter, nm Diameter, nm
0
100
200
300
400
500
600
700
10 30 50 70 90 110
130
150
170
190
Freq
uenc
y
Diameter, nm
(a)
0
100
200
300
400
500
600
10 30 50 70 90 110
130
150
170
190
Freq
uenc
y
(b)
Replicate 1Replicate 2Replicate 3
0
100
200
300
400
500
600
10 30 50 70 90 110
130
150
170
190
Freq
uenc
y
(c)
Replicate 1Replicate 2Replicate 3
Diameter, nm Diameter, nm
Figure 3. (a) Raw data of plant tomato shoots not exposed to CeO2 NPs; (b) Raw data of plant tomato shoots exposed to 30-50 nm CeO2 NPs (7 mg/L) for 19 days. The insets show the data points for the first second of data acquisition.
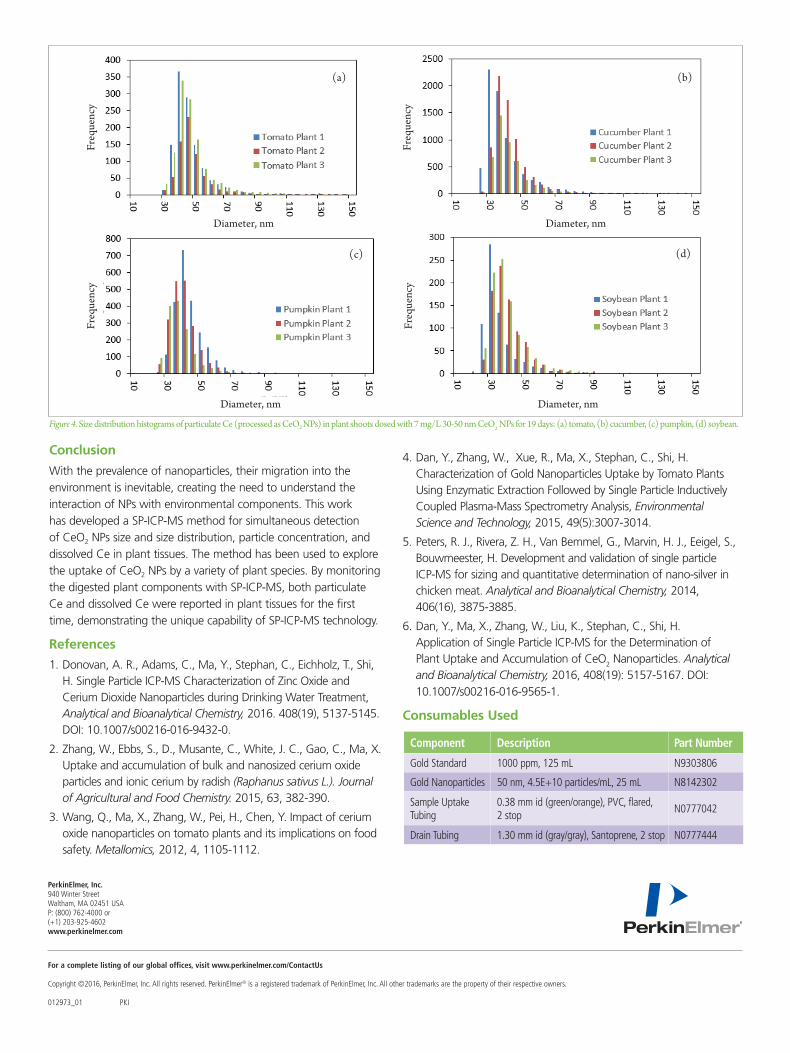
The pulse signals in Figure 3(b) represent particulate Ce. These pulsed signals might be either CeO2 NPs, undigested plant tissue residual colloids with Ce ions adsorbed onto them, or a combination of both. The size distribution of particulate Ce shown in Figure 4 suggests dosed CeO2 NPs. However, this could not be confirmed by SP-ICP-MS, and further investigation is needed. Nevertheless, this study unequivocally demonstrated the presence of dissolved Ce in plant shoots hydroponically exposed to CeO2 NPs for the first time. In addition, the unique capability of the SP-ICP-MS methodology allows the dissolved and particulate forms of NPs in plants to be distinguished.
(a)
(b)
(c)
(a)
(b)
For a complete listing of our global offices, visit www.perkinelmer.com/ContactUs
Copyright ©2016, PerkinElmer, Inc. All rights reserved. PerkinElmer® is a registered trademark of PerkinElmer, Inc. All other trademarks are the property of their respective owners. 012973_01 PKI
PerkinElmer, Inc. 940 Winter Street Waltham, MA 02451 USA P: (800) 762-4000 or (+1) 203-925-4602www.perkinelmer.com
4. Dan, Y., Zhang, W., Xue, R., Ma, X., Stephan, C., Shi, H. Characterization of Gold Nanoparticles Uptake by Tomato Plants Using Enzymatic Extraction Followed by Single Particle Inductively Coupled Plasma-Mass Spectrometry Analysis, Environmental Science and Technology, 2015, 49(5):3007-3014.
5. Peters, R. J., Rivera, Z. H., Van Bemmel, G., Marvin, H. J., Eeigel, S., Bouwmeester, H. Development and validation of single particle ICP-MS for sizing and quantitative determination of nano-silver in chicken meat. Analytical and Bioanalytical Chemistry, 2014, 406(16), 3875-3885.
6. Dan, Y., Ma, X., Zhang, W., Liu, K., Stephan, C., Shi, H. Application of Single Particle ICP-MS for the Determination of Plant Uptake and Accumulation of CeO2 Nanoparticles. Analytical and Bioanalytical Chemistry, 2016, 408(19): 5157-5167. DOI: 10.1007/s00216-016-9565-1.
Consumables Used
Figure 4. Size distribution histograms of particulate Ce (processed as CeO2 NPs) in plant shoots dosed with 7 mg/L 30-50 nm CeO2 NPs for 19 days: (a) tomato, (b) cucumber, (c) pumpkin, (d) soybean.
Freq
uenc
y
Diameter, nm Fr
eque
ncy
Diameter, nm
Conclusion
With the prevalence of nanoparticles, their migration into the environment is inevitable, creating the need to understand the interaction of NPs with environmental components. This work has developed a SP-ICP-MS method for simultaneous detection of CeO2 NPs size and size distribution, particle concentration, and dissolved Ce in plant tissues. The method has been used to explore the uptake of CeO2 NPs by a variety of plant species. By monitoring the digested plant components with SP-ICP-MS, both particulate Ce and dissolved Ce were reported in plant tissues for the first time, demonstrating the unique capability of SP-ICP-MS technology.
References
1. Donovan, A. R., Adams, C., Ma, Y., Stephan, C., Eichholz, T., Shi, H. Single Particle ICP-MS Characterization of Zinc Oxide and Cerium Dioxide Nanoparticles during Drinking Water Treatment, Analytical and Bioanalytical Chemistry, 2016. 408(19), 5137-5145. DOI: 10.1007/s00216-016-9432-0.
2. Zhang, W., Ebbs, S., D., Musante, C., White, J. C., Gao, C., Ma, X. Uptake and accumulation of bulk and nanosized cerium oxide particles and ionic cerium by radish (Raphanus sativus L.). Journal of Agricultural and Food Chemistry. 2015, 63, 382-390.
3. Wang, Q., Ma, X., Zhang, W., Pei, H., Chen, Y. Impact of cerium oxide nanoparticles on tomato plants and its implications on food safety. Metallomics, 2012, 4, 1105-1112.
Component Description Part Number
Gold Standard 1000 ppm, 125 mL N9303806
Gold Nanoparticles 50 nm, 4.5E+10 particles/mL, 25 mL N8142302
Sample Uptake Tubing
0.38 mm id (green/orange), PVC, flared, 2 stop
N0777042
Drain Tubing 1.30 mm id (gray/gray), Santoprene, 2 stop N0777444
Freq
uenc
y
Diameter, nm
Fr
eque
ncy
Diameter, nm
(a) (b)
(c) (d)