ICL REPORTS STRONG Q4 AND FULL YEAR 2018...
33
1 INVESTOR RELATIONS CONTACT PRESS CONTACT Limor Gruber Maya Avishai Head of Investor Relations Head of Global External Communications +972-3-684-4471 +972-3-684-4477 [email protected] [email protected] ICL REPORTS STRONG Q4 AND FULL YEAR 2018 RESULTS Top Line Growth and margin expansion in All of ICL's Value Chains 2018: - Annual sales of $5.56 billion compared to $5.42 billion for 2017. Sales excluding divested businesses of $5.51 billion compared to $5.08 for 2017, a growth of 8% - Operating income of $1,519 million compared to $629 million for 2017. Adjusted operating income excluding divested businesses increased by 42% to $750 million - Net income more than tripled compared to 2017. Adjusted net income excluding divested businesses increased by approximately 50% - Net debt to EBITDA ratio decreased to 1.9 at the end of 2018 from 2.9 at the end of 2017 - EPS of 97 cents compared to 29 cents in 2017. Adjusted EPS excluding divestments of 37 cents vs. 25 cents in 2017 Q4: - Fourth quarter sales of $1.41 billion compared to $1.36 billion for Q4 2017, or compared to $1.30 billion excluding divested businesses, a growth of 8% - Operating income of $166 million, compared to $189 million in Q4 2017. Adjusted operating income excluding divested businesses of $214 million compared to $153 million in Q4 2017, a growth of 40% - EBITDA excluding divested businesses of $322 million compared to $259 million in Q4 2017 - EPS of 6 cents, adjusted EPS excluding divestments of 10 cents. Dividend of 4.8 cents/share reflects annualized dividend yield of above 3% Tel Aviv, Israel, February 6, 2019 – ICL (NYSE & TASE: ICL), a leading global specialty minerals and specialty chemicals company, today reported its financial results for the fourth quarter and year ended December 31, 2018. Sales for the fourth quarter were $1,410 million compared to $1,361 million for the comparable period in 2017, a growth of 4%. Compared to sales excluding divested businesses of $1,301 million in Q4 2017, sales grew by 8%. The Company reported operating income of $166 million for Q4 2018 compared to $189 million for Q4 2017, which included a capital gain of $48 million. Adjusted operating income was $214 million, compared to adjusted operating income excluding divested businesses of $153 million in Q4 2017, an increase of 40%. Net income was $82 million for the fourth quarter of 2018 compared to $155 million in the comparable period in 2017. Higher prices across the board led to an increase of 24% in Q4 2018 EBITDA to $322 million,
Transcript of ICL REPORTS STRONG Q4 AND FULL YEAR 2018...

1
INVESTOR RELATIONS CONTACT PRESS CONTACT
Limor Gruber Maya Avishai
Head of Investor Relations Head of Global External Communications
+972-3-684-4471 +972-3-684-4477 [email protected] [email protected]
ICL REPORTS STRONG Q4 AND FULL YEAR 2018
RESULTS
Top Line Growth and margin expansion in All of ICL's Value Chains
2018:
- Annual sales of $5.56 billion compared to $5.42 billion for 2017. Sales
excluding divested businesses of $5.51 billion compared to $5.08 for 2017, a
growth of 8%
- Operating income of $1,519 million compared to $629 million for 2017.
Adjusted operating income excluding divested businesses increased by 42% to
$750 million
- Net income more than tripled compared to 2017. Adjusted net income
excluding divested businesses increased by approximately 50%
- Net debt to EBITDA ratio decreased to 1.9 at the end of 2018 from 2.9 at the
end of 2017
- EPS of 97 cents compared to 29 cents in 2017. Adjusted EPS excluding
divestments of 37 cents vs. 25 cents in 2017
Q4:
- Fourth quarter sales of $1.41 billion compared to $1.36 billion for Q4 2017, or
compared to $1.30 billion excluding divested businesses, a growth of 8%
- Operating income of $166 million, compared to $189 million in Q4 2017.
Adjusted operating income excluding divested businesses of $214 million
compared to $153 million in Q4 2017, a growth of 40%
- EBITDA excluding divested businesses of $322 million compared to $259
million in Q4 2017
- EPS of 6 cents, adjusted EPS excluding divestments of 10 cents. Dividend of
4.8 cents/share reflects annualized dividend yield of above 3%
Tel Aviv, Israel, February 6, 2019 – ICL (NYSE & TASE: ICL), a leading global
specialty minerals and specialty chemicals company, today reported its financial results
for the fourth quarter and year ended December 31, 2018.
Sales for the fourth quarter were $1,410 million compared to $1,361 million for the
comparable period in 2017, a growth of 4%. Compared to sales excluding divested
businesses of $1,301 million in Q4 2017, sales grew by 8%. The Company reported
operating income of $166 million for Q4 2018 compared to $189 million for Q4 2017,
which included a capital gain of $48 million. Adjusted operating income was $214
million, compared to adjusted operating income excluding divested businesses of $153
million in Q4 2017, an increase of 40%. Net income was $82 million for the fourth
quarter of 2018 compared to $155 million in the comparable period in 2017. Higher
prices across the board led to an increase of 24% in Q4 2018 EBITDA to $322 million,
2
compared to $259 million in Q4 2017, excluding the contribution of divested
businesses.
Operating income for the year ended December 31, 2018, including a capital gain of
$841 million from the sale of the Fire Safety and Oil Additives businesses, amounted
to $1,519 million, an increase of about 140% over 2017. Adjusted operating income
excluding divestments increased by 42% to $750 million for the year ended December
31, 2018, compared to $530 million in 2017, supported by higher selling prices across
all of ICL's value chains. Annual net income more than tripled compared to 2017, and
adjusted net income excluding divestment businesses increased by approximately 50%.
ICL’s CEO, Raviv Zoller, stated, "ICL’s strong results in the fourth quarter, propelled
by positive contributions from each of our value chains, capped an extraordinary year
for the Company. We successfully completed the divestment of our Fire Safety and Oil
Additives businesses which reduced our net debt level substantially and together with
the optimization of our debt structure, created financial flexibility to support our
growth. During 2018 we aligned ICL’s organizational structure to enhance our leading
market positions and promote our growth, while successfully implementing a ‘Value
over Volume’ strategy for our specialty businesses."
Zoller continued, "Our Industrial Products division set an all-time record for annual
profit this year, benefiting from record bromine prices and higher sales volumes of
several products, while our Potash division achieved record production at our Dead Sea
unit. We significantly improved the performance of our potash operations in Spain and
our YPH JV in China, both of which shifted to profitability, as we continued to focus
on cost controls, prudent capital investments and environmental responsibility.
Towards the end of the year, we also commenced commercial operation of our new
power plant in Israel."
Zoller concluded, "We are deeply grateful to our more than 11,000 talented employees
around the globe for the achievements we recorded during the year. We recognize that
it is their dedication and perseverance during challenging periods that allowed us to
take advantage of improved market conditions in 2018 and to move forward into 2019
with strong business momentum."
ICL’s Chairman, Johanan Locker, added, " 2018 represented an important turning
point for ICL. This year we started implementing our new strategy, which was launched
in early 2018 and is focused on enhancing ICL's leadership positions in each of our core
value chains, while expanding our specialty businesses and promoting our Innovative
Ag Solutions offerings. I am confident that ICL will continue to be a flagship of Israeli
industry with a strong global footprint and one of the world’s major fertilizers and
specialty chemicals companies."
3
FINANCIAL RESULTS 12/2018-10 12/2017-10 12/2018-1 12/2017-1
$
millions % of sales
$ millions
% of sales
$ millions
% of sales
$ millions
% of sales
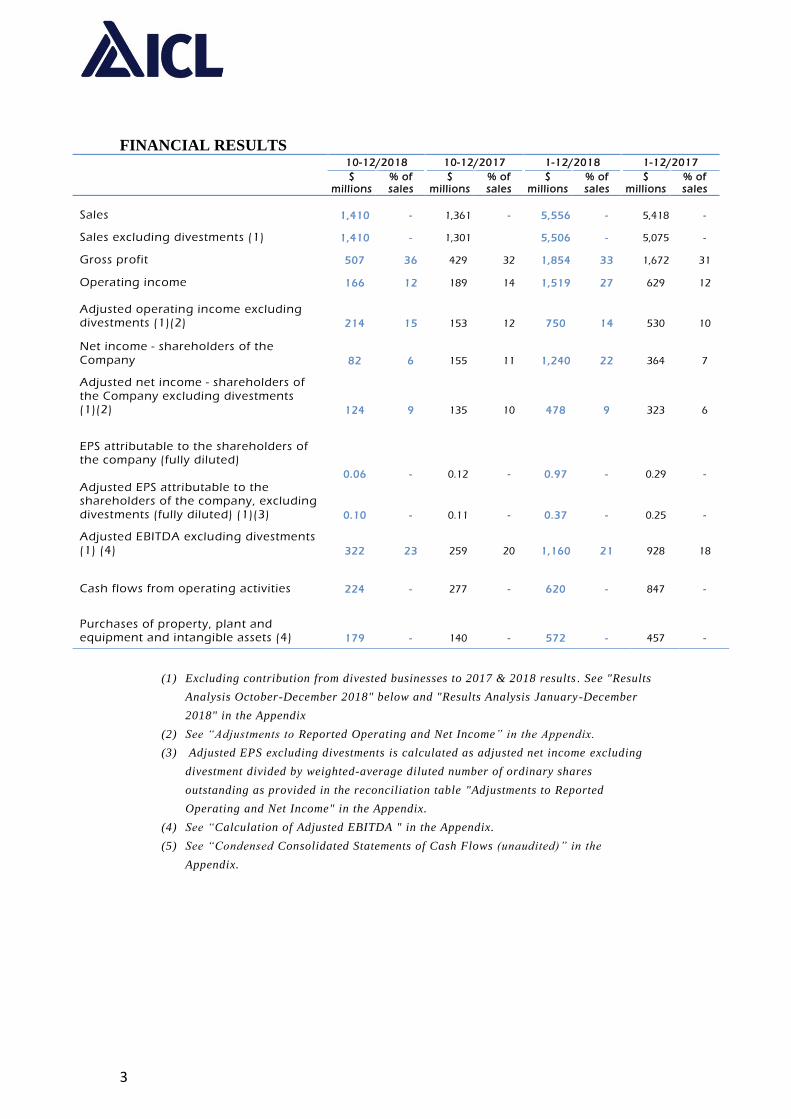
Sales 1,410 - 1,361 - 5,556 - 5,418 -
Sales excluding divestments (1) 1,410 - 1,301 5,506 - 5,075 -
Gross profit 507 36 429 32 1,854 33 1,672 31
Operating income 166 12 189 14 1,519 27 629 12
Adjusted operating income excluding divestments (1)(2) 214 15 153 12 750 14 530 10
Net income - shareholders of the Company 82 6 155 11 1,240 22 364 7
Adjusted net income - shareholders of the Company excluding divestments (1)(2) 124 9 135 10 478 9 323 6
EPS attributable to the shareholders of the company (fully diluted) 0.06 - 0.12 - 0.97 - 0.29 -
Adjusted EPS attributable to the shareholders of the company, excluding divestments (fully diluted) (1)(3) 0.10 - 0.11 - 0.37 - 0.25 -
Adjusted EBITDA excluding divestments (1) (4) 322 23 259 20 1,160 21 928 18
Cash flows from operating activities 224 - 277 - 620 - 847 -
Purchases of property, plant and equipment and intangible assets (4) 179 - 140 - 572 - 457 -
(1) Excluding contribution from divested businesses to 2017 & 2018 results . See "Results
Analysis October-December 2018" below and "Results Analysis January-December
2018" in the Appendix
(2) See “Adjustments to Reported Operating and Net Income” in the Appendix.
(3) Adjusted EPS excluding divestments is calculated as adjusted net income excluding
divestment divided by weighted-average diluted number of ordinary shares
outstanding as provided in the reconciliation table "Adjustments to Reported
Operating and Net Income" in the Appendix.
(4) See “Calculation of Adjusted EBITDA " in the Appendix.
(5) See “Condensed Consolidated Statements of Cash Flows (unaudited)” in the
Appendix.

4
Results Analysis October – December 2018
Sales Expenses Operating
income
$ millions
Q4 2017 figures 1,361 (1,172) 189
Total adjustments Q4 2017* - (21) (21)
Adjusted Q4 2017 figures 1,361 (1,193) 168
Divested businesses contribution 2017 (60) 45 (15)
Adjusted Q4 2017 figures (excluding divested businesses)
1,301 (1,148) 153
Quantity (1) (6) (7)
Price 133 - 133
Exchange rate (23) 30 7
Raw materials - (17) (17)
Energy - 3 3
Transportation - (20) (20)
Operating and other expenses - (38) (38)
Adjusted Q4 2018 figures 1,410 (1,196) 214
Total adjustments Q4 2018* - 48 48
Q4 2018 figures 1,410 (1,244) 166
* See "Adjustments to reported operating and net income (Non-GAAP)" in the appendix. See annual
results analysis in the Appendix.
Revenue: Sales in Q4 2018 were $1,410 million compared to $1,361 million in Q4
2017, an increase of 4%. Sales excluding divestments increased by more than 8% from
$1,301 million in Q4 2017. Higher prices across all of ICL's value chains
overcompensated for the negative impact of the devaluation of the euro and the Chinese
yuan against the US dollar.
FY 2018 sales increased to $5.56 billion compared to $5.42 billion in FY 2017, a
growth of 3%. Sales excluding divestments was $5.51 billion in FY 2018 compared to
$5.08 billion in FY 2017, an increase of more than 8%. Higher prices, the upward
revaluation of the euro against the dollar and higher sales volumes of flame retardants,
specialty fertilizers and dairy proteins more than offset lower sales volumes of potash,
commodity phosphates and specialty phosphates.
Operating income: Operating income in Q4 2018 was $166 million compared to $189
million in Q4 2017, a decrease of 12%, mainly due to a capital gain of $48 million
recorded in the comparable period last year. Adjusted operating income excluding
divestments, which excludes the contribution of divested businesses, provisions for
prior-periods' royalties and for closure costs of the Sallent mine in Spain (towards the
site consolidation and as part of the restoration solution), increased by 40% to $214
million. The increase was driven by higher prices, lower energy costs and favorable
exchange rates (devaluation of the euro, Israeli shekel and yuan decreased costs in
dollar terms). This was partially offset by higher marine transportation and raw material
prices (sulphur used in the phosphate value chain and raw materials used in the
5
production of bromine and phosphorous flame retardants) and other expenses which
include insurance income in Israel recorded in the corresponding quarter of 2017,
inventory write-offs and higher depreciation expenses. The negative impact of sales
volume derives from unfavorable product mix due to an increase in the sales of
Polysulphate and the sales of electricity surplus to third parties from the new power
plant in Sodom together with lower sales volumes of potash, phosphate specialties and
specialty fertilizers. This was partially offset by an increase in the sales volume of
bromine based industrial solutions.
Operating income for FY 2018 was $1,519 million, compared to $629 million for FY
2017, an increase of about 140%. The increase in operating income is mainly attributed
to a capital gain of $841 million from the sale of the Fire Safety and Oil Additives
businesses. Adjusted operating income excluding divestments, which mainly excludes
capital gain and contribution from divestments to 2017 & 2018 results, asset
impairments and provisions for early retirement, legal claims and site closure costs,
amounted to $750 million in 2018 compared to $530 million in 2017, an increase of
42%. The increase is attributed to higher prices and the upward revaluation of the euro
against the dollar. These were partially offset by higher raw material and marine
transportation prices, lower sales volume, insurance income in Israel recorded in 2017,
higher royalties and depreciation and inventory write-offs.
Financing expenses, net: The net reported financing expenses in Q4 2018 amounted
to $66 million, compared to $25 million in the corresponding quarter in 2017. Excluding
expenses deriving from interest on past royalties recognized in the current period, the
net adjusted financing expenses amounted to $59 million compared to $28 million in
Q4 2017 (which excludes an income in connection with a resolution of tax dispute in
Belgium). Interest expenses decreased by $4 million to $25 million. The decrease was
more than offset by an increase in hedging transaction provisions which derived mainly
from the devaluation of the shekel against the dollar, a decrease in interest rates and a
sharp decrease in energy prices towards the end of the quarter.
Net financial expenses for FY 2018 amounted to $158 million compared to $124
million. Excluding expenses deriving from interest on past royalties recognized in 2018
in the amount of $10 million, the net adjusted financing expenses in 2018 amounted to
$148 million. A decrease in interest expenses in the amount of $11 million was more
than offset mainly by lower financial income as a result of change in exchange rate
differences and an increase in provisions for hedging transactions.
Tax expenses: Tax expenses for Q4 2018 amounted to $19 million compared to $13
million in Q4 2017. Excluding the tax impact of the adjustments to operating income
and financial expenses, adjusted tax expenses in Q4 2018 amounted to $32 million,
which reflects an adjusted effective tax rate of 20% (from adjusted income before tax),
compared to $2 million in Q4 2017, which reflects an effective tax rate of 1%. The
unusually low tax rate in 2017 was driven by an adjustment of deferred taxes in respect
of the change in the tax rate in the US in Q4 2017 and a decrease in tax provisions in
Israel related to the Natural Resource Tax Law.
Tax expenses for 2018 amounted to $129 million compared to $158 million in 2017.
Excluding the tax impact of the adjustments to operating income and financial expenses,
adjusted tax expenses in 2018 amounted to $136 million, which reflects an adjusted
effective tax rate of 22% (from adjusted income before tax), compared to $156 million
6
in 2017, which reflects an adjusted effective tax rate of 30%. The decrease in 2018 is
attributed to lower profit deriving from the US, following the divestitures, lower tax rate
in the US, the devaluation of the shekel against the dollar during the year, and a decrease
in tax provisions in Israel.
Cash flow & debt level: In Q4 2018, operating cash flow decreased by $53 million
compared to the corresponding quarter in 2017 to $224 million. This decrease derives
primarily from a decrease of $30 million in working capital recorded in Q4 2018
compared with a decrease of $57 million during Q4 2017. This is attributed to a more
moderate decrease in trade receivables as a result of the late signings of the potash
supply contracts in China and India. In addition, operating cash flow was negatively
impacted by payments of royalties to the Israeli government in respect if prior periods
and cash paid due to derivatives transactions. These were partly offset by lower tax
payments in this quarter compared with the corresponding quarter last year.
Operating cash flow for 2018 amounted to $620 million compared to $847 million in
2017. The decrease is attributed to an increase in inventory and trade receivables.
Cash flow used for the purchase of property, plant, equipment and intangible assets
amounted to $179 million and $572 million in Q4 2018 and FY 2018, respectively,
compared to $140 million and $457 million in Q4 2017 and FY 2017, respectively. The
increase derives mainly from several infrastructure projects in ICL's potash division.
The Company’s net financial liabilities at the end of 2018 amounted to $2,212 million,
a decrease of $825 million compared to December 31, 2017. The significant decrease
is mainly due to proceeds received from the sale of the Fire Safety and Oil Additives
businesses.
REVIEW OF OPERATING SEGMENTS
Industrial Products
ICL’s global leadership in the bromine industry is driven by its focus on delivering
value to its customers rather than increasing volume. ICL is able to generate more value
by leveraging its unique assets and know-how and by fostering innovation through the
development of new applications, such as new bromine and phosphorus-based flame
retardants, magnesia and salt products, as well as other solutions. ICL continues to
leverage its unique logistical advantages and unparalleled experience related to the
safety and environmental aspects of its Bromine business.
The Industrial Products segment recorded another strong quarter driven by higher prices
across its bromine value chain as well as most of its complementary businesses, and
resulting in an all-time record of annual segment profit. Higher prices drove an
approximately 2% expansion in quarterly and annual segment profit margins.
Industrial Products accounted for 22% of sales and 30% of profit attributed to segments
in Q4 2018 compared to 22% of sales and 31% of profit attributed to segments in Q4
2017. The segment accounted for 23% of sales and 35% of profit attributed to segments
in 2018 compared to 22% of sales and 33% of profit attributed to segments in 2017.
7
Significant Highlights and Business Environment
During Q4 2018 elemental bromine prices in China increased compared to Q3
2018 and compared to Q4 2017 as local bromine production was affected by
strict environmental-related regulatory pressure and the winter shutdown.
Demand for bromine-based flame retardants during Q4 was lower compared to
prior periods. However, the segment is benefitting from higher prices as a result
of elevated bromine prices.
ICL Industrial Products successfully secured several supply agreements for
bromine compounds for 2019, mostly with higher prices and stable volumes.
ICL continues its efforts to conclude additional agreements.
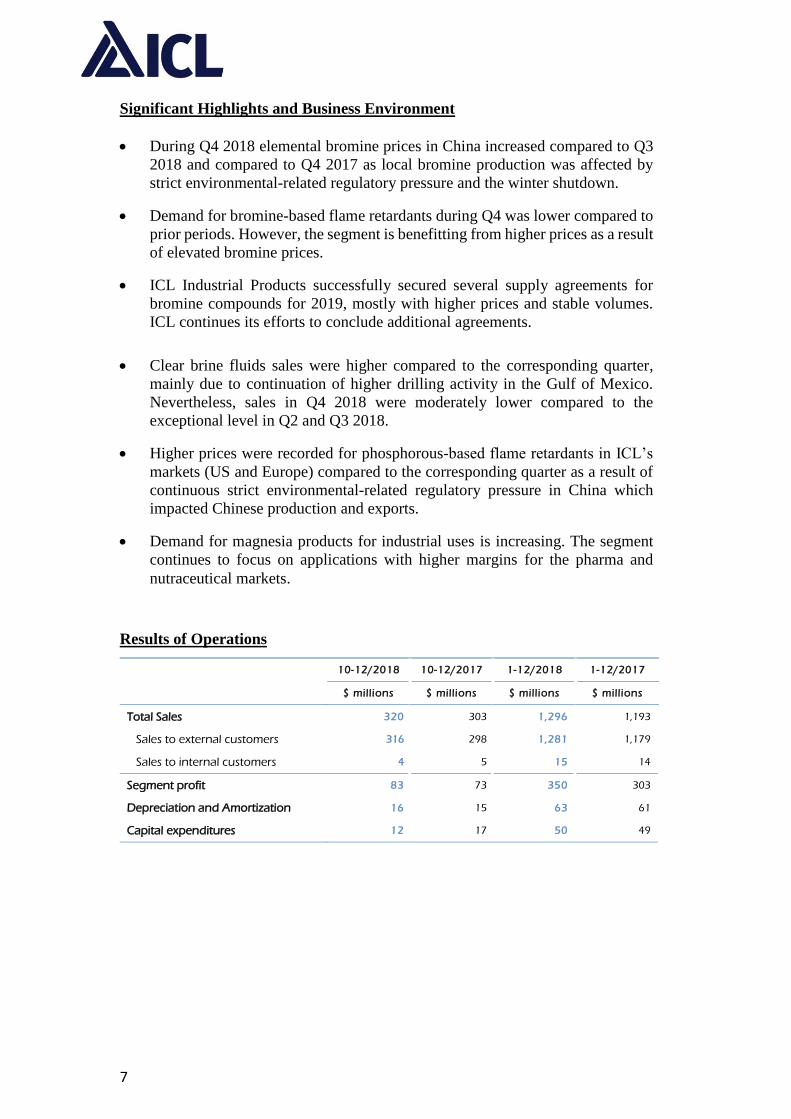
Total Sales 320 303 1,296 1,193
Sales to external customers 316 298 1,281 1,179
Sales to internal customers 4 5 15 14
Segment profit 83 73 350 303
Depreciation and Amortization 16 15 63 61
Capital expenditures 12 17 50 49
Clear brine fluids sales were higher compared to the corresponding quarter,
mainly due to continuation of higher drilling activity in the Gulf of Mexico.
Nevertheless, sales in Q4 2018 were moderately lower compared to the
exceptional level in Q2 and Q3 2018.
Higher prices were recorded for phosphorous-based flame retardants in ICL’s
markets (US and Europe) compared to the corresponding quarter as a result of
continuous strict environmental-related regulatory pressure in China which
impacted Chinese production and exports.
Demand for magnesia products for industrial uses is increasing. The segment
continues to focus on applications with higher margins for the pharma and
nutraceutical markets.
Results of Operations
12/2018-10 12/2017-10 12/2018-1 12/2017-1
$ millions $ millions $ millions $ millions
8
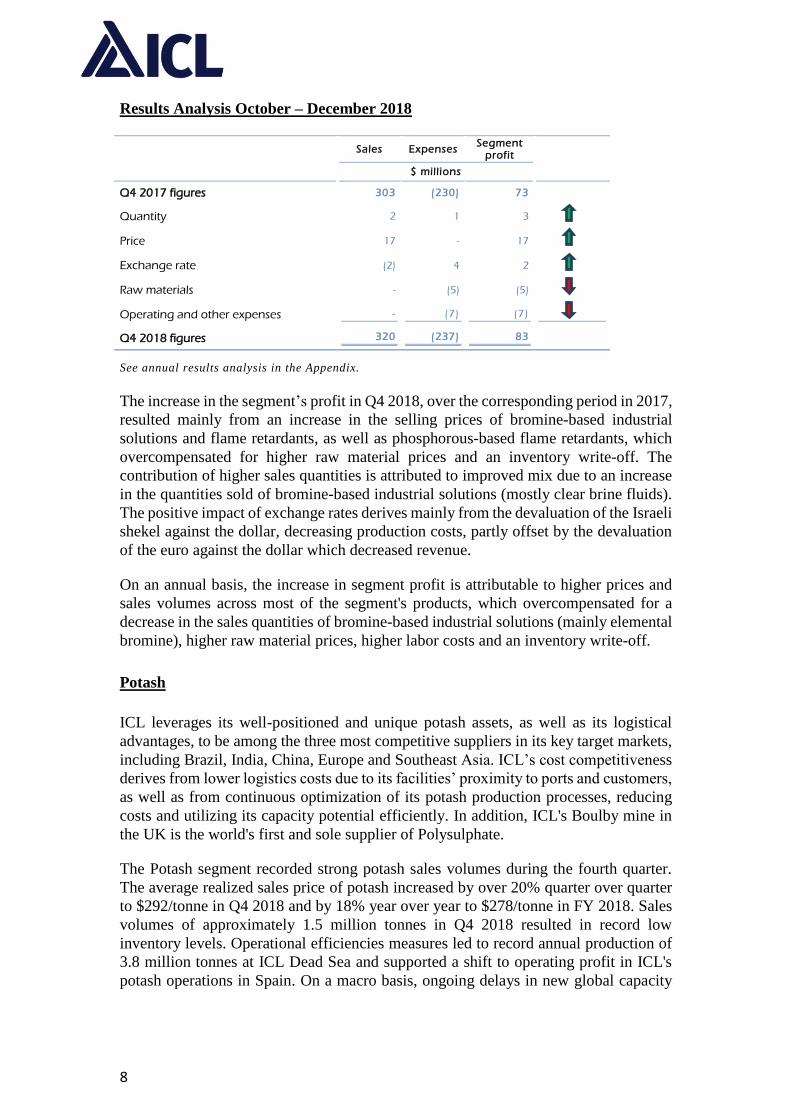
Results Analysis October – December 2018
Sales Expenses Segment
profit
$ millions
Q4 2017 figures 303 (230) 73
Quantity 2 1 3
Price 17 - 17
Exchange rate (2) 4 2
Raw materials - (5) (5)
Operating and other expenses - (7) (7)
Q4 2018 figures 320 (237) 83
See annual results analysis in the Appendix.
The increase in the segment’s profit in Q4 2018, over the corresponding period in 2017,
resulted mainly from an increase in the selling prices of bromine-based industrial
solutions and flame retardants, as well as phosphorous-based flame retardants, which
overcompensated for higher raw material prices and an inventory write-off. The
contribution of higher sales quantities is attributed to improved mix due to an increase
in the quantities sold of bromine-based industrial solutions (mostly clear brine fluids).
The positive impact of exchange rates derives mainly from the devaluation of the Israeli
shekel against the dollar, decreasing production costs, partly offset by the devaluation
of the euro against the dollar which decreased revenue.
On an annual basis, the increase in segment profit is attributable to higher prices and
sales volumes across most of the segment's products, which overcompensated for a
decrease in the sales quantities of bromine-based industrial solutions (mainly elemental
bromine), higher raw material prices, higher labor costs and an inventory write-off.
Potash ICL leverages its well-positioned and unique potash assets, as well as its logistical
advantages, to be among the three most competitive suppliers in its key target markets,
including Brazil, India, China, Europe and Southeast Asia. ICL’s cost competitiveness
derives from lower logistics costs due to its facilities’ proximity to ports and customers,
as well as from continuous optimization of its potash production processes, reducing
costs and utilizing its capacity potential efficiently. In addition, ICL's Boulby mine in
the UK is the world's first and sole supplier of Polysulphate.
The Potash segment recorded strong potash sales volumes during the fourth quarter.
The average realized sales price of potash increased by over 20% quarter over quarter
to $292/tonne in Q4 2018 and by 18% year over year to $278/tonne in FY 2018. Sales
volumes of approximately 1.5 million tonnes in Q4 2018 resulted in record low
inventory levels. Operational efficiencies measures led to record annual production of
3.8 million tonnes at ICL Dead Sea and supported a shift to operating profit in ICL's
potash operations in Spain. On a macro basis, ongoing delays in new global capacity
9
ramp-up are contributing to a balanced market, reflected in solid pricing during the off-
season period.
The Potash segment accounted for 33% of sales and 57% of profit attributed to
segments in the fourth quarter of 2018, compared to 28% of sales and 50% of profit
attributed to segments in Q4 2017. The segment accounted for 27% of sales and 39%
of profit attributed to segments in 2018 compared to 23% of sales and 31% of profit
attributed to segments in 2017.
Significant Highlights and Business Environment
Potash prices continued to increase during Q4 2018 despite the agricultural
season ending in key regions, including Brazil, US and Europe, supported by
low availability of product for spot sales. This can be considered as a positive
indication towards the first quarter of 2019. According to CRU (Fertilizer Week
Historical Prices, January 2019) the average price of granular potash imported
to Brazil for Q4 2018 was $350 per tonne (CFR), up by 6.1% and 25%
compared to Q3 2018 and Q4 2017, respectively.
The Grain price index, which peaked during Q2 2018, remained quite steady
during Q4 as corn and soybean prices increased while wheat and rice prices
decreased. The increase in soybean price is explained by a decrease in its
production in the US, mainly due to the US-China trade dispute resulting in a
decrease in the US export to China. This has led to an increase in Chinese
soybean imports from Brazil while the US has increased its soybean export to
other geographical markets. The decrease in wheat prices is related mainly to
higher exports from Russia and an increase in the production in Canada, which
were higher than the decrease in exports from Australia due to a continuing
drought in the latter, according to the WASDE (World Agricultural Supply and
Demand Estimates) reports from November and December 2018.
Based on the aforementioned reports, the grains stock to use ratio for the
2018/2019 agricultural year is expected to decrease to 29.01%, compared with
31.20% at the end of the 2017/2018 agricultural year and compared with
30.55% in the 2016/2017 agricultural year. This trend of lower stock-to-use
ratio may be supportive for fertilizer demand.
According to preliminary data, potash imports to China in 2018 reached 7.5
million tonnes, a decrease of 1% compared to 2017.
According to the FAI (Fertilizer Association of India), potash imports during
2018 amounted to 4.4 million tonnes, a 1% increase over 2017. The moderate
increase can be explained by low availability of potash.
According to preliminary data, potash imports into Brazil during 2018 were
over 10.5 million tonnes, surpassing last year's record by 8%.
Supply side developments: EuroChem (Russia) announced that it has cut its
forecast for 2018 output from its new potash mines, Usolskiy and Volgakaliy,
to a total of about 0.3 million tonnes. The Turkmenhimiya (Turkmenistan)
Garlyk mine (nameplate capacity of 1.4 million tonnes per year) is believed to
be inoperable. The ramp-up of Slavkaliy's (Belarus) Nezhinsky Potash project
10
(nameplate capacity of 1 million tonnes per year) is expected to be delayed from
2020 to 2022. K+S (Germany) closed its Sigmundshall site (0.6 million tonnes
per year). It is assumed that problems with K+S' granulation stage production
process in the Bethune mine in Saskatchewan led it to deliver standard MOP to
China. Mosaic commissioned the new production skip at its Esterhazy K3
potash mine in Saskatchewan (Canada) on December 2018. This project is
expected to reach its full operational capacity (7.35 million tonnes per year) by
2024.
In November 2018, ICL signed framework agreements with its customers in
China for 2019-2021, to supply a total of 3 million tonnes of potash, with
additional options for 0.75 million tonnes. Prices will be subject to the
prevailing market prices in China at the relevant date of supply.
In December 2018, ICL signed a five-year potash supply agreement with Indian
Potash Limited ("IPL"), India's largest importer of potash. According to the
agreement, ICL is expected to supply IPL with 600 thousand tonnes per year in
2019 and 2020, increasing to 650 thousand tonnes per year from 2021 to2023
(including optional quantities). Prices will be determined in accordance with the
prevailing market prices in India at the relevant date of supply.
ICL continues to ramp-up Polysulphate production in the Boulby mine in the
UK, towards reaching 1 million tonnes run-rate by the end of 2020, which is
required in order to achieve profitability.
Part of the Company's strategy is to grow its FertilizerpluS platform, by, among
other things, utilizing Polysulphate as a base for a product portfolio which
includes PotashpluS, PKpluS and other products. Sales of FertilizerpluS in 2018
totaled $114 million. In December 2018, ICL signed a new supply agreement
for Polysulphate and its derivatives with customers in China for 2019 in a total
quantity of 89 thousand tonnes.
Global demand for magnesium remained constrained in China, Brazil and
Europe. This was partly offset by an improvement in the US market as trade
restrictions have pushed up prices in the steel, aluminum and automotive
sectors, which in turn has caused a resumption of domestic production, and
consequent demand for raw materials, including magnesium.
On October 24, 2018 a petition was filed with the International Trade
Administration of the US Department of Commerce and the US International
Trade Commission by a US magnesium competitor, US Magnesium, to impose
antidumping and countervailing duties on imports of magnesium from Israel.
US Magnesium claims that imports of magnesium produced in Israel by Dead
Sea Magnesium Ltd. are being subsidized and are being sold at less than fair
value in the US market. At this time, it is not possible to determine whether the
petition will be successful or whether tariffs will be imposed in the future.
Market reaction has seen impacts through increased prices coupled with future
supply concerns on the part of consumers.
11
Results of Operations
12/2018-10 12/2017-10 12/2018-1 12/2017-1
$ millions $ millions $ millions $ millions
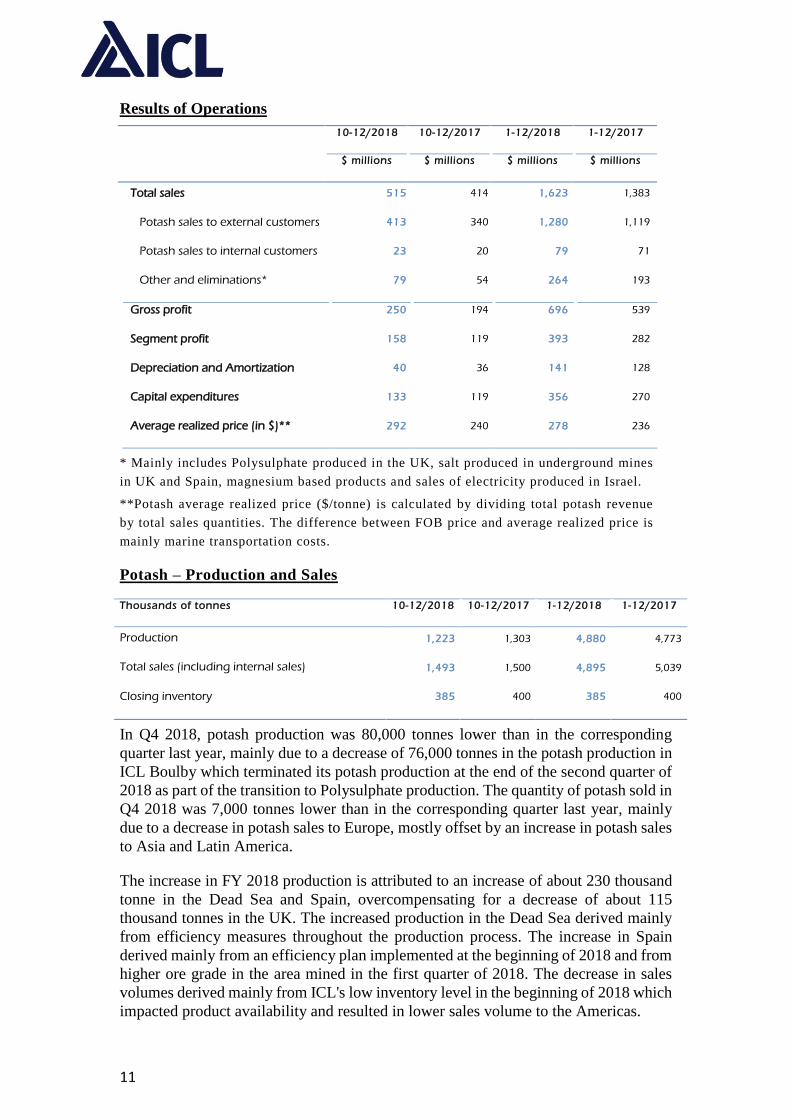
Total sales 515 414 1,623 1,383
Potash sales to external customers 413 340 1,280 1,119
Potash sales to internal customers 23 20 79 71
Other and eliminations* 79 54 264 193
Gross profit 250 194 696 539
Segment profit 158 119 393 282
Depreciation and Amortization 40 36 141 128
Capital expenditures 133 119 356 270
Average realized price (in $)** 292 240 278 236
* Mainly includes Polysulphate produced in the UK, salt produced in underground mines
in UK and Spain, magnesium based products and sales of electricity produced in Israel.
**Potash average realized price ($/tonne) is calculated by dividing total potash revenue
by total sales quantities. The difference between FOB price and average realized price is
mainly marine transportation costs.
Potash – Production and Sales Thousands of tonnes 10-12/2018 10-12/2017 1-12/2018 1-12/2017
Production 1,223 1,303 4,880 4,773
Total sales (including internal sales) 1,493 1,500 4,895 5,039
Closing inventory 385 400 385 400
In Q4 2018, potash production was 80,000 tonnes lower than in the corresponding
quarter last year, mainly due to a decrease of 76,000 tonnes in the potash production in
ICL Boulby which terminated its potash production at the end of the second quarter of
2018 as part of the transition to Polysulphate production. The quantity of potash sold in
Q4 2018 was 7,000 tonnes lower than in the corresponding quarter last year, mainly
due to a decrease in potash sales to Europe, mostly offset by an increase in potash sales
to Asia and Latin America.
The increase in FY 2018 production is attributed to an increase of about 230 thousand
tonne in the Dead Sea and Spain, overcompensating for a decrease of about 115
thousand tonnes in the UK. The increased production in the Dead Sea derived mainly
from efficiency measures throughout the production process. The increase in Spain
derived mainly from an efficiency plan implemented at the beginning of 2018 and from
higher ore grade in the area mined in the first quarter of 2018. The decrease in sales
volumes derived mainly from ICL's low inventory level in the beginning of 2018 which
impacted product availability and resulted in lower sales volume to the Americas.
12
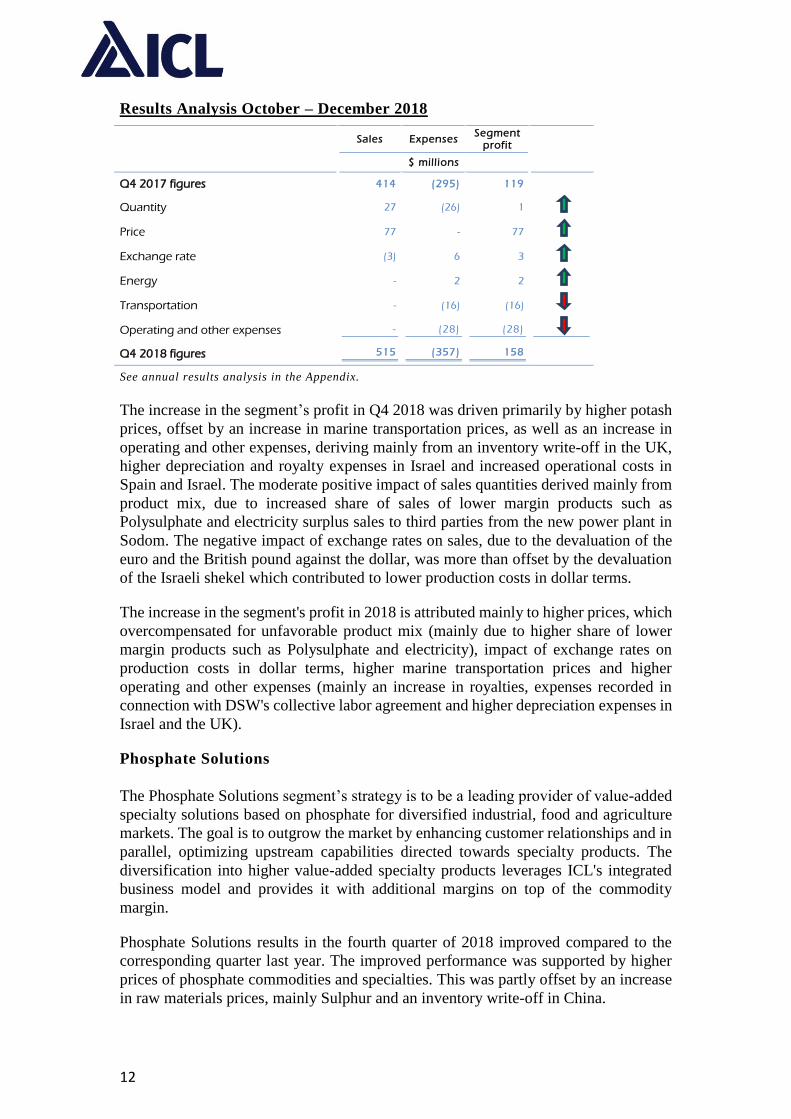
Results Analysis October – December 2018
Sales Expenses Segment
profit
$ millions
Q4 2017 figures 414 (295) 119
Quantity 27 (26) 1
Price 77 - 77
Exchange rate (3) 6 3
Energy - 2 2
Transportation - (16) (16)
Operating and other expenses - (28) (28)
Q4 2018 figures 515 (357) 158
See annual results analysis in the Appendix.
The increase in the segment’s profit in Q4 2018 was driven primarily by higher potash
prices, offset by an increase in marine transportation prices, as well as an increase in
operating and other expenses, deriving mainly from an inventory write-off in the UK,
higher depreciation and royalty expenses in Israel and increased operational costs in
Spain and Israel. The moderate positive impact of sales quantities derived mainly from
product mix, due to increased share of sales of lower margin products such as
Polysulphate and electricity surplus sales to third parties from the new power plant in
Sodom. The negative impact of exchange rates on sales, due to the devaluation of the
euro and the British pound against the dollar, was more than offset by the devaluation
of the Israeli shekel which contributed to lower production costs in dollar terms.
The increase in the segment's profit in 2018 is attributed mainly to higher prices, which
overcompensated for unfavorable product mix (mainly due to higher share of lower
margin products such as Polysulphate and electricity), impact of exchange rates on
production costs in dollar terms, higher marine transportation prices and higher
operating and other expenses (mainly an increase in royalties, expenses recorded in
connection with DSW's collective labor agreement and higher depreciation expenses in
Israel and the UK).
Phosphate Solutions
The Phosphate Solutions segment’s strategy is to be a leading provider of value-added
specialty solutions based on phosphate for diversified industrial, food and agriculture
markets. The goal is to outgrow the market by enhancing customer relationships and in
parallel, optimizing upstream capabilities directed towards specialty products. The
diversification into higher value-added specialty products leverages ICL's integrated
business model and provides it with additional margins on top of the commodity
margin.
Phosphate Solutions results in the fourth quarter of 2018 improved compared to the
corresponding quarter last year. The improved performance was supported by higher
prices of phosphate commodities and specialties. This was partly offset by an increase
in raw materials prices, mainly Sulphur and an inventory write-off in China.
13
The segment's profit margins increased from 5% in Q4 2017 to 8% in Q4 2018 and
from 7% in 2017 to 10% in 2018, driven by synergy utilization and higher prices of
specialty and commodity phosphates, which more than compensated for an annual
increase of $50 million in raw material costs. The segment’s ten-year profit record for
specialty phosphates was driven by its value over volume strategy. The segment also
significantly improved the performance of its YPH JV, which shifted to profitability
during the year.
The Phosphate Solutions segment accounted for 33% of sales and 14% of profit
attributed to segments in Q4 2018 compared to 34% of sales and 10% of profit
attributed to segments in Q4 2017. The segment accounted for 36% of sales and 21%
of profit attributed to segments in 2018 compared to 36% of sales and 16% of profit
attributed to segments in 2017.
Significant Highlights and Business Environment
Sales of Phosphate Specialties in Q4 2018 decreased by approximately 6%
compared to the corresponding quarter last year to $267 million. Higher prices
drove approximately 26% growth in profit to $32 million. Q4 2017 includes
$6M sales of the Rovita business, which was divested at the beginning of the
third quarter of 2018. 2018 sales of Phosphate Specialties increased by
approximately 6% to $1,197 million and profit increased by approximately 36%
to $171 million. 2017 includes $32M sales of the Rovita business, while 2018
includes $16M sales, as a result of the aforementioned divestment.
Phosphate acids’ sales were slightly down in comparison to the corresponding
quarter of last year due to lower sales volumes in South America, driven by
increased imports from China, and lower sales volume to Europe. However,
increased volumes in China as well as higher prices in Europe and North
America drove an increase in the business profit.
Phosphate salts` performance was slightly down due to volume losses of food
salts in Europe and North America, partly offset by increased prices and higher
market share in China for the YPH JV.
The Paints and Coatings business experienced strong performance driven by
strong volumes of high performance additives as well as by higher prices.
The Dairy Protein business was slightly below Q4 2017 as business
performance normalized following a strong first three quarters of 2018.
In July 2018, ICL divested and transferred the assets and business of Rovita
GmbH, which produces a commodity milk protein. In Q4 2017, the business
reported sales of $6 million and operating loss of approximately $2 million.
The commodity phosphate market weakened towards the end of Q4 2018 and
into 2019 and prices softened as the agricultural season ended at the major
phosphate fertilizers importing countries. According to CRU (Fertilizer Week
Historical Prices, January 2019), the spot DAP price in India (CFR bulk)
declined from $430 per tonne in Q3 2018 to $422 in Q4 2018 while TSP price
(FOB Morocco) increased from $354 per tonne to in Q3 2018 to $361 per tonne
in Q4 2018, 26% higher than Q4 2017. Sulphur prices also moderated from

14
November 2018 and into the beginning of 2019. Market observers are
forecasting that the price moderation trend in the phosphate market will
continue during the first half of 2019 followed by stable pricing in the second
half of the year.
According to IHS Markit data, Brazil imported 9.0 million tonnes of phosphates
during 2018, a 0.9% increase from 2017. This is due to increases in SSP, TSP
and NPK, offset by lower MAP, DAP and NP/NPS imports.
OCP secured Q1 2019 green phosphoric acid contracts with its Indian partners
at $750 per tonne P2O5 CFR, a decrease of $18 from the previous quarter.
According to the FAI (Fertilizer Association of India), DAP imports during
2018 increased by 50% to 6 million tonnes compared to 2017 while domestic
DAP production decreased by 27% to 3.6 million tonnes, due to economic
preference for DAP imports over its local production.
For information regarding developments in the agriculture market and
FertilizerpluS products, which are mainly based on Polysulphate, see “Potash -
Significant Highlights and Business Environment”.
Results of Operations
12/2018-10 12/2017-10 12/2018-1 12/2017-1
$ millions $ millions $ millions $ millions
Total Sales 495 487 2,099 2,037
Sales to external customers 471 460 2,001 1,938
Sales to internal customers 24 27 98 99
Segment profit 38 23 208 149
Depreciation and Amortization 42 45 172 172
Capital expenditures 53 29 176 154
Phosphate Solutions: Backward Integrated Value Chain
Thousands of tonnes 10-12 2018
10-12 2017
1-12 2018
1-12 2017
Phosphate rock
Production 1,325 1,098 5,006 4,877
Green phosphoric acid
Used for production of phosphate commodities 152 115 552 451
Used for production of phosphate specialties 77 75 305 281
Other 2 6 17 28
Phosphate fertilizers
Production 619 555 2,304 2,094
Sales* 543 501 2,269 2,291
Pure phosphoric acid
Production 69 72 289 275
* To external customers.
15
Production of phosphate rock in Q4 2018 and in 2018 increased mainly due to a
shutdown at Rotem's Zin plant during the second half of 2017. The increase in green
phosphoric acid used for production of phosphate commodities is attributed to higher
phosphate fertilizers production in the YPH JV in China. The increase in Green
phosphoric acid used for production of phosphate specialties was mainly due to an
increase in the production of specialty products in the YPH JV. Higher sales of
phosphate fertilizers in Q4 2018 derived mainly from higher sales in North America
and in China by the YPH joint venture. Production of pure phosphoric acid was lower
in Q4 2018, mainly due to lower production in Brazil in alignment with market demand.
The increase in the production of pure phosphoric acid in 2018 is attributed to increased
production in Israel and China and to increased demand in China.
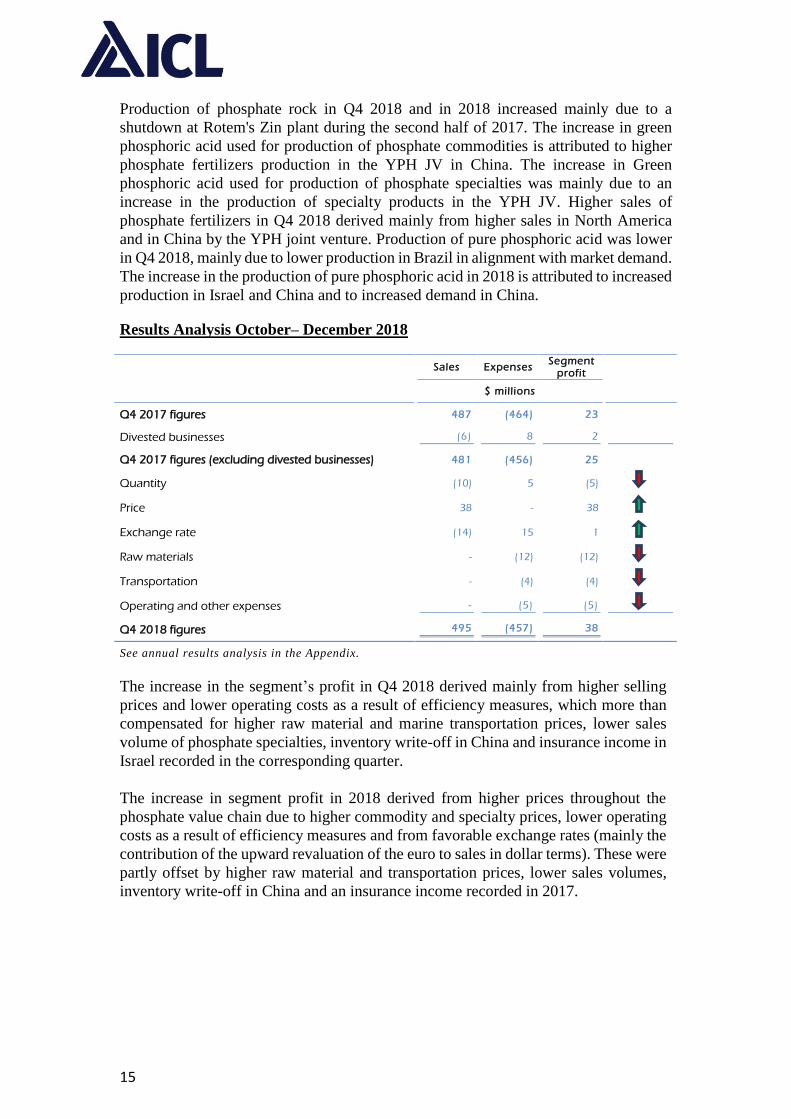
Results Analysis October– December 2018
Sales Expenses Segment
profit
$ millions
Q4 2017 figures 487 (464) 23
Divested businesses (6) 8 2
Q4 2017 figures (excluding divested businesses) 481 (456) 25
Quantity (10) 5 (5)
Price 38 - 38
Exchange rate (14) 15 1
Raw materials - (12) (12)
Transportation - (4) (4)
Operating and other expenses - (5) (5)
Q4 2018 figures 495 (457) 38
See annual results analysis in the Appendix.
The increase in the segment’s profit in Q4 2018 derived mainly from higher selling
prices and lower operating costs as a result of efficiency measures, which more than
compensated for higher raw material and marine transportation prices, lower sales
volume of phosphate specialties, inventory write-off in China and insurance income in
Israel recorded in the corresponding quarter.
The increase in segment profit in 2018 derived from higher prices throughout the
phosphate value chain due to higher commodity and specialty prices, lower operating
costs as a result of efficiency measures and from favorable exchange rates (mainly the
contribution of the upward revaluation of the euro to sales in dollar terms). These were
partly offset by higher raw material and transportation prices, lower sales volumes,
inventory write-off in China and an insurance income recorded in 2017.

16
Innovative Ag Solutions
ICL's Innovative Ag Solutions (“IAS”) segment was established on the foundations of
the ICL's specialty fertilizers business. The segment aims to achieve global leadership
by enhancing its global positions in its core markets of specialty agriculture, ornamental
horticulture, turf and landscaping. The segment targets high-growth markets such as
Latin America, India and China and by leveraging its R&D capabilities, vast agronomic
know-how, global footprint, backward integration to potash and phosphate, chemistry
know-how as well as by utilizing M&A opportunities. The segment also functions as
ICL’s innovative arm, which seeks to leverage its R&D capabilities and to implement
digital innovations.
The IAS segment's annual top line growth was in-line with the strong growth in the
specialty fertilizers market, with increased sales to the growing markets of China, Brazil
and India. Profit margins eroded as a result of the segment’s continued realignment of
its business to promote its growth and market leadership. Sales in the fourth quarter
decreased due to plant maintenance in Israel and in China and due to currency
fluctuations.
ICL’s IAS segment accounted for 10% of sales and 1% of profit attributed to segments
in Q4 2018, compared to 11% of sales and 3% of profit attributed to segments in the
Q4 2017. The segment accounted for 13% of sales and 6% of profit attributed to
segments in 2018, compared to 12% of sales and 6% of profit attributed to segments in
2017.
Significant Highlights and Business Environment
Q4 2018 sales were lower compared to the corresponding quarter last year,
mainly due to lower sales in the specialty agriculture market as a result of
inventory management policy, product availability due to a ramp-up in the
Company's CRF fertilizers plant in North America, lower sales in Turkey due
to currency risk and a particularly strong Q4 in 2017.
The decrease was partly offset by an increase in sales of chemicals, mainly
sulfuric acid and caustic soda.
Sales in the growing emerging markets of China, India and Brazil increased due
to increased demand for specialty fertilizers.
Sales in Europe were mostly stable, while sales in North America continue to
be affected by competitive pressure and by the ramp-up of the segment’s plant
in Summerville, US.
Prices of straight fertilizers (mainly MKP and PeKacid) increased in Q4 2018
compared to Q4 2017.
Sales to the turf and ornamental markets were generally stable.
ICL's efforts to identify sustainable sourcing of ammonia resulted in a partial
recovery, though historical sales volumes have not yet been achieved.

17
Results of Operations
12/2018-10 12/2017-10 12/2018-1 12/2017-1
$ millions $ millions $ millions $ millions
Total Sales 147 156 741 692
Sales to external customers 142 148 719 671
Sales to internal customers 5 8 22 21
Segment profit 2 8 57 56
Depreciation and Amortization 5 6 19 19
Capital expenditures 7 5 15 12
Results Analysis October– December 2018
Sales Expenses Segment
profit
$ millions
Q4 2017 figures 156 (148) 8
Quantity (9) 5 (4)
Price 4 - 4
Exchange rate (4) 3 (1)
Raw materials - (1) (1)
Operating and other expenses - (4) (4)
Q4 2018 figures 147 (145) 2
See annual results analysis in the Appendix.
The segment's performance in Q4 2018 was negatively impacted by lower sales of
specialty agriculture products, largely of straight fertilizers and water-soluble NPK and
from an increase in other expenses as a result of higher labor costs, inventory write-offs
and insurance income recorded in Q4 2017. These were partially offset by an increase
in the selling prices of specialty agriculture products, mainly straight fertilizers and
chemicals.
The segment's performance in 2018 was positively impacted by higher sales volumes,
mainly of liquid and water soluble NPKs as well as straight fertilizers, higher prices
and favorable exchange rates, partially offset by higher raw material costs.
DIVIDEND DISTRIBUTION
ICL's Board of Directors declared the final dividend distribution out of 2018 financial
results at the amount of about 4.8 cents per share or about $62 million. The dividend
will be paid on March 13, 2019, with a record date of February 28, 2019.
18
##
About ICL
ICL is a global specialty minerals and chemicals company operating bromine, potash,
and phosphate mineral value chains in a unique, integrated business model. ICL
extracts raw materials from well-positioned mineral assets and utilizes technology and
industrial know-how to add value for customers in key agricultural and industrial
markets worldwide. ICL focuses on strengthening leadership positions in all of its core
value chains. It also plans to strengthen and diversify its offerings of innovative agro
solutions by leveraging ICL’s existing capabilities and agronomic know-how, as well
as the Israeli technological ecosystem. ICL shares are dually listed on the New York
Stock Exchange and the Tel Aviv Stock Exchange (NYSE and TASE: ICL). The
company employs more than 11,000 people worldwide, and its sales in 2018 totaled
approximately US$5.6 billion. For more information, visit the Company's website at
www.icl-group.com.
Forward Looking Statement
This press release contains statements that constitute “forward-looking statements”,
many of which can be identified by the use of forward-looking words such as
“anticipate”, “believe”, “could”, “expect”, “should”, “plan”, “intend”, “estimate” and
“potential” among others. Forward-looking statements include, but are not limited to
assessments and judgments regarding macro-economic conditions and ICL’s markets,
operations and financial results. Forward-looking assessments and judgments are based
on our management’s current beliefs and assumptions and on information currently
available to our management. Such statements are subject to risks and uncertainties,
and actual results may differ materially from those expressed or implied in the forward-
looking statements due to various factors, including, but not limited to, market
fluctuations, especially in ICL’s manufacturing locations and target markets ; the
difference between actual resources and our resources estimates ; changes in the
demand and price environment for ICL's products as well as the cost of shipping and
energy, whether caused by actions of governments, manufacturers or consumers
;changes in the capital markets, including fluctuations in currency exchange rates,
credit availability, interest rates;changes in the competition structure in the market;and
the factors in “Item 3. Key Information—D. Risk Factors” in the Company's annual
report on Form 20-F filed with the U.S. Securities and Exchange Commission (the
"SEC") on March 7, 2018 and other filings from time to time with the SEC. Forward-
looking statements speak only as of the date they are made, and we do not undertake
any obligation to update or revise them or any other information contained in this press
release, whether as a result of new information, future developments or otherwise.
##
(Financial tables follow and are also available in
Excel format on our website located at www.icl-group.com)
19
Appendix:
We disclose in this quarterly press release non-IFRS financial measures titled sales
excluding divested businesses, adjusted operating income, adjusted operating income
excluding divested businesses, adjusted net income, adjusted net income excluding divested
businesses, adjusted EPS attributable to the Company’s shareholders excluding divestments
and adjusted EBITDA excluding divested businesses. Our management uses these measures
to facilitate operating performance comparisons from period to period. We calculate our
sales excluding divested businesses by adjusting our sales to exclude sales attributable to
the Fire Safety and Oil Additives (P2S5) business (divested in Q1 2018) and Rovita (divested
in Q3 2018), as set forth in the reconciliation table “ [Adjustments to reported operating
and net income]” below. We calculate our adjusted operating income by adjusting our
operating income to add certain items, as set forth in the reconciliatio n table “Adjustments
to reported operating and net income” below. Certain of these items may recur. We
calculate our adjusted operating income excluding divested businesses by adjusting our
adjusted operating income to exclude the results of the Fi re Safety and Oil Additives (P2S5)
business (divested in Q1 2018) and Rovita (divested in Q3 2018), as set forth in the
reconciliation table “Adjustments to reported operating and net income. We calculate our
adjusted net income attributable to the Company’s shareholders by adjusting our net income
attributable to the Company’s shareholders to add certain items, as set forth in the
reconciliation table “Adjustments to reported operating and net income” below, excluding
the total tax impact of such adjustments and adjustments attributable to the non-controlling
interests. We calculate our adjusted net income attributable to the Company’s shareholders
excluding divested businesses by adjusting our adjusted net income attributable to the
Company’s shareholders to exclude the results of the Fire Safety and Oil Additives (P2S5)
business (divested in Q1 2018) and Rovita (divested in Q3 2018), as set forth in the
reconciliation table “Adjustments to reported operating and net income” below. We
calculate adjusted EPS excluding divestments as adjusted net income excluding divested
businesses divided by weighted-average diluted number of ordinary shares outstanding as
provided in the reconciliation table "Adjustments to reported operating and net income"
below. We calculate our adjusted EBITDA excluding divested businesses by adding back to
the net income attributable to the Company’s shareholders the depreciation and
amortization, financing expenses, net, taxes on income and the items presented in the
reconciliation table “Adjusted EBITDA for the periods of activity” below and excluding the
contributions of the results of the Fire Safety and Oil Additives (P2S5) business (divested in
Q1 2018) and Rovita (divested in Q3 2018), which were adjusted for in calculating the
adjusted operating income and adjusted net income attributable to the Company’s
shareholders.
You should not view sales excluding divested businesses, adjusted operating income,
adjusted operating income excluding divested businesses, adjusted net income attributable
to the Company’s shareholders , adjusted net income attributable to the Company’s
shareholders excluding divested businesses, adjusted EPS attributable to the Company’s
shareholders excluding divestments or adjusted EBITDA excluding divested businesses as a
substitute for sales, operating income or net income attributable to the Company’s
shareholders determined in accordance with IFRS, and you should note that our definitions
of sales excluding divested businesses, adjusted operating income, adjusted operating
income excluding divested businesses, adjusted net income attributable to the Company’s
shareholders, adjusted net income attributable to the Company’s shareholders excluding
divested businesses and adjusted EBITDA excluding divested businesses may differ from

20
those used by other companies. However, we believe adjusted operating income, adjusted
net income attributable to the Company’s shareholders , adjusted net income attributable to
the Company’s shareholders excluding divested businesses, adjusted EPS attributable to the
Company’s shareholders excluding divestments and adjusted EBITDA excluding divested
businesses provide useful information to both management and investors by excluding
certain results and expenses that management believes are not indicative of our ongoing
operations, in particular the divestments of the Fire Safety and Oil Additives business
(divested in Q1 2018) and the Rovita business (divested in Q3 2018), as we no longer own
these businesses. Our management uses these non-IFRS measures to evaluate the Company's
business strategies and management's performance. We believe that these non -IFRS
measures provide useful information to investors because they improve the comparability
of the financial results between periods and provide for greater transparency of key
measures used to evaluate our performance.
We present a discussion in the period-to-period comparisons of the primary drivers of
changes in the Company’s results of operations. This discussion is based in part on
management’s best estimates of the impact of the main trends in its businesses. We have
based the following discussion on our financial statements. You should read the following
discussion together with our financial statements.
21
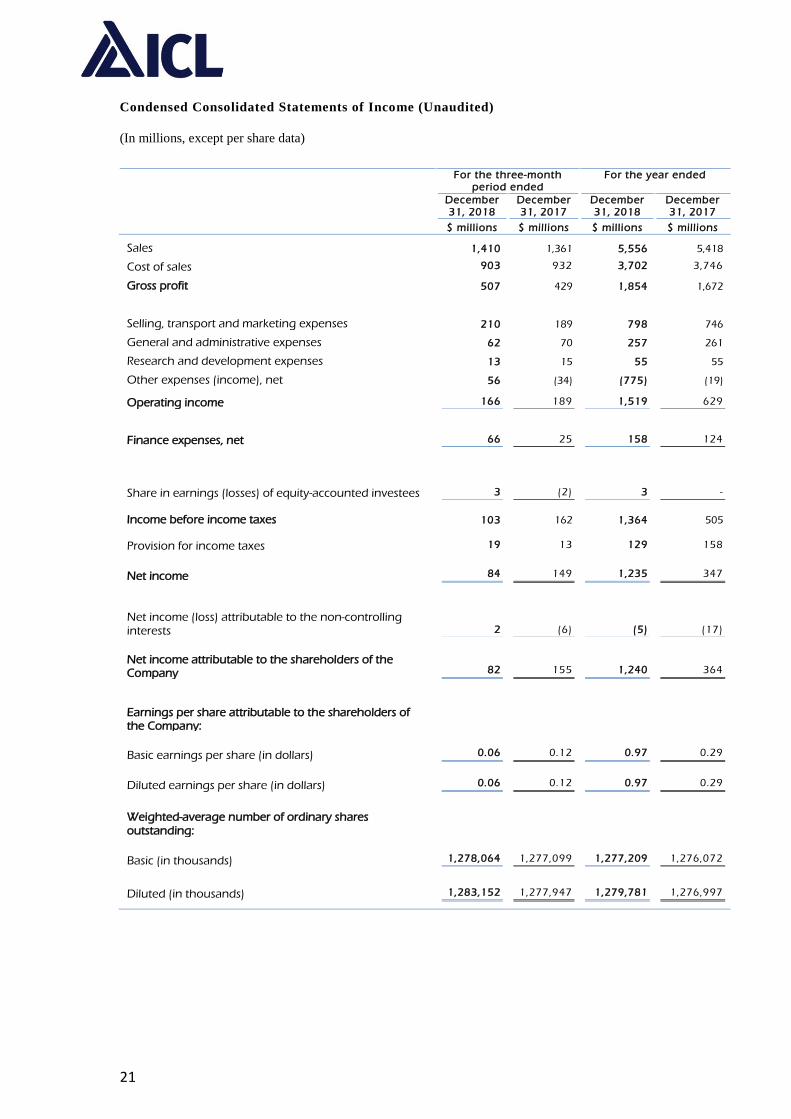
Condensed Consolidated Statements of Income (Unaudited)
(In millions, except per share data)
For the three-month period ended
For the year ended
December 31, 2018
December 31, 2017
December 31, 2018
December 31, 2017
$ millions $ millions $ millions $ millions
Sales 1,410 1,361 5,556 5,418
Cost of sales 903 932 3,702 3,746
Gross profit 507 429 1,854 1,672
Selling, transport and marketing expenses 210 189 798 746
General and administrative expenses 62 70 257 261
Research and development expenses 13 15 55 55
Other expenses (income), net 56 (34) (775) (19)
Operating income 166 189 1,519 629
Finance expenses, net 66 25 158 124
Share in earnings (losses) of equity-accounted investees 3 (2) 3 -
Income before income taxes 103 162 1,364 505
Provision for income taxes 19 13 129 158
Net income 84 149 1,235 347
Net income (loss) attributable to the non-controlling interests 2 (6) (5) (17)
Net income attributable to the shareholders of the Company 82 155 1,240 364
Earnings per share attributable to the shareholders of the Company:
Basic earnings per share (in dollars) 0.06 0.12 0.97 0.29
Diluted earnings per share (in dollars) 0.06 0.12 0.97 0.29
Weighted-average number of ordinary shares outstanding:
Basic (in thousands) 1,278,064 1,277,099 1,277,209 1,276,072
Diluted (in thousands) 1,283,152 1,277,947 1,279,781 1,276,997
22
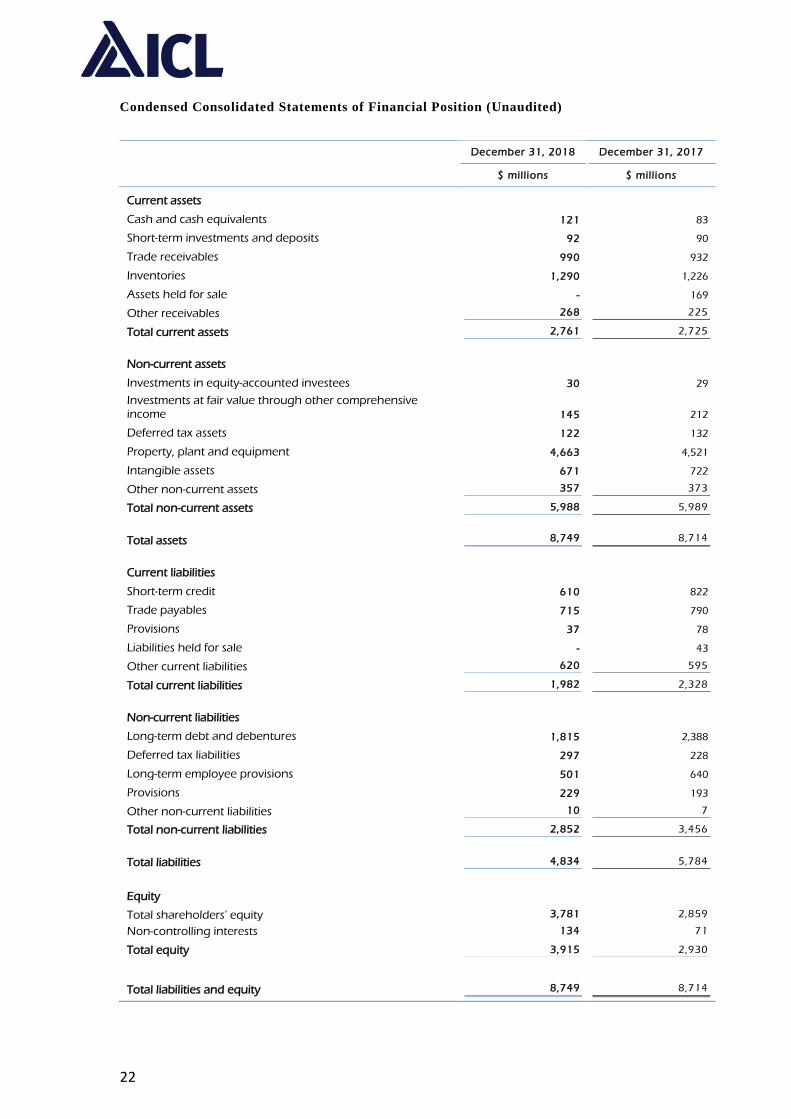
Condensed Consolidated Statements of Financial Position (Unaudited)
December 31, 2018 December 31, 2017
$ millions $ millions
Current assets
Cash and cash equivalents 121 83
Short-term investments and deposits 92 90
Trade receivables 990 932
Inventories 1,290 1,226
Assets held for sale - 169
Other receivables 268 225
Total current assets 2,761 2,725
Non-current assets
Investments in equity-accounted investees 30 29
Investments at fair value through other comprehensive income 145 212
Deferred tax assets 122 132
Property, plant and equipment 4,663 4,521
Intangible assets 671 722
Other non-current assets 357 373
Total non-current assets 5,988 5,989
Total assets 8,749 8,714
Current liabilities
Short-term credit 610 822
Trade payables 715 790
Provisions 37 78
Liabilities held for sale - 43
Other current liabilities 620 595
Total current liabilities 1,982 2,328
Non-current liabilities
Long-term debt and debentures 1,815 2,388
Deferred tax liabilities 297 228
Long-term employee provisions 501 640
Provisions 229 193
Other non-current liabilities 10 7
Total non-current liabilities 2,852 3,456
Total liabilities 4,834 5,784
Equity
Total shareholders’ equity 3,781 2,859
Non-controlling interests 134 71
Total equity 3,915 2,930
Total liabilities and equity 8,749 8,714
23
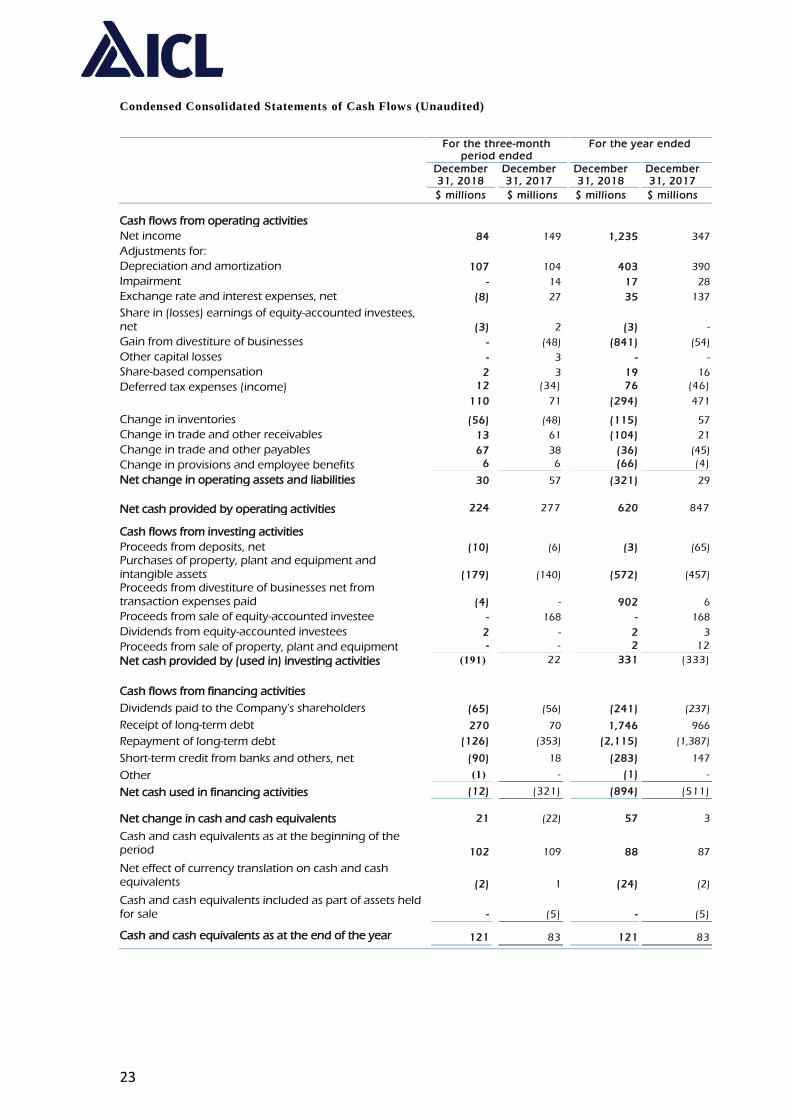
Condensed Consolidated Statements of Cash Flows (Unaudited)
For the three-month
period ended For the year ended
December 31, 2018
December 31, 2017
December 31, 2018
December 31, 2017
$ millions $ millions $ millions $ millions
Cash flows from operating activities
Net income 84 149 1,235 347
Adjustments for:
Depreciation and amortization 107 104 403 390
Impairment - 14 17 28
Exchange rate and interest expenses, net (8) 27 35 137
Share in (losses) earnings of equity-accounted investees, net (3) 2 (3) -
Gain from divestiture of businesses - (48) (841) (54)
Other capital losses - 3 - -
Share-based compensation 2 3 19 16
Deferred tax expenses (income) 12 (34) 76 (46)
110 71 (294) 471
Change in inventories (56) (48) (115) 57
Change in trade and other receivables 13 61 (104) 21
Change in trade and other payables 67 38 (36) (45)
Change in provisions and employee benefits 6 6 (66) (4)
Net change in operating assets and liabilities 30 57 (321) 29
Net cash provided by operating activities 224 277 620 847
Cash flows from investing activities
Proceeds from deposits, net (10) (6) (3) (65)
Purchases of property, plant and equipment and intangible assets (179) (140) (572) (457)
Proceeds from divestiture of businesses net from transaction expenses paid (4) - 902 6
Proceeds from sale of equity-accounted investee - 168 - 168
Dividends from equity-accounted investees 2 - 2 3
Proceeds from sale of property, plant and equipment - - 2 12
Net cash provided by (used in) investing activities )191( 22 331 (333)
Cash flows from financing activities
Dividends paid to the Company's shareholders (65) (56) (241) (237)
Receipt of long-term debt 270 70 1,746 966
Repayment of long-term debt (126) (353) (2,115) (1,387)
Short-term credit from banks and others, net (90) 18 (283) 147
Other )1( - (1) -
Net cash used in financing activities (12) (321) (894) (511)
Net change in cash and cash equivalents 21 (22) 57 3
Cash and cash equivalents as at the beginning of the period 102 109 88 87
Net effect of currency translation on cash and cash equivalents (2) 1 (24) (2)
Cash and cash equivalents included as part of assets held for sale - (5) - (5)
Cash and cash equivalents as at the end of the year 121 83 121 83
24
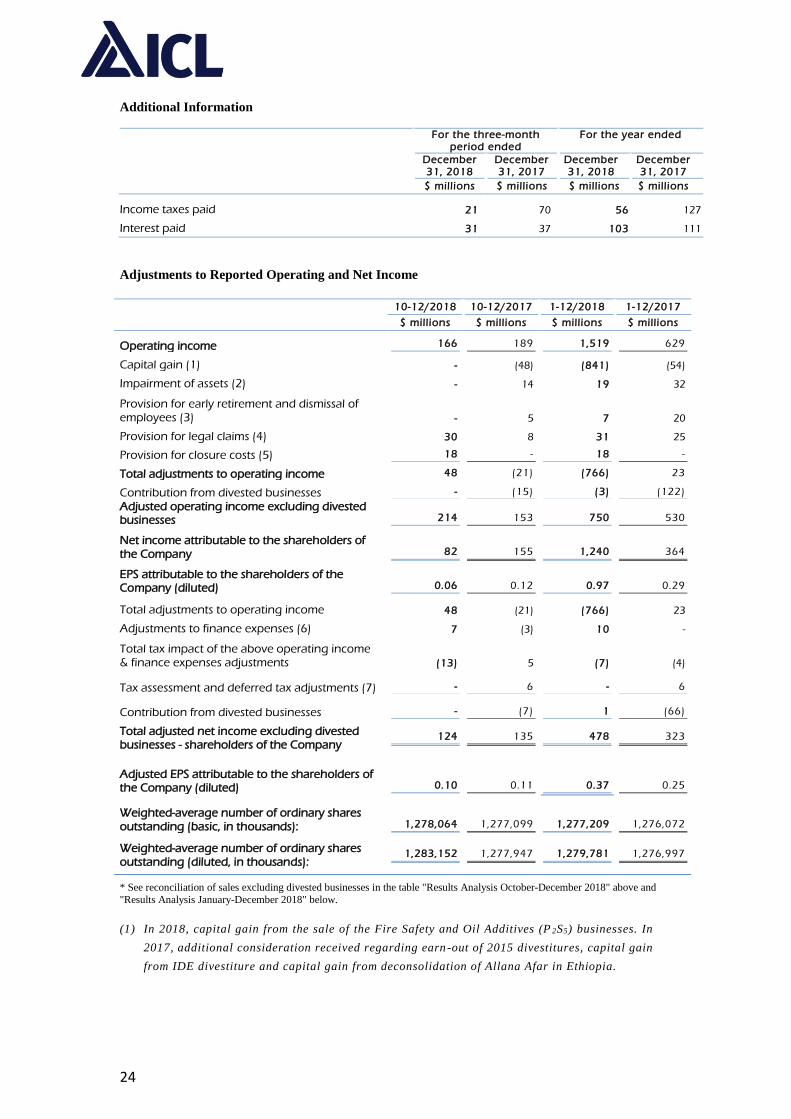
Additional Information
For the three-month
period ended For the year ended
December 31, 2018
December 31, 2017
December 31, 2018
December 31, 2017
$ millions $ millions $ millions $ millions
Income taxes paid 21 70 56 127
Interest paid 31 37 103 111
Adjustments to Reported Operating and Net Income
10-12/2018 10-12/2017 1-12/2018 1-12/2017
$ millions $ millions $ millions $ millions
Operating income 166 189 1,519 629
Capital gain (1) - (48) (841) (54)
Impairment of assets (2) - 14 19 32
Provision for early retirement and dismissal of employees (3) - 5 7 20
Provision for legal claims (4) 30 8 31 25
Provision for closure costs (5) 18 - 18 -
Total adjustments to operating income 48 (21) (766) 23
Contribution from divested businesses - (15) (3) (122)
Adjusted operating income excluding divested businesses 214 153 750 530
Net income attributable to the shareholders of the Company 82 155 1,240 364
EPS attributable to the shareholders of the Company (diluted) 0.06 0.12 0.97 0.29
Total adjustments to operating income 48 (21) (766) 23
Adjustments to finance expenses (6) 7 (3) 10 -
Total tax impact of the above operating income & finance expenses adjustments (13) 5 (7) (4)
Tax assessment and deferred tax adjustments (7) - 6 - 6
Contribution from divested businesses - (7) 1 (66)
Total adjusted net income excluding divested businesses - shareholders of the Company
124 135 478 323
Adjusted EPS attributable to the shareholders of the Company (diluted) 0.10 0.11 0.37 0.25
Weighted-average number of ordinary shares outstanding (basic, in thousands): 1,278,064 1,277,099 1,277,209 1,276,072
Weighted-average number of ordinary shares outstanding (diluted, in thousands):
1,283,152 1,277,947 1,279,781 1,276,997
* See reconciliation of sales excluding divested businesses in the table "Results Analysis October-December 2018" above and
"Results Analysis January-December 2018" below.
(1) In 2018, capital gain from the sale of the Fire Safety and Oil Additives (P 2S5) businesses. In
2017, additional consideration received regarding earn -out of 2015 divestitures, capital gain
from IDE divestiture and capital gain from deconsolidation of Allana Afar in Ethiopia.

25
(2) Impairment in value and write-down of assets. In 2018, write-off of Rovita’s assets following
its divestment and write-off of an intangible asset regarding a specific ICL R&D project
related to ICL’s phosphate-based products. In 2017, relating to impairment of an intangible
asset in Spain, write-down of an investment in Namibia and impairment of assets in China and
the Netherlands.
(3) Provision for early retirement and dismissal of employees in accordance with the Company’s
comprehensive global efficiency plan in its production facilities throughout the group. In 2018,
provisions relating to the Company’s facilities in the United Kingdom (Boulby mine) and Israel
(Rotem). In 2017, provisions relating to Rotem, and to subsidiaries in North America and
Europe.
(4) Provision for legal claims. In 2018, an increase of a provision in connection with prior periods
in respect of royalties’ arbitration in Israel, partly offset by a VAT refund related to prior
periods in Brazil (2002-2015). In 2017, judgment relating to a dispute with the National
Company for Roads in Israel regarding damage caused to bridges by DSW, a decision of the
European Commission concerning past grants received by a subsidiary in Spain, claims for
damages related to the contamination of the water in certain wells at the Suria site in Spain,
a provision in connection with prior periods in respect of royalties’ arbitration in Israel,
reversal of the provision for retroactive electricity charges in connection with prior periods
and settlement of the dispute with Great Lakes (a subsidiary of Chemtura Corporation).
(5) Provision for site closure cost. In 2018, an increase in the provision in connection with the
Sallent site closure costs as part of the restoration solution.
(6) Interest and linkage expenses. In 2018, an increase in the provision related to the royalties’
arbitration in Israel (see also above) and in 2017 related to a decision of the Euro pean
Commission in the third quarter, which was fully offset by income in connection with the
resolution of the Appeals Court for Tax Matters in Belgium in the following quarter.
(7) In 2017, an internal transaction in preparation of the low-synergy business divestitures,
resulting in tax liabilities (see also capital gain from divestment of the Fire Safety and Oil
Additives businesses above), and tax income relating to the resolution of the Appeals Court
for Tax matters in Belgium.
Calculation of Adjusted EBITDA:
10-12/2018 10-12/2017 1-12/2018 1-12/2017
$ millions $ millions $ millions $ millions
Net income attributable to the shareholders of the Company 82 155 1,240 364
Depreciation and Amortization 107 104 403 390
Financing expenses, net 66 25 158 124
Taxes on income 19 13 129 158
Adjustments * 48 (21) (766) 23
Contribution from divested businesses - (17) (4) (131)
Total adjusted EBITDA excluding divested businesses
322 259 1,160 928
* See "Adjustments to reported operating and net income (Non-GAAP)" above.
26
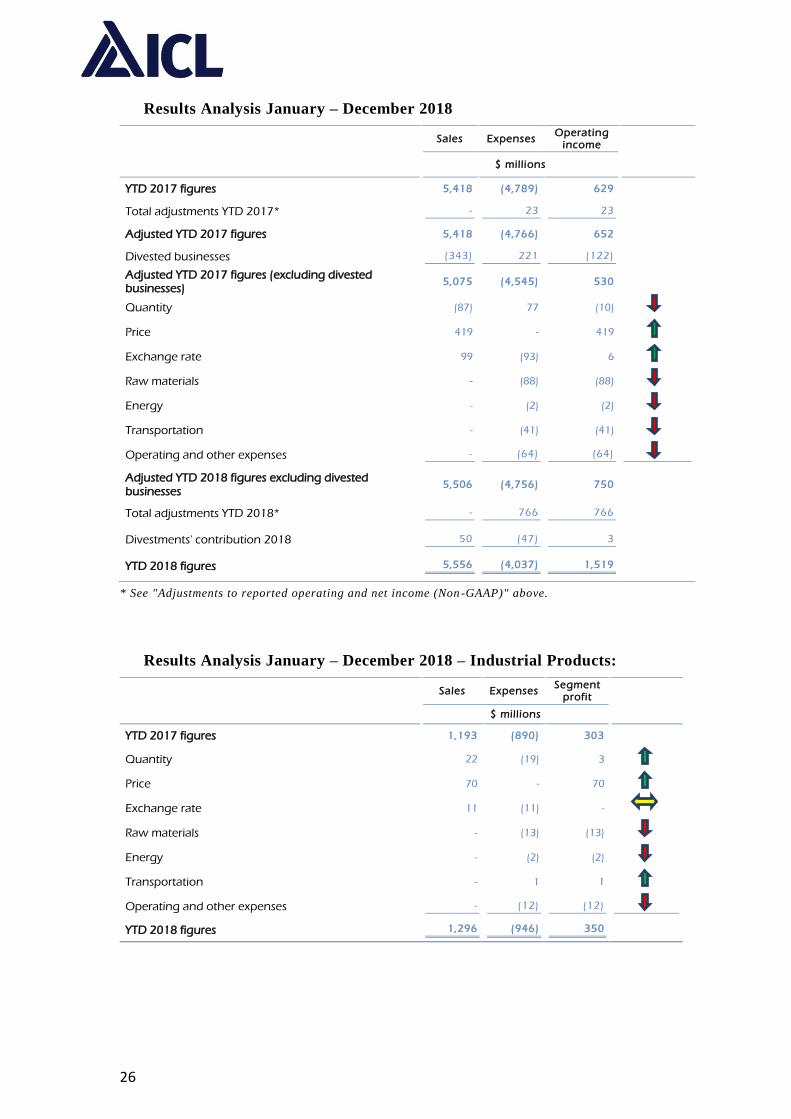
Results Analysis January – December 2018
Sales Expenses Operating
income
$ millions
YTD 2017 figures 5,418 (4,789) 629
Total adjustments YTD 2017* - 23 23
Adjusted YTD 2017 figures 5,418 (4,766) 652
Divested businesses (343) 221 (122)
Adjusted YTD 2017 figures (excluding divested businesses)
5,075 (4,545) 530
Quantity (87) 77 (10)
Price 419 - 419
Exchange rate 99 (93) 6
Raw materials - (88) (88)
Energy - (2) (2)
Transportation - (41) (41)
Operating and other expenses - (64) (64)
Adjusted YTD 2018 figures excluding divested businesses
5,506 (4,756) 750
Total adjustments YTD 2018* - 766 766
Divestments' contribution 2018 50 (47) 3
YTD 2018 figures 5,556 (4,037) 1,519
* See "Adjustments to reported operating and net income (Non -GAAP)" above.
Results Analysis January – December 2018 – Industrial Products:
Sales Expenses Segment
profit
$ millions
YTD 2017 figures 1,193 (890) 303
Quantity 22 (19) 3
Price 70 - 70
Exchange rate 11 (11) -
Raw materials - (13) (13)
Energy - (2) (2)
Transportation - 1 1
Operating and other expenses - (12) (12)
YTD 2018 figures 1,296 (946) 350
27
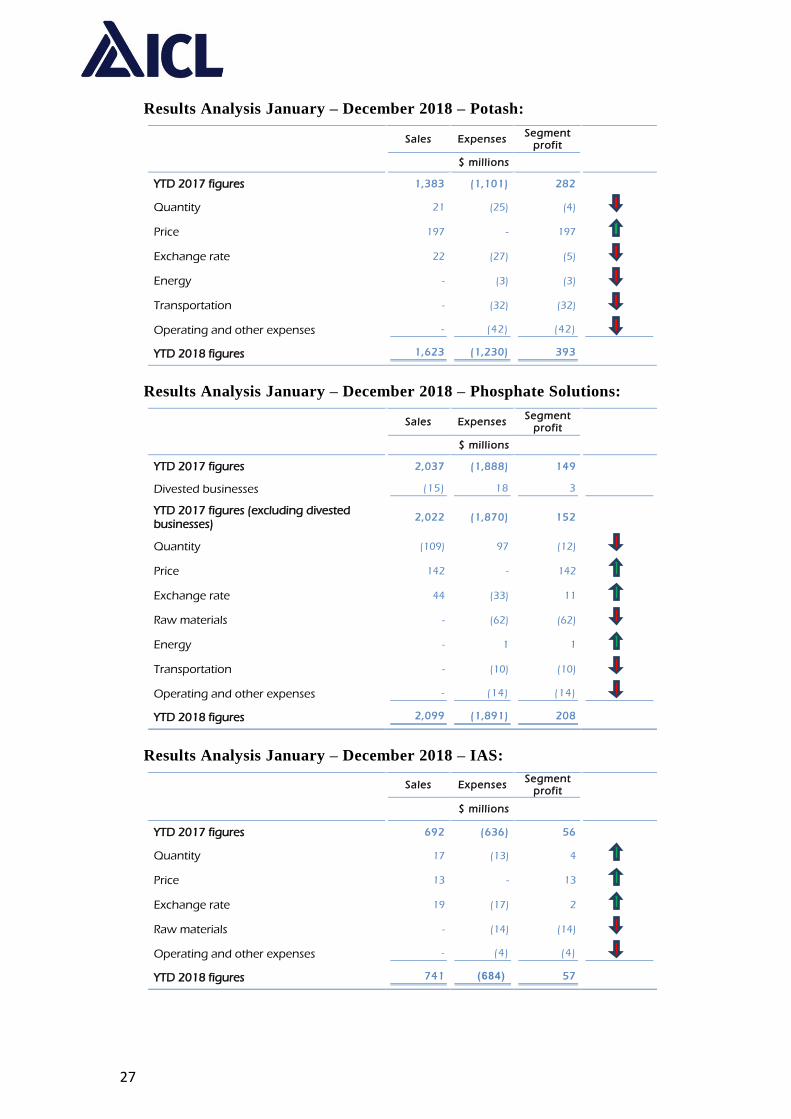
Results Analysis January – December 2018 – Potash:
Sales Expenses Segment
profit
$ millions
YTD 2017 figures 1,383 (1,101) 282
Quantity 21 (25) (4)
Price 197 - 197
Exchange rate 22 (27) (5)
Energy - (3) (3)
Transportation - (32) (32)
Operating and other expenses - (42) (42)
YTD 2018 figures 1,623 (1,230) 393
Results Analysis January – December 2018 – Phosphate Solutions:
Sales Expenses Segment
profit
$ millions
YTD 2017 figures 2,037 (1,888) 149
Divested businesses (15) 18 3
YTD 2017 figures (excluding divested businesses)
2,022 (1,870) 152
Quantity (109) 97 (12)
Price 142 - 142
Exchange rate 44 (33) 11
Raw materials - (62) (62)
Energy - 1 1
Transportation - (10) (10)
Operating and other expenses - (14) (14)
YTD 2018 figures 2,099 (1,891) 208
Results Analysis January – December 2018 – IAS:
Sales Expenses Segment
profit
$ millions
YTD 2017 figures 692 (636) 56
Quantity 17 (13) 4
Price 13 - 13
Exchange rate 19 (17) 2
Raw materials - (14) (14)
Operating and other expenses - (4) (4)
YTD 2018 figures 741 )684( 57
28
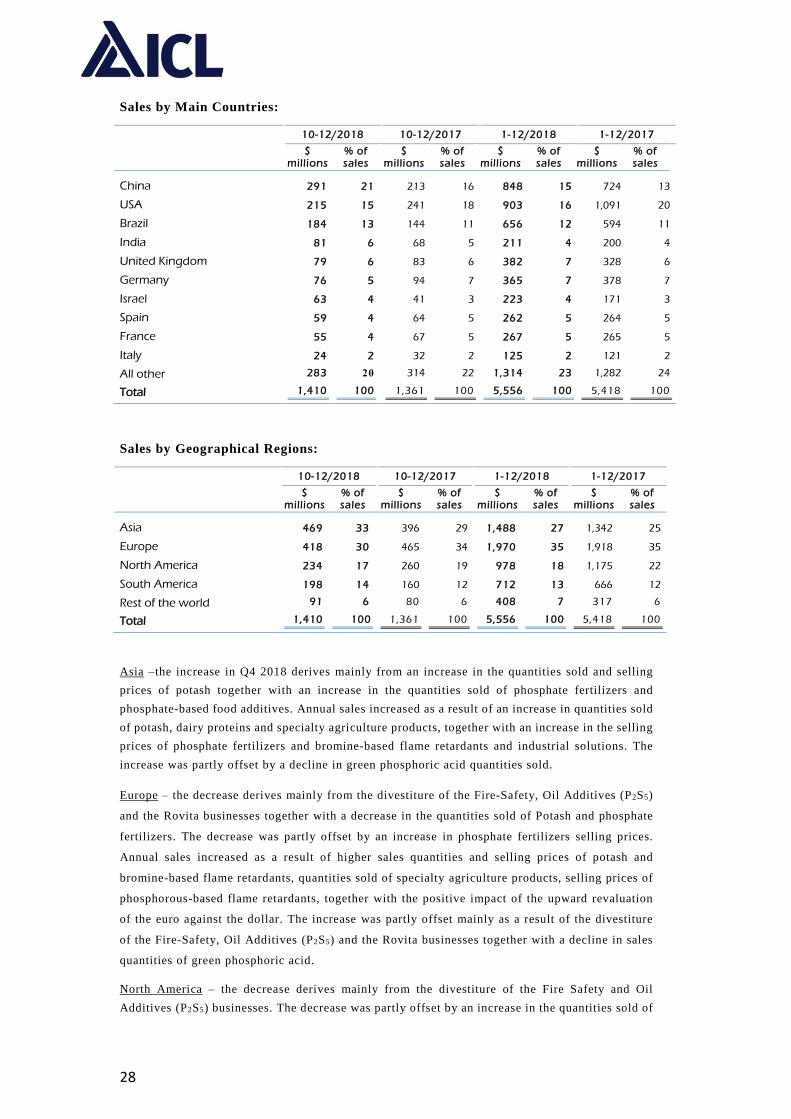
Sales by Main Countries:
10-12/2018 10-12/2017 1-12/2018 1-12/2017
$
millions % of sales
$ millions
% of sales
$ millions
% of sales
$ millions
% of sales
China 291 21 213 16 848 15 724 13
USA 215 15 241 18 903 16 1,091 20
Brazil 184 13 144 11 656 12 594 11
India 81 6 68 5 211 4 200 4
United Kingdom 79 6 83 6 382 7 328 6
Germany 76 5 94 7 365 7 378 7
Israel 63 4 41 3 223 4 171 3
Spain 59 4 64 5 262 5 264 5
France 55 4 67 5 267 5 265 5
Italy 24 2 32 2 125 2 121 2
All other 283 20 314 22 1,314 23 1,282 24
Total 1,410 100 1,361 100 5,556 100 5,418 100
Sales by Geographical Regions:
10-12/2018 10-12/2017 1-12/2018 1-12/2017
$
millions % of sales
$ millions
% of sales
$ millions
% of sales
$ millions
% of sales
Asia 469 33 396 29 1,488 27 1,342 25
Europe 418 30 465 34 1,970 35 1,918 35
North America 234 17 260 19 978 18 1,175 22
South America 198 14 160 12 712 13 666 12
Rest of the world 91 6 80 6 408 7 317 6
Total 1,410 100 1,361 100 5,556 100 5,418 100
Asia –the increase in Q4 2018 derives mainly from an increase in the quantities sold and selling
prices of potash together with an increase in the quantities sold of phosphate fertilizers and
phosphate-based food additives. Annual sales increased as a result of an increase in quantities sold
of potash, dairy proteins and specialty agriculture products, together with an increase in the selling
prices of phosphate fertilizers and bromine-based flame retardants and industrial solutions. The
increase was partly offset by a decline in green phosphoric acid quantities sold.
Europe – the decrease derives mainly from the divestiture of the Fire-Safety, Oil Additives (P2S5)
and the Rovita businesses together with a decrease in the quantities sold of Potash and phosphate
fertilizers. The decrease was partly offset by an increase in phosphate fertilizers selling prices.
Annual sales increased as a result of higher sales quantities and selling prices of potash and
bromine-based flame retardants, quantities sold of specialty agriculture products, selling prices of
phosphorous-based flame retardants, together with the positive impact of the upward revaluation
of the euro against the dollar. The increase was partly offset mainly as a result of the divestiture
of the Fire-Safety, Oil Additives (P2S5) and the Rovita businesses together with a decline in sales
quantities of green phosphoric acid.
North America – the decrease derives mainly from the divestiture of the Fire Safety and Oil
Additives (P2S5) businesses. The decrease was partly offset by an increase in the quantities sold of
29
phosphate fertilizers and clear brine fluids. Annual sales decreased as a result of the divestiture of
the Fire Safety and Oil Additives (P2S5) businesses and a decrease in the quantities sold of potash.
The decrease was partly offset by an increase in the selling prices and quantities sold of phosphate
fertilizers, quantities sold of clear brine fluids and phosphorous-based flame retardants and selling
prices of potash.
South America – the increase derives mainly from an increase in selling prices and the quantities
sold of potash. The increase in annual sales is attributed to an increase in selling prices of potash,
partly offset by a decrease in potash quantities sold.
Rest of the world – the increase derives mainly from sales of electricity surplus to third parties
from ICL's new power plant in Sodom, partly offset by a decrease in the quantities sold of dairy
protein products. The increase in annual sales is attributed to an increase in the quantities sold of
dairy proteins products, clear brine fluids and electricity surplus to third parties from ICL's new
power plant in Sodom.
30
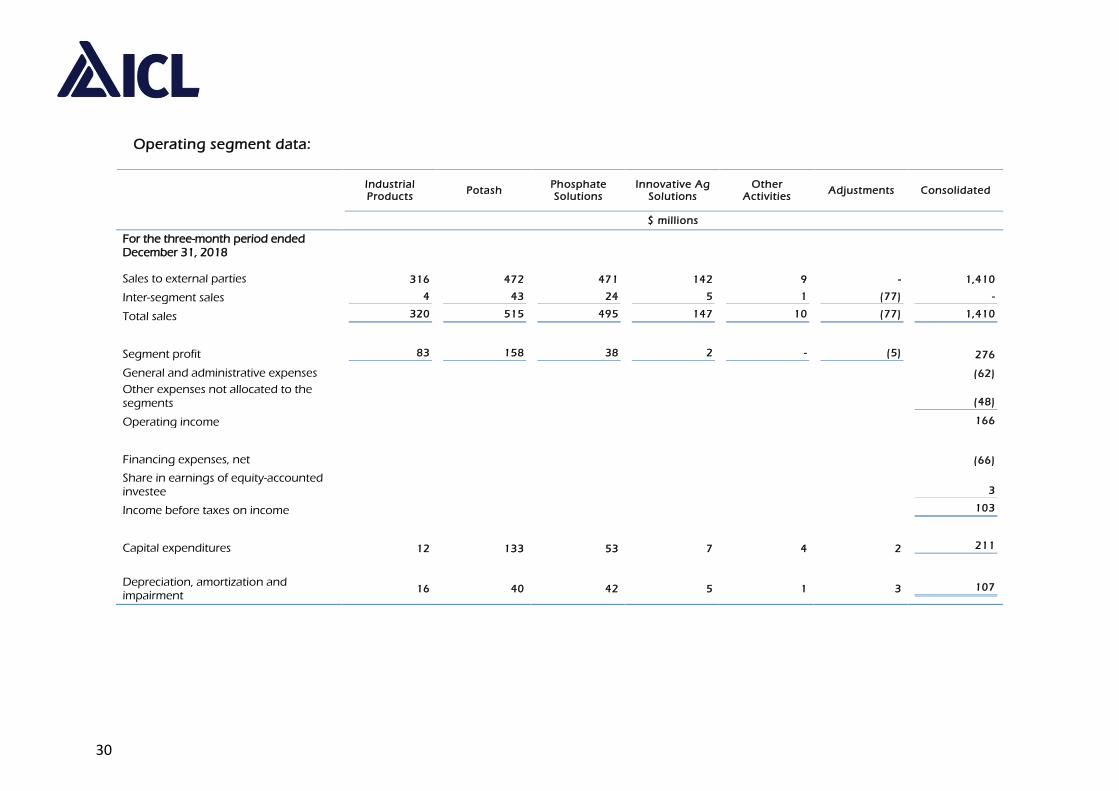
Operating segment data:
Industrial Products
Potash Phosphate Solutions
Innovative Ag Solutions
Other Activities
Adjustments Consolidated
$ millions
For the three-month period ended December 31, 2018 Sales to external parties 316 472 471 142 9 - 1,410
Inter-segment sales 4 43 24 5 1 (77) -
Total sales 320 515 495 147 10 (77) 1,410
Segment profit 83 158 38 2 - (5) 276
General and administrative expenses (62)
Other expenses not allocated to the segments (48)
Operating income 166
Financing expenses, net (66)
Share in earnings of equity-accounted investee 3
Income before taxes on income 103
Capital expenditures 12 133 53 7 4 2 211
Depreciation, amortization and impairment
16 40 42 5 1 3 107
31
Industrial Products
Potash Phosphate Solutions
Innovative Ag Solutions
Other Activities
Adjustments Consolidated
$ millions
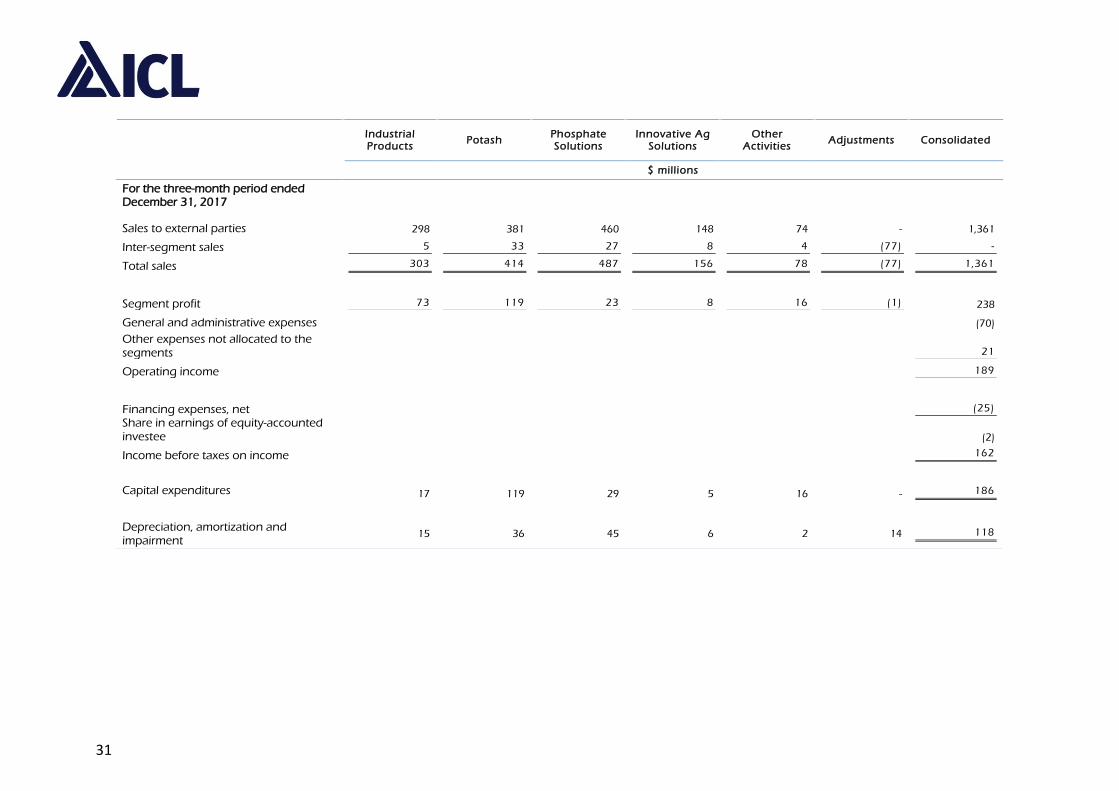
For the three-month period ended December 31, 2017
Sales to external parties 298 381 460 148 74 - 1,361
Inter-segment sales 5 33 27 8 4 (77) -
Total sales 303 414 487 156 78 (77) 1,361
Segment profit 73 119 23 8 16 (1) 238
General and administrative expenses (70)
Other expenses not allocated to the segments 21
Operating income 189
Financing expenses, net (25)
Share in earnings of equity-accounted investee (2)
Income before taxes on income 162
Capital expenditures 17 119 29 5 16 - 186
Depreciation, amortization and impairment
15 36 45 6 2 14 118
32
Industrial Products
Potash Phosphate Solutions
Innovative Ag Solutions
Other Activities
Adjustments Consolidated
$ millions
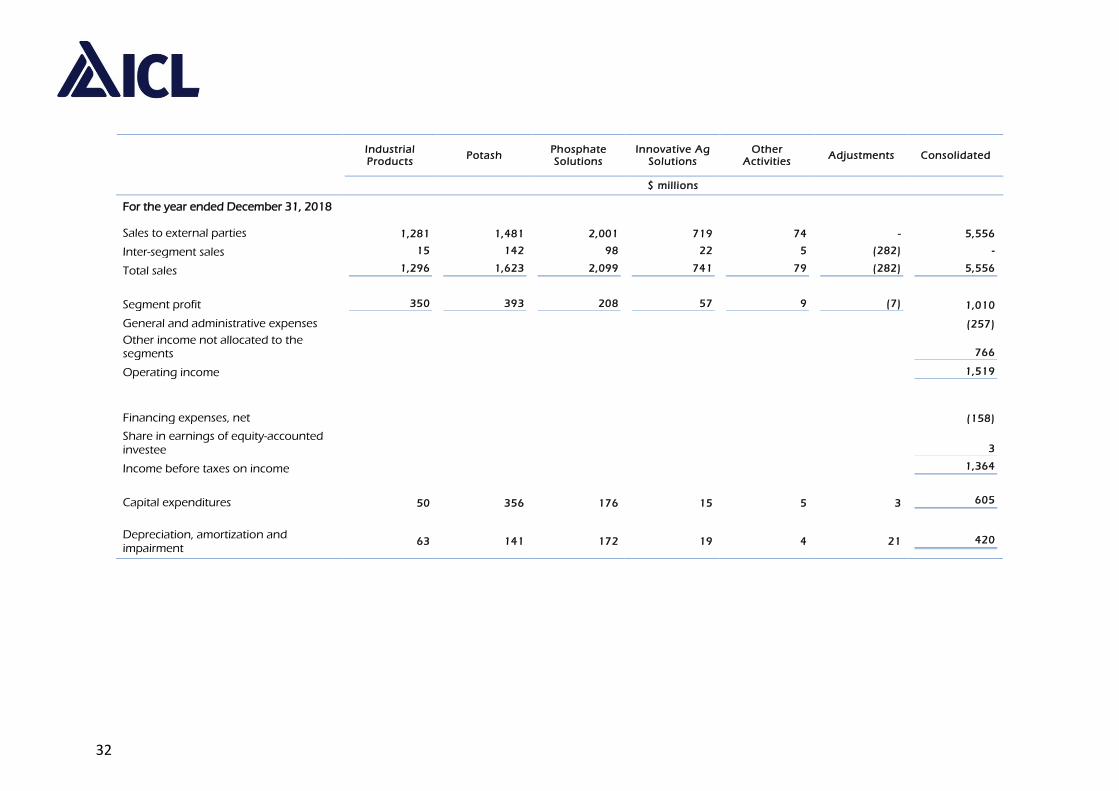
For the year ended December 31, 2018 Sales to external parties 1,281 1,481 2,001 719 74 - 5,556
Inter-segment sales 15 142 98 22 5 (282) -
Total sales 1,296 1,623 2,099 741 79 (282) 5,556
Segment profit 350 393 208 57 9 (7) 1,010
General and administrative expenses (257)
Other income not allocated to the segments 766
Operating income 1,519
Financing expenses, net (158)
Share in earnings of equity-accounted investee 3
Income before taxes on income 1,364
Capital expenditures 50 356 176 15 5 3 605
Depreciation, amortization and impairment
63 141 172 19 4 21 420
33
Industrial Products
Potash Phosphate Solutions
Innovative Ag Solutions
Other Activities
Adjustments Consolidated
$ millions
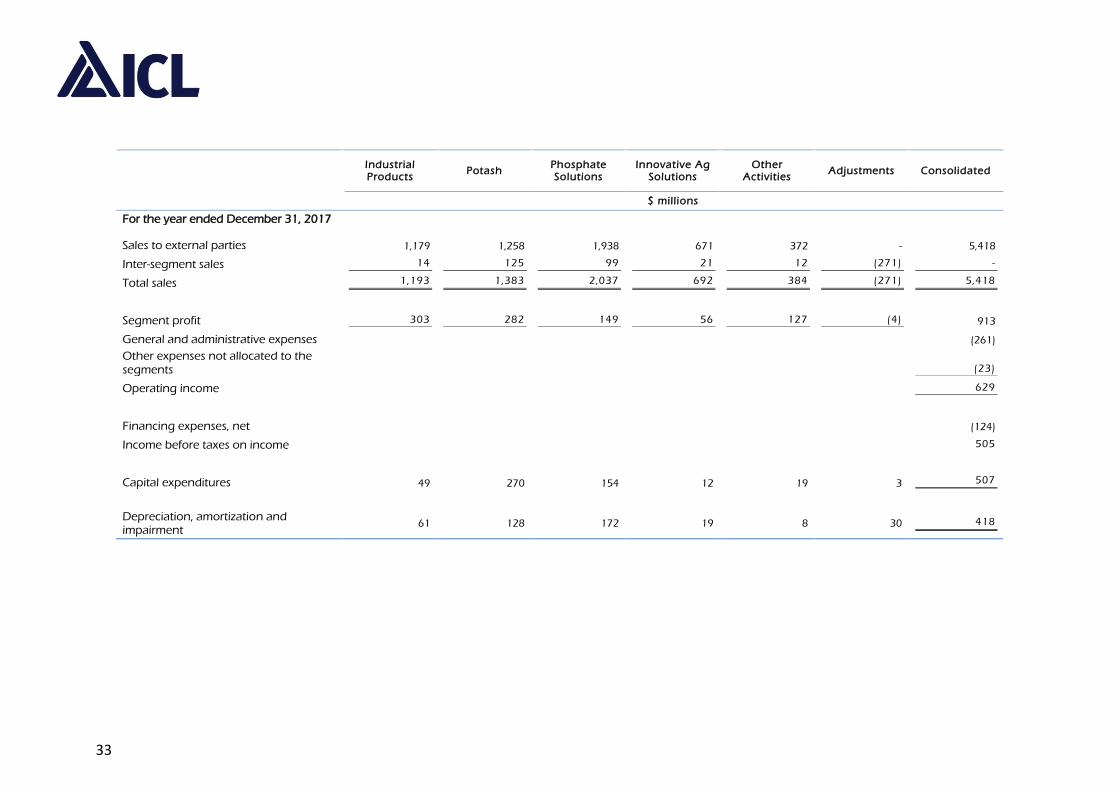
For the year ended December 31, 2017
Sales to external parties 1,179 1,258 1,938 671 372 - 5,418
Inter-segment sales 14 125 99 21 12 (271) -
Total sales 1,193 1,383 2,037 692 384 (271) 5,418
Segment profit 303 282 149 56 127 (4) 913
General and administrative expenses (261)
Other expenses not allocated to the segments (23)
Operating income 629
Financing expenses, net (124)
Income before taxes on income 505
Capital expenditures 49 270 154 12 19 3 507
Depreciation, amortization and impairment
61 128 172 19 8 30 418