
ICING ON A NON-ROTATING CYLINDER UNDER … · essentiel de I'equation regissant le bilan thermique...
8
J oul'I/a l 0/ Glaciology, Vo!. 32, No . 110, 1986 ICING ON A NON-ROTATING CYLINDER UNDER CONDITIONS OF HIGH LIQUID WATER CONTENT IN THE AIR: 11. HEAT TRANSFER AND RATE OF ICE GROWTH By JO UKO LA UN IAINEN (Department of Geophysics. Univer sity of Helsinki , Fabianinkatu 24 A , SF-OOIOO Helsinki 10, Finland) and MARKK U LYYRA (Institute of Marine Research , Box 33, SF-OO!)3l Helsinki, Finland) ' ABSTRACT. The rate of ice growth and heat transfer during a stationary wet-growth icing was studied, based on wind-tunnel experiments of Reynolds numbers of 10 4 to 10 5 , and air temperatures of oOe to -13°e. The con- vective heat-transfer coefficient, a quantity of primary importance entering the heat-balance equation of a freezing surface, was found to depend strongly on the liquid water content in the air (or rather, on the impinging water flow on the surface). The convective heat-transfer coefficient was considered theoretically and the dependence is thought to be caused by an increase in the surface roughness and, especially, by an effect of the impinging water droplets on viscous sub-layers and on turbulent heat transfer near the icing boundary. The above evaluation allows us to calculate an accretion efficiency for each icing condition. RESUME. Givrage d 'un cylindre immobile lorsque la teneur en eau liquide de I'air est importante: ll. Trans/ert de chaleur et vitesse de croissance de la glace . La vitesse de croissance de la glace et les transferts de chaleur pendant un givrage humide stationnaire sont etudies dans une soufflerie pour des nombres de Reynolds de 10· :i 10 5 et des temperatures de oOe :i -13 °e. On a trouve que le coefficient de transfert convectif de la chaleur, parametre essentiel de I'equation regissant le bilan thermique d'une surface en train de geler, dependait fortement de la teneur en eau liquide de I'air (ou plut6t du flux de gouttelettes liquides heurtant la surface). Le coefficient de transfert convectif de la chaleur est etudie d'un point de vue NOTATION a b c D e Coefficient (4.4 W m - 2 K - I ) Deposit width Coefficient of viscoelasticity Cylinder diameter Saturation water-vapour pressure at the temperature of the air (m bar) Saturation water-vapour pressure at the temperature of the freezing surface (mbar) Water-droplet collection efficiency Specific heat capacity of air at constant pressure (1.004 kJ kg- I K -I) ·Present address: Department of Geophysics, University of Helsinki, Fabianinkatu 24 A, SF -00 I 00 Helsinki 10, Finland. 12 theorique. On pense que ses vanatlOns sont liees :i une augmentation de la rugosite de la surface et, surtout, aux consequences de I'impact des gouttelettes d'eau sur les sous couches visqueuses et sur les transferts turbulents de chaleur pres du front de congelation. Les estimations precedentes nous permettent de calculer l'efficacite de I'accretion de glace pour chaque condition de givrage . ZUSAMMENFASSUNG. Vereisung eines nicht rotierenden Zylinders bei hohem Gehalt an /liissigem Wasser in der Lu/t: ll. Wiirmetransport und Eiswachstumsrate. Auf der Grundlage von Windkanal- Versuchen mit Reynolds-Zahlen von 10· bis 10 5 und bei Lufttemperaturen zwischen oOe und -13 °c wurde die Eiswachstumsrate und der W1irme- transport w1ihrend einer station1iren feuchten Vereisung untersucht. Der Koeffizient des konvektiven W1irmeflusses, eine Grllsse von prim1irer Bedeutung, die in die W1irmebilanzgleichung fUr eine gefrierende OberfHiche eingeht, erwies sich als stark abhlingig von dem Gehalt an fiussigem Wasser in der Luft (oder besser gesagt: von dem an der Oberfl1iche auftreffenden Wasserstrom). Eine theoretische Betrachtung des Koeffizienten des konvektiven W1irmeflusses fUhrt zu der Annahme, dass seine Abh1ingigkeit durch eine Zunahme der Oberfl1ichen- rauhigkeit und besonders durch eine Wirkung der auf- treffenden Wassertrllpfchen auf viskose tiefere Schichten und auf turbulenten W1irmefluss nahe der Vereisungsgrenzfl1iche verursacht wird . Die geschilderte Auswertung erlaubt die Berechnung einer Zuwachsleistung fur jeden Vereisungs- zustand. h d· 1 k· 1 p Pr R Re Convective heat-transfer coefficient (W m- 2 K - I) Specific heat of water (4.2 kJ kg- I K- I ) Ice-layer thickness Molecular heat conductivity of air (2.43 x 10- 2 W m-I K- I at 273 K) Heat conductivity of ice (W m-I K- 1 ) Enthalpy of vaporization (2.50 x 10 3 kJ kg-I) Enthalpy of freezing (3 .34 x 10 2 kJ kg - I) Atmospheric pressure (mbar) Prandtl number for air (0.71) Rate of ice-mass growth (kg m- 2 S-I) Reynolds number (= VDP a / /La) Droplet mass flux (= eWV) glvmg eWV x 2/ n averaged per unit area of a half cylinder
Transcript of ICING ON A NON-ROTATING CYLINDER UNDER … · essentiel de I'equation regissant le bilan thermique...

Joul'I/al 0/ Glaciology, Vo!. 32, No. 110, 1986
ICING ON A NON-ROTATING CYLINDER UNDER CONDITIONS OF HIGH LIQUID WATER CONTENT
IN THE AIR: 11. HEAT TRANSFER AND RATE OF ICE GROWTH
By JO UKO LA UN IAIN EN
(Department of G eophysics . University of Helsinki , Fabianinkatu 24 A , SF-OOIOO Helsinki 10, Finland)
and MARKK U LYYRA
(Institute of Marine Research , Box 33, SF-OO!)3l Helsinki, Finland) '
ABSTRACT. The rate of ice growth and heat transfer during a stationary wet-growth icing was studied, based on wind-tunnel experiments of Reynolds numbers of 104 to 105, and air temperatures of oOe to -13°e. The convective heat-transfer coefficient, a quantity of primary importance entering the heat-balance equation of a freezing surface, was found to depend strongly on the liquid water content in the air (or rather, on the impinging water flow on the surface). The convective heat-transfer coefficient was considered theoretically and the dependence is thought to be caused by an increase in the surface roughness and, especially, by an effect of the impinging water droplets on viscous sub-layers and on turbulent heat transfer near the icing boundary. The above evaluation allows us to calculate an accretion efficiency for each icing condition.
RESUME. Givrage d 'un cylindre immobile lorsque la teneur en eau liquide de I'air est importante: ll. Trans/ert de chaleur et vitesse de croissance de la glace. La vitesse de croissance de la glace et les transferts de chaleur pendant un givrage humide stationnaire sont etudies dans une soufflerie pour des nombres de Reynolds de 10· :i 105
et des temperatures de oOe :i -13 °e. On a trouve que le coefficient de transfert convectif de la chaleur, parametre essentiel de I'equation regissant le bilan thermique d'une surface en train de geler, dependait fortement de la teneur en eau liquide de I'air (ou plut6t du flux de gouttelettes liquides heurtant la surface) . Le coefficient de transfert convectif de la chaleur est etudie d'un point de vue
NOTATION
a
b
c
D
e
Coefficient (4.4 W m - 2 K - I )
Deposit width
Coefficient of viscoelasticity (~I)
Cylinder diameter
Saturation water-vapour pressure at the temperature of the air (m bar)
Saturation water-vapour pressure at the temperature of the freezing surface (mbar)
Water-droplet collection efficiency
Specific heat capacity of air at constant pressure (1.004 kJ kg- I K -I)
·Present address: Department of Geophysics, University of Helsinki, Fabianinkatu 24 A, SF -00 I 00 Helsinki 10, Finland .
12
theorique. On pense que ses vanatlOns sont liees :i une augmentation de la rugosite de la surface et, surtout, aux consequences de I'impact des gouttelettes d'eau sur les sous couches visqueuses et sur les transferts turbulents de chaleur pres du front de congelation. Les estimations precedentes nous permettent de calculer l'efficacite de I'accretion de glace pour chaque condition de givrage.
ZUSAMMENFASSUNG. Vereisung eines nicht rotierenden Zylinders bei hohem Gehalt an /liissigem Wasser in der Lu/t: ll. Wiirmetransport und Eiswachstumsrate. Auf der Grundlage von Windkanal-Versuchen mit Reynolds-Zahlen von 10· bis 105 und bei Lufttemperaturen zwischen oOe und -13 °c wurde die Eiswachstumsrate und der W1irmetransport w1ihrend einer station1iren feuchten Vereisung untersucht. Der Koeffizient des konvektiven W1irmeflusses, eine Grllsse von prim1irer Bedeutung, die in die W1irmebilanzgleichung fUr eine gefrierende OberfHiche eingeht, erwies sich als stark abhlingig von dem Gehalt an fiussigem Wasser in der Luft (oder besser gesagt: von dem an der Oberfl1iche auftreffenden Wasserstrom). Eine theoretische Betrachtung des Koeffizienten des konvektiven W1irmeflusses fUhrt zu der Annahme, dass seine Abh1ingigkeit durch eine Zunahme der Oberfl1ichen-rauhigkeit und besonders durch eine Wirkung der auftreffenden Wassertrllpfchen auf viskose tiefere Schichten und auf turbulenten W1irmefluss nahe der Vereisungsgrenzfl1iche verursacht wird. Die geschilderte Auswertung erlaubt die Berechnung einer Zuwachsleistung fur jeden Vereisungszustand.
h
d· 1
k· 1
p
Pr
R
Re
Convective heat-transfer coefficient (W m- 2 K -I)
Specific heat of water (4.2 kJ kg- I K -I )
Ice-layer thickness
Molecular heat conductivity of air (2.43 x 10⁻² W m-I K- I at 273 K)
Heat conductivity of ice (W m-I K- 1)
Enthalpy of vaporization (2.50 x 10³ kJ kg-I)
Enthalpy of freezing (3 .34 x 102 kJ kg-I)
Atmospheric pressure (mbar)
Prandtl number for air (0.71)
Rate of ice-mass growth (kg m-2 S-I)
Reynolds number (= VDPa/ /La)
Droplet mass flux (= eWV) glvmg eWV x 2/ n averaged per unit area of a half cylinder

rc Recovery factor
Se Sehmidt number for air (0.60)
Air temperature
T f Freezing temperature
v
w
/la
Pa
C1
Surface temperature
Aerodynamic temperature increase at the surface
Free-stream velocity
Liquid water content in the air (kg m-3 )
Molecular weight ratio (0.622)
Radiative emissivities of air and freezing surface, respectively
Dynamic viscosity of air (1.718 x 10⁻⁶ kg m-I s-1 at 273 K)
Air density
Stefan-Boltzmann constant (5.68 x 10⁻⁸ W m- 2 K -4)
INTRODUCTION
Advances in understanding ice-accretion mechanisms have been gained through the theoretical considerations by Macklin and Payne (1967), Cansdale and McNaughtan (1977), List (1977), Ackley and Templeton (1979), and Lozowski and others (1979, I 983[a)), and by experimental verification tests by Lozowski and others (1979, 1983[b D, and Bain and Gayet (1982). These studies have been concentrated on icing of a cylinder exposed to supercooled water droplets, which are eventually mixed with snow and ice crystals. In spite of these advances, knowledge of icing, especially as a wet-growth process, i.e . when all the impinging water does not freeze but runs off, still seems to be insufficient. This has been revealed in experimental tests by Lozowski and others (1979, 1983[b], and Launiainen and others (1983).
The purpose of this paper is to study experimentally and theoretically icing and heat transfer, especially in wet-growth conditions. An increase in liquid water content in the air seems to have a rather drastic effect on heat transfer (cf. Launiainen and others, 1983) and the rate of icing. This effect is thought to be caused by an increase in surface roughness, and especially, by an effect of the impinging water droplets on a viscous sub-layer and on turbulent heat transfer near an icing boundary. The study
Launiainen and Lyyra: Icing on a non-rotating cylinder: JI
was initiated after experimental results clearly revealed distinctly higher icing rates compared to those estimated using the present heat-balance formulations. The experiments were performed in a wind tunnel specially designed for icing studies (cf. Part I of this study; Launiainen and Lyyra, 1986).
Basic theoretical concepts The basic problem, i.e. the rate of lClDg (mass growth
per unit time and unit area), can be formally expressed simply as
R = eWV(l -n) (I)
where W is the liquid water content in the air and V is the wind speed. WV gives the mass flow of supercooled water in the air. The coefficient e is the collection efficiency and is a function of properties of flow and icing structure. The term (I - n) expresses the portion of impinging water that freezes. "Dry growth" (11 = 0) is when all the water freezes, and "wet growth" (0 < n , I) when all the latent heat cannot be transferred from the freezing surface. Hence, the term n may be interpreted as a resistance expressing the part which does not freeze and runs off. The accretion efficiency (1 -11) is a function of the mechanisms controlling primarily the heat balance at the freezing surface. The most important meteorological quantities involved are air temperature Ta' wind speed V, and liquid water content W. Accordingly, the rate of ice accretion may be expressed by the following quantities
R = R(Ta,V,W,F,S) (2)
where, in addition to those given above, the quantities F and S characterize the properties of flow and structure, such as the effect of free-stream turbulence and form, size, and material properties of the icing structure.
The heat balance of a freezing surface, controlling the rate of icing, has been discussed in several papers (Ludlam, 1951; Messinger, 1953; Cansdale and McNaughtan, 1977; Lozowski and others, 1979, 1983[a]; Makkonen, 1981). Considering the most important heat-exchange mechanisms, the quasi-stationary heat-balance equation for a freezing surface can be given as
and
(4)
where R is the rate of ice-mass growth, Lf is the latent heat of freezing, and the other f1uxes increasing or decreasing the enthalpy of the freezing surface are defined (cf. Notation)
sensible heat flux between the freezing surface and air stream;
qe = h ~~r63 ~ )cEa - Eg) p
qi = k i(Ti-Ts)/ d i
latent heat flux due to evaporation;
heat flux between the freezing surface and underlying material, by conduction;
long-wave radiative heat flux (linear approximation);
sensible heat flux required to warm the freezing water droplets to the temperature of the freezing surface;
flux of kinetic energy transformed into heat when the water droplets impinge on the icing surface;
viscous aerodynamic heating due to the air stream;
sensible heat flux required to heat the run-off and shedding part of the impinging water.
I3
Journal of Glaciology
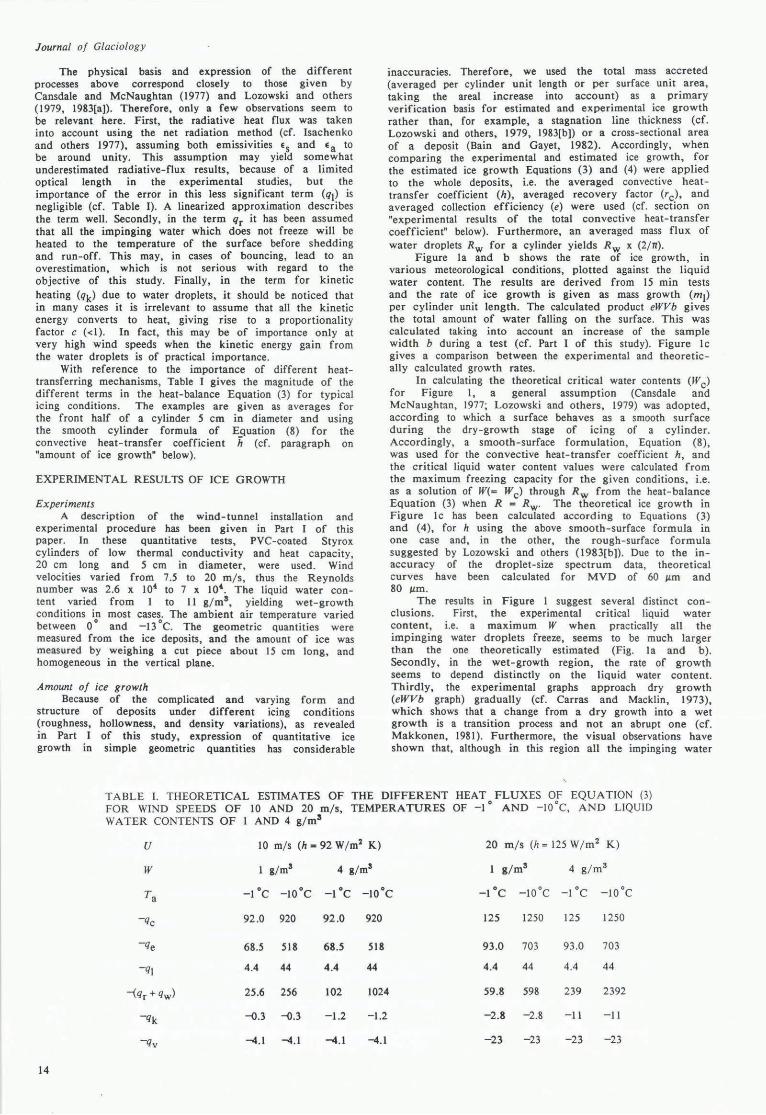
The physical basis and expression of the different processes above correspond closely to those given by Cansdale and McNaughtan (1977) and Lozowski and others (1979, 1983[a]). Therefore, only a few observations seem to be relevant here. First, the radiative heat flux was taken into account using the net radiation method (cf. Isachenko and others 1977), assuming both emissivities ES and Ea to be around unity. This assumption may yield somewhat underestimated radiative-flux results, because of a limited optical length in the experimental studies, but the importance of the error in this less significant term (ql) is negligible (cf. Table I). A linearized approximation describes the term well. Secondly, in the term qr it has been assumed that all the impinging water which does not freeze will be heated to the temperature of the surface before shedding and run-off. This may, in cases of bouncing, lead to an overestimation, which is not serious with regard to the objective of this study. Finally, in the term for kinetic heating (qk) due to water droplets, it should be noticed that in many cases it is irrelevant to assume that all the kinetic energy converts to heat, giving rise to a proportionality factor c « I). In fact, this may be of importance only at very high wind speeds when the kinetic energy gain from the water droplets is of practical importance.
With reference to the importance of different heattransferring mechanisms, Table I gives the magnitude of the different terms in the heat-balance Equation (3) for typical icing conditions . The examples are given as averages for the front half of a cylinder 5 cm in diameter and using the smooth cylinder formula of Equation (8) for the convective heat-transfer coefficient ii (cf. paragraph on "amount of ice growth" below).
EXPERIMENTAL RESULTS OF ICE GROWTH
Experiments A description of the wind-tunnel installation and
experimental procedure has been given in Part I of this paper. In these quantitative tests, PVC-coated Styrox cylinders of low thermal conductivity and heat capacity, 20 cm long and 5 cm in diameter, were used . Wind velocities varied from 7.5 to 20 ml s, thus the Reynolds number was 2.6 x 10⁴ to 7 X 10⁴ • The liquid water content varied from I to II g/ m3 , yielding wet-growth conditions in most cases. The ambient air temperature varied between 0 ° and -13 QC. The geometric quantities were measured from the ice deposits, and the amount of ice was measured by weighing a cut piece about 15 cm long, and homogeneous in the vertical plane.
Amount of ice growth Because of the complicated and varying form and
structure of deposits under different lcmg conditions (roughness, hollowness, and density variations), as revealed in Part I of this study, expression of quantitative ice growth in simple geometric quantities has considerable
inaccuracies. Therefore, we used the total mass accreted (averaged per cylinder unit length or per surface unit area, taking the area I increase into account) as a primary verification basis for estimated and experimental ice growth rather than, for example, a stagnation line thickness (cf. Lozowski and others, 1979, 1983[b]) or a cross-sectional area of a deposit (Bain and Gayet, 1982). Accordingly, when comparing the experimental and estimated ice growth, for the estimated ice growth Equations (3) and (4) were applied to the whole deposits, i.e. the averaged convective heattransfer coefficient (h), averaged recovery factor (r c), and averaged collection efficiency (e) were used (cf. section on "experimental results of the total convective heat-transfer coefficient" below). Furthermore, an averaged mass flux of water droplets Rw for a cylinder yields Rw x (2I n) .
Figure la and b shows the rate of ice growth, in various meteorological conditions, plotted against the liquid water content. The results are derived from 15 min tests and the rate of ice growth is given as mass growth (ml) per cylinder unit length. The calculated product eWVb gives the total amount of water falling on the surface. This was calculated taking into account an increase of the sample width b during a test (cf. Part I of this study). Figure Ic gives a comparison between the experimental and theoretically calculated growth rates.
In calculating the theoretical critical water contents (Wc) for Figure I, a general assumption (Cansdale and McNaughtan, 1977; Lozowski and others , 1979) was adopted, according to which a surface behaves as a smooth surface during the dry- growth stage of lClDg of a cylinder. Accordingly, a smooth- surface formulation , Equation (8), was used for the convective heat-transfer coefficient h, and the critical liquid water content values were calculated from the maximum freezing capacity for the given conditions, i.e. as a solution of W(= Wc) through Rw from the heat-balance Equation (3) when R = Rw. The theoretical ice growth in Figure lc has been calculated according to Equations (3) and (4), for h using the above smooth-surface formula in one case and , in the other, the rough -surface formula suggested by Lozowski and others (1983[b]). Due to the inaccuracy of the droplet-size spectrum data, theore tical curves have been calculated for MVD of 60 /Lm and 80 /Lm.
The results in Figure I suggest several distinct conclusions. First, the experimental critical liquid water content, i.e. a maximum W when practically all the impinging water droplets freeze, seems to be much larger than the one theoretically estimated (Fig. la and b). Secondly, in the wet-growth region, the rate of growth seems to depend distinctly on the liquid water content. Thirdly, the experimental graphs approach dry growth (eWVb graph) gradually (cf. Carras and Macklin, 1973), which shows that a change from a dry growth into a wet growth is a transition process and not an abrupt one (cf. Makkonen, 1981). Furthermore, the visual observations have shown that, although in this region all the impinging water
TABLE l. THEORETICAL ESTIMATES OF THE DIFFERENT HEAT FLUXES OF EQUATION (3) TEMPERATURES OF -I ° AND -IQ oC, AND LIQUID FOR WIND SPEEDS OF 10 AND 20 mls,
WATER CONTENTS OF I AND 4 g/m3
U 10 ml s (h = 92 W/ m2 K) 20 ml s (h; 125 W 1m2 K)
W I g/ m3 4 gl mS I glmS 4 g/ m3
Ta -1°C -10°C -1 °c -10°C -1°C -lO oC -1 °C -10 °C
-Qc 92 .0 920 92 .0 920 125 1250 125 1250
-qe 68.5 518 68.5 518 93.0 703 93.0 703
-ql 4.4 44 4.4 44 4.4 44 4.4 44
-(qr + qw) 25.6 256 102 1024 59.8 598 239 2392
-qk -{).3 -{).3 -1.2 -1.2 -2.8 -2.8 -11 -11
-qv -4.1 -4.1 -4.1 -4.1 -23 -23 -23 -23
14

freezes, it is not necessary that the surface is physically dry all the time. Finally, the experiments yielded significantly higher ice growth than theoretically estimated (Fig. lc). In order to interpret the characteristic results above, and because there is not at present any satisfactory theory, a deeper approach to the heat-exchange problems is now taken (see below).
HEA T EXCHANGE DURING ICING
Using the notation listed, an overall heat-exchange coefficient hoa can be defined for an icing process as
m, /(g Cm')
30 a T. - 14 ·c
o - 12 , - 8 • - 6
I
V· 15 m / 5
20
10
20
15
10
5
4 6
T, V
• - S ·C 10 rn / s . e - 9 ·C 20 rn / s ;;-
0<'1 ~# .... /
I " I / ~"I
I ~ I a l / ...----" I / ___ --I / • ___
1/'/ I V
I f"
8 10
2 4 6 8 10 12
~~ rn / s
I il
15 / 1 , ~~I ------!I ,.--;
/' I / ' // ............. .
,
10 • . . .... . . ' 2
, ' ,' " .... :. I 5 .. : : :: :
.1 ·.·.········ I
o Lt +-1-_L-...L.--L--'-_L..--'--'---L-l
10 o 2 4 6 8
LaUlliaillell alld Lyyra: Icillg on a non-rotating cylinder: II
(5)
which in terms of Equation (3) yields
+, (a)
1 +
(b) (c)
~r f·6S EL (E - E) &.. (T j -Ts)
hoa _ .::.=.e a S + a + c cpP (Ta - Ts) di (Ta -Ts)
h ~c (6) + Rwcw + + (tRwV 2) . (Ta -Ts) cp (Ta-Ts)
(d) (e) (f)
On the role and magnitude of the different terms, we can state the following (cf. the various fluxes in Table I divided by temperature difference). The term (a), connected with convection and evaporation, is large and frequently the most important one. The term (b) using a thermally isolated cylinder is insignificant (in a special study we have found it to be in the order of a few per cent of hoa)' The term (c) is a less significant one and reasonably well known. The term (d), when W is large, is large and significant but the formulation above gives a maximum contribution to the heat transfer and, if incorrect, gives a slight overestimation. The term (e) at velocities lower than 30 m/s is rather small. At low wind velocities, the term (f) is also small, and, if incorrect, it slightly overestimates the heat transfer (cf. section on "basic theoretical concepts" above).
According to the results, the experimental ice growth was found to be larger than the theoretically estimated one. Now, the parameterization of the terms (c) to (f) brings a maximum contribution to the theoretically calculated heat transfer, i.e. a maximum contribution to theoretical growth rates. This means that the problem is more or less concentrated on the first term, and especially on the convective heat-transfer coefficient entering in (a).
In terms of Equations (5) and (6), we can define the convective heat-transfer coefficient as
(7)
I + ---- [~JO.63 ~E -E) + rcV2
] (Ta - Ts) lse pC p a s 2cp
Fig. I . a. Dependence of ice-mass growth (ml ) per unit length for a 5 cm diameter cylinder on the liquid water contellt . for various temperatures and a wind speed of 15 m/ s. and test duration of 15 min. The product eVWb gives the total amount of water falling on the surface. The vertical pointers below show the theoretical critical water content (W ) for the temperature in question. b. Depenience of ice-mass growth per unit length for a 5 cm diameter cylinder on the liquid water content . for a set of experiments of V - 10 m / sand T - -6
0
C. and one of 20 m/ s and ~0c. Test duration 15 min. The product eVWb gives the total amount of water falling on the surface. and the pointers below show the theoretical critical water content. c. Comparison of the experimental and theoretically calculated ice ~rowth. The experimental curve is based on a set (T - -8 C) of measurements from Figure la. The graphs "1" and "1" give the theoretically est imated ice growth. using for the convective heat-transfer coefficient the smooth-surface formula of Equat ion (8) in • r and the rough-surface formula by Lozowski and others ( 1983[ a}) in "2". Both theoretical graphs are given for the droplet size of MVD - 60 jIJ1I (lower lines) and 80 jLm ( upper lines) .
15

Journal of Glaciology
Experimental results of the total convective heat-transfer coefficient
Equation (7) offers a means for calculating from experimental results the transfer coefficient h. Because the surface temperature of a deposit could not be measured, h could only be calculated for wet growth when T - Tf - 0 ·C. The study was carried gut by averaging over t~e deposits, thus giving the average h values. An increase in sample width during the test was taken into account in calculating the terms R, e, and Rw, using the mean of the initial cylinder width and the measured final sample width as an effective width, b, and the effective heat-transferring surface was approximated as a half cylinder of a diameter of b. This approximation fits short-duration 'tests well (cf. Part I) but it may introduce an error in longer-period tests of over 10-15 min. In all the considerations, data obtained by a PVC-coated cylinder were used and, before applying Equation (7), the rate of ice growth R was corrected with respect to the heat capacity of the test probe in order to avoid errors in results of h in very short tests.
Figure 2 gives, in the form of a time series, the experimental jj calculated from a few available sets of
Ta W V
• -13 ·C 7.0gm-3 '5rns-'
x -13 3.7 15
h/ (Wm-' K-') -9 3.9 15
• -6 5.0 15
400 • - 6 3.1 10
- - ~ - - - - - .. - - - - - . - - -300 _ '_-Cl: - e - - - - - -Cl - - - - - - - - - - - -
,,_ • • ~W-~ - - - - .- - - - - - - - - - -
~ GI • _----- - . 200 _ ; ____ - 9 - - - - -, - - - - - - - - - - - - - - v- -
_'f- -q
100 -h,(IS)
h ,(lO)
Fig . 2. Time development of the average experimental convective heat-transfer coefficient for _ various icing conditions. The coefficients hi 10) and hi I5) give the smooth-cylinder coefficients according to Equation (8).
consecutive measurements of different durations, in stationary conditions. For reference, Figure 2 also gives it for the front half of a smooth cylinder calculated from
k Re1/2 n/2 -'l.a ___ 1_ J I
D n/ 2 (8)
o
where ka is the molecular heat conductivity, Re is the Reynolds number, D is the cylinder diameter, and e the angle from the stagnation line. Equation (8) is an approximation used by Lozowski and others (1983[a]), based on the Nusselt number data of Achenbach (1977).
In addition to the somewhat sparse data in Figure 2, we obtained several sets of short-period data from tests of duration 0.5-5 min under various conditions. The data from these tests confirm the results and, together with the data in Figure 2, suggest that the experimental it in wet-growth conditions is significantly greater than the theoretical one, calculated for a smooth surface, right from the very beginning of the test. When comparing common deposit size and form characteristics of our tests (cf. figures 2 and 3 in Part I) with the above, we find that during the first 1-2 min a deposit surface looks smooth but after 5 min the whole surface is covered with small roughness elements and after 9-10 min the deposit reaches its overall structure, after which it increases in size.
Figure 3 gives the experimental heat-transfer coefficient ii versus liquid water content for various wind speeds and
16
h / (Wm-2 K-')
400 a
300
200 o
hi (Wm-2 K-' )
400 b [] /.;..._-- r:J- --- --r:J
/'"
300 / /
20 m /s
15 rn / s Ta
<11 -14 'C
Q -12.5
o -11
• -8 :., - 8 horizontal
cyl. • - 7
• - 5
I I
I .J --
__ - A- - - :. -A- - 10 m I S
200 I --IQ ." .'"
I ;' I //
I / _ 1~ /'~ __ _ hs (20) --
hs (10)
hs (7.5)
o
2 4
0-----0
_-------07.5m / s
Fig . 3 . a. Dependence of the experimental convective heat-transfer coefficient on the liquid water content in the air for various temperatures and a wind speed of 15 m /so h ( 15) gives the coefficient for a smooth cylinder. b.
s Dependence of the experimental heat-transfer coefficient
on the liquid water content in the air for wind speeds of 7.5, 10, and 20 m /s o For symbols , see Figure 3a.
air temperatures, calculated from IS min experiments. The experimental ii is seen to depend distinctly on W, especially for low contents of liquid water in the air. For high wind velocities, the dependence is more apparent than for lower ones. At small liquid water contents, the graphs tend towards hs' The method of calculating h from Equation (7) is thus "self-checking" and indicates that the overall parameterization of Equation (3) is relevant. As discussed before, ii could only be calculated in our case from Equation (7) for wet-growth conditions of W ~ Wc when Ts -_Tf· Figure 3 does not indicate any apparent dependence or h on Ta' Unfortunately, the droplet-size spectrum (or MVD) could not be measured so that the role due to its possible changes in the above results could not be investigated.
The findings given in Figures 2 and 3 raise the question: what physically underlies the facts according to which the experimental convective heat-transfer coefficient from the very beginning of icing is much larger than the theoretical one for a smooth surface, and, that this coefficient seems to be strongly dependent on the liquid water content W? In answer, we might expect that the surface roughness of an ice deposit, the effect of which on heat transfer is rather poorly known, would be principally responsible for the above. However, if we consider the problem from this point of view, we can find the follow ing arguments which do not strongly support that assumption. First, the results show that ii is large from the beginning of the icing, i.e. before the formation of the visual roughness elements, _whereas during the formation of the roughness elements h increases about 20% in four cases out of five (see Fig. 2). Secondly, the dependence of Ji on W in Figure 3 distinctly exceeds the magnitude of time dependence in Figure 2 when the roughness elements are being generated, and Figure 4 reveals a more or less similar interdependence between ii and W in short-period tests, during the early stages of the formation of roughness elements. Thirdly,

300
200 /
/
100
/
/'
/' ~ /' 0
/ 0 'Xi
·1 min
02
.. 3
.4
o 5
--15
Fig. 4. Convective heat-transfer coefficient versus the liquid water content for test periods of 1-5 min (V = 15 m / s) . The dashed line represents the dependence of 15 min tests in Figure 3.
according to the drag coefficient and the Nusselt number studies given in the literature, it seems that at the low wind velocities (i.e . Iow Reynolds numbers) considered the dependence of heat-transfer coefficient on surface roughness is rather low. Additionally, in the case of a hydrodynamically rough cylinder, a further increase in roughness at low Reynolds numbers does not significantly increase skin friction (Achenbach, 1971) and heat transfer (Achenbach, 1977). Actually, a classification of the roughness of an ice deposit, e.g. in terms of the so-called "equivalent sand-grain roughness", is extremely difficult, as pointed out by Lozowski and others (I983[aJ). This is distinctly revealed from figures 2 and 3 in Part I of this paper. Finally, if we follow the assumptions of Lozowski and others (I983[aJ) that a measure of the highest roughness in Achenbach's (1977) experiments represents an ice deposit in roughness we find (Achenbach, 1977, fig . 15) that jj for a rough half-cylinder is approximately the same as for a smooth one when Re ~ 4.8 x 10⁴ and 1.6 times that of a smooth cylinder when Re ~ 7.3 x 10⁴
. When comparing this latter result with Figures 2 and 3, jj obtained from this study can be seen still to be mush larger but it is interesting to note that the increase of h in Figure 2 is of the same order of magnitude as the above change from smooth to rough according to Achenbach's results. The latter Re = 7.3 x 10⁴
corresponds, actually, to a higher velocity (of about 20 m/s) than the results in Figure 2.
Summarizing all the discussion above, we conclude that the large convective heat-transfer coefficients found in this study are not primarily due to surface roughness. This does not mean, however, that surface roughness cannot have any role in this but in the following section, when trying to find a more comprehensive explanation, we just cannot explicitly separate the mechanisms from each other using the available data.
TOWARDS THE MODELLING OF THE HEAT-TRANSFER COEFFICIENT DURING ICING
Total convective heat-transfer coefficient In order to find an explanation to the problem outlined
above, the convective heat-transfer coefficient h, which controls the fluxes of sensible and latent heat during icing, is further discussed below.
If we first consider a semi-stationary convective heattransfer process, the temperature conditions at a heattransferring surface, corresponding to those during icing in the dry-growth region, can be expressed schematically as in Figure Sa. In this case, the convective, i.e. sensible heat flux, is given as
(9)
where hI is the transfer coefficient in question. Using a socalled (e.g. Kreith, 1966) equivalent thickness of a
LaUlliaillell and L yyra: Icing on a non-rotating cylinder: II
®
ICE
Fig. 5. A schematic diagram showing temperature conditions: (a) in a viscous sub-layer in air above an ice-air boundary under dry-growth Iczng; (b) in the viscous sub-layer in water and in air in all ice-water film-air boundary under wet-growth icing.
conductive sub-layer, Sa' hl can be expressed as hl = ka/ Sa where ka is the molecular thermal conductivity in air.
In Figure 5b the temperature conditions are given, analogically, for the case when a water film exists above the heat-releasing surface, corresponding to the wet-growth process. In this case, the viscous sub-layer in the air is assumed to be more or less similar to the former one but, because of the water film (under which the ice grows giving rise to Ts being slightly lower than Tf)' there also exists a viscous sub-layer in the water film . Because of the continuity of the transfer
in air
in water
qI = hI (Ta -Ts)'
q2 = h2(Ts -Tf)'
the following equality must hold:
Eliminating Ts' the solution of ht from the above gives the total heat-transfer coefficient as
(I I)
where h2 is the transfer coefficient in the water film. As an analogy to hI' the coefficient h2 may be expressed formally as h2 = kw/Sw where kw is the molecular heat conductivity in water and Sw is the equivalent thickness of the conductive sub-layer in the water film. Equation (11) covers both cases discussed above. In the former case, 0w - 0 and ht = hp corresponding to a dry- growth process.
It must be emphasized that in the above discussion the equivalent thickness of the conductive sub-layer is a pseudo-thickness merely of practical relevance. This corresponds only to an extension of a linear temperature profile from a boundary, determined by molecular mechanisms, to the total temperature jump. Accordingly, the familiar Nusselt_ number for a cylinder in terms of Sa is Nu z hD/ka - D/ 6a. by definition (cf. Kreith, 1966).
Effect of perturbation due to water droplets impinging on a viscous sub-layer and heat transfer
Strictly speaking, the above consideration is only valid for a process due to temperature differences, and without the flow of impinging water droplets corresponding to a situation under real icing conditions. In the former case, the heat transfer is determined according to Nu - f(Re) only.
17

Journal of Glaciology
In this case, however, the flow of water droplets impinging on a surface causes perturbation in the boundary layer (cf. Fig. 5b). This can contribute to heat transfer in several ways. First, when a water droplet impinges on a surface, it penetrates the heat-transferring layer and locally destroys the structure of the viscous sub-layer in the air-ice or air-water film-ice boundary (the number of impinging water droplets was IOL lO5 cm-2 S-I in these experiments). This perturbation, together with the effects due to splashing, enhances the heat transfer which is otherwise controlled more or less by molecular mechanisms at the boundary. Formally, this enhancement may be interpreted as a decrease in the "effective" equivalent thickness of the conductive sub-layer, similar to the known effect due to an increase in the surface roughness in convective transfer. Combined with "a droplet perturbation", this effect, in later stages of icing, probably affects the icing process.
As a first approximation, it is reasonable to assume that the enhancement of the transfer above is proportional to the number and momentum of impinging droplets, i.e. an increase of Rw (increase of W or V) increases the convective heat-transfer coefficient in Equation (9) through an increase of hI in the atmospheric boundary layer. An increase in the droplet size (MYD) might be expected to affect the convective transfer in a similar way. At large W flows, however, the process becomes a wet one in which the surface is covered by a water layer. Within the limits of surface structure and gravitation, the thickness of the water layer tends to thicken with increasing water flow. Although this layer is also exposed to perturbation due to the impinging droplet flow, and hence the heat transfer (h2)
is controlled to a lesser degree by the molecular mechanisms, the water layer forms a limiting process for heat transfer when liquid water contents in flow are large, even though the increase in the number of droplets tends to increase h I further. For example, in the stagnation region of low shear but large collection efficiency, the water film tends to thicken most rapidly thus decreasing the heat transfer, and this gives rise to the formation of a stagnation hollow. Based on these arguments, the two asymptotic regions for Equation (11) may be expressed as
(12)
for a dry process when Sw z 0 and,
(13)
for a wet one of large W when Sw increases and h2« hI' In these considerations we have merely tried to find an
explanation for the behaviour of the convective heattransfer coefficient. Thus we have not paid any attention to the net effect ansmg from a change in the droplet spectrum (increase in MYD - decrease in the number of droplets) to the form and size of an object exposed to droplet perturbation, to alignment of the surface with respect to the flow, etc. Therefore, we refrain from a parameterization of the sparse experimental data available. However, for small contents of W, the results (see Fig. 3) suggest h follows Equation (12) linearly with W, and show that ht can be expressed as in Equation (11), as given for the two examples in Figure 6.
It is reasonable to assume that, for example, in the results by Lozowski and others (1979, 1983[b]) this "droplet perturbation" might explain icing rates larger than the estimated ones for large W. However, the data given in the paper do not allow a quantitative approach.
ACCRETION EFFICIENCY
The accretion efficiency (1 - n), a quantity of practical importance in Equation (I), can be solved by making equal the rate of ice I\!0wth R in Equations (I) and (5). Using the experimenal h from Figure 3 in calculating Equation (6), Figure 7 gives the estimated (I - n) for various meteorological conditions. Figure 7 is based on 15 min experiments but may serve as a basis for approximation for icing tests of a few minutes duration up to I h (cf. Fig.
18
h / (Wm-Z K-1)
1200
1000
800
600
400
200
\ \ \ \
\ \
\ /
\{
/ "
15 m/s
20 m/s
Fig. 6. Examples of the convective heat-transfer coefficients in air (hI) and in water (h 2) based on Equation (11) and on an assumption of a linear increase of hI with increasing liquid water content. The experimental coefficients ht are from Figure 3.
(1-n)
to ~
- · - · -7.5m/s
---15 m/S
0.8 - - - - 20 m/s
0.6 -14·C
0.4 :-~ f -10·C
0.2
Fig. 7. Accretion efficiency of Equation (J) for a 5 cm diameter cylinder, based on the experimental convective heat-transfer coefficients from Figure 3. The dotted line gives the theoretical accretion efficiency calculated by using the convective heat-transfer coefficient for a smooth cylinder for an air temperature of -14·C and wind speed of 15 m/so
2), providing that the change in the collection efficiency in tests of a longer duration are taken into account. For reference, an example of the efficiency (I - n), calculated by using the (constant) smooth-surface heat-exchange coefficient (see Fig. 7), is seen to yield drastically lower (I - n) estimates than the results of this study.
Carras and Macklin (1973) have given interesting results relating to the fraction Of water lost (i .e. the quantity n in this study) during ice accretion on cylinders and in artificial hailstone growth. Qualitatively, these results are very similar to the present ones. Strict quantitative comparison, however,

is very difficult because of the different Reynolds numbers, the different droplet sizes, and the rotation of test cylinders in the experiments by Carras and Macklin.
SUMMARY AND CONCLUDING REMARKS
Based on wind-tunnel experiments concerning stationary wet-growth icing on a non-rotating cylinder, the rate of icing and heat balance of an icing surface was investigated. The experimental ice growth was found to be distinctly larger than the estimated one according to present heatbalance formulae . For very small (dry growth) liquid water contents (W) in the air, however, the overall parameterization of Equation (3), using the smooth-surface formula for the convective heat-transfer coefficient, seems to be (asymptotically) relevant.
The convective heat-transfer coefficient (h) was found to depend strongly on the liquid water content in the air (or rather on the droplet flux Rw) but not on the air temperature. In fact, the temperature region during the experiments, which depended on the ambient temperature in our outdoor tunnel, was somewhat restricted. The large experimental h and the dependence of h on W is supposed to be primarily due to two different mechanisms: an increase in surface roughness of an ice deposit and, especially, mechanical perturbations of viscous atmospheric and waterfilm boundaries above a freezing surface, caused by impinging water droplets. Unfortunately, the effects of these two mechanisms cannot be separated and explicitly parameterized, using the available data. (We are planning to carry out a special set of heat-transfer experiments in the near future .) The latter mechanism and the "total" convective heat-transfer coefficient was considered theoretically but further data are necessary for general parameterization . Data are scarce, and in these kinds of studies several potential errors may have an influence; such as calculation of collection efficiency, determination of surface area, taking into account shedding water in the calculation of the heat-transfer coefficient, the effect of sponginess on growth rate and on heat-transfer results, etc. According to an error analysis and indirect evidence indicated by the results, these errors should not seriously affect the results of this study. For example, spongy ice was not observed (cf. Part I) except in tests at high temperatures , and the transfer coefficient Ji did not show a dependence on the temperature, as might be expected when there is sponginess or there are errors in estimating the effect of the shedding water.
The h results obtained allow us to calculate the net accretion efficiency (I - n) for various experimental conditions given as nomographs in Figure 7.
Finally, the discovery that the convective heat-transfer coefficient is not constant and, especially that h = h(W), led us to speculate about the critical water-content (Wc) concept, determining the change from dry growth to wet growth. In this case, the critical water content cannot be calculated directly (cf. Makkonen, 1981) by solving Wc from the maximum freezing capacity given by a heat-balance equation such as Equation (3) but it involves an iteration process. To avoid this, instead of using the critical water content, a concept of a "critical temperature" for the given conditions might be used, which is analogous to the usual "dew-point temperature" for each atmospheric moisture condition. In practice, however, the experiments (cf. Part I) have shown that the change from dry growth to wet growth is a transition process and not an· abrupt one. This is also supported by the present theoretical arguments.
ACKNOWLEDGEMENTS
We wish to thank the advisory group of the project: Professor E. Holopainen, Professor M. Porkka, Dr P. M!Ukki, and Civ. eng. G. Edelman for their scientific
L aUlliainell and L yyra: Icing 011 a non-rotating cylinder: II
support. Furthermore, scientific discussions with Professor E. Palosuo, as well as the assistance of Mr M. J!intti in performing the experiments, are kindly acknowledged. The study was supported financially by the Finnish Academy.
REFERENCES
Achenbach, E. 1971 . Influence of surface roughness on the cross flow around a circular cylinder. Journal of Fluid Mechanics, Vol. 46, 29 March, Part 11, p. 321-35.
Achenbach, E. 1977. The effect of surface roughness on the heat transfer from a circular cylinder to the cross flow of air. International Journal of Heat and Mass Transfer, Vol. 20, No. 4, p . 359-69.
Ackley, S.F., and Templeton, M.K. 1979. Computer modeling of atmospheric ice accretion. CRREL Report 79-4.
Bain, M., and Gayet, J .F. 1982. Aircraft measurements of icing in supercooled and water droplet/ ice crystal clouds. Journal of Applied Meteorology, Vol. 21, No. 5, p. 631-41.
Cansdale, J.T., and McNaughtan, 1.1. 1977. Calculation of surface temperature and ice accretion rate in a mixed water droplet / ice crystal cloud. Farnborough, Royal Aircraft Establishment. (Technical Report 77090.)
Carras, J.N., and Macklin, W.C. 1973. The shedding of accreted water during hailstone growth. Quarterly Journal of the Royal Meteorological Society , Vol. 99, No. 422, p . 639-48 .
lsachenko, V.P., and others. 1977. Heat transf er , by V .P. Isachenko, V.A . Osipova, and A.S . Sukomel . Moscow, MlR Publishers.
Kreith, F. 1966. Principles of heat transf er. Scranton, PA, International Textbook Co.
Launiainen, J., and Lyyra, M. 1986. Icing on a non-rotating cylinder under conditions of high liquid water content in the air: I. Form and size of ice deposits . Journal of Glaciology, Vol. 32, No. 110, p. 6-11 .
Launiainen, J., and others . 1983. A wind tunnel study of icing on marine structures, by J . Launiainen, M . Lyyra, and L. Makkonen. POAC 83. The seventh Internat ional Conference on Port and Ocean Engineering under Arctic Conditiolls, Helsinki , Finland , 5-9 April 1983. Proceedings , Vol. 3, p. 446-57 .
List, R. 1977. Ice accretions on structures. Journal of Glaciology, Vol. 19, No. 81, p. 451-65 .
Lozowski, E.P., and others. 1979. The icing of an unheated nonrotating cylinder in liquid water droplet-ice crystal clouds, by E.P. Lozowski, J.R. Stallabrass, and P .F. Hearty. Ottawa, National Research Council Canada. Division of Mechanical Engineering. Low Temperature Laboratory. (Report L TR-L T -96.)
Lozowski, E.P., and others. 1983[a]. The icing of an unheated nonrotating cylinder. Part I: a simulation model, by E.P. Lozowski, J.R. Stallabrass, and P.F. Hearty. Journal o[ Climate and Applied Meteorology, Vol. 22, No. 12, p. 2053-62.
Lozowski, E.P., and others. 1983[b]. The icing of an unheated nonrotating cylinder. Part 11: icing wind tunnel experiments, by E .P . Lozowski, J .R. Stallabrass, and P.F. Hearty. Journal of Climate and Applied Meteorology, Vol. 22, No. 12, p. 2063-74.
Ludlam, F.H. 1951. The heat economy of a rimed cylinder . Quarterly Journal of the Royal Meteorological Society, Vol. 77, No. 334, p. 663-66.
Macklin, W.C., and Payne, G.S. 1967. A theoretical study of the ice accretion process. Quarterly Journal of the Royal Meteorological Society, Vol. 93, No. 396, p. 195-213.
Makkonen, L. 1981 . Estimating intensity of atmospheric ice accretion on stationary structures . Journal of Applied Meteorology, Vol. 20, No. 5, p. 595-600.
Messinger, B.L. 1953. Equilibrium temperature of an unheated icing surface as a function of air speed. Journal of the Aeronautical Sciences, Vol. 20, No. I, p. 29-41.
MS . received 2 January 1985 and in revised form 22 October 1985
19