
icepac tech manual - Greg Hand
94
Ionospheric Communications Enhanced Profile Analysis & Circuit (ICEPAC) Prediction Program Technical Manual i I ONOSPHERIC C OMMUNICATIONS E NHANCED P ROFILE A NALYSIS & C IRCUIT (ICEPAC) PREDICTION PROGRAM TECHNICAL MANUAL
Transcript of icepac tech manual - Greg Hand

Ionospheric Communications Enhanced Profile Analysis & Circuit (ICEPAC) Prediction Program Technical Manual
i
IONOSPHERIC COMMUNICATIONS
ENHANCED PROFILE ANALYSIS & CIRCUIT
(ICEPAC)
PREDICTION PROGRAM
TECHNICAL MANUAL

Ionospheric Communications Enhanced Profile Analysis & Circuit (ICEPAC) Prediction Program Technical Manual
ii
TABLE OF CONTENTS
Page
1. INTRODUCTION 1
1.1 HF Radio Propagation History 1
1.2 General Description 3
2. PREDICTABLE IONOSPHERIC PARAMETERS 5
2.1 D Region 5
2.2 E Region 6
2.3 F Region 8
2.4 Propagation by Way of sporadic E and Other Anomalous Ionization 10
2.5 Electron density profile model 12
3. CALCULATION OF CIRCUIT PARAMETERS FROM PATH GEOMETRY 14
3.1 Path Length and Bearings 14
3.2 Reflection Area Coordinates 14
3.3 Sun's Zenith Angle 16
3.4 Types of Paths Considered 16
3.5 Ionospheric Parameters 17
3.6 Electron Density Profile 23
3.7 Raypath and Area Coverage Propagation 26
3.8 Probability of Sky-Wave Propagation 36
3.9 Probability of Sporadic-E Propagation 40
3.10 Calculation of Mixed Modes 41
4. NOISE PARAMETERS 42
4.1 Galactic Noise 42
4.2 Atmospheric Noise 42
4.3 Man-Made Noise 43
4.4 Combination of Noise 44
5. HIGH-FREQUENCY TRANSMISSION LOSS CALCULATIONS 46
5.1 Free Space Loss Lbf 47
5.2 Ionospheric Loss Li 48
5.3 Frequency Dependence Effects on Absorption 52
5.4 Loss For Propagation Above the Standard MUF 55
5.5 Sporadic E Loss 56
5.6 System Loss Ls 57
5.7 Conclusions 59

Ionospheric Communications Enhanced Profile Analysis & Circuit (ICEPAC) Prediction Program Technical Manual
iii
TABLE OF CONTENTS (CONT'D)
Page
6. LONG DISTANCE MODEL 60
6.1 Qualitative Aspects of Long Distance Communications 60
6.2 The Long Distance Model 64
6.3 Summary 69
7. HIGH-FREQUENCY SYSTEM PERFORMANCE 71
7.1 Circuit Reliability 71
7.2 Service Probability 74
7.3 Multipath Evaluation 82
8. MAXIMUM USABLE FREQUENCY (MUF) MODEL 85
8.1 Geometry of the MUF 86
9. ACKNOWLEDGEMENTS 89
APPENDIX A. INDIVIDUAL ANTENNA DESCRIPTIONS AND POWER GAIN EQUATIONS 90
REFERENCES 133

Ionospheric Communications Enhanced Profile Analysis & Circuit (ICEPAC) Prediction Program Technical Manual
1
TECHNICAL DESCRIPTION OF ICEPAC PROPAGATION PREDICTION PROGRAM
FRANK G. STEWART
Simulation models have been developed for predicting
and analyzing the performance of HF systems that depend
on ionospheric propagation. These models are documented.
1. INTRODUCTION
This report describes a propagation predictions model (ICEPAC) that is an
extension of the IONCAP program. It differs in the polar region structure of
the ionosphere and the low and mid latitude ionospheric structure. The ICED
(ionospheric conductivity and electron density) profile model is a statistical
model of the large-scale features of the northern hemisphere ionosphere. The
model recognizes the different physical processes that exist in the different
regions of the ionosphere. It contains distinct algorithms for the subauroral
trough, the equator-ward portion of the auroral zone, the polward region of the
auroral zone, and the polar cap. This report will be a complete description of
the ICEPAC propagation prediction program.
The predictions are used primarily for long-term (month-to-month, year-
to-year, etc.) frequency management and circuit planning, but are often used
for hour-to-hour and day-to-day operations as well. Most important,
propagation considerations are basic to studies of electromagnetic
compatibility, and analytical computer prediction methods such as the one
described in this report are essential to a practical solution.
It should be emphasized that a computer program is a tool for convenience
in calculation; the user must exercise his own engineering judgment in
determining the applicability and limitation of the results to specific
problems.
1.1 HF RADIO PROPAGATION HISTORY
For many years, numerous organizations have been employing the High
Frequency (HF) spectrum to communicate over long distances. It was recognized
in the late 30's that these communication systems were subject to marked
variations in performance, and it was hypothesized that most of these
variations were directly related to changes in the ionosphere. Considerable
effort was made in the United States, as well as in other countries, to
investigate ionospheric parameters and determine their effect on radio waves

Ionospheric Communications Enhanced Profile Analysis & Circuit (ICEPAC) Prediction Program Technical Manual
2
and the associated reliability of HF circuits. A worldwide network of vertical
incidence sounders was established to measure values of parameters such as foE,
foF1, foEs, foF2, and h'F. Worldwide noise measurement records were started
and steps were taken to record observed variations in signal amplitudes over
various HF paths. The results of this research established that ionized
regions ranging from approximately 70 to 1000 km above the earth's surface
provide the medium of transmission for electromagnetic energy in the HF
spectrum (2 to 30 MHz) and that most variations in HF system performance are
directly related to changes in these ionized regions. The ionization is
produced in a complex manner by the photoionization of the earth's high
altitude atmosphere by solar radiation. Within the ionosphere, the
recombination of the ions and electrons proceeds slowly enough (due to low gas
densities) so that some free electrons persist even throughout the night. In
practice, the ionosphere has a lower limit of 50 to 70 km and no distinct upper
limit, although 1000 km is somewhat arbitrarily set as the upper limit for most
application purposes.
The vertical structure of the ionosphere is changing continuously. It
varies from day to night, with the seasons of the year, and with latitude.
Furthermore, it is sensitive to enhanced periods of short-wavelength solar
radiation accompanying solar activity. In spite of all this, the essential
features of the ionosphere are usually identifiable, except during periods of
unusually intense geomagnetic disturbances.
The Radio Propagation Unit of the U.S. Army Signal Corps provided a great
deal of information and guidance on the phenomena of HF propagation in 1945.
By 1948, a treatise of ionospheric radio propagation was published by the
Central Radio Propagation Laboratory (CRPL) of the national Bureau of
Standards. This document (NBS, Circular 462, 1948) outlined the state of the
art in HF propagation. Techniques were included for: predicting the maximum
usable frequencies (MUF); determining the MUF for any path at any time taking
into account the various possible modes of propagation by combining theory and
operational experiences; and estimating skywave field strength.
Laitinen and Haydon (1962) of the U.S. Army signal Radio Propagation
Agency furthered the science of predicting HF system performance by developing
empirical ionospheric absorption equations and combining them with the
theoretical ground loss, free-space loss, and antenna gain factors so that
expected field strengths could be estimated for radio signals reflected from
the E- and F2-regions, considering the effect of solar activity and seasonal
and diurnal variations.

Ionospheric Communications Enhanced Profile Analysis & Circuit (ICEPAC) Prediction Program Technical Manual
3
In the United States, the first automated HF path prediction computer
program was developed in 1957, for the U.S. Army Signal Corps, Radio
Propagation Agency (Contract DA 360039 SC-66438), now part of the U.S. Army
Strategic Communications Command (see Stanford Research Institute (SRI), 1957).
A later version was published in 1961 (Radio Corporation of America, 1961).
The first fully automated program, in which the oblique transmission equations
for parabolic layers were used, was developed in 1966 (Lucas and Haydon, 1966)
by ESSA's Institute for Telecommunication Sciences and Aeronomy (ITSA), which
preceded the Institute for Telecommunication Sciences (ITS).
This work was continued in two separate paths, one for communications
analysis and predictions, reported in ITS-78 (Barghausen et al., 1969) and
another for analysis and prediction of OTH radar systems reported in NRL Tech.
Reports 2226 and 2500 (Headrick et al., 1971; Lucas et al., 1972).
The culmination of this work was the IONCAP program which uses the above
described development for the shorter paths and other techniques for the long
path predictions (Whale, 1969).
Fundamental to all efficient HF computer prediction programs are the
synoptic numerical coefficient representations of the ionospheric
characteristics. These were first developed by ITSA (formerly the Central
Radio Propagation laboratory, National Bureau of Standards) and first published
in 1960 (Jones and Gallet, 1960). Subsequent modification led to the technique
now used (Jones et al., 1966), which will be discussed later.
1.2 GENERAL DESCRIPTION
The techniques used in the computer program described in this report are
procedurally similar to the earlier ITS programs (ITSA-1, ITS-78, HFMUFES,
IONCAP), but there have been sufficient significant changes to warrant further
documentation.
The literature on the ionosphere and its role in HF sky-wave radio
communications is very extensive. Theories concerning ionospheric propagation
will not be repeated here in detail, but some background material will be given
where necessary for an understanding of the prediction processes and the
philosophy of the program.
In the basic model, it is assumed that the ionosphere can be represented
by one or more Chapman layers (Dudney, 1983), given sufficient information
concerning the height of maximum ionization, semi-thickness, and electron
density. Sufficient data must be available to predict an average electron
density distribution with height for any possible transmission path. The

Ionospheric Communications Enhanced Profile Analysis & Circuit (ICEPAC) Prediction Program Technical Manual
4
model retains the equivalent path theorem (Breit and Tuve, 1926; Martyn, 1935)
and its transmission curve solution (Smith, 1939), since this is the method for
scaling and predicting ionospheric characteristics.
The program predicts the long-term operational parameters, such as
maximum usable frequency (MUF), optimum traffic frequency (FOT), and lowest
useful frequency (LUF), in terms of the probability of successful transmission
for a particular circuit. The probability of successful transmission depends
on the probability that the transmission frequency is below the critical
frequency (i.e., the maximum frequency for reflection) of the F2 layer and the
probability that the available signal-to-noise ratio is above a specified
level.
Throughout the report, attempts have been made to clarify duplication of
nomenclature and symbols commonly accepted in wave propagation and antenna
studies.

Ionospheric Communications Enhanced Profile Analysis & Circuit (ICEPAC) Prediction Program Technical Manual
5
2. PREDICTABLE IONOSPHERIC PARAMETERS
The presence of free electrons in the ionosphere produces the reflecting
regions important to High Frequency (HF) radio-wave propagation. In the
principal regions, between the approximate heights of 75 km and 500 km, the
electrons are produced by the ionizing effect of ultraviolet light and soft x-
rays from the sun. for convenience in studies of radio-wave propagation, the
ionosphere is divided into three regions defined according to height and ion
distribution: the D,E, and F regions. Each region is subdivided into layers
called the D,E, Es, F1, and F2 layers, also according to height and ion
distribution. These are not distinctly separated layers, but rather
overlapping regions of ionization that vary in thickness from a few kilometers
to hundreds of kilometers. The number of layers, their heights, and their
ionization (electron) density vary both geographically and with time. At HF,
all the regions are important and must be considered in predicting the
operational parameters of radio communication circuits.
2.1 The D Region
The D region lies between the approximate limits of 75 and 90 km above
the earth's surface. The electron density is relatively small compared with
that of the other regions, but, because of collisions between the molecules of
the atmosphere and free electrons excited by the presence of an electromagnetic
wave, pronounced energy loss occurs. This energy loss, dissipated in the form
of thermal energy of the electrons or thermal (electromagnetic) noise, is
termed absorption. Absorption in the D region is called non-deviative, since
it occurs below the level of reflection and predominates when the real part of
the refractive index is near unity (µ≈1); i.e., little or no bending takes
place. Higher in the E and F regions, electron collisions with atmosphere
molecules can also affect the condition for reflection that occurs wherever
there is a marked bending of the wave. This is explained by the fact that as
the wave nears its reflecting level, there is a slowing down or retardation
effect, which allows additional time for collisions to occur and thus for
absorption to take place. Absorption of this type is called deviative
absorption.
Because of the low electron density, the D region does not reflect useful
transmissions in the frequency range above 1 MHz. However, D-region absorption
is important at all frequencies and, because its ionization is produced by
ultraviolet solar radiation, it is primarily a daytime phenomenon. The degree

Ionospheric Communications Enhanced Profile Analysis & Circuit (ICEPAC) Prediction Program Technical Manual
6
of absorption, expressed by the absorption factor, is proportional to the
product of the collision frequency and electron density, and approximately
inversely proportional to the square of the wave frequency. The absorption
factor variation is adequately represented by cos χ, where χ is the zenith angle
of the sun. After sunset in the D region, ionization decreases rapidly and
non-deviative absorption becomes negligible 2 to 3 hours later.
Non-deviative D-region absorption is the principal cause of the
attenuation of HF sky waves, particularly at the lower frequencies during
daylight hours. It is accounted for in the program by an analytical, semi-
empirical expressions, which is explained in detail in section 5. Deviative
absorption losses are estimated and included in the loss calculations as an
uncertainty factor (see sec.7).
Another important property of the upper D and lower E regions is the
differential absorption between the ordinary and extraordinary waves produced
by the earth's magnetic field. These differential absorption properties of the
characteristic waves and their down-coming state of polarization are especially
important at frequencies below about 3 MHz and in low-latitude regions. In
these areas, when vertically polarized antennas are used, most of the radiated
power is coupled into the extraordinary wave (Berghausen, 1966). The
extraordinary wave is reflected at a lower level, its critical frequency is
somewhat higher, and it suffers greater absorption. The idealized situation is
when a vertically polarized wave is transmitted in an easterly or westerly
direction along the location of the earth's magnetic dip equator and the wave
frequency is exactly equal to the gyromagnetic frequency (~0.8 MHz). Then, all
the radiated power is coupled into the extraordinary wave and the ordinary wave
does not exist. In this program, only the ordinary wave critical frequency and
absorption properties are considered.
2.2 THE E REGION
For communication, the most important characteristic feature of the E
region is the temporal and geographic variation of its critical frequency. In
almost all other respects, the features of the E layer are very predictable
compared with those of the F2 layer.
2.2.1 Measurements
A large volume of vertical-incidence ionosonde data has been collected
over about three solar cycles, and many features of the E region are therefore
well known. The minimum virtual height of the E region and the variation of

Ionospheric Communications Enhanced Profile Analysis & Circuit (ICEPAC) Prediction Program Technical Manual
7
maximum electron density within this region as a function of time and
geographic location are readily obtained from the ionograms. The phenomenology
of sporadic-E has been investigated, but classification of sporadic-E types
remain unresolved. The effects of different types of sporadic-E on oblique-
incidence radio propagation are not established; as a result, the compilation
of meaningful statistics to form the basis of predictions is difficult.
The E-region characteristics that have been systematically scaled from
the vertical-incidence ionosonde records include:
foE The critical frequency of the ordinary component of the E
layer; i.e., that frequency at which the signal from the
ionosonde just penetrates the E layer.
h'E The minimum virtual height of the E layer, measured at the
point where the trace becomes horizontal.
foEs The highest observed frequency of the ordinary component of
sporadic-E (Es).
h'Es The minimum virtual height of the sporadic-E layer, measured
at the point where the trace becomes horizontal.
fbEs The blanketing frequency; i.e., the lowest ordinary wave
frequency at which the Es layer begins to become transparent,
usually determined from the minimum frequency at which
ordinary wave reflections of the first order are observed
from a higher layer.
2.2.2 Predictions
The regular E layer is predicted using three parameters: the monthly
median value of critical frequency (foE), height of maximum ionization of the
layer (hmE), and ratio of hmE to semi-thickness (ymE). In the past, the E-layer
critical frequency has been determined by a semi-empirical equation involving
the sunspot number and the zenith angle of the sun. Obviously, such a
relationship would be inadequate to estimate foE values at sunrise or sunset
and during nighttime. Worldwide numerical coefficients of monthly median foE
are available for computer applications in terms of geographic latitude,
longitude, and universal time. The numerical coefficients (Leftin, 1976)

Ionospheric Communications Enhanced Profile Analysis & Circuit (ICEPAC) Prediction Program Technical Manual
8
representing foE were derived from measurements taken during 1958 and 1964.
These years were selected for analysis because the data are representative of
the high (1958) and low (1964) phases of the sunspot cycle. Linear
interpolation is used between the representative data for the high (SSN = 150)
and low (SSN = 10) sunspot periods to obtain foE estimates at all other phases
of the solar cycle.
Little information is available concerning the statistical distribution
of the monthly median foE. In daytime, the E layer is sufficiently regular
that the distribution spread of the monthly median foE may be considered
negligible. Nighttime data are insufficient, but it appears justified (Elling,
1961; Wakai, 1966; Wakai, 1967) to assume a similar regularity for the foE
monthly median of the nighttime E layer.
Therefore, we believe that the E-layer characteristics most important for
communication purposes are adequately represented by the available foE monthly
median numerical coefficients. The approximate true height range of the
regular E layer is well established at 90 to 130 km and it is assumed that the
maximum electron density occurs at 110 km and the semi-thickness is 20 km
(Kneckt, 1963; Frihagen, 1965). With the above assumption, the ratio of the
height to the semi-thickness (hmE/ymE) is assumed to be 5.5.
2.3 THE F REGION
The vertical-incidence ionosonde network with its long series of
measurements over much of the world, provides the basis for F-region
predictions (Martyn, 1959). The following parameters have been systematically
scaled from the vertical ionosonde records (Piggott and Rawer, 1961), although
some stations do not report all of them:
foF2 The critical frequency of the ordinary component of the F2
layer; i.e., that frequency at which the signal from the
ionosonde just penetrates the F2 layer.
M(3000)F2 The factor for converting vertical-incidence critical
frequencies to oblique incidence for a distance of 3000 km
via the F2 layer.

Ionospheric Communications Enhanced Profile Analysis & Circuit (ICEPAC) Prediction Program Technical Manual
9
foF1 The critical frequency of the ordinary component of the F1
layer; i.e., that frequency at which the signal from the
ionosonde just penetrates the F1 layer.
H'F2 The minimum virtual height of the F layer; i.e., the minimum
virtual height of the night F layer and the day F1 layer. It
is measured at the point where the F trace becomes
horizontal. (In earlier years the minimum virtual height of
the night F layer was often combined with that of the day F2
layer, the combined tabulation being designated h'F2. In
these cases, the minimum virtual height of the F1 layer,
h'F1, was tabulated separately.)
hpF2 The virtual height of the F2 layer corresponding to a
frequency f, where f = 0.834 foF2. This is based on the
assumption of a parabolic ionization distribution, which is
usually considered justified as an approximation to the
height of maximum ionization of the F2 layer.
For HF radio communications, the F region is the most important part of
the ionosphere. It is not regular and because of its variability, short time
scale estimates of the important F-region characteristics are required if
predictions of the operational parameters of HF radio systems are to be
meaningful.
There are many characteristic features of the F region important to HF
radio communications. It is beyond the scope of this report to describe all of
them, nor is this necessary, since there are many publications and excellent
textbooks on the subject. We will briefly describe only those F-region
characteristics that are relevant to the program.
The F1 layer has not been as well defined as the F2 layer in terms of its
predictable characteristic features. the F1 layer is of importance to
communication only during daylight hours or during ionospheric storms (Kelso,
1964; Wright et al., 1960-63); it lies in the height range of about 200 to 250
km and undergoes both seasonal and solar cycle variations, which are more
pronounced during the summer and in high sunspot periods.

Ionospheric Communications Enhanced Profile Analysis & Circuit (ICEPAC) Prediction Program Technical Manual
10
2.3.2 Predictions
The F2 layer is described by three parameters: monthly median value of
critical frequency (fof2), height of maximum ionization (hmF2), and a ratio of
hmF2 to semi-thickness (ymF2). Monthly median values of foF2 and the M(3000)F2
for two solar activity levels are available as numerical coefficients in terms
of a modified magnetic-dip angle and longitude, and universal time (CCIR,
1966). There is also available a more recent model of the F2 region of the
ionosphere. This model is based on a combination of observed and theoretical
data. The theoretical data provided stability in large regions where no
observed data existed, such as ocean areas and non-industrialized areas. (CCIR
1989) This F2 region model showed minor improvements in populated regions and
significant improvements over sea area and unpopulated regions when compared to
observed ionosound and satellite measurements. For this document the old CCIR
model will be described. The analytical structure of the more recent
coefficients and the documentation would be consistent. The solar activity
dependence is accounted for by linear interpolation.
The model divides the F2 region into four distinct zones: (1) normal
low-latitude and mid-latitude ionosphere as described by the numerical
coefficients, (2) the trough, (3) the zone of aurorally enhanced foF2's and (4)
the polar cap. The key boundary for the model is the equatorward edge of the
auroral oval. The resulting boundary location is parameterized by comparing it
with standard Feldstein oval boundaries computed as a function of Kp or Q
(Whalen, 1972). The resulting magnetic index (Kpeff or QE) is an effective
auroral energy index because it is based on the "current" state of the high
latitude ionosphere.
2.4 PROPAGATION BY WAY OF SPORADIC E AND OTHER ANOMALOUS IONIZATION
In the preceding discussion of the important regions of the ionosphere,
we concentrated on the first order characteristics of the various layers.
There are many other characteristic phenomena, e.g., sporadic E, spread F, F
scatter, multiple traces, and other transients, often observed on ionosonde
records (Piggott and Rawer, 1961), that are important in radio communications;
however, present prediction schemes demand that the general ionospheric
structure be statistically representative and in a continuous sequence. Of
these phenomena, the only one we have been able to partly represent for
prediction purposes is the sporadic-E layer.

Ionospheric Communications Enhanced Profile Analysis & Circuit (ICEPAC) Prediction Program Technical Manual
11
2.4.1. Sporadic E
Sporadic E (Smith and Matsushita, 1962; Bowhill, 1966; Whitehead, 1969)
is seen on vertical and oblique ionograms near the height of maximum ionization
of the regular E layer. Sporadic E(Es) is characterized by little or no
retardation at its critical frequency and may be either blanketing (totally
reflecting) or semitransparent (partly reflecting), or both, up to very high
frequencies( >75 MHz). These characteristics can be helpful or harmful to
radio communications. For example, blanketing Es may block propagation via a
more favorable regular layer mode in a certain frequency range or cause
additional attenuation at other frequencies. Partially reflecting Es can
cause serious multipath and mode interference, especially detrimental to data
transmission systems. However, Es may extend the useful frequency range and
its presence can be effectively used in system design and operations.
The physical processes that produce sporadic-E ionization are not fully
known, but it is generally accepted that the mechanisms may be quite different
in auroral, temperate, and equatorial geographic areas (Bowhill, 1966;
Whitehead, 1969). In auroral areas, energetic particles appear to play a vital
role in the production of sporadic E (Baily, 1968). Temperate-area Es is best
explained by the behavior of upper atmosphere winds (Matsushita and Reddy,
1968) and a related wind-shear theory (Axford and Cunnold, 1968). In
equatorial areas, i.e., in a narrow ±6o belt centered on the magnetic dip
equator, the production of sporadic-E is explained by theories on plasma
instability phenomena (Farley, 1963; Waldteufel, 1965). Methods of forecasting
sporadic E are influenced by the physical processes involved and should be
considered in all prediction schemes. In this report, we are not directly
concerned with forecasting techniques, but with predicting operational
parameters when sporadic E is the dominant propagation mode. Therefore, the
numerical coefficients representing the monthly statistical distribution of
foEs for any location are empirically derived estimates of sporadic E during
periods of solar cycle minimum and maximum, and they are used only when
propagation via the regular E layer is not possible (see sec. 3).
It may be helpful to review the general occurrence characteristics of
sporadic E for the three geographic areas mentioned above (CCIR, 1969):
Auroral Es - Occurs mainly at night at geomagnetic latitudes greater than
about 60o, with a maximum near 69o. Its seasonal, diurnal, and solar cycle
patterns are not clear. It occurs more frequently during periods of high
magnetic activity and follows the sudden commencement associated with a solar
flare (Hunsucker and Bates, (1969).

Ionospheric Communications Enhanced Profile Analysis & Circuit (ICEPAC) Prediction Program Technical Manual
12
Temperate Es - Characterized by a pronounced maximum during the summer
solstices (June-July in the Northern Hemisphere and December-January in the
Southern Hemisphere). A seasonal minimum occurs during the vernal equinox;
this minimum changes abruptly at 60o geomagnetic latitude. The diurnal pattern
exhibits peaks during mid-morning hours and near sunset. It is primarily
observed during the daylight hours and shows a complicated dependence on the
sunspot cycle.
Equatorial Es - A regular daytime occurrence without seasonal dependence.
It is highly transparent (partly reflecting) and reaches high ( ≈ 50 MHz)
frequencies. Values of foEs around 10 MHz are regularly observed by ionosondes
near the geomagnetic dip equator. The reflection properties depend on the
direction of propagation; higher reflection coefficients are to be expected for
north-south paths.
2.4.2 PREDICTIONS
Numerical coefficients are available for each month representing the
median and decile values of foEs in terms of a modified magnetic-dip angle and
longitude, and universal time (Leftin et al., 1968). These numerical maps are
from data taken during periods of solar activity minimum (1954) and solar
activity maximum (1958). Linear interpolation is used for other levels of
solar activity. Unless other information is available, the virtual height of
the sporadic-E layer is assumed to be 110 km.
2.5 ELECTRON DENSITY PROFILE MODEL
Frequency versus virtual height traces of the ordinary wave as available
on vertical incidence ionograms can be converted into electron density profiles
by a standard reduction program. These profiles, including geographic,
diurnal, seasonal, and solar cycle variations, are generated between heights of
70 km and the height of maximum of the F2 layer, hmF2. The electron density is
given by the relationship
N = 1.24 x 10¹⁰ fN2 (4)
N = electrons per cubic meter
fN = plasma frequency MHz
A fixed reflection height for the E and F2 layers was used in the
original computer program (Lucas and Haydon, 1961). Then parabolic layers for
both the E and F2 layer were used (Lucas and Haydon, 1966; Barghausen et al.,
1969). The F1 layer was added and the profile was generated by taking the
maximums of these intersecting layers. The current method of profile

Ionospheric Communications Enhanced Profile Analysis & Circuit (ICEPAC) Prediction Program Technical Manual
13
generations replaces the parabolic layer structure with a Chapman layer
structure. The parabolic layer is analytically more tractable but the Chapman
layer has the advantage that a layer whose process is dominated by
electromagnetic ionization and chemical losses is closely described by the
Chapman layer. In addition, the Chapman layer decreases exponentially with
altitude above the layer peak -- this again more closely describes the
ionospheric situation. (Dudney 1983).

Ionospheric Communications Enhanced Profile Analysis & Circuit (ICEPAC) Prediction Program Technical Manual
14
3. CALCULATION OF CIRCUIT PARAMETERS FROM PATH GEOMETRY
To determine the operational parameters for an HF ionospheric radio
communication circuit, it is necessary to calculate several parameters that are
based on the geometry of the path, such as path length, path bearings, and
zenith angle of the sun.
3.1 PATH LENGTH AND BEARINGS
The first parameter to be calculated, given the geographic latitude and
longitude of the transmitting and receiving locations, is the path length,
which is taken to be the shorter of the great-circle distances between the two
points, and which is computed as follows:
cos d = sin x1 sin x2 + cos x1 cos x2 cos(y1 - y2), (3.1)
where
x1 = geographic latitude of transmitter,
y1 = geographic longitude of transmitter,
x2 = geographic latitude of receiver,
y2 = geographic longitude of receiver,
d = path length in radians.
Having obtained the path length, we calculate the bearing of transmitter
to receiver and receiver to transmitter along the great circle path:
cos b1 = (sin x2 - sin x1 cos d)/ (cos x1 sin d) (3.2)
cos b2 = (sin x1 - sin x2 cos d)/ (cos x2 sin d) (3.3)
where
b1 = bearing transmitter to receiver in radians,
b2 = bearing receiver to transmitter in radians.
3.2 REFLECTION AREA COORDINATES
In the development of a profile of electron density along the path, the
ionospheric parameters at from one to five reflection areas along the path are
evaluated depending on the path length. These five areas are:
1. The midpoint of the path.
2. The E-region reflection area nearest the transmitter for the
estimated least possible number of hops.

Ionospheric Communications Enhanced Profile Analysis & Circuit (ICEPAC) Prediction Program Technical Manual
15
3. The E-region reflection area nearest the receiver for the same
number of hops.
4. The F-region reflection area nearest the transmitter for the
estimated least possible number of hops.
5. the F-region reflection area nearest the receiver for the same
number of hops.
The estimated least possible number of E-layer and F-layer hops is
determined from the following relationship to path length:
1E, 1F - 0000 km ≤ path length < 2000 km.
2E, 1F - 2000 km ≤ path length < 4000 km.
4E, 2F - 4000 km ≤ path length < 8000 km.
6E, 3F - 8000 km ≤ path length < 12,000 km.
for paths less than 2000 km, only the path midpoint is considered. This
establishes the reflection areas for determining the ionospheric
characteristics for the entire path.
To evaluate the ionospheric parameters of these five reflection areas,
their geographic coordinates and geomagnetic latitude have to be computed as
follows:
xn = 90o - arccos(cos dn sin x1 + sin dn cos x1 cos b1) (3.4)
yn = y1 - arccos((cos dn - sin xn sin x1)/(cos xn cos x1)) (3.5)
gn = 90o - arccos(sin 78.5o sin xn + cos 78.5
o cos xn cos
(yn - 69.0o)), (3.6)
where
dn = angular distance of reflection area from
transmitter,
xn = geographic latitude of reflection area,
yn = geographic longitude of reflection area,
gn = geomagnetic latitude of reflection area.

Ionospheric Communications Enhanced Profile Analysis & Circuit (ICEPAC) Prediction Program Technical Manual
16
The modified magnetic dip latitude is required at each control point for
the evaluation of the ionospheric parameters. The magnetic dip is calculated
from the 1963 Jensen and Cain model of the earth's magnetic field. (Jensen,
D.C. and Cain, T.C.- 1962) The corrected geomagnetic latitude and longitude is
required to define the location and structure of the polar ionosphere.
Computation of the corrected geomagnetic coordinates begins by starting
in the equatorial plane at the same point with a dipole field line and a
spherical analysis field line, and then calculating the distance between the
"landing points" of the two field lines on the earth. In its simplest form,
the method consists of labeling the spherical analysis field lines (sometimes
called the real field lines) with the coordinates of the coincident equatorial,
dipolar field lines. That is, the spherical analysis field has numerous
irregularities due to regional anomalies and so it is difficult to assign a
meaningful symmetric grid pattern to such a system. However, superimposing the
symmetric dipolar grid system on the "realistic" spherical analysis produces a
useful coordinate system for modeling purposes.
3.3 SUN'S ZENITH ANGLE
For the first three reflection areas, the zenith angle of the sun is
needed for each hour of the day, to be used later in calculating the absorption
factor, and is computed from the following equation:
cos χ = sin xn sin sx + cos xn cos sx cos(sy - yn), (3.7)
where
tg = universal time,
sy = 15 tg - 180 = subsolar longitude,
sx = subsolar latitude for the middle of the month,
χ = sun's zenith angle.
3.4 TYPES OF PATHS CONSIDERED
Up to six ray paths are evaluated for each hour and each designated
frequency. These ray paths are interpolated from the reflectrix table for the
frequency with the distance calculated using a corrected version of Martyn's
Theorem for the equivalence of oblique and vertical heights of reflectivity.

Ionospheric Communications Enhanced Profile Analysis & Circuit (ICEPAC) Prediction Program Technical Manual
17
3.5 IONOSPHERIC PARAMETERS
Once the propagation path has been located geographically, the parameters
of the ionosphere at the reflection areas along the path are needed for further
computation. These parameters are the critical frequency of the layer, height
of the maximum electron density of the layer, height of the bottom of the
layer, and semi-thickness of the layer.
3.5.1 Low and Mid Latitude Model
The critical frequency of the E layer (foE) is obtained from world maps
(Leftin, 1976) and is the median value of that parameter. The height of the
maximum foE (hmE) is set at 110 km for the low and mid latitude with the semi-
thickness (ymE) set at
(3.8)
The maximum solar zenith angle χmax for the occurrence of the F1 layer is
used as the cutoff for the prediction of the monthly median foF1. This is
necessary since the F1 layer is normally observed on vertical incidence
ionograms during daylight hours only. The χmax and critical frequency of the F1
layer (foF1) are calculated as follows (Rosich et al., 1973)
χmax = AC1 + BC1 * SSN + (AC2 + BC2 * SSN) * cos (GMDIP) (3.9)
where SSN = 12 month smoothed mean sunspot number
GMDIP = Rawer's modified magnetic dip latitude
AC1, BC2, AC2, BC2, are coefficients based on a two dimensional
representation of χmax using sunspot numbers and Rawer's modified
magnetic dip. A set of coefficients exists for each month.
When χ at the control point is greater than χmax then foF1 = 0.2
When χ at the control point is less than χmax , the following equation is used:
foF1 = A1 + B1 * SSN + (A2 + B2 * SSN) cos χ + (A3 + B3 * SSN) cos2χ (3.10)
20.0 = 5.5110
= 5.5
hmE = ymE

Ionospheric Communications Enhanced Profile Analysis & Circuit (ICEPAC) Prediction Program Technical Manual
18
where
SSN is the 12 month smooth mean sunspot number and
χ is the solar zenith angle of the sun at the control point ( χ ≤ 90.0).
A1, B1, A2, B2, A3, B3 are coefficients from the numerical representations.
(Rosich et. al. 1973). The height of the maximum ionization for the F1 layer
(hmF1) is calculated as follows:
hmF1 = 165 + 0.6428 * χ or 200 which ever is less
The semi-thickness of the foF1 layer (ymF1) is calculated as
where χ is the solar zenith angle of the sun and hmF1 is restricted to a maximum
value of 200 km.
The critical frequency of the F2 layer is obtained from world maps (Jones
et al., 1966) and is the median value of that parameter. The true height of
the maximum electron density of the F layer is developed in two steps. First,
the M(3000)F2 factor is obtained from world maps, and then the true height of
the maximum ionization hmF2 in the layer is calculated on the basis of the
following relationship (Dudney, 1983):
XE = foF2/foE if XE < 1.7, XE = 1.7 (3.11)
(3.12)
4.01
hmF = ymF1
0.012 - 1.215-XE
.253 = m
∆
1 - 2 M(3000)F1.29671 + 2* M(3000)F 0.0196
M(3000)F2= F2
2

Ionospheric Communications Enhanced Profile Analysis & Circuit (ICEPAC) Prediction Program Technical Manual
19
(3.13)
(3.14)
The semi-thickness (ymF2 of the F2 layer is calculated on the basis of
coefficients that represent the ratio of the height of maximum ionization of
the F2 region to its semi-thickness ymF2. (Lucas et al., 1966).
3.5.2 Auroral Zone
The Auroral foE is made up of both solar ionization and auroral zone
precipitating particals. The maximum auroral critical frequency (foEamax) due to
precipitating particals (Vondrak et.al. 1978) is calculated by the following
equation:
foEamax = 2.5 + Qe / 9.0 0 ≤ Qe ≤ 2.7
= -1.0 + 7/5 Qe 2.7 < Qe ≤ 4.2
= 3.2 + 2/5 Qe Qe > 4.2 (3.15)
where Qe = effective geomagnetic activity index. foEamax is then adjusted for
local time magnetic variations (Maximum ionizations at 0300 magnetic local time
and minimum ionization at 1500 magnetic local time).
(3.16)
where TCGM = time corrected geomagnetic time.
A linear interpolation is done between the oval boundaries and the point
of maximum ionization in the oval. The FoEa values of the polarized and
equatorial boundaries of the auroral zone are set at 60% of the foEamax. The
model uses linear interpolation to get values between the equatorial or
176 - M + M(3000)F2
1490F = hmF2
∆
15 > TCGM 1) - (foEa 12TCGM)-(27
- foEa = foEa
15 TCGM 1)-(foEa 12
3)-(TCGM - foEa = foEa
maxmax
maxmax ≤

Ionospheric Communications Enhanced Profile Analysis & Circuit (ICEPAC) Prediction Program Technical Manual
20
polarized auroral boundaries and the geomagnetic latitude of the foEamax. FoEa,
the interpolated value, is the auroral value of foE when no solar component is
present (Auroral night line, Auroral sunrise, sunset). The height of maximum
ionization for the auroral E layer is calculated as follows:
hmEa = 130.0 foEa ≤ 1.0
hmEa = 90.0 foEa ≥ 7.0
(3.17)
When there is an Auroral daytime point, the low and mid latitude value of
the foE is used.
foEs = foE obtained from world maps
hmEs = hmE from low and mid latitude = 110 km
When both solar and auroral E components are present, the following rules
are used to select the E layer critical frequency:
foE = (foEs4 + 1.5 foEa4)1/4 (hmEs - hmEa) ≤ 10.0
hmE = corresponding height (hmEa or hmEs) (hmEs - hmEa)>10.0
Auroral foF1
The auroral zone night time value of the F1 layer are set as follows:
foF1 = 0.2 MHz
hmF1 = 200.0 km
ymF1 = hmF1/4.0
The low and mid latitude values are used otherwise.
7.0 < foEa < 1.0 90.0) - (130.01.0 - 7.0
1 - foEa - 130.0 = hmEa

Ionospheric Communications Enhanced Profile Analysis & Circuit (ICEPAC) Prediction Program Technical Manual
21
Auroral foF2 is calculated from the following equations (Tascione et.al.
1988)
(3.18)
λm = corrected geomagnetic latitude of interest
Φp = polward boundary of the oval
Φa = equatorward boundary of the oval
Φm = middle of the auroral oval
X1 = 2 * X1 if λm > φm
HmF2 for the auroral oval is calculated the same as the low and mid
latitude value.
3.5.3 Polar Cap
The polar E layer has a default set of parameters as follows:
foE = 0.6 Mhz
HmE = 120.0 km
ymE = 120.0/5.5 = 22 km
The polar F1 layer has a default set of parameters as follows:
foF1 = 0.2 Mhz
fmF1 = 200.00 km
ymF1 = 200.0/4.0 = 50.0 km
oval auroral the of widthentire = a) - pwhere(
a) - p(m) - a(
= X1
e = N
tscoefficien theby evaluated foF2 = foF2c where
N 9.0 + 2foF = foF2a
2x-
2c
21
φφ
φφλφ
∆
∆

Ionospheric Communications Enhanced Profile Analysis & Circuit (ICEPAC) Prediction Program Technical Manual
22
The polar F2 layer is calculated with the same formulas as the auroral
zone.
3.5.4 Sub Auroral Trough
foF2 = foF2c
foF2 = (1 + ∆N)
where foF2c is the foF2 from coefficients and where ∆N is the depletion
region adjustment factor which is a function of both magnetic local time and
geomagnetic activity. The following definition of ∆N is based upon Miller and
Gibbs (1975):
where D is the Julian day and T is a complicated weighting factor dependent on
local geomagnetic time, magnetic activity, and solar zenith angle.
T = T1 exp ([χ1 - χ12] / 2.0) exp [-1.0 TPC2 / 12.0]
where
χ1 = (λm - ΦA) / (3.7 + 1.3 KPeff
TPC = abs (TCGM - 3.0)
and
T1 = 0.0 χ ≤ 90 or 6.0 < TCGM < 18.0
T1 = -0.2 χ > 94.6 and 18.0 ≤ TCGM ≤ 6.0
T1 = [-0.2(χ - 90)] / 4.6
90 ≤ χ ≤ 94.6 and 18.0 ≤ TCGM ≤ 6.0
In the above expressions, χ is the solar zenith angle, TCGM is the local
geomagnetic time, λm is the corrected geomagnetic latitude of the point being
considered, and φA is the geomagnetic latitude of the equatorward auroral
boundary, Kpeff is the effective Kp geomagnetic index.
The trough height values are calculated as follows. The low and mid
latitude calculations are made at 4 points, centered on 0300 magnetic local
time and the trough maximum. Calculation of hmF2 for the subauroral trough is
5])11.0)/182. + (D[ + T(1.0 = N πcos∆

Ionospheric Communications Enhanced Profile Analysis & Circuit (ICEPAC) Prediction Program Technical Manual
23
made for each point on the following grid:
Equatorial ������������������������������������ Trough polward
boundary of the� � � boundary
auroral zone � � �
� � �
������������������������������������ Trough maximum
� � �
� � �
� � � Trough equatorial
������������������������������������ boundary
2000 MLT 0300 MLT 0700 MLT
At the trough maximum and 0300 magnetic local time (0300 MLT), the maximum
height of the trough is set at 450 km. The value of hmF2 is calculated by
interpolation in the above grid.
3.6 ELECTRON DENSITY PROFILE
For the generation of the electron density profile a single set of
critical frequencies and associated parameters are chosen. Depending on the
path length, a process of elimination is used to reduce up to 5 control points
to 1 to 3 control points that best represent the ionosphere for that particular
communications circuit. The ionospheric parameters (foE, hmE, ymE, foF1,
hmF1.....etc) are then used to build an electron density profile at the control
points based on the Chapman layer structure at the critical frequency and
below, with exponential extensions on the topsides of the layers.
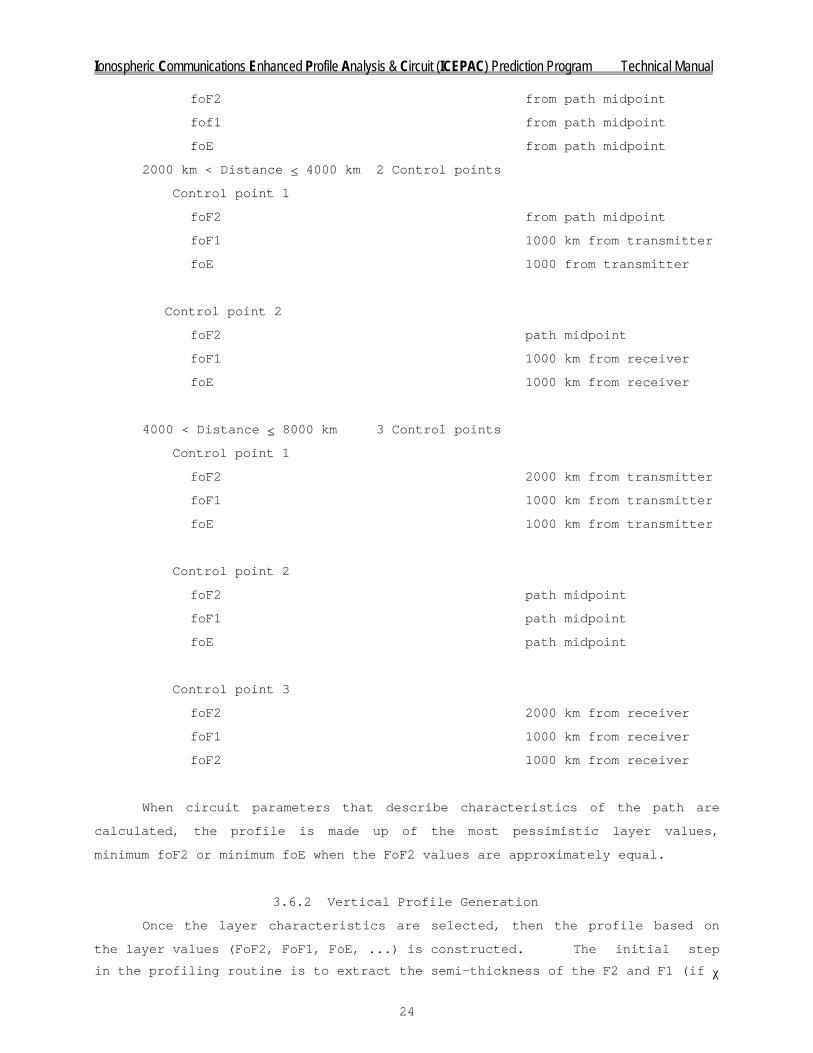
3.6.1 Control Point Selection
For each communication circuit, up to five geographic points are
calculated along the circuit path. From these geographic locations, up to 3
control points are selected with ionospheric parameters assigned to each. When
the ionospheric profile is generated, the layer parameters are selected from
the values at the three control points.
Distance ≤ 2000 km 1 Control point
Ionospheric Communications Enhanced Profile Analysis & Circuit (ICEPAC) Prediction Program Technical Manual
24
foF2 from path midpoint
fof1 from path midpoint
foE from path midpoint
2000 km < Distance ≤ 4000 km 2 Control points
Control point 1
foF2 from path midpoint
foF1 1000 km from transmitter
foE 1000 from transmitter
Control point 2
foF2 path midpoint
foF1 1000 km from receiver
foE 1000 km from receiver
4000 < Distance ≤ 8000 km 3 Control points
Control point 1
foF2 2000 km from transmitter
foF1 1000 km from transmitter
foE 1000 km from transmitter
Control point 2
foF2 path midpoint
foF1 path midpoint
foE path midpoint
Control point 3
foF2 2000 km from receiver
foF1 1000 km from receiver
foF2 1000 km from receiver
When circuit parameters that describe characteristics of the path are
calculated, the profile is made up of the most pessimistic layer values,
minimum foF2 or minimum foE when the FoF2 values are approximately equal.
3.6.2 Vertical Profile Generation
Once the layer characteristics are selected, then the profile based on
the layer values (FoF2, FoF1, FoE, ...) is constructed. The initial step
in the profiling routine is to extract the semi-thickness of the F2 and F1 (if χ

Ionospheric Communications Enhanced Profile Analysis & Circuit (ICEPAC) Prediction Program Technical Manual
25
≤ 105o) regions from the E-R model. The semi-thickness (ST) are then
normalized by use of the empirical Wrobel function (Damon and Hartranft, 1970)
as follows:
ST (F2) = ST (E-R)*W (hmF2ICED)/W (hmF2E-R)
ST (F1) = ST (E-R)*W (hmF1ICED)/W (hmF2E-R)
where
W(h) = 1n(h)/0.02186 - 203.447
is the expression for the Wrobel scale height and the subscripts indicate the
source of the height of the maximum density value (E-R = Elkins-Rush 1973).
The profile is then constructed in the following manner:
(1) At and above the F2 layer peak, we closely follow the Elkins-Rush
model with the exception of the modified F-region semi-thickness, and a
modified top-side scale height using DMSP in-situ ion-electron measurements (if
available).
(2) At and below the E layer peak, a Chapman layer with scale height of
16 km is used unless the F1 layer contribution at the E layer peak height
exceeds the E layer density computed from either solar or particle ionizations.
In this case, the E layer is disregarded and the F1 layer is extended
downward.
(3) Between the F2 layer peak and the E layer height of maximum electron
density, the modeling depends on whether or not the F1 layer is present.
(a) In the absence of the F1 layers, the electron density at any height
is the sum of the density contributions from the E and F2 layers.
(b) When the sun is visible at F1 layer heights, the intermediate region
is modeled by subtracting the F1 layer contribution at E and F2 layer heights
from the maximum densities produced by the model for these two layers
independently. The reduced E and F2 layer maximum densities are then used in
the Chapman function representing each layer. Finally, the total electron
density at any level is the sum of the density contributions from the F1 layer
and the modified E and F2 layers. In this procedure, the Chapman scale height
of the F2 layer is decreased, if necessary, to insure that the F1 layer peak
falls at least two (F2) scale heights below the F2 peak. The above technique,

Ionospheric Communications Enhanced Profile Analysis & Circuit (ICEPAC) Prediction Program Technical Manual
26
then allows the F2 and E layer peak densities to be modeled exactly and
generally results in an F1 density within 5 percent of the target value.
3.7 VIRTUAL HEIGHT RAY PATH AND AREA COVERAGE
MODEL FOR SINGLE HOP PROPAGATION
This section describes a simple computation method for obtaining all the
single-hop ray paths through an ionosphere described by an electron density
profile. It uses the classical relationships between the virtual-height
ionograms and the oblique path (however, Martyn's equivalence theorem is used
in a "corrected" form as described in Section 3.7.4). First, the ionogram is
obtained using numerical integration techniques. Then reflectrices are
obtained as single table entering all ray-path information. Finally, the
correction to Martyn's theorem and a table look up and interpolation procedure
are used to find the ray sets which describe the propagation for a particular
operating frequency.
3.7.1 Virtual Height Ionograms
Virtual heights for the ordinary trace are found from the electron density
profile by numerically integrating the equation.
(3.19)
fv is a selected vertical sounding frequency;
ho is the lowest true height of the profile, i.e., 70 km;
h' is the virtual height of the profile;
hr is the true height corresponding to fv;
h is the true height of reflection;
µ' is the group index of refraction;
′
′∫′
f
(h)f - 1 = )f (h,
where
dh )f (h, l + h = )f(h
2v
2N
1/2-
v
vhh0v
r
0
µ
µ

Ionospheric Communications Enhanced Profile Analysis & Circuit (ICEPAC) Prediction Program Technical Manual
27
fN is the plasma frequency.
The area is found using a Gaussian integration technique (see Figure 1). The
effect of the cusp at hr can be lessened by using a nonlinear transformation
from
the interval [ho, hr], to [-1, 1]. The transformation and integration equations
are:
hj = true height corresponding to (wj, Xj);
Xj = Gaussian abscissa;
wj = Gaussian weight;
N = number of Gaussian terms (at least 40) for electron density profiles
described in Section 3.6.2.
A forty-point Gaussian integration was found to be adequate when the
electron density profile was sampled at true height intervals of 4 km and the
vertical sounding frequencies were selected at intervals of 0.2 MHz.
3.7.2 Skywave Propagation
Skywave radio propagation paths may be described by a set of parameters
known as raysets (Croft, 1967). For most HF communication applications, this
consists of operating frequency, takeoff angle, virtual height of reflection,
true height of reflection, and ground distance. The basic inputs are true and
virtual heights as a function of critical-incidence frequency.
The ray paths are calculated using the following simplifying assumptions:
1. Horizontal and azimuthal variations in the ionospheric electron
density profiles are negligible for each hop (on a multi-hop path,
different sample area are used).
2. The magnetic field may be ignored.
3. The ionosphere is spherically symmetrical to the earth.
With these simplifications, the equivalence between a given frequency on
an oblique path (fob) and a vertical incidence frequency (fv) with same vertical
height specified by Snell's law is
fob = fv secθt (3.20)

Ionospheric Communications Enhanced Profile Analysis & Circuit (ICEPAC) Prediction Program Technical Manual
28
where
θt is the angle between the apparent ray path and the normal to the earth
at the true height of reflection.
By simple geometry, the virtual height of the oblique path is related to
the takeoff angle ∆ by (see Figure 2).
a cos ∆ = (a + h'ob) sin Φ (3.21)
where
∆ = takeoff angle of the ray,
a = earth's radius,
h'ob = virtual height of the oblique path,
Φ = is the angle between the virtual ray and the normal to the earth
at h'ob.
Martyn's theorem for a plane ionosphere specified the ray path by the
equality of the virtual height of the oblique path, with the virtual height of
the ionogram at the equivalent frequency fv. For a curved ionosphere, this
leads to a consistent error at higher frequencies for thicker layers. The
Breit and Tuve theorem states that the time taken to transverse the actual path
is the same as that which would be taken to transverse the equivalent path in
free space. Both theorems are corrected in the following model by an
empirically derived correction factor which depends only on the electron
density profile and the curvature of the ionosphere:
(3.22)
where
foF2 is the F2 critical frequency,
h'v is the virtual height corresponding to fv,
h is the true height of reflection.
This correction has errors of less than one percent as compared with the
distances calculated by a ray-trace program based on Haselgrove's equation
method (Haselgrove, 1954; Finney, 1963). This is described in more detail in
′′′′
ah-hh)+2(a +
ah-hh 2
foF
f-f + h = h v
2v2
2v
2ob
vbo

Ionospheric Communications Enhanced Profile Analysis & Circuit (ICEPAC) Prediction Program Technical Manual
29
the following section.
The model uses equations 3.20 and 3.21 to generate Table 1. The first
row is the vertical-incidence frequency in megahertz. The second row is the
true height of reflection, h; the third row is the virtual height of
reflection, h'; and the rows following are the equivalent oblique operating
frequencies of the transmitter for ray paths with corresponding takeoff angles;
e.g., the row after 0.0 is for ray paths with a takeoff angle of Oo. When the
information contained in Table 1 is plotted in constant frequency contours of
virtual reflection height and distances as in Figure 3, the displayed contours
are called reflectrices (Lejay and Lepechinsky, 1950). At each given operating
frequency, the area coverage is found by interpolating in Table 1 for the
desired ray paths. This procedure yields the desired reflectrix for the given
frequency in the form of a table of raysets (Table 2). Calculations are not
necessary at each frequency as all the desired information is contained in
Table 1. For two-hop modes, a table of reflectrix information (as in Table 1)
is generated for the second-hop sample area, and at the given operating
frequency, a table of rayset information is generated (as in Table 2). The
two-hop modes are found by matching the takeoff angle of the second hop with
the arrival angle of the first hop. Note that there has been no mention of
individual layers (E, F1, or F2) since the electron density profile was
generated. The ionosphere is treated as a single region by the program, and
all possible mode combinations are generated. In order to keep the traditional
layer nomenclature, the ray paths are named according to where their equivalent
vertical frequencies lie (e.g., below foE); thus the modes may be E-E, F2-F2,
or E-F2 according to the label of each hop. Since the sporadic-E modes are
assumed to exist with some degree of probability with reflection at a constant
height, the rayset information is the same for each operating frequency and
there is no need to generate the equivalent of Table 1 for the Es mode.


Ionospheric Communications Enhanced Profile Analysis & Circuit (ICEPAC) Prediction Program Technical Manual
31
Table 1 Showing the Relationship Between Vertical Incidence Data (Ionogram)
and Oblique Propagation (Reflectrix)
IONOGRAM AND REFLECTRIX
FVERT .01 .91 1.82 2.72 2.83 2.95 3.06 3.17 3.29 3.40 3.40 3.51 3.62 3.73 3.84
HTRUE 70.0 74.2 89.0 98.0 99.0 100.0 101.3 102.9 105.0 110.0 153.8 155.0 156.7 158.5 160.4
HPRIM 70.0 83.9 103.0 114.0 114.6 116.3 119.6 124.4 132.1 175.7 328.4 241.0 231.3 226.7 226.5
ANGLES OBLIQUE FREQUENCIES kHz
0.0 68 6036 10983 15684 16257 16822 17358 17867 18325 18532 15760 16204 16630 17046 17454
.5 67 6026 10968 15665 16238 16802 17337 17847 18304 18512 15748 16192 16617 17035 17440
1.0 67 5997 10924 15608 16179 16741 17276 17784 18242 18452 15711 16154 16579 16997 17402
2.0 66 5885 10753 15385 15950 16507 17039 17542 17998 18216 15567 16007 16430 16846 17249
3.0 64 5711 10484 15034 15590 16138 16661 17160 17613 17844 15336 15772 16191 16603 17003
4.0 61 5492 10141 14582 15125 15661 16174 16666 17115 17359 15029 15459 15873 16280 16676
5.0 58 5245 9746 14057 14585 15106 15608 16089 16532 16791 14661 15083 15491 15892 16283
6.0 55 4984 9321 13487 13998 14504 14991 15461 15897 16168 14246 14660 15060 15454 15839
8.0 49 4466 8452 12305 12779 13249 13706 14148 14565 14856 13335 13729 14111 14489 14858
10.0 44 3991 7030 11167 11604 12039 12461 12875 13268 13567 12391 12762 13125 13483 13825

Ionospheric Communications Enhanced Profile Analysis & Circuit (ICEPAC) Prediction Program Technical Manual
32
12.0 39 3578 6895 10136 10538 10937 11328 11712 12081 12378 11478 11826 12168 12506 12840
14.0 35 3227 6257 9230 9599 9966 10327 10683 11028 11319 10626 10955 11276 11595 11909
16.0 32 2930 5709 8444 8784 9123 9457 9787 10107 10390 9855 10164 10465 10765 11061
18.0 29 2679 5239 7765 8079 8393 8703 9010 9310 9580 9166 9453 9736 10018 10297
20.0 27 2465 4835 7179 7471 7762 8051 8338 8619 8876 8562 8821 9088 9353 9616
22.0 25 2283 4488 6672 6944 7216 7486 7754 8018 8263 8006 8260 8511 8761 9010
24.0 23 2126 4186 6231 6486 6741 6994 7246 7494 7728 7523 7762 7999 8236 8471
26.0 21 1989 3924 5846 6086 6326 6564 6801 7036 7258 7093 7320 7545 7769 7992
28.0 20 1871 3694 5508 5734 5961 6186 6410 6633 6845 6711 6926 7140 7353 7565
30.0 19 1766 3492 5210 5424 5639 5852 6065 6276 6480 6370 6574 6778 6981 7183
32.0 18 1675 3314 4945 5150 5354 5557 5759 5961 6155 6065 6260 6454 6648 6842
34.0 17 1593 3155 4710 4905 5100 5294 5487 5679 5866 5791 5978 6164 6350 6535
36.0 16 1521 3013 4501 4687 4873 5058 5244 5428 5607 5545 5724 5903 6081 6259
38.0 15 1456 2886 4313 4491 4670 4848 5025 5202 5375 5323 5495 5667 5839 6010
40.0 15 1398 2772 4143 4315 4487 4658 4829 4999 5166 5123 5289 5454 5619 5784

Ionospheric Communications Enhanced Profile Analysis & Circuit (ICEPAC) Prediction Program Technical Manual
33
42.0 14 1346 2670 3991 4157 4322 4487 4652 4816 4978 4941 5101 5261 5421 5580
44.0 14 1298 2577 3853 4013 4173 4333 4492 4651 4608 4777 4932 5086 5241 5395
46.0 13 1256 2493 3729 3884 4038 4193 4347 4501 4653 4627 4777 4926 5077 5227
48.0 13 1217 2417 3616 3766 3916 4066 4216 4365 4513 4491 4637 4783 4928 5074
50.0 12 1182 2348 3513 3659 3805 3951 4096 4242 4386 4367 4509 4651 4793 4934
52.0 12 1151 2286 3420 3562 3704 3846 3988 4130 4270 4255 4393 4531 4669 4807
54.0 12 1122 2229 3335 3474 3613 3751 3889 4028 4165 4152 4287 4422 4557 4692
56.0 12 1095 2177 3258 3394 3529 3665 3800 3935 4069 4058 4190 4322 4454 4586
58.0 11 1072 2130 3188 3321 3453 3586 3718 3851 3982 3973 4103 4232 4361 4490
60.0 11 1050 2088 3125 3255 3385 3515 3644 3774 3908 3696 4023 4150 4276 4403
65.0 11 1005 1998 2991 3115 3240 3364 3489 3613 3737 3733 3854 3976 4098 4219
70.0 10 970 1929 2888 3009 3129 3249 3359 3489 3609 3607 3725 3842 3960 4078
75.0 10 944 1878 2812 2930 3047 3164 3281 3398 3515 3514 3629 3743 3858 3973
80.0 10 927 1843 2760 2875 2990 3105 3220 3335 3450 3450 3562 3675 3788 3900
85.0 10 916 1823 2730 2843 2957 3071 3184 3298 3412 3412 3524 3635 3746 3858
90.0 10 9l3 l8l6 2720 2833 2946 3059 3173 3286 3399 3400 3511 3622 3733 3844


Ionospheric Communications Enhanced Profile Analysis & Circuit (ICEPAC) Prediction Program Technical Manual
35
Table 2. Rayset Table for 10 MHz. Great-Circle Distance (km),
Vertical Angle (Degrees), Virtual and True Reflection
Heights (km), Propagation Mode, and Equivalent Vertical
Incidence Frequency (fv in MHz)
RAYSET FOR FREQUENCY =10.00 MHz
DISTANCE ANGLE VIRTUAL TRUE MODE FV
2240.69 0.00 99.81 86.03 E 1.64
2132.85 .50 99.85 86.07 E 1.64
2031.62 1.00 100.03 86,19 E 1.65
1848.52 2.00 100.66 86.68 E 1.68
1689.82 3.00 101.70 87.46 E 1.73
1553.09 4.00 103.08 88.51 E 1.79
1431.40 5.00 104.33 89.49 E 1.87
1323.49 6.00 105.49 90.43 E 1.96
1147.44 8.00 108.15 92.59 E 2.18
1012.11 10.00 111.13 95.02 E 2.42
906.11 12.00 114.34 97.62 E 2.68
819.51 14.00 117.39 100.15 E 2.96
1024.54 16.93 181.35 109.96 E 3.40
1817.87 16.93 359.68 153.64 1 3.40
1213.47 18.00 234.01 158.34 1 3.73
1121.66 20.00 237.04 163.87 1 4.01
1194.88 22.00 280.89 174.09 1 4.31
1496.14 22.52 374.11 182.41 1 4.40
2184.89 22.52 595.08 210.45 2 4.40
1349.37 24.00 354.18 215.75 2 4.68
1209.20 26.00 340.38 221.60 2 4.96
1133.73 28.00 343.83 228.35 2 5.23
1094.45 30.00 358.10 236.32 2 5.50
1084.19 32.00 383.12 246.06 2 5.77
1127.25 34.00 432.03 259.43 2 6.05
1942.44 35.70 874.76 290.49 2 6.30

Ionospheric Communications Enhanced Profile Analysis & Circuit (ICEPAC) Prediction Program Technical Manual
36
3.7.3 Corrected Martyn's Theorem
The model derives the rays as described above in the following manner:
first the virtual height of reflections are derived by numerical integration (40
point Gaussian quadrature)
(3.23)
hr is the true height of reflection and µ'(fv , h) is the group index of
refraction.
For each radiation (takeoff) angle ∆, Snell's law is used to find the
oblique frequency corresponding to fv, the vertical sounding frequency:
fob = fv sec Φ
sin Φ = cos ∆ / (1 + h'/a).
Then the distance is found using Martyn's theorem for equivalence of oblique
and vertical heights of reflectivity (first source of error as it is valid only
for a "flat" ionosphere). See figure 2.
D = 2a (π - ∆ - Φ')
where
sin Φ' = cos ∆ / (1 + h'/a)
h' is the virtual height corresponding to hr as derived above.
Finally the group path is found using the law of Breit and Tuve (second
source of error as it is valid only for a "flat" ionosphere):
P' = 2a cos (Φ'+ ∆)/ sin Φ'.
To compensate for the above errors, the following correction was used.
dh h) ,f( = )f( h vh0v
r µ′∫′

Ionospheric Communications Enhanced Profile Analysis & Circuit (ICEPAC) Prediction Program Technical Manual
37
(3.24)
f = f withf
f - 1 =
where
ah - h h)+2(a +
ah - h h )(
f
f + h = h
vN2ob
2n2
r
v2
v2r
c
ob
2
vbo
µ
µ
′′′′

Ionospheric Communications Enhanced Profile Analysis & Circuit (ICEPAC) Prediction Program Technical Manual
38
3.8 PROBABILITY OF SKY-WAVE PROPAGATION
Since the MUF calculated is based upon median values of the ionospheric
characteristics, the probability of a sky-wave path for this frequency is assumed
to be 50 percent. The frequency that would have a 90 percent probability of
propagating (FOT) and the frequency which has 10 percent probability (HPF) are
obtained by multiplying the MUF by the factors given in table 3.
The values in table 3 were derived from a study (R.M. Davis and N.L. Groome,
1964, private communication) of the distribution of daily values of MUF about
their monthly median. The data used in this study were values of the standard
MUF, which is the product of the foF2 and M(3000)F2 factors scaled from vertical
incidence ionograms. Data from 13 stations located at geomagnetic latitudes from
71oS to 88oN were analyzed. The temporal variations of the MUF distribution were
determined by considering observations at all hours of the day, each month of the
year, and periods representing low, medium, and high solar activity. Values were
derived for the ratios of upper and lower decile MUFs to median MUF for a given
season, a given solar activity, 4-hour local time blocks, and each 10o of
geographic latitude from 10o to 80o, north or south.
The values in table 3 reflect some general trends. The MUF distribution is
wider at night than during the day, and wider at low latitudes than high latitudes
in daytime. Also, in daytime, the distribution is wider in summer than winter,
except at high latitudes where the reverse is true. Dependence on solar activity
is weak, but during daytime hours the difference between the decile ratios
generally seems to increase with solar activity at latitudes above 40o. The study
by Davis and Groome (1964, private communication) indicates that the distribution
is mostly dependent on foF2, not on the M(3000)F2 factor; therefore, the
distributions are assumed valid for any oblique path.

Ionospheric Communications Enhanced Profile Analysis & Circuit (ICEPAC) Prediction Program Technical Manual
39
TABLE 3. FACTORS FOR CALCULATING FOT AND HPF FROM MUF LOCAL TIME
N. Hemisphere (Nov., Dec., Jan., Feb.)
Winter
{ S. Hemisphere (May, June, July, Aug.)
Low (0-50) Sunspot Number
���������������������������������������������������������������������������������������������
� Geo. � 22-02 � 02-06 � 06-10 � 10-14 � 14-18 � 18-22 � Geo.�
� ������������������������������������������������������������������������������� �
� Lat. � Fu Fl � Fu Fl � Fu Fl � Fu Fl � Fu Fl � Fu Fl � Lat.�
���������������������������������������������������������������������������������������������
� > 75 � 1.44 .60 � 1.34 .65 � 1.45 .69 � 1.32 .72 � 1.33 .68 � 1.40 .67 � > 75�
�65-75 � 1.37 .68 � 1.29 .71 � 1.38 .75 � 1.23 .76 � 1.24 .75 � 1.35 .70 � 65-75�
�55-65 � 1.30 .74 � 1.24 .76 � 1.27 .80 � 1.15 .80 � 1.17 .82 � 1.30 .73 � 55-65�
�45-55 � 1.25 .79 � 1.21 .78 � 1.16 .83 � 1.12 .85 � 1.12 .84 � 1.25 .76 � 45-55�
�35-45 � 1.23 .81 � 1.20 .79 � 1.13 .85 � 1.11 .87 � 1.11 .89 � 1.23 .77 � 35-45�
�25-35 � 1.28 .81 � 1.30 .74 � 1.15 .86 � 1.17 .82 � 1.15 .85 � 1.28 .78 � 25-35�
�15-25 � 1.34 .78 � 1.37 .67 � 1.19 .87 � 1.20 .75 � 1.24 .77 � 1.32 .79 � 15-25�
� ≤ 15 � 1.27 .71 � 1.38 .70 � 1.18 .88 � 1.15 .86 � 1.14 .87 � 1.20 .79 � ≤ 15����������������������������������������������������������������������������������������������
Medium (50-100) Sunspot Number
���������������������������������������������������������������������������������������������
� Geo. � 22-02 � 02-06 � 06-10 � 10-14 � 14-18 � 18-22 � Geo.�
� ������������������������������������������������������������������������������� �
� Lat. � Fu Fl � Fu Fl � Fu Fl � Fu Fl � Fu Fl � Fu Fl � Lat.�
���������������������������������������������������������������������������������������������
� > 75 � 1.45 .76 � 1.39 .78 � 1.44 .68 � 1.40 .67 � 1.33 .62 � 1.45 .70 � > 75�
�65-75 � 1.39 .79 � 1.31 .81 � 1.37 .74 � 1.32 .70 � 1.29 .73 � 1.41 .73 � 65-75�
�55-65 � 1.33 .82 � 1.24 .83 � 1.25 .79 � 1.21 .75 � 1.22 .80 � 1.33 .76 � 55-65�
�45-55 � 1.30 .84 � 1.19 .82 � 1.14 .83 � 1.15 .81 � 1.16 .84 � 1.29 .78 � 45-55�
�35-45 � 1.27 .83 � 1.17 .81 � 1.12 .85 � 1.14 .86 � 1.14 .86 � 1.28 .79 � 35-45�
�25-35 � 1.30 .78 � 1.31 .76 � 1.16 .85 � 1.18 .85 � 1.18 .85 � 1.32 .78 � 25-35�
�15-25 � 1.33 .74 � 1.38 .71 � 1.17 .85 � 1.22 .83 � 1.26 .82 � 1.40 .76 � 15-25�
� ≤ 15 � 1.21 .77 � 1.26 .69 � 1.14 .87 � 1.13 .86 � 1.15 .85 � 1.23 .78 � ≤ 15����������������������������������������������������������������������������������������������
High (>100) Sunspot Number
���������������������������������������������������������������������������������������������
� Geo.� 22-02 � 02-06 � 06-10 � 10-14 � 14-18 � 18-22 � Geo.�
� ������������������������������������������������������������������������������� �
� Lat.� Fu Fl � Fu Fl � Fu Fl � Fu Fl � Fu Fl � Fu Fl � Lat.�
���������������������������������������������������������������������������������������������
� > 75 � 1.36 .62 � 1.27 .70 � 1.41 .74 � 1.42 .67 � 1.40 .64 � 1.43 .73 � > 75�
�65-75 � 1.31 .69 � 1.25 .74 � 1.34 .77 � 1.30 .72 � 1.16 .72 � 1.34 .78 � 65-75�
�55-65 � 1.26 .77 � 1.23 .78 � 1.24 .81 � 1.18 .80 � 1.11 .79 � 1.26 .82 � 55-65�
�45-55 � 1.19 .83 � 1.19 .80 � 1.16 .84 � 1.11 .87 � 1.09 .84 � 1.20 .86 � 45-55�
�35-45 � 1.15 .86 � 1.14 .81 � 1.13 .87 � 1.09 .90 � 1.09 .87 � 1.14 .87 � 35-45�
�25-35 � 1.22 .83 � 1.26 .76 � 1.12 .89 � 1.09 .90 � 1.11 .88 � 1.13 .86 � 25-35�
�15-25 � 1.32 .78 � 1.35 .70 � 1.12 .89 � 1.12 .89 � 1.14 .89 � 1.20 .83 � 15-25�
� ≤ 15 � 1.18 .83 � 1.25 .76 � 1.14 .89 � 1.13 .90 � 1.15 .89 � 1.20 .84 � ≤ 15����������������������������������������������������������������������������������������������

Ionospheric Communications Enhanced Profile Analysis & Circuit (ICEPAC) Prediction Program Technical Manual
40
TABLE 3. FACTORS FOR CALCULATING FOT AND HPF FROM MUF LOCAL TIME (CONT.)
Equinox (Mar., Apr., Sept., Oct.)
Low (0-50) Sunspot Number
���������������������������������������������������������������������������������������������
� Geo. � 22-02 � 02-06 � 06-10 � 10-14 � 14-18 � 18-22 � Geo.�
� ������������������������������������������������������������������������������� �
� Lat. � Fu Fl � Fu Fl � Fu Fl � Fu Fl � Fu Fl � Fu Fl � Lat.�
���������������������������������������������������������������������������������������������
� > 75 � 1.42 .67 � 1.32 .72 � 1.29 .74 � 1.26 .73 � 1.33 .80 � 1.48 .65 � > 75�
�65-75 � 1.38 .70 � 1.25 .75 � 1.25 .76 � 1.23 .74 � 1.26 .82 � 1.40 .69 � 65-75�
�55-65 � 1.32 .73 � 1.21 .78 � 1.22 .80 � 1.20 .75 � 1.20 .81 � 1.31 .73 � 55-65�
�45-55 � 1.26 .75 � 1.19 .80 � 1.20 .81 � 1.18 .76 � 1.16 .81 � 1.26 .76 � 45-55�
�35-45 � 1.22 .77 � 1.20 .81 � 1.19 .81 � 1.16 .77 � 1.16 .80 � 1.25 .78 � 35-45�
�25-35 � 1.22 .78 � 1.26 .80 � 1.18 .82 � 1.15 .78 � 1.16 .81 � 1.28 .74 � 25-35�
�15-25 � 1.30 .77 � 1.32 .75 � 1.16 .83 � 1.14 .81 � 1.18 .83 � 1.33 .69 � 15-25�
� ≤ 15 � 1.23 .76 � 1.40 .66 � 1.13 .86 � 1.13 .89 � 1.19 .86 � 1.16 .75 � ≤ 15����������������������������������������������������������������������������������������������
Medium (50-100) Sunspot Number
���������������������������������������������������������������������������������������������
� Geo. � 22-02 � 02-06 � 06-10 � 10-14 � 14-18 � 18-22 � Geo.�
� ������������������������������������������������������������������������������� �
� Lat. � Fu Fl � Fu Fl � Fu Fl � Fu Fl � Fu Fl � Fu Fl � Lat.�
���������������������������������������������������������������������������������������������
� > 75 � 1.45 .64 � 1.31 .61 � 1.27 .73 � 1.28 .74 � 1.30 .74 � 1.47 .67 � > 75�
�65-75 � 1.41 .68 � 1.22 .71 � 1.23 .77 � 1.26 .74 � 1.26 .78 � 1.38 .70 � 65-75�
�55-65 � 1.35 .70 � 1.17 .75 � 1.20 .80 � 1.23 .72 � 1.18 .78 � 1.29 .73 � 55-65�
�45-55 � 1.28 .73 � 1.15 .77 � 1.17 .81 � 1.21 .74 � 1.13 .76 � 1.20 .75 � 45-55�
�35-45 � 1.22 .75 � 1.16 .78 � 1.16 .82 � 1.18 .78 � 1.12 .76 � 1.17 .76 � 35-45�
�25-35 � 1.22 .77 � 1.22 .76 � 1.15 .82 � 1.17 .83 � 1.14 .78 � 1.23 .72 � 25-35�
�15-25 � 1.32 .75 � 1.30 .73 � 1.13 .84 � 1.15 .87 � 1.17 .81 � 1.37 .69 � 15-25�
� ≤ 15 � 1.18 .79 � 1.39 .68 � 1.11 .86 � 1.13 .89 � 1.20 .84 � 1.23 .80 � ≤ 15����������������������������������������������������������������������������������������������
High (>100) Sunspot Number
���������������������������������������������������������������������������������������������
� Geo. � 22-02 � 02-06 � 06-10 � 10-14 � 14-18 � 18-22 � Geo.�
� ������������������������������������������������������������������������������� �
� Lat. � Fu Fl � Fu Fl � Fu Fl � Fu Fl � Fu Fl � Fu Fl � Lat.�
���������������������������������������������������������������������������������������������
� > 75 � 1.46 .66 � 1.37 .67 � 1.35 .75 � 1.40 .66 � 1.38 .70 � 1.46 .72 � > 75�
�65-75 � 1.42 .67 � 1.31 .71 � 1.30 .73 � 1.31 .70 � 1.33 .70 � 1.37 .72 � 65-75�
�55-65 � 1.30 .69 � 1.25 .75 � 1.27 .71 � 1.24 .71 � 1.25 .71 � 1.24 .72 � 55-65�
�45-55 � 1.18 .73 � 1.20 .78 � 1.25 .70 � 1.20 .72 � 1.16 .74 � 1.17 .73 � 45-55�
�35-45 � 1.15 .79 � 1.16 .82 � 1.17 .75 � 1.16 .78 � 1.12 .80 � 1.14 .82 � 35-45�
�25-35 � 1.25 .81 � 1.18 .82 � 1.10 .87 � 1.10 .87 � 1.11 .87 � 1.15 .86 � 25-35�
�15-25 � 1.31 .81 � 1.32 .77 � 1.11 .89 � 1.11 .92 � 1.12 .90 � 1.20 .85 � 15-25�
� ≤ 15 � 1.21 .80 � 1.23 .79 � 1.09 .86 � 1.20 .90 � 1.14 .90 � 1.23 .82 � ≤ 15����������������������������������������������������������������������������������������������
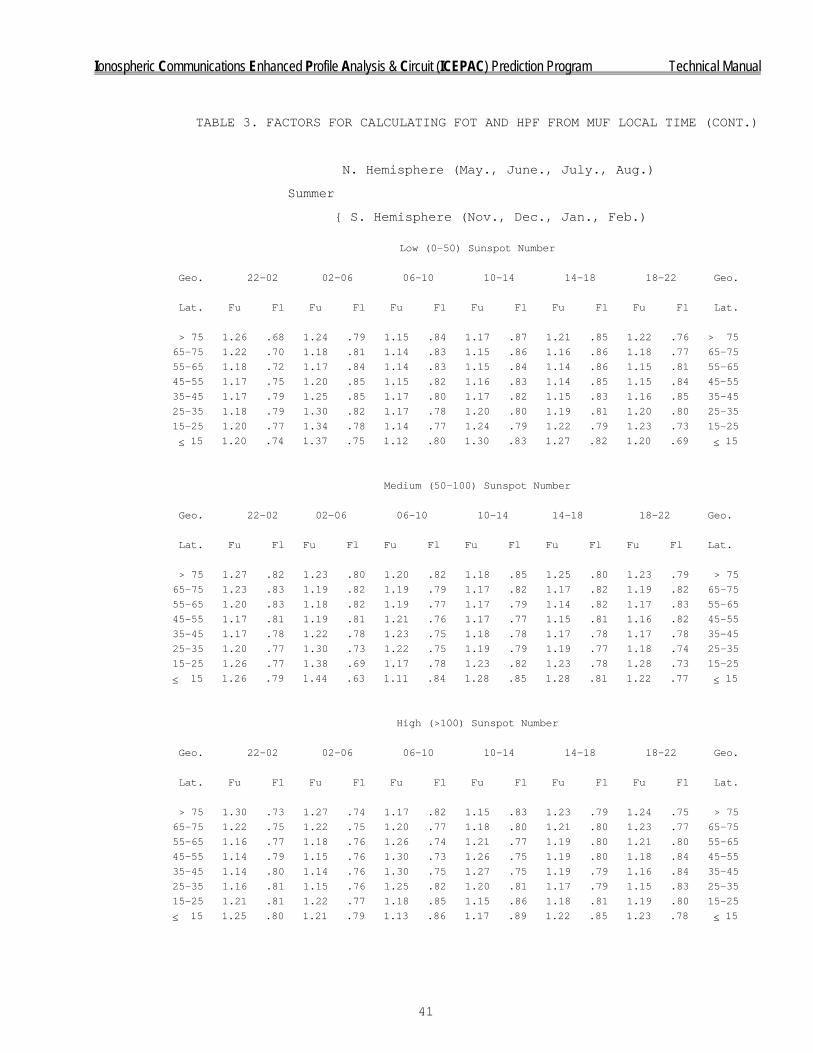
Ionospheric Communications Enhanced Profile Analysis & Circuit (ICEPAC) Prediction Program Technical Manual
41
TABLE 3. FACTORS FOR CALCULATING FOT AND HPF FROM MUF LOCAL TIME (CONT.)
N. Hemisphere (May., June., July., Aug.)
Summer
{ S. Hemisphere (Nov., Dec., Jan., Feb.)
Low (0-50) Sunspot Number
����������������������������������������������������������������������������������������������
� Geo. � 22-02 � 02-06 � 06-10 � 10-14 � 14-18 � 18-22 � Geo. �
� ������������������������������������������������������������������������������� �
� Lat. � Fu Fl � Fu Fl � Fu Fl � Fu Fl � Fu Fl � Fu Fl � Lat. �
����������������������������������������������������������������������������������������������
� > 75 � 1.26 .68 � 1.24 .79 � 1.15 .84 � 1.17 .87 � 1.21 .85 � 1.22 .76 � > 75 �
�65-75 � 1.22 .70 � 1.18 .81 � 1.14 .83 � 1.15 .86 � 1.16 .86 � 1.18 .77 � 65-75 �
�55-65 � 1.18 .72 � 1.17 .84 � 1.14 .83 � 1.15 .84 � 1.14 .86 � 1.15 .81 � 55-65 �
�45-55 � 1.17 .75 � 1.20 .85 � 1.15 .82 � 1.16 .83 � 1.14 .85 � 1.15 .84 � 45-55 �
�35-45 � 1.17 .79 � 1.25 .85 � 1.17 .80 � 1.17 .82 � 1.15 .83 � 1.16 .85 � 35-45 �
�25-35 � 1.18 .79 � 1.30 .82 � 1.17 .78 � 1.20 .80 � 1.19 .81 � 1.20 .80 � 25-35 �
�15-25 � 1.20 .77 � 1.34 .78 � 1.14 .77 � 1.24 .79 � 1.22 .79 � 1.23 .73 � 15-25 �
� ≤ 15 � 1.20 .74 � 1.37 .75 � 1.12 .80 � 1.30 .83 � 1.27 .82 � 1.20 .69 � ≤ 15 �����������������������������������������������������������������������������������������������
Medium (50-100) Sunspot Number
���������������������������������������������������������������������������������������������
� Geo. � 22-02 � 02-06 � 06-10 � 10-14 � 14-18 � 18-22 � Geo. �
� ������������������������������������������������������������������������������� �
� Lat. � Fu Fl � Fu Fl � Fu Fl � Fu Fl � Fu Fl � Fu Fl � Lat. �
���������������������������������������������������������������������������������������������
� > 75 � 1.27 .82 � 1.23 .80 � 1.20 .82 � 1.18 .85 � 1.25 .80 � 1.23 .79 � > 75�
�65-75 � 1.23 .83 � 1.19 .82 � 1.19 .79 � 1.17 .82 � 1.17 .82 � 1.19 .82 � 65-75�
�55-65 � 1.20 .83 � 1.18 .82 � 1.19 .77 � 1.17 .79 � 1.14 .82 � 1.17 .83 � 55-65�
�45-55 � 1.17 .81 � 1.19 .81 � 1.21 .76 � 1.17 .77 � 1.15 .81 � 1.16 .82 � 45-55�
�35-45 � 1.17 .78 � 1.22 .78 � 1.23 .75 � 1.18 .78 � 1.17 .78 � 1.17 .78 � 35-45�
�25-35 � 1.20 .77 � 1.30 .73 � 1.22 .75 � 1.19 .79 � 1.19 .77 � 1.18 .74 � 25-35�
�15-25 � 1.26 .77 � 1.38 .69 � 1.17 .78 � 1.23 .82 � 1.23 .78 � 1.28 .73 � 15-25�
�≤ 15 � 1.26 .79 � 1.44 .63 � 1.11 .84 � 1.28 .85 � 1.28 .81 � 1.22 .77 � ≤ 15����������������������������������������������������������������������������������������������
High (>100) Sunspot Number
����������������������������������������������������������������������������������������������
� Geo. � 22-02 � 02-06 � 06-10 � 10-14 � 14-18 � 18-22 � Geo. �
� ������������������������������������������������������������������������������� �
� Lat. � Fu Fl � Fu Fl � Fu Fl � Fu Fl � Fu Fl � Fu Fl � Lat. �
����������������������������������������������������������������������������������������������
� > 75 � 1.30 .73 � 1.27 .74 � 1.17 .82 � 1.15 .83 � 1.23 .79 � 1.24 .75 � > 75 �
�65-75 � 1.22 .75 � 1.22 .75 � 1.20 .77 � 1.18 .80 � 1.21 .80 � 1.23 .77 � 65-75 �
�55-65 � 1.16 .77 � 1.18 .76 � 1.26 .74 � 1.21 .77 � 1.19 .80 � 1.21 .80 � 55-65 �
�45-55 � 1.14 .79 � 1.15 .76 � 1.30 .73 � 1.26 .75 � 1.19 .80 � 1.18 .84 � 45-55 �
�35-45 � 1.14 .80 � 1.14 .76 � 1.30 .75 � 1.27 .75 � 1.19 .79 � 1.16 .84 � 35-45 �
�25-35 � 1.16 .81 � 1.15 .76 � 1.25 .82 � 1.20 .81 � 1.17 .79 � 1.15 .83 � 25-35 �
�15-25 � 1.21 .81 � 1.22 .77 � 1.18 .85 � 1.15 .86 � 1.18 .81 � 1.19 .80 � 15-25 �
�≤ 15 � 1.25 .80 � 1.21 .79 � 1.13 .86 � 1.17 .89 � 1.22 .85 � 1.23 .78 � ≤ 15 �����������������������������������������������������������������������������������������������

Ionospheric Communications Enhanced Profile Analysis & Circuit (ICEPAC) Prediction Program Technical Manual
42
.1 Based on the values in table 3, the probability of ionospheric support at a
given frequency is determined by evaluating the Gaussian probability distribution
function.
The standard deviation is first evaluated as follows:
where F(I,J,K) are the multiplying factors from table 3 and I,J,K are
indexs that represent latitude, low or high sunspot number, and time of day.
Then the probability that the operating frequency (F) is greater than the FOT,
MUF, or HPF for a given layer using the MUF distribution is
The E layer is stable and very predictable; therefore, if the E layer
supports propagation, it is assumed to have a probability of 0.99.
3.9 PROBABILITY OF SPORADIC-E PROPAGATION
The program contains an option for considering sporadic-E propagation in the
system performance predictions. Sporadic-E propagation is not considered when
calculating the MUF, because the median value of foEs does not represent a true
critical frequency and is used simply to estimate the probability of occurrence of
sporadic E. It is only considered when regular E-layer propagation is not
possible.
The median and upper and lower decile values of foEs are obtained from the
numerical coefficients (see sec. 2.4), and converted into values for the oblique
path by the secant law relationship. The multiplicative factor, sec Φ, is
computed as follows:
1.28K)KMUFJ,F(I, - MUF
= σ
dt d 21
= ) MUF- F
P( = )m-x
P( 2t-MUF-F
-
2
∫ ∞ σπσσ

Ionospheric Communications Enhanced Profile Analysis & Circuit (ICEPAC) Prediction Program Technical Manual
43
(3.35)
where
d/2 = half the great-circle path length in radians,
β = takeoff angle obtained from (3.17), with h' = 110 km.
The probability of sporadic-E propagation is then calculated for the
operating frequency from these median and decile values using the normal
probability function. As discussed in section 3.4, no additional loss is
determined for the partial transparency of the Es layer to radio waves.
3.10 Calculation of Mixed Modes
For path lengths equal to or greater than 3000 km, two N-type mixed modes of
propagation are considered. This type consists of one E or Es hop, with the
remainder of the propagation path via the F layer. If E-layer propagation is not
possible, the probability of Es propagation is determined and combined with the
probability of subsequent F-layer propagation. Normally, a mixed mode is not the
most reliable mode.
) - 2d
- 2
(
1 =
βπ
φcos
sec

Ionospheric Communications Enhanced Profile Analysis & Circuit (ICEPAC) Prediction Program Technical Manual
44
4. NOISE PARAMETERS
The probability of successful transmission depends on the probability that
the available signal-to-noise ratio at the receiving location is above a specified
level. This level is the one required for a specified grade of service (see sec.
7) in the presence of noise, but in the absence of any other unwanted signals.
The three major types of external noise with which the HF signal must compete are
galactic, atmospheric, and man-made. In general, these noise sources have
spectral energy distributions that vary more or less uniformly over the entire
high frequency range. All values of noise are considered representative of those
that would be expected with a short vertical lossless receiving antenna. No
allowance is made in the program to account for the directional and polarization
properties of other types of receiving antennas that could alter the available
signal-to-noise ratio.
4.1 GALACTIC NOISE
Estimates of galactic (cosmic) noise are obtained from measurements
(Spaulding and Disney (1974) CCIR Report 258-4(1982)).
The median galactic noise is represented by
Ng = 52.0 + 23 log10 (f) - 204 dBW (4.1)
where
10 log10 kTo = 204 db
k = (Boltzmann;s constant) 1.38 * 10-23 Joules/degree Kelvin
To = Reference temperature 288o K
Ng = expected median value of the galactic noise power in decibels
relative to 1 W in a 1 Hz bandwidth,
f = frequency in megahertz.
The temporal variation is estimated at ±2 dB (CCIR, 1982), and values
represent the upper limit of galactic noise. Ionospheric shielding of galactic
noise is determined by evaluating the F-layer critical frequency above the
receiving location. Directional properties of the receiving antenna are not
considered. Estimates of the uncertainty in predicting the median and deciles are
0.5 dB and 0.2 dB, respectively.

Ionospheric Communications Enhanced Profile Analysis & Circuit (ICEPAC) Prediction Program Technical Manual
45
4.2 ATMOSPHERIC NOISE
In the HF band, Na, the atmospheric noise, is the most erratic of the three
major types of noise. It is generally characterized by short pulses with random
recurrence superimposed upon a background of random noise (Spaulding and Disney
(1974)). Averaging these short pulses of noise power over several minutes yields
average values that are nearly constant during a given hour. The variations
seldom exceed ± 2 dB, except during sunrise or sunset periods and when local
thunderstorms are present. Worldwide maps published in CCIR Report 322-3,
representing the median of hourly medians of atmospheric noise at 1 MHz within 4-
hour time blocks for the four (3-month) seasons of the year, are used as the basis
for estimating this noise at any given receiving locations. Levels of atmospheric
noise for other frequencies and its associated distribution about the median are
available for each time block and season.
The maps in CCIR Report 322-3 were used to generate, by means of a least
squares fit based on Fourier analysis, numerical coefficients representing the
worldwide distribution of atmospheric noise (Spaulding and Washburn, 1985) as a
function of geographic location. The curves of frequency dependence and
variability of the radio noise were generated from a power series of least squares
fit. The numerical maps and complete listings of the numerical coefficients used
in the prediction program are given in NTIA Report 85-173 (Spaulding and
Washburn).
The numerical coefficients in latitude, longitude, and local mean time at
the receiving location give the median atmospheric noise power in decibels above k
To b, at 1 MHz for each time block and season. The value of k (Boltzmann's
constant) is 1.38 x 10 -23 Joules per degree Kelvin, the reference temperature is
288oK, 10 log10kTo = 204 dB below one joule, and b is the bandwidth in Hz. Noise
values for other frequencies and their distributions are evaluated from numerical
arrays derived from the frequency curves for each time block and season.
4.3 MAN-MADE NOISE
At certain receiving locations, unintended man-made radio noise may be the
predominant external noise with which the communication system must compete. It
may arise from any number of sources, such as power lines, industrial machinery,
ignition systems, etc., and thus have wide geographic and short-term variations.

Ionospheric Communications Enhanced Profile Analysis & Circuit (ICEPAC) Prediction Program Technical Manual
46
Information for deriving specific man-made noise levels as a function of
geographic location and time is insufficient, but from the limited observations
available, it is possible to express typical levels of unintended radiation
(JTAC, 1968).
Four models are used to designate the median level of man-made noise, all
based on the following equation:
Nm = c + d log10 f - 204 dBW (4.2)
where
Nm = man-made noise power in decibels below 1 W in a 1 Hz
bandwidth,
f = frequency in megahertz,
c,d = constants derived from measurements and given below.
Values of c,d for each of the four models, are given below.
Values of Parameters for the Man-Made Noise Models
Environmental category c d
Business (curve A) 76.8 27.7
Residential (curve B) 72.5 27.7
Rural (curve C) 67.2 27.7
Quiet rural (curve D) 53.6 28.6
Galactic noise (curve E) 52.0 23.0
Urban location is defined as one within the industrial-business area of
large cities, residential is one near a large city or within a small town, and
rural location is one well removed from all populated areas and chosen to be as
free as possible of man-made noise. The upper and lower decile values of Nm are
9.7 dB and 7.0 dB. Estimates of the uncertainty in predicting the median and
deciles are 5.4 db and 1.5 db respectively.
When the user inserts his own value of man-made noise power in decibels
below 1 watt in a 1 Hz bandwidth at 3 MHz (Nuser), the suburban noise curve is
used. In the program, the suburban curve is shifted vertically and includes the
noise value at 3 MHz specified by the user.
4.4 COMBINATION OF NOISE

Ionospheric Communications Enhanced Profile Analysis & Circuit (ICEPAC) Prediction Program Technical Manual
47
The three basic noise sources, man-made, galactic, and atmospheric noise,
are independent of each other and must be combined by a statistically accurate
method in order to represent the overall noise level at the site of interest. The
current noise distributions are considered log normal and the method used to
combine them is to determine the log normal distributions that best approximate
the true distribution of the sum. The method used is a rather complex
mathematical process. For specific information refer to an updated noise model
for use in IONCAP (Spaulding, A.D. and Stewart, F.G. (1987).
Three major changes have been made with the new noise model: The
replacement of the world wide atmospheric radio noise estimates with the current,
much improved estimates of CCIR report 322-3; the replacement of the man-made
noise estimates with the much more modern estimates of CCIR Report 258-4; and the
overall distribution and its statistical variations have been updated.

Ionospheric Communications Enhanced Profile Analysis & Circuit (ICEPAC) Prediction Program Technical Manual
48
5. IONOSPHERIC LOSS MODEL
This section describes the equations used to calculate ionospheric losses
for a single-hop mode. The model is intended to cover the frequency band from 3
to 30 MHz. All modes which result from a complete electron density profile are
covered, as well as sporadic-E modes. Lower decile, median, and upper decile
values of field strength (signal or signal-to-noise ratio) can be determined by
the methods described. The theoretical background and method of measurements are
given in the manual on Ionospheric Absorption Measurements (Rawer, 1976). The
equations described below are intended to be used on a worldwide basis, and are
limited by the available worldwide prediction data base.
The equations are based on the CCIR 252-2 (1970) loss equation using a
philosophy that modifications are made only when measured values demand a change.
The CCIR loss equation was primarily derived from F2 low-angle modes with
operating frequencies not greater than the FOT. For these conditions, there is no
need to modify the equation. For E-layer low-angle modes, two modifications were
necessary. A correction factor to account for less E-Layer bending was added
[Equation (5.8)]. Since an arbitrary electron density profile can be used, the
true height of reflection may be written into the D-layer absorbing region,
resulting in lower absorption. This has been accounted for by modifying the
collision frequency factor in the denominator [Equation (5.10)]. In addition to
the D-region losses due to absorption, there may be losses at the area of
reflection if the ionization of the region is insufficient to reflect all the
radio energy. This loss increases as frequency increases, starts to be
significant as the frequency nears the MUF, and increases rapidly above the MUF.
Since this loss is closely associated with the MUF, the day-to-day variation of
the MUF within the month can be used to estimate the day-to-day variation of these
losses within the month. This loss due to partial failure of ionospheric support
is referred to as an "over-the-MUF" loss[Equation (5.12)]. Since the basic loss
equations contain the average effect of deviative absorption, an additional loss
is only added to the high-angle modes (including those F modes on the upper side
of the E MUF (see Equation 41). Sporadic-E mode losses are determined as are the
regular E modes, but the deviative loss is zero and the over-the-MUF loss is what
is usually termed reflection loss [Equation (5.13)].

Ionospheric Communications Enhanced Profile Analysis & Circuit (ICEPAC) Prediction Program Technical Manual
49
The equations referred to provide monthly median losses when used with
monthly median parameters of the ionosphere. In order to evaluate the performance
of a communication system, the distribution of these losses within the month is
needed. These distributions have been given as tables of transmission loss
distributions (CCIR 252-2, 1970) and are uniform for operation frequency and for
mode type. For geomagnetic latitudes below 40 degrees, these tables are for
frequencies less than the FOT and are the variation of the F2 mode losses about
the CCIR 252-2 equation based on 83 circuit years of data (Laitinen and Haydon,
1950). The rest of the tables correspond to 10.0 MHz and is based on the
difference between minimum loss during the month and the distribution of losses
above this difference within the Arctic regions. These tables are used in the
following manner; the frequency that corresponds to the table of losses is
established as either the F2 FOT or as 10.0 MHZ. Then the sporadic-E obscuration
loss and the F2 over-the-MUF loss are subtracted from the table value. The
residual table values are then added to the losses at each frequency for each
mode. Auroral losses form the main part of the residual table. Decile values of
losses are determined by calculating the Es obscuration loss and the over-the-MUF
losses using the proper decile values of the Es and E, F1, or F2 mode MUFs. It
should be especially noted in this model that the over-the-MUF losses limit the
successful operation of the radio systems at the higher frequencies; i.e., the
mode is always there but the losses become sufficiently high that the system
becomes inoperative. The circuit reliability falls because of weak signal levels
in contrast to earlier prediction methods which use a concept of "fraction-of-
days" where the mode existed to limit the reliability at the higher frequencies.
both the original table and the derived values are decibel with respect to the
loss equations given here. If other loss equations are used, the distribution
tables must be adjusted. the derivation of these loss equations is given below.
5.1 FREE-SPACE BASIC TRANSMISSION LOSS
Free-space losses result from the geometrical spreading of energy as the
radio wave progresses away from the transmitter. In ionospheric propagation, the
incremental cross section of the ray bundle at the receiver depends upon the
physical properties of the ionosphere and the geometry of the propagation path.
Simplifying asumptions are made in the program so that transmission losses can be
calculated in a practical manner.

Ionospheric Communications Enhanced Profile Analysis & Circuit (ICEPAC) Prediction Program Technical Manual
50
In the simplest model of sky-wave propagation, it is assumed that the earth
and the ionosphere are both flat and that the reflection is specular (mirror-
like). For this type of propagation, the energy density diminishes as the inverse
square of the ray-path distance (Piggott, 1959). This means that for an isotropic
transmitting antenna radiating p watts of power, the power flux density at a slant
range distance D is p/(4 π D2). The total area of an isotropic receiving antenna
in free space is λ2 /(4 π), where λ is the wavelength of the radio wave.
Therefore, the total power received by the antenna is p λ2 / (4 π D)2. The basic
free-space transmission loss is the ratio between the power radiated and the power
received by a loss-free receiving antenna, and is given by:
(26)
Espressing the wavelength λ in terms of the frequency f of the electro-magnetic
wave, (26) becomes:
(27)
where f is in Megahertz and D is in kilometers.
5.2 CCIR 252-2 IONOSPHERIC LOSS
The absorption in the D-E regions of the ionosphere is usually the major
loss (after free space) in radio wave propagation via the ionosphere. To describe
this effect, Martyn's theorem relating vertical and oblique path and the quasi-
longitudinal approximation to the absorption loss (e.g., Budden, 1966) are used:
(dB) D 4
20 = )D (4 / p
p 10 = L 102210bf λ
ππλ
loglog
(db) D 20 + f 20 + 32.45 = L 1010bf loglog

Ionospheric Communications Enhanced Profile Analysis & Circuit (ICEPAC) Prediction Program Technical Manual
51
(5.1)
(5.2)
where
C = constant,
ho = height at bottom of ionosphere,
h(fv)= height of reflection for frequency fv,
N = N(h) electron density profile,
ν = ν(h) collision frequency,
µ = refractive index,
fob = oblique sounding frequency,
fv = vertical sounding frequency,
fH = gryofrequency, (fL, the longitudinal component of
gyrofrequency, is usually put into equation)
φo = angle of earth's normal to ray path at 100 km.
Equation (5.2) can be put into the form (Budden, 1966)
L(fv)= (ν/c)(h' - hp) (5.3)
where
ν = effective collision frequency
h' = virtual height of reflection,
hp = phase height of reflection,
c = velocity of light.
φ0vob )fL( = )fL( cos
)2
( + )f + f(
dh N
C = )fL(22
Hv
)fh(
hvv
0
πν
µν
∫

Ionospheric Communications Enhanced Profile Analysis & Circuit (ICEPAC) Prediction Program Technical Manual
52
Since hp is bounded and h' is not, there is a strong dependence on frequency which
cannot be explained simply by an inverse-frequency-squared law. The usual method
of analysis has been to write equation (5.2) in the form (definition of the global
absorption parameter A)
(5.4)
Most analyses of absorption are based on estimated A(fv). This has sometimes
been done by assuming non-deviative absorption only, and thereby trying to ignore
the frequency dependence. When this is done with a small data base and no
adjustment is made for the frequency dependence, the results can be misleading
(and possibly inaccurate).
The CCIR absorption equation is based upon the U.S. Army signal Radio
Propagation Agency study (Laitinen and Haydon, 1950), with a modification for
lower frequencies by Lucas and Haydon (1966).
The exponent of the frequency term (fv + fH) and values for the terms
(ν/2π)2 and A(fv) were determined by least square curve fitting. The oblique
loss measurements were normalized to virtual loss measurements to give a standard
comparison method, as well as to expand the data base, by the equation
(5.5)
The data used were for F-layer modes only. The fitted equation is
(see Figure 4).
)/2( + )f+f(
)fA( = )fL( 22
Hv
vv πν
φπν
πν022
Hob
22Lvv
ob ])/2( + )f+f[(
])/2( + )f+f)[(FL( = )fL( sec

Ionospheric Communications Enhanced Profile Analysis & Circuit (ICEPAC) Prediction Program Technical Manual
53
(5.6)
That is, the averaged value of A(fv) is
_ + 677.2I
where
I = -.04 + exp (-2.937 + 0.8445foE). (5.7)
The formula for absorption index I is in terms of foE which includes the
variation in zenith angle and solar activity. This formula is an inversion of that
formerly used to obtain foE from I. There have been attempts to modify and
replace equation (5.6) by independent researchers. Schultz and Gallet(1970) (used
in Barghausen et al., 1969) used the methods described by Piggott (1953) to
describe _ without frequency dependence (non-deviative absorption) on a smaller
data base than used to derive Equation (5.6), but did not add the frequency
dependence suggested by Piggott (1953) [essentially the same as Equation (5.3),
but for a parabolic E layer]. George (1971) has developed an absorption equation
using an A(fv) which has an implicit (h' - hp) curve.
The method of supplementing equation (5.6) described below was based upon
area coverage and radar backscatter data and was developed in two steps, first to
correct equation (5.6) for E-layer modes and then for frequency dependence
(deviative absorption). It is essentially based upon the suggestion in Piggott
and in George, but with the advantage of having the electron density profiles
available on a worldwide basis. (See also Rawer,1976; Bibl et al., 1961; and
Fejer, 1961 for further discussion.)
10.2 + )f+f(
677.2I = )fL( 1.98
Lob
0ob
φsec

Ionospheric Communications Enhanced Profile Analysis & Circuit (ICEPAC) Prediction Program Technical Manual
54
5.3 FREQUENCY DEPENDENCE EFFECTS ON ABSORPTION
The absorption equation (5.6) contains an averaged value of A(fv) for F2-
layer modes, i.e., the effects of E-region electron density on non-deviative
absorption collision frequency (and magnetic field effects, etc.) were averaged in
the curve fitting process. Therefore, a correction for E-layer modes was derived:
Lc = A + B loge (Xe), (5.8)
where
Lc is the loss correction factor for E modes:
A = 1.359 for foE > 2 MHz,
= 1.359 (foE-0.5) / 1.5 for 0.5 ≤ foE ≤ 2 MHz,
= 0.0 for foE , 0.5 MHz;
B = 8.617 for foE > 2 MHz,
= 8.617 (foE - 0.5) / 1.5 for 0.5 ≤ foE ≤ 2 MHz,
= 0.0 for foE , 0.5 MHz;
XE = fv/ foE for h > 90 km,
= fv(90) / foE for h ≤ 90 km;
h = true height of reflection;
fv = equivalent vertical sounding frequency.
The equations for E-mode and F-mode losses assume that the mode goes through
the absorbing region (true height of reflection above 95 to 100 km). Equation
(38) represents the effect of E-layer losses which were included in Equation (36).
When the true height of reflection is below 90 km, which will happen with the
complete electron density profiles, the use of Equations (36) and (38) will give
losses much higher than those observed. The absorption should reach a maximum as
the operating frequency is lowered and then decreased. Theoretically the
absorption reaches a maximum at the height where ν/2π = f + fH. However the
electron density profile available does not represent the lower ionosphere
adequately, so this behavior has been introduced into the model in an ad hoc
manner by replacing the constant value of (ν/2π)2 = 10.2 by a calculated value.
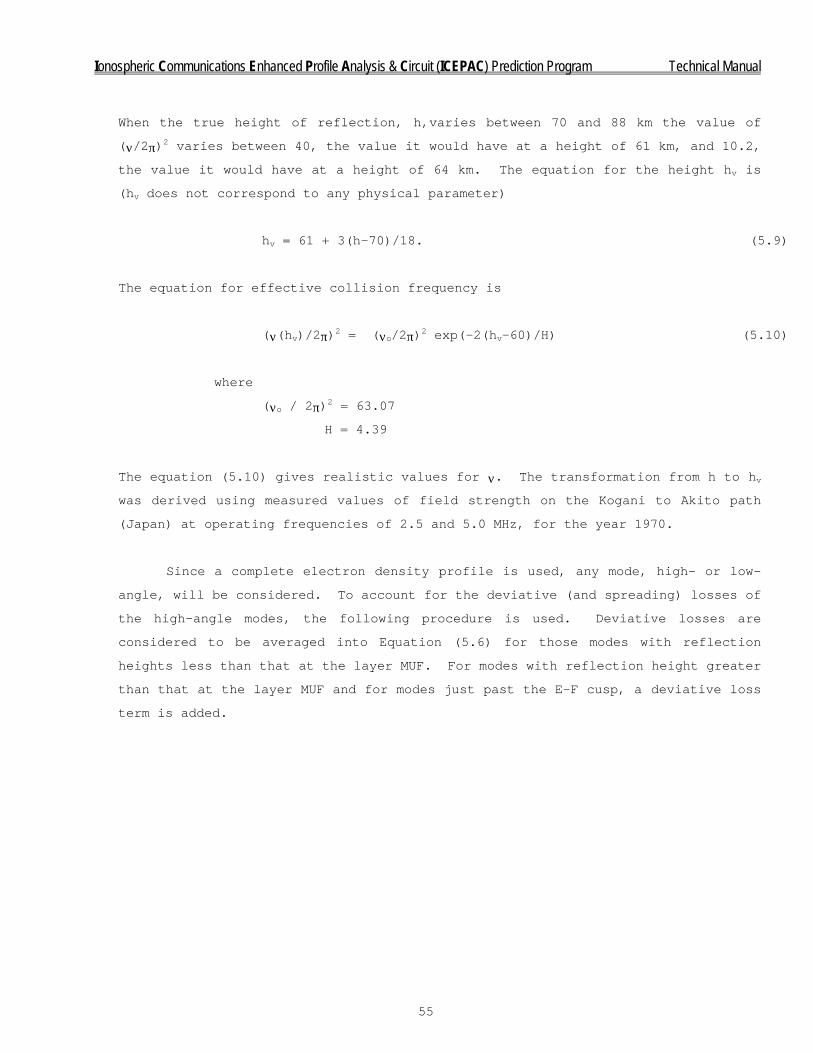
Ionospheric Communications Enhanced Profile Analysis & Circuit (ICEPAC) Prediction Program Technical Manual
55
When the true height of reflection, h,varies between 70 and 88 km the value of
(ν/2π)2 varies between 40, the value it would have at a height of 61 km, and 10.2,
the value it would have at a height of 64 km. The equation for the height hv is
(hv does not correspond to any physical parameter)
hv = 61 + 3(h-70)/18. (5.9)
The equation for effective collision frequency is
(ν(hv)/2π)2 = (νo/2π)2 exp(-2(hv-60)/H) (5.10)
where
(νo / 2π)2 = 63.07
H = 4.39
The equation (5.10) gives realistic values for ν. The transformation from h to hv
was derived using measured values of field strength on the Kogani to Akito path
(Japan) at operating frequencies of 2.5 and 5.0 MHz, for the year 1970.
Since a complete electron density profile is used, any mode, high- or low-
angle, will be considered. To account for the deviative (and spreading) losses of
the high-angle modes, the following procedure is used. Deviative losses are
considered to be averaged into Equation (5.6) for those modes with reflection
heights less than that at the layer MUF. For modes with reflection height greater
than that at the layer MUF and for modes just past the E-F cusp, a deviative loss
term is added.

Ionospheric Communications Enhanced Profile Analysis & Circuit (ICEPAC) Prediction Program Technical Manual
56
The equation is based on the relationship that the loss is proportional to the
product of collision frequency with the difference between group path and phase
path, i.e.,
Ap(fv) = B(fv)(h'-h)Nsec (φo), (5.11)
where Ap(fv) is the deviative absorption loss in dB and
B(fv) = CE exp [ -2(h-70)/ymE] for the E layer,
= CF exp [-2(h-hmF2 + ymF2)/ymF2] for the F2 layer,
B(fv) = C1 exp [-2(h-hmF1 + ymF1)/ymF1] for the F1 layer and
B(fv) = C2 exp [-2(h-hmF2 + ymF2)/ymF2] for the F2 layer
when the F1 layer is present.
The constants have not been mapped on a worldwide basis as yet. Interim values
used are
CE= 0.25,
CF= 0.40,
C1= 0.60,
C2= B(foF1).
In order to preserve continuity at the F1-layer to F2-layer transition, C2 is the
value of B(fv) with fv taken as foF1. This assures a smooth calculation of loss
for all possible electron density profiles. Note that CF and C2 are forced to
have minimum values of 0.05.
When sporadic E is present, the loss is supplemented by an Es obscuration
factor as described in Section 5.4.

Ionospheric Communications Enhanced Profile Analysis & Circuit (ICEPAC) Prediction Program Technical Manual
57
5.4 LOSS FOR PROPAGATION ABOVE THE STANDARD MUF
The model does not assume that propagation ceases at the junction frequency
(or skip distance). It is known that the geometric optics approximation does not
suffice in the neighborhood of the skip zone. By using wave methods, it is shown
that energy difracts into the skip region (Bremmer, 1949). However, the observed
signals are too strong to be explained in terms of wave propagation at the skip
distance. The physical mechanism for the propagation of significant signals
within the skip zone (or above the MUF when the distance is fixed) is not
completely understood. One possibility is that the ray-path approximation for the
calculation of skywave signal paths is probably inadequate since the skywave
signal will normally return from a large region of the ionosphere (at least one
Fresnel zone). As the frequency approaches the MUF, the energy arriving at the
sharper angles will tend to penetrate and a portion of the Fresnel zone becomes
ineffective as a reflector. As the frequency is further increased, less and less
of energy is reflected and losses will sharply increase. On the longer paths
where the fresnel zone is larger, losses increase slowly as the frequency exceeds
the MUF compared to the sharp increase on shorter paths where the Fresnel zone is
smaller. Other mechanisms may also contribute to the signal propagation and
explain the significant signals observed above the MUF. For example, propagation
may possibly be explained by scattering from horizontal irregularities in the
ionosphere (Budden, 1966). The method used here is based on the empirical
statistical method of Philips-Abel (Wheeler, 1966) rather than wave theory. The
basic assumption is that a reflecting layer of the ionosphere may be considered as
composed by quasi-random (quasi-independent) elemental patches of ionization.
These elemental patches are considered to be composed of sub-patches, each with a
classical MUF (JF). The median value of received power is proportional to the
probability that there are reflecting areas with elemental classical MUF values
that are equal to or greater than the transmission frequency. Experience
indicates that the normal distribution is a fair estimate of the spatial
probability of the elemental classical MUF values and that the mean value of this
distribution is a fair estimate of the standard MUF. Further, at any given
operating frequency there is some probability that the frequency will exceed the
median monthly predicted MUF on some days. Thus this loss term includes both the
effect of not being below the MUF on some days of the month and the loss on those
days when the frequency is above the MUF. So this term is added at all operating
frequencies.

Ionospheric Communications Enhanced Profile Analysis & Circuit (ICEPAC) Prediction Program Technical Manual
58
The equation is
L = 10 log10 P sec (φ) (dB) (5.12)
where
and
fm is the MUF for the circuit elevation angle and distance (note that fm is
higher for a two-hop mode than for a one-hop mode on the same circuit). For
vertical incidence, the loss is less than 0.5 dB for frequencies less than the
FOT, and less than 3 dB for frequencies less than the MUF. Note that all modes
from all layers (E, F1, F2, and Es) now look the same (absorption losses plus over-
the-MUF loss). The difference is in the distribution of the MUF's, being narrow
for the E and F1, somewhat wider for the F2, and the widest for the Es.
Since signal losses are associated with the ratio of the operating frequency
to the MUF at a given time, the day-to-day distribution of expected losses near
the monthly median MUF> As the frequency is well above the monthly median MUF;
e.g., above the HPF only the scatter components remain and the signal is very
weak, but the day-to-day distribution is not great.
5.5 Sporadic-E Losses
This section discusses the loss models associated with modes of propagation
for which ray theory is not valid. The sporadic-E layer was not included in the
electron density profile. It is modeled as a thin layer occurring at the height
h'Es (usually 100 to 110 km). Its effect upon modes of propagation passing
through it is given by Es obscuration loss. It is calculated by a method proposed
by Phillips (1962) and modified to use the now available maps of foEs:
σ
π
fm - f=Z
dx /2)x(- 2
1 = P
0
2Z exp∫∞

Ionospheric Communications Enhanced Profile Analysis & Circuit (ICEPAC) Prediction Program Technical Manual
59
Lo = 10 log10 (1 - P) (dB) (5.13)
where
For modes which have reflected from the sporadic-E layer, the loss is the
absorption losses supplemented by a reflection loss (corresponding to the over-
the-MUF loss) defined by
LR = 8.91 p-0.7 (5.14)
Note that this is effectively the same as Lr = 8.91 - 10 log(P) (dB).
5.6 SYSTEM LOSS
The system loss of a radio circuit is defined as the ratio of the signal
power available at the receiving antenna terminals relative to that available at
the transmitter antenna terminals, in decibels. This excludes any transmitting or
receiving antenna transmission line losses, since such losses are considered
readily measurable. The system loss does include all the losses in the
transmitting and receiving antenna circuits - not only the transmission loss
caused by radiation from the transmitting antenna and re-radiation from the
receiving antenna, but also any ground losses, dielectric losses, antenna loading
coil losses, and terminating resistor losses. Antenna gain is taken as antenna
power gain which is the product of antenna directive gain in the direction aligned
with the propagation path in both elevation and azimuth and of antenna efficiency.
. foEs = Esf
,Esf - f
= Z
dx /2)X(- 21
= P
m
mob
2Z
φ
σ
π
sec
exp∫∞
Ionospheric Communications Enhanced Profile Analysis & Circuit (ICEPAC) Prediction Program Technical Manual
60
The system loss is summarized as (Rice, et al., 1965)
Lb = Lbf + Li + Lg - (Gt + Gr) (dB) (5.15)
where
Lbf = the basic free-space transmission loss expected
between ideal, loss-free, isotropic, transmitting
and receiving antennae in free space;
Li = losses caused by ionospheric absorption, this term
includes sporadic E obscuration loss, Lo , for F-layer modes.
For all modes, this factor includes the
deviative losses at high reflection heights, over-
the-MUF loss as well as the tables of measured
deviations which include auroral losses.
Lg = ground reflection losses.
Gt = transmitting antenna power gain relative to an
isotropic antenna in free space;
Gr = receiving antenna power gain relative to an isotropic
antenna in free space;
In this report, Gt and Gr are in the direction of the propagation path and include
all antenna losses, so that Gt + Gr is an approximation of the gain Gp . The
values Gt and Gr are required for any elevation angle, azimuth direction, and
frequency.
The skywave field strength is directly related to the transmission loss, Lb.
This is the loss that would be observed if the actual antennas were replaced by
ideal, loss-free, isotropic transmitting and receiving antennas. the field
strength is:

Ionospheric Communications Enhanced Profile Analysis & Circuit (ICEPAC) Prediction Program Technical Manual
61
E = 107.2 + 20 log fob + Gt + P - Lb (dB) (5.16)
where
E = rem field strength in dB referred to one microvolt
per meter,
Gt = transmitting antenna gain in the direction of the ray
path used to determine Ls (decibels referred to an
isotropic antenna),
P = transmitter power delivered to the transmitter antenna
in decibels referred to one watt,
fob = operating frequency in megahertz.
In cases when the reference field strength is 300 millivolts per
meter at one kilometer (rms field produced by 1 kw input to a short
dipole over perfect earth), the skywave field strength, E, is
E = 142 + 20 log fob - Lb (dB) (5.17)
Likewise, when the reference field strength is 222 millivolts per
meter at one kilometer, the skywave field strength, E, is
E = 139.4 + 20 log fob - Lb (dB) (5.18)
5.7 CONCLUSIONS
A semi-empirical method to include recent measurements, especially back-
scatter measurement, in the calculation of ionospheric losses has been developed.
It includes deviative and non-deviative effects as well as sporadic-E effects.
The average effects of magnetic field and of polarization changes are included
implicitly as the constants in the equations are taken from measurements which
included these effects. The median excess system loss, Table 4 (Lucas and Haydon,
1966) is no longer used as it was mainly the average effect of sporadic-E and
deviative losses.

Ionospheric Communications Enhanced Profile Analysis & Circuit (ICEPAC) Prediction Program Technical Manual
62
6.0 LONG DISTANCE MODEL
A model to describe the virtual-height ray path and area coverage with
single ionosphere reflections has been described (Section 5). This method was a
combination of classical geometric-ray theoretical methods and empirical
statistical methods. It has long been recognized that a continuation of such
methods have severe limitations when applied to multi-hop propagation (Pedersen,
1927; Harnischmacher, 1960; Whale, 1969). As the radio path length increases,
individual ray paths become increasing difficult to define, and the composite
signal from all modes becomes increasingly important relative to the signal from
an individual mode (Bremmer, 1949).
Even for short paths there may be significant contribution from multi-hop
paths, especially when the antenna pattern does not favor the vertical angle
associated with the single-hop mode. This is not necessarily an indication that
there is anything basically wrong with the prediction techniques, but rather that
there are fundamentally unpredictable (or random) factors present. The following
section will describe some qualitative aspects of multi-hop propagation and a
quantitative method for estimating the effect of the ionosphere upon multi-hops
paths.
6.1 QUALITATIVE ASPECTS OF LONG DISTANCE PROPAGATION
The short-distance propagation model rigorously extended to long paths would
lead to the expectation that failure of propagation at any of the ionospheric
reflection areas would cause propagation to fail altogether. Empirically,
however, it has been observed that propagation usually does not fail until
ionospheric "control areas,' along the great circle path near each end of the
path, fail to support transmission (CRPL, 1948). This is apparently true, within
limits, no matter now long the great circle path is between the control points,
and no matter what the condition of the ionosphere is in between.

Ionospheric Communications Enhanced Profile Analysis & Circuit (ICEPAC) Prediction Program Technical Manual
63
Figure 10 illustrates some of the additional modes of propagation available
over great distances along the great circle path. Actual propagation is not of
course limited to a geometric plane, but travels by waves within some volume of
space [ hence we speak here of control 'areas" and reflection 'areas," not points,
(see Figure 5)].
The modes depicted include chordal modes (i.e. those which because of
ionospheric tilts are deflected over the absorbing regions) and M-modes, which
reflect above a regular E- or sporadic-E layer on some part of the path. Any wave
which leaves the earth and strikes the F2 layer excites scatter sources on its way
up through the E region (short scatter), and on its way down, after being
reflected from the F2 layer (long scatter). Re-radiation takes place from both
regions. The short scatter source provides fairly intermittent energy because of
the intermittent nature of the ionization causing the re-radiation. However, the
wave reflected from the F2 layer is spread over a wide area so that there are
enough patches of irregularities to provide an appreciable amount of re-radiation.
The irregularities consist of rather small departures of the electron
density from the average of background value so the "blobs" in the ionosphere are
not opaque, but are regions in which the refractive index is only slightly
different from the average value. Such a medium can be referred to as a
diaphanous screen (Whale, 1969). The power spectrum from such a medium contains
two components: a pseudo-specular component and a scattered component. On short-
distance paths, the specular component, which follows the geometric ray path,
predominates. On long-distance paths, the scattered component becomes
increasingly important. The situation is further complicated by horizontal and
lateral inhomogeneities, presence of the magnetic field, and ground and
ionospheric scatter, both along and from off the great circle path.
The proposed model for multi-hop propagation loss considers a wave which
travels on a great circle path by considering three parts of this path:
- losses associated with the launching of a skywave from the transmitter,
- losses associated with the propagation of the wave between
the launch and intercept area,
- losses associated with the intercept of a skywave at the
receiver.

Ionospheric Communications Enhanced Profile Analysis & Circuit (ICEPAC) Prediction Program Technical Manual
64
It is assumed that the effective launch area of the ionosphere may be
identified by examining earth-ionosphere propagation paths and selecting the most
efficient one as determined by combining the short-distance propagation model with
appropriate transmitter antenna gains. The effective intercept area is determined in
a similar manner using the appropriate receiving antenna gains.
It is assumed that between the launch and intercept areas the energy travels in
a complex combination of specular reflection and scatter components (see figure 10),
always seeking a path with the least loss.
In order to keep the models (single-hop and multi-hop) internally consistent,
the single-hop models are used to estimate the launch and inherent areas of the
multi-hop model and to estimate the losses between these areas. The following
section gives a more detailed description

Ionospheric Communications Enhanced Profile Analysis & Circuit (ICEPAC) Prediction Program Technical Manual
65
6.2 THE LONG-DISTANCE MODEL
Sampling areas are selected the same for both models; i.e., two at each end,
and one in the middle. No new set of equations nor new computer code arises this
way.
The basic transmission loss equation used in the single-hop model assumes
continual divergence as if the medium were free space. A convergence factor is added
to this equation for the multi-hop model. The theoretical angular (horizontal)
convergence factor (Davis, 1965, 1969) is used and the resultant functional form is
shown in figure 6.
CH = 15 dB at the antipodal (Ψ = π)
(6.1)
P' is the group path
where
CH is the convergence factor, dB, and
∆ is the radiation angle,
a is the earth's radius,
Ψ is the distance angle.
Ionospheric losses for the multi-hop model are in three parts as follows:
(1) The loss associated with the launch of the skywave. The characteristics
of the dominate launch path are taken from the samples of ionospheric
parameters at the transmitter and of the circuit. The radiation angle of the
transmitted ray is taken from that path which will have a maximum field
strength at a ground distance of 4000 km. The ionospheric loss associated with
the selected ray is then taken as one-half the loss associated with a one-hop
mode using this ray. The distance corresponding to the launch of the skywave
is one-half the ground distance associated with the one-hop mode.
Ψ∆′
sincos
log a P
10 = C 10H

Ionospheric Communications Enhanced Profile Analysis & Circuit (ICEPAC) Prediction Program Technical Manual
66
(2) The loss associated with the intercept of the skywave. The dominant
intercept path is assumed to be at the angle at which the ionospheric loss rate
is the lowest; i.e., the least loss per kilometer of ground distance. As in
the launch case, this angle and associated distance may be determined directly
from the "ray set' table.
(3) Loss between the launch and intercept area. The distance between the
launch and intercept areas is the great circle distance minus the distance to
the launch area from the transmitter and the distance from the intercept area
to the receiver. The loss rate along this distance is assumed to be
approximated by the average of the loss rates at the three sample areas.
The model therefore assumes that absorption on long paths is related to the
signal power that reaches the ionosphere at the transmitter end less the power that
is attenuated at the receiver and less that power lost along the path. The expected
behavior of the long-path model is depicted in Figure 7. For long-path propagation,
the mode structure is lost, being a composite of ground and ionospheric reflection
and scatter.
The total system loss for multi-hop propagation is then (figure 8)
LT = Lbf - CH + LT + Li + LR + LG + YP (6.2)
where
LT is total system loss for long sky-wave paths.
Lbf is free space loss based on ray path distance.
CH is a horizontal convergence gain.
LT is loss in the launch of the radio wave at the
transmitter. A combination of transmitter antenna gain
and propagation losses for the most efficient mode at the
sample area near the transmitter.
Li is loss over the portion of the great circle path between
the launch and intercept areas. Average of the loss
rates at the sample areas times the distance between the
launch and intercept areas.
LR is loss in the intercept of the radio wave at the receiver.
Calculated in the same way at LT using receiver antenna gain.

Ionospheric Communications Enhanced Profile Analysis & Circuit (ICEPAC) Prediction Program Technical Manual
67
LG is an average ground loss rate times distance between
launch and intercept areas.
YP is the prediction system loss correction factor which
includes effect of auroral zones and sporadic E.
It is possible to designate the factor A(fv) in Equation (5.4) as a
frequency term by defining a special lowest usable high frequency (LUF). Take the
LUF as that value of frequency, fLUF, where the field strength of 1000 kW of effective
radiated power is 0 dBu (Beckmann, 1958). Combining Equations (30), (5.4), (5.15),
(5.16), and (6.2), the field strength is
E = (E0 + 34.8) [1 - LT - Li - LR] + LG + LM + YP - 34.8 (6.3)
The reference field is Eo
E0 = 104.8 - 20 log10D
LM is the over-the-MUF losses from each end.
Rearranging the algebraic terms, the other factors are:
(6.4)
10.2 + f
f= L 1.98
0
2TL,
T
10.2 + f
f = L 1.98
0
2RL,
R

Ionospheric Communications Enhanced Profile Analysis & Circuit (ICEPAC) Prediction Program Technical Manual
68
(6.5)
(6.6)
IT , IR are absorption indices at each end of the path.
fo = fob + fH
Li = AM DM + AF DF
DM is the distance along the path supporting an M mode
(Fig.14)
DF is the total distance less DM and the one-half hop
distances at each end.
Using the night minimum absorption index (I = .1); an average
distance factor (α) to replace the number of hops, and the loss
per kilometer function, AH is obtained from the rearrangement
of the ionospheric loss Equation (5.6).
34.8 + E
I 677.2 = f
0
TT2TL,
φsec
34.8 + E
I 677.2 = f
0
RR2RL,
φsec
( )D) (b D
10.2 + f(19.335
= A 10M
1.980
Mlog
α

Ionospheric Communications Enhanced Profile Analysis & Circuit (ICEPAC) Prediction Program Technical Manual
69
b = .1047 107
(6.7)
I is average absorption index.
6.3 SUMMARY
The short-distance model based on a complete electron density
profile of the D, E, F1 , and F2 regions with a separate sporadic-E layer predicts
the ray path at any vertical angle of departure. Propagation losses for multipath
propagation, which is essential for long paths, is considered to be approximated
through a multiple application of the single-hop model. The steps are:
1. Sample the ionosphere at control areas near the transmitter and
receiver and at the path midpoint.
2. Use the short-distance propagation model to develop a ray-set
table at each sample location. This table includes propagation
distance for each angle of departure including absorption and
over-the-MUF losses.
3. Combine the transmitting antenna gain pattern with the propagation
ray set for the sample area near the transmitter to determine the
most efficient launch path for a distance of 4000 km. (Path with
the lowest loss rate including transmitter antenna gain.) Note
the launch loss (one-half the losses from the ray-set table plus
( )D) (b D
10.2 + f
I 193.35
= A10F
1.980
Flog
α
)D use (,D
4000 - D+ 1. = mF
Fα

Ionospheric Communications Enhanced Profile Analysis & Circuit (ICEPAC) Prediction Program Technical Manual
70
transmitter antenna gain) and the corresponding launch distance
(one-half the ground wave range for a single hop).
4. Repeat #3 above to determine the most efficient intercept path
using the sample area near the receiver and the receiving antenna
vertical gain pattern.
5. Determine the distance between the ionospheric launch and
intercept areas. (Ground great-circle distance minus the launch
and intercept distance is an adequate approximation.)
6. Estimate a loss for the distance obtained in #5 above by averaging
the loss rates at the three sample areas and multiply by the
distance.
7. Determine the basic free-space loss and modify by a horizontal
convergence factor.
8. Estimate ground losses (loss rate for type of intervening terrain
times distance in #5 above).
9. Use the system loss adjustment factor table.
10. Combine 3, 4, 6, 7, 8, 9 to estimate the system loss.

Ionospheric Communications Enhanced Profile Analysis & Circuit (ICEPAC) Prediction Program Technical Manual
71
7. HIGH-FREQUENCY SYSTEM PERFORMANCE
Two methods are used in the program to obtain estimates of the expected system
performance. The first gives performance estimates in terms of the circuit
reliability, which is defined as the fraction of days that successful communication
may be expected at a given hour within the month at a specific operating frequency.
The circuit reliability is based upon monthly median estimates of all operational
parameters and their distributions and represents only the expected fraction of days
in the month at the given hour that successful communication is expected. The second
method gives estimates of the service probability, which is defined as the
probability of obtaining a predetermined grade of service or better during a
specified percentage of time (Barsis et al., 1961). It includes estimates of the
prediction uncertainties associated with the operational parameters as a function of
the percentage of time the specified grade of service is required, and it is
therefore a measure of the chance of successful communication with the system
employed.
7.1 CIRCUIT RELIABILITY
The primary factor in determining the circuit reliability is the signal-to-
noise ratio, which is directly associated with a grade of service. The grade of
service defines the quality of communication desired as, for example, the percentage
of satisfied observers of facsimile transmissions. A minimum required signal-to-
noise ratio is associated with the desired grade of service. This ratio is
determined in terms of the class of emissions, modulation index, modulation rate, and
signaling codes, and includes the effects of fading, error-correcting schemes, noise
reducers, optimum modulation and detection techniques, and diversity schemes. The
required signal-to-noise ratio for a minimum acceptable grade of service must be
specified by the user.
The method for estimating the circuit reliability for a particular path
consists of (1) calculating the maximum frequency that will be supported by the
ionosphere; (2) determining the probability that a specified frequency will be
propagated at a given hour within the month; (3) based on relationships between the
specified system components and the propagation medium, calculating the distribution
of signal-to-noise ratios from the medians and standard deviations of both signal
power and noise power; (4) determining the probability that the signal-to-noise ratio
will exceed the required signal-to-noise ratio; and (5) combining the two

Ionospheric Communications Enhanced Profile Analysis & Circuit (ICEPAC) Prediction Program Technical Manual
72
probabilities to give an estimate of the circuit reliability.
The median value of received signal power Pe required for minimum acceptable
grade of service during the month at a given hour is (CCIR, 1988)
Pe = Fam + Rmd + B - 204 (dBW) , (7.1)
where
Fam = median of the hourly values of radio noise power density Fa within
a seasonal time block system,
Rmd = required system signal-to-noise power density ratio,
B = effective receiver bandwidth (10 log10b; b in Hz).
The values of Fam are given in terms of the effective antenna noise factor that
results from the external noise power available from a loss-free antenna. Note that
the values of Fam are representative of those that would be obtained with a short
vertical lossless antenna over a perfectly conducting plane earth. Use of other
antennas requires some correction because of directivity and polarization; it is not
now accounted for in the program. To account for this, atmospheric noise source maps
are now under study. The available signal-to-noise ratio RS/N at the receiving
antenna terminals is calculated by combining the received signal power with the
received noise power:
RS/N = S - N, (7.2)
where
S = monthly median signal in decibels,
N = monthly median of the hourly median radio noise power in decibels.
The probability qS/N that RS/N exceeds a given level is evaluated by the chi-
square probability functions given by (5.20), where the value of χ2 is related to
Rmo. The median, upper, and lower decile values of the required signal-to-noise
ratio, Rmo, R.90, R.10, respectively, are substituted in (5.21), (5.23), (5.24), and
(5.26) for the MUF values, and the calculation proceed as before. The ratios R.90 and
R.10 are defined as follows:
(7.4) ,] S + [ 1.28 - mR = R
(7.3) ,] S + [ 1.28 + R = R
1/22No.10
1/22u
2Nm.90 uo
llσ
σ

Ionospheric Communications Enhanced Profile Analysis & Circuit (ICEPAC) Prediction Program Technical Manual
73
where
Rm0 = median value D50 of the required signal-to-noise power ratio,
σNu,l = departures of the standard deviation of the radio noise from the
median,
Su,l = departures of the standard deviation of the received signal from
the median.
Values of N and 1.28 σN are obtained from numerical representations of the
atmospheric, galactic, and man-made noise as described in section 4. Values of
S(med.), Su, and Sl are obtained by the methods described in section 7 in terms of the
system loss and are shown in tables 7.3 and 7.4.
The probability qf that at least one sky-wave mode will be present to produce
the median available signal-to-noise is described in section 5, and the combined
probabilities gives the circuit reliability
REL = qf qS/N . (7.5)
Therefore, the reliability is based on the available signal or signal-to-noise ratio
and the fraction of days a sky-wave path is expected to be present. These two
factors do not need to be associated with the same propagation mode, however. The
program selects the lowest loss of all likely modes and combines this with the
highest likelihood of ionospheric support to calculate the circuit reliability.
(a) the reliability computation is based (among other things) upon an
estimate of the day-to-day variation in signal level;
(b) the semi-empirical determination of these day-to-day variations as used
in this prediction method includes all modes of propagation (see sec.
7.4), i.e., signal levels associated with specific modes of propagation
ate not separated out;
(c) the minimum loss (corresponding essentially to the highest hourly median
signal level observed during the month) is more predictable than the
monthly median of hourly medians, especially when predictions must be
applicable worldwide;
(d) the minimum loss for any path is assumed to be associated with any mode
that has a qf of 0.01 or more; and
(e) the fraction of days for any propagation mode is assumed to be
approximated by the fraction of days for the most probable mode.
The program lists the individual mode for any frequency and hour that has the
highest reliability, but this particular mode may not be the mode with the lowest

Ionospheric Communications Enhanced Profile Analysis & Circuit (ICEPAC) Prediction Program Technical Manual
74
loss or the highest likelihood of ionospheric support qf used to calculate the
circuit reliability. The lowest useful frequency (LUF) is defined as the minimum
frequency at which the calculated circuit reliability is above a specified level. It
has been common practice to designate the LUF as the minimum frequency with a circuit
reliability of 0.90. An option is available in the program to specify any
reliability level to designate the LUF.
7.2 SERVICE PROBABILITY
The service probability Qt is the probability that the grade of service, gr,
defined by the required signal-to-noise ratio will be achieved or exceeded for a
specified time availability, qr. In other words, the problem is to assess the
probability that the specified grade of service for a given percentage of the days
within the month at some specified hour will be provided by the calculated available
signal-to-noise ratio. Suppose, for example, that the fraction of days, qr, within
the month that the grade of service, gr, is desired is 0.95, and that the calculated
service probability is 0.70. This means that, for 0.95 of the days within the month,
there is a 0.70 probability at the particular hour and frequency that the grade of
service will be achieved.
Estimates of the service probability combine statistically the uncertainties of
all values included in the prediction process. The most important of these are
related to the prediction of the received signal and noise. The required signal-to-
noise ratio, Rmo, that defines the grade of service, gr, has an associated uncertainty
because of errors in estimating equipment performance, short-term noise and signal
variations, multipath propagation, etc. In the absence of sufficient test data, this
uncertainty, expressed as a standard deviation, σr, has arbitrarily been taken to be
equal to 2 dB for all grades of service.
Prediction uncertainties associated with estimates of the received signal level
or, conversely, the excess system loss, are shown in table 4 and 5. Values represent
estimates of the uncertainty, expressed as a standard deviation in predicting the
median, σP, the upper decile σSu, and the lower decile σSl of the excess system loss.
These estimates of prediction uncertainties were obtained from comparisons of
predicted values of received signals with those observed on operating circuits (R.M.
Davis, 1969, private communication).

Ionospheric Communications Enhanced Profile Analysis & Circuit (ICEPAC) Prediction Program Technical Manual
75
TABLE 4 EXPECTED EXCESS SYSTEM LOSS (dB)
(Paths Less than 2500 km)
WINTER (NOV., DEC., JAN., FEB.)���������������������������������������������������������������������������������������������������������������������������������������������������������
� G.M. � 01-04 LMT � 04-07 LMT � 07-10 LMT � 10-13 LMT � 13-16 LMT � 16-19 LMT � 19-22 LMT � 22-01 LMT � G.M. �
� ����������������������������������������������������������������������������������������������������������������������������������������� �
� LAT. � Med Sl Su � Med Sl Su � Med Sl Su � Med Sl Su � Med Sl Su � Med Sl Su � Med Sl Su � Med Sl Su � LAT. �
���������������������������������������������������������������������������������������������������������������������������������������������������������
� 00-40 � 9.0 4.0 9.0 � 9.0 4.0 7.6 � 9.0 4.0 7.6 � 9.0 4.0 6.4 � 9.0 4.0 6.4 � 9.0 4.0 7.6 � 9.0 4.0 7.6 � 9.0 4.0 9.0 � 00-40 �
� 40-45 � 9.4 4.3 9.0 � 9.3 4.3 8.3 � 10.1 4.6 8.6 � 9.1 4.5 7.1 � 9.1 4.2 6.2 � 9.6 4.6 8.1 � 9.7 4.6 7.9 � 9.3 4.2 9.1 � 40-45 �
� 45-50 � 9.9 4.7 9.1 � 9.6 4.6 9.0 � 11.2 5.2 9.6 � 9.2 5.1 7.8 � 9.2 4.4 6.5 � 10.2 5.2 8.6 � 10.5 5.2 8.3 � 9.6 4.5 9.2 � 45-50 �
� 50-55 � 10.3 5.1 9.2 � 10.0 5.0 9.7 � 12.2 5.9 10.7 � 9.3 5.7 8.7 � 9.4 4.6 6.9 � 10.8 5.8 9.1 � 11.3 5.8 8.7 � 9.9 4.8 9.3 � 50-55 �
� 55-60 � 11.0 5.3 10.0 � 13.5 6.7 9.6 � 15.6 8.2 14.6 � 10.4 5.0 10.6 � 9.8 4.8 7.2 � 11.7 6.5 9.0 � 12.0 5.4 10.6 � 11.0 5.1 9.5 � 55-60 �
� 60-65 � 16.0 8.0 13.5 � 25.0 12.7 13.0 � 23.0 12.3 23.7 � 12.6 6.8 20.5 � 11.0 5.8 8.7 � 15.8 8.3 14.1 � 18.8 8.9 17.2 � 15.6 7.2 9.9 � 60-65 �
� 65-70 � 15.2 7.7 14.6 � 24.6 13.5 13.2 � 21.8 11.8 22.5 � 11.3 6.0 22.0 � 10.5 5.4 8.2 � 13.6 7.8 11.3 � 16.0 7.8 18.6 � 14.0 6.8 11.5 � 65-70 �
� 70-75 � 12.4 6.3 9.4 � 17.3 8.9 15.2 � 17.6 9.9 14.3 � 9.9 5.4 13.9 � 9.5 4.8 7.5 � 11.5 6.5 10.5 � 12.0 5.8 14.8 � 12.0 6.0 9.0 � 70-75 �
� 75-80 � 11.0 5.6 9.4 � 15.6 7.7 8.8 � 15.2 8.4 10.2 � 10.5 6.3 10.7 � 9.5 4.7 6.7 � 10.4 5.4 8.6 � 10.5 4.9 11.5 � 10.0 5.4 8.5 � 75-80 �
���������������������������������������������������������������������������������������������������������������������������������������������������������
EQUINOX (MAR., APR., SEPT., OCT.)���������������������������������������������������������������������������������������������������������������������������������������������������������
� G.M. � 01-04 LMT � 04-07 LMT � 07-10 LMT � 10-13 LMT � 13-16 LMT � 16-19 LMT � 19-22 LMT � 22-01 LMT � G.M. �
� ����������������������������������������������������������������������������������������������������������������������������������������� �
� LAT. � Med Sl Su � Med Sl Su � Med Sl Su � Med Sl Su � Med Sl Su � Med Sl Su � Med Sl Su � Med Sl Su � LAT. �
���������������������������������������������������������������������������������������������������������������������������������������������������������
� 00-40 � 9.0 4.0 9.0 � 9.0 4.0 9.0 � 9.0 4.0 7.6 � 9.0 4.0 6.4 � 9.0 4.0 6.4 � 9.0 4.0 7.6 � 9.0 4.0 7.6 � 9.0 4.0 9.0 � 00-40 �
� 40-45 � 9.5 4.5 10.0 � 9.6 4.4 11.5 � 10.6 5.3 9.8 � 10.0 4.7 9.0 � 9.7 4.5 8.9 � 10.3 5.0 11.3 � 10.0 4.8 10.0 � 10.3 4.7 10.0 � 40-45 �
� 45-50 � 10.1 5.0 11.1 � 10.3 4.8 14.1 � 12.3 6.6 12.0 � 11.0 5.4 11.6 � 10.4 5.0 11.4 � 11.6 6.0 15.0 � 11.0 5.6 12.5 � 11.6 5.4 11.0 � 45-50 �
� 50-55 � 10.7 5.6 12.2 � 11.0 5.2 16.6 � 14.0 8.0 14.3 � 12.0 6.2 14.2 � 11.2 5.6 13.9 � 13.0 7.0 18.7 � 12.0 6.4 15.0 � 13.0 6.2 12.0 � 50-55 �
� 55-60 � 11.4 5.7 17.6 � 13.4 6.4 22.0 � 16.5 8.3 15.3 � 14.0 7.6 18.3 � 11.6 5.6 15.5 � 13.8 7.5 20.2 � 14.5 7.7 19.5 � 15.1 7.4 13.3 � 55-60 �
� 60-65 � 15.7 7.7 30.3 � 20.2 9.5 29.3 � 26.0 14.0 23.4 � 18.0 10.6 33.0 � 16.2 8.3 19.2 � 18.0 10.3 27.0 � 19.9 11.3 29.0 � 24.0 13.0 26.7 � 60-65 �
� 65-70 � 15.5 8.1 28.0 � 21.0 11.1 31.0 � 30.4 18.2 26.9 � 17.5 10.0 27.9 � 13.8 7.0 18.0 � 15.0 8.4 24.0 � 19.0 11.3 28.8 � 22.7 11.3 17.5 � 65-70 �
� 70-75 � 12.3 7.0 21.7 � 20.0 13.8 20.8 � 20.6 12.8 20.2 � 14.1 8.8 18.9 � 11.6 6.2 14.2 � 13.0 7.2 18.0 � 15.0 8.6 22.0 � 16.0 8.0 16.5 � 70-75 �
� 75-80 � 10.4 6.1 15.5 � 11.5 7.5 18.7 � 16.4 9.7 14.4 � 12.8 7.5 13.6 � 10.0 5.4 12.0 � 11.4 6.2 14.1 � 11.4 6.4 20.6 � 12.3 6.3 15.7 � 75-80 �
���������������������������������������������������������������������������������������������������������������������������������������������������������

Ionospheric Communications Enhanced Profile Analysis & Circuit (ICEPAC) Prediction Program Technical Manual
76
SUMMER (MAY, JUNE, JULY, AUG.)���������������������������������������������������������������������������������������������������������������������������������������������������������
� G.M. � 01-04 LMT � 04-07 LMT � 07-10 LMT � 10-13 LMT � 13-16 LMT � 16-19 LMT � 19-22 LMT � 22-01 LMT � G.M. �
� ����������������������������������������������������������������������������������������������������������������������������������������� �
� LAT. � Med Sl Su � Med Sl Su � Med Sl Su � Med Sl Su � Med Sl Su � Med Sl Su � Med Sl Su � Med Sl Su � LAT. �
���������������������������������������������������������������������������������������������������������������������������������������������������������
� 00-40 � 9.0 4.0 9.0 � 9.0 4.0 7.6 � 9.0 4.0 7.6 � 9.0 4.0 6.4 � 9.0 4.0 6.4 � 9.0 4.0 7.6 � 9.0 4.0 7.6 � 9.0 4.0 9.0 � 00-40 �
� 40-45 � 9.8 4.4 9.8 � 9.6 4.3 9.9 � 9.8 4.7 9.1 � 9.7 4.5 7.2 � 9.8 4.5 8.1 � 10.6 5.1 8.6 � 10.5 4.9 9.5 � 10.3 4.7 10.0 � 40-45 �
� 45-50 � 10.6 4.8 10.6 � 10.2 4.7 12.2 � 10.6 5.5 10.7 � 10.5 5.0 8.1 � 10.7 5.0 9.8 � 12.3 6.2 9.7 � 12.1 5.9 11.4 � 11.6 5.4 11.0 � 45-50 �
� 50-55 � 11.5 5.3 11.4 � 10.8 5.1 14.6 � 11.4 6.3 12.3 � 11.3 5.5 9.0 � 11.6 5.5 11.6 � 14.0 7.3 10.8 � 13.6 6.9 13.4 � 13.0 6.1 12.0 � 50-55 �
� 55-60 � 12.2 5.5 17.8 � 11.7 5.5 16.1 � 13.0 7.2 15.6 � 12.0 6.0 10.6 � 12.0 5.8 13.5 � 15.5 8.5 11.0 � 15.7 7.8 14.1 � 14.0 6.4 15.0 � 55-60 �
� 60-65 � 15.5 7.5 24.5 � 13.8 5.8 22.7 � 18.0 10.7 26.0 � 15.0 7.8 18.8 � 13.8 6.2 19.9 � 18.1 9.1 14.2 � 18.5 10.1 20.5 � 17.9 8.9 21.1 � 60-65 �
� 65-70 � 13.9 6.5 22.1 � 13.2 6.2 21.8 � 15.2 9.2 26.7 � 13.5 6.7 19.5 � 12.8 5.7 16.6 � 14.4 7.2 13.8 � 16.7 7.9 21.9 � 16.2 7.8 19.0 � 65-70 �
� 70-75 � 11.4 5.4 15.6 � 12.0 5.8 15.0 � 11.8 6.8 18.2 � 12.0 6.2 12.0 � 11.7 5.5 13.3 � 13.2 6.9 11.1 � 13.8 7.6 17.8 � 13.5 6.8 16.0 � 70-75 �
� 75-80 � 11.2 5.7 12.8 � 11.7 6.0 11.3 � 10.2 5.3 16.8 � 11.3 5.7 9.5 � 11.2 5.3 12.1 � 12.8 7.0 10.2 � 13.2 7.2 11.8 � 12.8 6.8 12.7 � 75-80 �
���������������������������������������������������������������������������������������������������������������������������������������������������������

Ionospheric Communications Enhanced Profile Analysis & Circuit (ICEPAC) Prediction Program Technical Manual
77
TABLE 4 EXPECTED EXCESS SYSTEM LOSS (dB) - Continued
(Paths Greater than 2500 km)
WINTER (NOV., DEC., JAN., FEB.)���������������������������������������������������������������������������������������������������������������������������������������������������������
� G.M. � 01-04 LMT � 04-07 LMT � 07-10 LMT � 10-13 LMT � 13-16 LMT � 16-19 LMT � 19-22 LMT � 22-01 LMT � G.M. �
� ����������������������������������������������������������������������������������������������������������������������������������������� �
� LAT. � Med. Sl Su � Med. Sl Su � Med. Sl Su � Med. Sl Su � Med. Sl Su � Med. Sl Su � Med. Sl Su � Med. Sl Su � LAT. �
���������������������������������������������������������������������������������������������������������������������������������������������������������
� 00-40 � 9.0 4.0 9.0 � 9.0 4.0 7.6 � 9.0 4.0 7.6 � 9.0 4.0 6.4 � 9.0 4.0 6.4 � 9.0 4.0 7.6 � 9.0 4.0 7.6 � 9.0 4.0 9.0 � 00-40 �
� 40-45 � 9.3 4.2 9.1 � 9.3 4.3 7.8 � 9.4 4.2 9.0 � 9.0 4.2 7.3 � 9.0 4.0 6.5 � 9.3 4.3 7.7 � 9.5 4.3 7.6 � 9.4 4.3 9.2 � 40-45 �
� 45-50 � 9.6 4.4 9.3 � 9.6 4.6 8.0 � 9.8 4.5 10.4 � 9.1 4.4 8.2 � 9.1 4.1 6.7 � 9.6 4.7 7.8 � 10.0 4.6 7.6 � 9.5 4.6 9.4 � 45-50 �
� 50-55 � 9.9 4.6 9.5 � 10.0 5.0 8.2 � 10.3 4.8 11.9 � 9.1 4.6 9.2 � 9.1 4.1 6.9 � 10.0 5.1 7.9 � 10.5 4.9 7.6 � 10.4 4.9 9.6 � 50-55 �
� 55-60 � 10.6 4.7 9.6 � 11.4 5.5 8.3 � 11.7 5.6 12.4 � 9.6 5.2 10.4 � 9.4 4.6 7.4 � 10.7 5.5 7.6 � 10.8 5.0 7.9 � 12.5 5.3 9.8 � 55-60 �
� 60-65 � 14.3 5.7 11.4 � 16.0 6.8 9.5 � 14.9 7.3 14.1 � 11.0 5.2 15.2 � 9.7 4.1 8.3 � 13.0 6.7 8.0 � 13.5 5.6 8.9 � 19.0 7.8 13.8 � 60-65 �
� 65-70 � 14.5 6.5 10.2 � 14.0 6.3 10.9 � 16.0 8.3 14.2 � 10.9 4.4 15.8 � 9.5 5.1 7.7 � 12.0 6.2 7.3 � 13.5 6.1 8.5 � 18.6 8.6 11.1 � 65-70 �
� 70-80 � 11.5 3.4 9.7 � 13.5 6.5 7.8 � 13.3 6.8 11.2 � 9.8 4.8 11.2 � 9.3 4.7 7.1 � 10.6 5.4 7.4 � 11.0 5.1 8.6 � 13.8 6.5 9.2 � 70-75 �
� 80-85 � 10.5 5.1 9.2 � 11.7 5.9 8.1 � 11.5 5.7 10.2 � 9.8 4.8 9.2 � 8.8 4.4 7.0 � 9.9 5.0 7.5 � 9.8 4.8 8.2 � 10.6 5.0 9.7 � 75-80 �
���������������������������������������������������������������������������������������������������������������������������������������������������������
EQUINOX (MAR., APR., SEPT., OCT.)���������������������������������������������������������������������������������������������������������������������������������������������������������
� G.M. � 01-04 LMT � 04-07 LMT � 07-10 LMT � 10-13 LMT � 13-16 LMT � 16-19 LMT � 19-22 LMT � 22-01 LMT � G.M. �
� ����������������������������������������������������������������������������������������������������������������������������������������� �
� LAT. � Med. Sl Su � Med. Sl Su � Med. Sl Su � Med. Sl Su � Med. Sl Su � Med. Sl Su � Med. Sl Su � Med. Sl Su � LAT. �
���������������������������������������������������������������������������������������������������������������������������������������������������������
� 00-40 � 9.0 4.0 9.0 � 9.0 4.0 7.6 � 9.0 4.0 7.6 � 9.0 4.0 6.4 � 9.0 4.0 6.4 � 9.0 4.0 7.6 � 9.0 4.0 7.6 � 9.0 4.0 9.0 � 00-40 �
� 40-45 � 9.3 4.1 10.0 � 9.3 4.1 8.5 � 9.6 4.2 8.3 � 9.6 4.4 7.9 � 9.4 4.3 8.8 � 10.0 4.5 9.0 � 9.9 4.3 8.9 � 9.6 4.2 10.6 � 40-45 �
� 45-50 � 9.6 4.2 11.0 � 9.6 4.2 9.4 � 10.2 4.5 9.0 � 10.3 4.9 9.4 � 9.8 4.6 11.2 � 11.0 4.9 10.4 � 10.8 4.6 10.2 � 10.3 4.4 12.3 � 45-50 �
� 50-55 � 9.9 4.4 12.1 � 9.9 4.3 10.3 � 10.8 4.8 9.7 � 11.0 5.4 11.0 � 10.3 5.0 13.7 � 12.1 5.4 11.9 � 11.7 5.0 11.6 � 11.0 4.7 14.0 � 50-55 �
� 55-60 � 10.4 4.5 13.2 � 11.0 4.6 10.6 � 12.2 5.7 9.8 � 12.8 6.3 11.2 � 10.8 5.1 14.2 � 13.0 5.7 12.0 � 14.4 6.2 12.4 � 12.4 5.1 17.5 � 55-60 �
� 60-65 � 12.9 5.7 15.5 � 14.2 5.9 10.8 � 16.6 7.9 11.4 � 18.0 9.4 15.7 � 14.0 6.5 17.2 � 16.5 7.5 14.2 � 19.0 8.5 16.7 � 16.9 7.5 22.1 � 60-65 �
� 65-70 � 12.7 5.7 14.3 � 14.6 6.6 10.6 � 16.7 7.7 13.8 � 17.1 9.0 13.4 � 12.5 5.7 17.3 � 14.0 6.5 13.3 � 18.5 8.5 16.0 � 16.3 7.1 17.5 � 65-70 �
� 70-75 � 10.8 4.9 13.1 � 11.9 5.3 9.8 � 13.1 6.1 10.9 � 14.7 7.7 12.4 � 10.5 4.9 15.9 � 12.2 5.8 12.5 � 14.6 6.9 13.8 � 12.6 5.6 16.3 � 70-75 �
� 75-80 � 10.0 4.8 11.0 � 10.2 4.6 9.0 � 11.7 5.7 10.6 � 12.0 6.5 12.2 � 9.6 5.0 14.8 � 11.0 5.5 11.0 � 11.3 5.5 13.7 � 10.6 4.9 15.6 � 75-80 �
���������������������������������������������������������������������������������������������������������������������������������������������������������
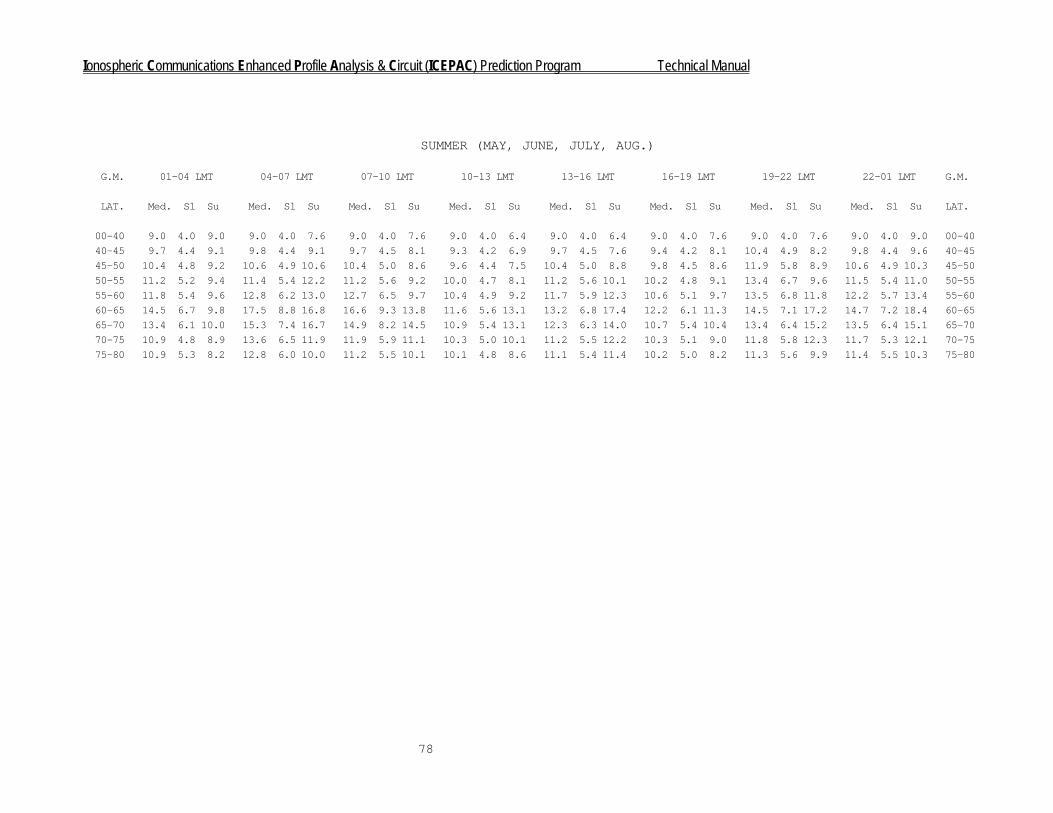
Ionospheric Communications Enhanced Profile Analysis & Circuit (ICEPAC) Prediction Program Technical Manual
78
SUMMER (MAY, JUNE, JULY, AUG.)���������������������������������������������������������������������������������������������������������������������������������������������������������
� G.M. � 01-04 LMT � 04-07 LMT � 07-10 LMT � 10-13 LMT � 13-16 LMT � 16-19 LMT � 19-22 LMT � 22-01 LMT � G.M. �
� ����������������������������������������������������������������������������������������������������������������������������������������� �
� LAT. � Med. Sl Su � Med. Sl Su � Med. Sl Su � Med. Sl Su � Med. Sl Su � Med. Sl Su � Med. Sl Su � Med. Sl Su � LAT. �
���������������������������������������������������������������������������������������������������������������������������������������������������������
� 00-40 � 9.0 4.0 9.0 � 9.0 4.0 7.6 � 9.0 4.0 7.6 � 9.0 4.0 6.4 � 9.0 4.0 6.4 � 9.0 4.0 7.6 � 9.0 4.0 7.6 � 9.0 4.0 9.0 � 00-40 �
� 40-45 � 9.7 4.4 9.1 � 9.8 4.4 9.1 � 9.7 4.5 8.1 � 9.3 4.2 6.9 � 9.7 4.5 7.6 � 9.4 4.2 8.1 � 10.4 4.9 8.2 � 9.8 4.4 9.6 � 40-45 �
� 45-50 � 10.4 4.8 9.2 � 10.6 4.9 10.6 � 10.4 5.0 8.6 � 9.6 4.4 7.5 � 10.4 5.0 8.8 � 9.8 4.5 8.6 � 11.9 5.8 8.9 � 10.6 4.9 10.3 � 45-50 �
� 50-55 � 11.2 5.2 9.4 � 11.4 5.4 12.2 � 11.2 5.6 9.2 � 10.0 4.7 8.1 � 11.2 5.6 10.1 � 10.2 4.8 9.1 � 13.4 6.7 9.6 � 11.5 5.4 11.0 � 50-55 �
� 55-60 � 11.8 5.4 9.6 � 12.8 6.2 13.0 � 12.7 6.5 9.7 � 10.4 4.9 9.2 � 11.7 5.9 12.3 � 10.6 5.1 9.7 � 13.5 6.8 11.8 � 12.2 5.7 13.4 � 55-60 �
� 60-65 � 14.5 6.7 9.8 � 17.5 8.8 16.8 � 16.6 9.3 13.8 � 11.6 5.6 13.1 � 13.2 6.8 17.4 � 12.2 6.1 11.3 � 14.5 7.1 17.2 � 14.7 7.2 18.4 � 60-65 �
� 65-70 � 13.4 6.1 10.0 � 15.3 7.4 16.7 � 14.9 8.2 14.5 � 10.9 5.4 13.1 � 12.3 6.3 14.0 � 10.7 5.4 10.4 � 13.4 6.4 15.2 � 13.5 6.4 15.1 � 65-70 �
� 70-75 � 10.9 4.8 8.9 � 13.6 6.5 11.9 � 11.9 5.9 11.1 � 10.3 5.0 10.1 � 11.2 5.5 12.2 � 10.3 5.1 9.0 � 11.8 5.8 12.3 � 11.7 5.3 12.1 � 70-75 �
� 75-80 � 10.9 5.3 8.2 � 12.8 6.0 10.0 � 11.2 5.5 10.1 � 10.1 4.8 8.6 � 11.1 5.4 11.4 � 10.2 5.0 8.2 � 11.3 5.6 9.9 � 11.4 5.5 10.3 � 75-80 �
���������������������������������������������������������������������������������������������������������������������������������������������������������

Ionospheric Communications Enhanced Profile Analysis & Circuit (ICEPAC) Prediction Program Technical Manual
79
TABLE 6. PREDICTION ERRORS IN THE ATMOSPHERIC RADIO NOISE LEVELS
Numerical Coefficients for use in Evaluation of the
Standard Deviation of the Median Value of the Atmospheric Radio Noise (σFAM)
DEC - JAN - FEB
LMT A1 A2 A3 A4 A5
00-04 .743379E+00 .184805E+01 -.890621E+00 -.199749E+01 .452507E+01
04-08 -.428242E+00 .302502E+00 .742824E+00 -.160900E+01 .417567E+01
08-12 -.342594E+00 .585453E+00 .177053E+01 -.985735E+00 .445041E+01
12-16 -.109963E+01 -.410156E+00 .272162E+01 -.191082E+00 .466347E+01
16-20 -.225828E+00 .262167E+00 .212719E+00 -.114419E+01 .468956E+01
20-24 .735803E+00 .143984E+01 -.177913E+01 -.191275E+01 .529731E+01
MAR - APR - MAY
00-04 .168882E+00 .653291E+00 .919879E-01 -.640683E+00 .367957E+01
04-08 .136798E+01 .256034E+01 -.222544E+01 -.292737E+01 .497452E+01
08-12 .114881E+01 .282530E+01 -.154909E+01 -.383357E+01 .603194E+01
12-16 .557917E+00 .171872E+01 -.111954E+01 -.284310E+01 .663045E+01
16-20 -.719275E-01 .119484E+01 .787773E+00 -.246763E+01 .451286E+01
20-24 -.104108E+00 .258124E+00 .256638E+00 -.575034E+00 .388959E+01
JUN - JUL - AUG
00-04 .441078E+00 .754692E+00 -.149459E+01 -.123047E+01 .552806E+01
04-08 .179997E+01 .285387E+01 -.427602E+01 -.421217E+01 .702824E+01
08-12 .122894E+01 .264191E+01 -.285556E+01 -.389196E+01 .766424E+01
12-16 .975428E+00 .875660E+00 -.440646E+01 -.204496E+01 .902340E+01
16-20 .147046E+01 .320094E+01 -.152498E+01 -.313552E+01 .587587E+01
20-24 .193233E-01 -.494468E+00 -.143067E+01 .118105E+00 .482582E+01
SEP - OCT - NOV
00-04 .507302E+00 .168124E+01 .292958E-01 -.211237E+01 .387806E+01
04-08 -.111661E-01 .110632E+01 .733434E+00 -.185950E+01 .449589E+01
08-12 .279820E+00 .177786E+01 .746844E+00 -.243937E+01 .494175E+01
12-16 .212440E+00 .130495E+01 -.603455E-02 -.221375E+01 .604906E+01
16-20 .820952E-01 .142235E+01 .685795E+00 -.248459E+01 .444219E+01
20-24 .425376E+00 .118228E+01 -.472298E+00 -.142879E+01 .427191E+01

Ionospheric Communications Enhanced Profile Analysis & Circuit (ICEPAC) Prediction Program Technical Manual
80
TABLE 6. PREDICTION ERRORS IN THE ATMOSPHERIC RADIO NOISE LEVELS (CONT.)
Numerical Coefficients for use in Evaluation of the
Standard Deviation of the Upper Decile of the Atmospheric Radio Noise (σDL)
DEC - JAN - FEB
LMT A1 A2 A3 A4 A5
00-04 .126904E+00 .268785E-01 -.770942E+00 .226285E-01 .248548E+01
04-08 .614280E+00 .571794E+00 -.235541E+01 -.100525E+01 .404069E+01
08-12 -.119745E+00 -.151771E-01 -.408071E+00 -.438922E+00 .347453E+01
12-16 .248158E+00 .202147E+00 -.149445E+01 -.538425E+00 .379969E+01
16-20 .511612E+00 .347771E+00 -.232743E+01 -.632405E+00 .429346E+01
20-24 -.343668E+00 -.414469E+00 .343420E+00 .494973E+00 .241309E+01
MAR - APR - MAY
00-04 -.794447E-01 -.421282E-01 -.106715E+00 -.450397E+00 .275694E+01
04-08 .400025E+00 .417995E+00 -.156035E+01 -.869965E+00 .369667E+01
08-12 .996029E+00 .112322E+01 -.368354E+01 -.221057E+01 .577247E+01
12-16 .795788E+00 .912118E+00 -.388410E+01 -.251610E+01 .719725E+01
16-20 .416649E+00 .821670E+00 -.199945E+01 -.223434E+01 .521205E+01
20-24 .137420E+00 .572644E+00 -.345254E+00 -.150924E+01 .284754E+01
JUN - JUL - AUG
00-04 .232038E+00 .183979E+00 -.116380E+01 -.550627E+00 .294489E+01
04-08 .686566E+00 .435191E+00 -.290795E+01 -.878487E+00 .455870E+01
08-12 .760254E+00 .494537E+00 -.318959E+01 -.969695E+00 .499249E+01
12-16 .956414E+00 .375093E+00 -.436184E+01 -.729336E+00 .636323E+01
16-20 .680902E+00 .331788E+00 -.308260E+01 -.609270E+00 .496306E+01
20-24 .302133E-01 .200021E+00 -.166200E+00 -.521770E+00 .197852E+01
SEP - OCT - NOV
00-04 -.104326E+00 -.796536E-01 -.663268E-01 -.221128E+00 .244773E+01
04-08 .547742E+00 .505893E+00 -.187325E+01 -.747520E+00 .365203E+01
08-12 .927719E+00 .123641E+01 -.299950E+01 -.222166E+01 .514314E+01
12-16 .403634E+00 .695742E+00 -.198732E+01 -.177995E+01 .532871E+01
16-20 .148801E+00 .170572E+00 -.108537E+01 -.747057E+00 .383926E+01
20-24 .208183E-01 .125692E+00 -.290634E+00 -.662367E+00 .244939E+01
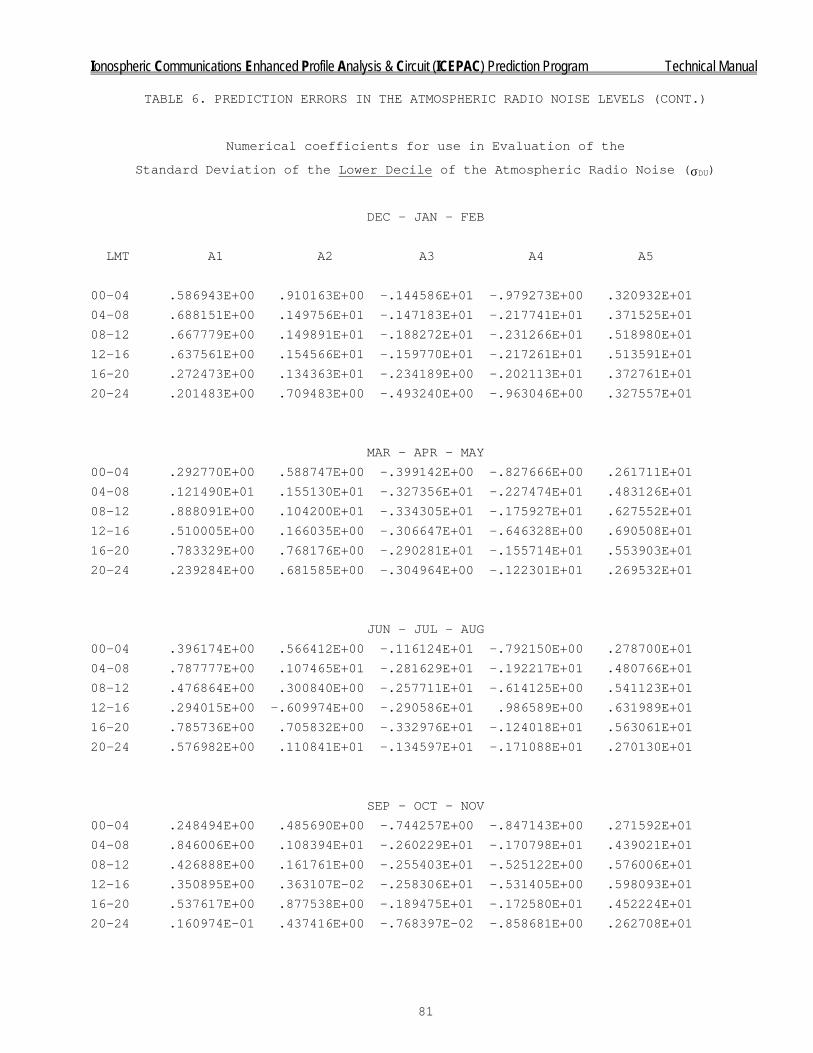
Ionospheric Communications Enhanced Profile Analysis & Circuit (ICEPAC) Prediction Program Technical Manual
81
TABLE 6. PREDICTION ERRORS IN THE ATMOSPHERIC RADIO NOISE LEVELS (CONT.)
Numerical coefficients for use in Evaluation of the
Standard Deviation of the Lower Decile of the Atmospheric Radio Noise (σDU)
DEC - JAN - FEB
LMT A1 A2 A3 A4 A5
00-04 .586943E+00 .910163E+00 -.144586E+01 -.979273E+00 .320932E+01
04-08 .688151E+00 .149756E+01 -.147183E+01 -.217741E+01 .371525E+01
08-12 .667779E+00 .149891E+01 -.188272E+01 -.231266E+01 .518980E+01
12-16 .637561E+00 .154566E+01 -.159770E+01 -.217261E+01 .513591E+01
16-20 .272473E+00 .134363E+01 -.234189E+00 -.202113E+01 .372761E+01
20-24 .201483E+00 .709483E+00 -.493240E+00 -.963046E+00 .327557E+01
MAR - APR - MAY
00-04 .292770E+00 .588747E+00 -.399142E+00 -.827666E+00 .261711E+01
04-08 .121490E+01 .155130E+01 -.327356E+01 -.227474E+01 .483126E+01
08-12 .888091E+00 .104200E+01 -.334305E+01 -.175927E+01 .627552E+01
12-16 .510005E+00 .166035E+00 -.306647E+01 -.646328E+00 .690508E+01
16-20 .783329E+00 .768176E+00 -.290281E+01 -.155714E+01 .553903E+01
20-24 .239284E+00 .681585E+00 -.304964E+00 -.122301E+01 .269532E+01
JUN - JUL - AUG
00-04 .396174E+00 .566412E+00 -.116124E+01 -.792150E+00 .278700E+01
04-08 .787777E+00 .107465E+01 -.281629E+01 -.192217E+01 .480766E+01
08-12 .476864E+00 .300840E+00 -.257711E+01 -.614125E+00 .541123E+01
12-16 .294015E+00 -.609974E+00 -.290586E+01 .986589E+00 .631989E+01
16-20 .785736E+00 .705832E+00 -.332976E+01 -.124018E+01 .563061E+01
20-24 .576982E+00 .110841E+01 -.134597E+01 -.171088E+01 .270130E+01
SEP - OCT - NOV
00-04 .248494E+00 .485690E+00 -.744257E+00 -.847143E+00 .271592E+01
04-08 .846006E+00 .108394E+01 -.260229E+01 -.170798E+01 .439021E+01
08-12 .426888E+00 .161761E+00 -.255403E+01 -.525122E+00 .576006E+01
12-16 .350895E+00 .363107E-02 -.258306E+01 -.531405E+00 .598093E+01
16-20 .537617E+00 .877538E+00 -.189475E+01 -.172580E+01 .452224E+01
20-24 .160974E-01 .437416E+00 -.768397E-02 -.858681E+00 .262708E+01

Ionospheric Communications Enhanced Profile Analysis & Circuit (ICEPAC) Prediction Program Technical Manual
82
Uncertainties in predicting the atmospheric radio noise are given in CCIR
Report 322 (1988) as standard deviations representing the errors in predicting the
median, σFam, upper decile, σDu, and lower decile, σDl. The curves representing the
above variables were generated by a least squares fit with the polynomial (Lucas and
Haydon, 1966)
Y(x) = A1 + A2x + A3x2 + A4x
3 + A5x4, (7.1)
where
Y(x) = σFam, σDl, or σDu,
x = logef,
f = frequency in megahertz.
The coefficients of the polynomial for each of the variables as a function of season,
hemisphere, and time of day are given in table 6.
As already noted, the time availability, qr, refers to the expected percentage
of the hours in the month, used in defining the grade of service, during which the
specified grade of service or better is achieved. The required grade of service is
specified by a required signal-to-noise ratio and when this ratio is equaled or
exceeded, the grade of service will be achieved. However, in calculating the
available signal-to-noise ratio at the receiver, some allowance must be made for the
variations of the hourly median signal levels and hourly median noise levels during
the specified time period. This allowance is termed a protection factor (CCIR,
1988). The day-to-day variations in the hourly median signal level S and noise level
N are assumed to be normally distributed and can be described by the median values
and the deviation DS or DN from the median.
The protection factor, C, in decibels, necessary to provide the required
signal-to-noise ratio, Rm, for the specified time availability, qr, is determined,
with no correlation assumed, from
(7.2)
where
DN = the value in decibels of the median noise power exceeded with a
probability (1 - qr),
[ ] (dB) D + D = C 2S
2N
1/2

Ionospheric Communications Enhanced Profile Analysis & Circuit (ICEPAC) Prediction Program Technical Manual
83
DS = the value in decibels of the median loss exceeded with a
probability (qr).
Values of DS and DN are determined as follows. The standard normal variate ε,
corresponding to a given value of qr, is first obtained from a table in the computer
program. Then,
DN = εDu / 1.28 (7.3)
DS = εSu / 1.28 (7.4)
for values of qr ≥ .50 and
DN = εDl / 1.28 (7.5)
DS = εSl / 1.28 (7.6)
for values of qr < .50
The values of Su (the difference between the excess losses exceeded 16 and 50
percent of the time) and the values of Sl (the difference between the excess losses
exceeded 50 and 84 percent of the time) are given in tables 4 and 5. The upper
decile Du and the lower decile Dl of the median noise power (atmospheric, galactic, or
man-made) are obtained by the methods described in section 5.
With the values of the required signal-to-noise ratio for the specified grade
of service Rmo, and the required protection factor for the specified time availability
C, the median value of the expected required signal power is (CCIR, 1988)
(7.7)
and is the equivalent of (8.1).
The prediction uncertainties are combined into a total uncertainty σt, on the
assumption that the errors are un-correlated, from
where
σr = uncertainty in predicting the required signal-to-noise ratio Rm,
standard deviation assumed to be 2 dB,
σp = standard deviation of estimates of the median received signal level
(dBW) 204 - B + R + C F = P mamme o±
(7.8) (dB), , + + + = 2C
2F
2P
2r
2t am σσσσσ

Ionospheric Communications Enhanced Profile Analysis & Circuit (ICEPAC) Prediction Program Technical Manual
84
S,
σFam = standard deviation of estimates of the median received noise
level N,
σC = standard deviation of C and is composed of the standard error in
predicting the radio noise level DN and the signal level DS
corresponding to the given time availability; σC is a
function of σSu (or σSl) and σDu (or σDl); therefore,
The service probability Qt corresponding to the specified time availability qr
and a given required grade of service gr is now calculated by the normal probability
function.
The above service probability calculation is only valid for frequencies having
a probability of ionospheric support qf equal to one. for frequencies having a
probability of support less than one, the total service probability would be
SPROB = Qt . qf. (7.9)
Figure 8 illustrates the calculations described above that the program
evaluates to obtain estimates of circuit performance based on the service probability
concept. Remember that we are concerned with the system signal levels where the
decile values R.10 and R.90 are the reverse of those associated with system losses.
The two curves illustrate the distributions and service probability estimates for two
different time availabilities qr. The calculated available signal-to-noise ratio for
the frequency and path is 57.5 dB. The probability of ionospheric support qf for the
frequency and path is assumed to be equal to one. Note that the higher time
availability gives a lower service probability. When service probability is used as
a prediction of the expected systems performance, the lowest useful frequency (LUF)
may be defined as the minimum frequency at which the service probability is above a
specified level.
7.3 Multipath Evaluation
The computer program contains a provision for calculating the likelihood of
multipath on a given transmission circuit (Lucas and Haydon, 1966). It is an
.) ( + 1.28
D = 2S
u,
2
2C u,σεε
σσ
l
l

Ionospheric Communications Enhanced Profile Analysis & Circuit (ICEPAC) Prediction Program Technical Manual
85
important consideration for high-speed data transmission systems where interference
due to multipath propagation can cause intolerable bit error rates (Bailey, 1959).
Multipath occurs when signals of comparable amplitude are propagated with
different delay times via two or more paths with a different number of hops. It can
occur a large percent of the time over a wide frequency range. The number of modes
depends on the relationship of the actual operating frequency to the path MUF. At
frequencies near the MUF, multipath is very low or entirely absent. As the operating
frequency is decreased relative to the MUF, the likelihood of other modes being
received is increased, and it is therefore desirable to have some indication of the
presence of multipath for selecting operating frequencies.
If the operator has an adequate choice of frequencies to permit operation where
the likelihood of multipath is low, an adequate signal-to-noise ratio will suffice to
determine circuit performance. If the reliability or service probability of two
frequencies is equal, and one has a greater likelihood of multipath, then the
frequency with the lowest multipath is preferable. It is also possible to reduce
multipath by antenna design or selection.
The probability of multipath is a function of frequency, path length, location,
local time, and season. The program predicts the probability of multipath based upon
some discrete minimum difference in received power and maximum tolerable delay time
between modes. The probability of multipath is assumed to be the probability that a
second sky-wave mode will be present to produce a minimum difference in received
signal powers.
The minimum tolerable difference in received power and maximum tolerable delay
time difference between modes are input parameters to the program and depend on the
communication system used.

Ionospheric Communications Enhanced Profile Analysis & Circuit (ICEPAC) Prediction Program Technical Manual
86
8. MAXIMUM USABLE FREQUENCY (MUF) MODEL
The maximum frequency which will support communications between two points is
an important parameter in radio system design and operation. Because of the
stochastic nature of the ionosphere, it is a very difficult parameter to determine.
This communication analysis program follows the classical philosophy of determining a
MUF based on monthly median ionospheric condition; i.e., to determine the frequency
where the high and low angle rays merge JF (Junction Frequency) using a predicted
ionosphere and to designate this frequency as MUF. Using the day-to-day distribution
of F2MUF (3000) (i.e., MUF at a distance of 3000 kilometers for the F2 layer ), the
percentage of days a given frequency will be below the JF of the F2 region can be
estimated. Frequencies which will be below the JF 90 percent of the days are
classically called optimum traffic frequencies (FOT) and those below the JF only 10
percent of the days are called highest probable frequencies (HPF). For the E and F1
layers, the distribution is taken as normal with a standard deviation of 10 percent
of the MUF.
The sampling of the ionosphere to determine the MUF is the same as it is for
the rest of the models. For short paths, only the middle of the great-circle path is
sampled. for long paths, the MUF is determined from the sample area with the lower
ionization at the ends of the path. It should be noted that in this model
communication does not fail at the MUF, only the signal level starts to sharply
decrease as frequency is increased above the daily MUF.
The MUF calculated this way does not correspond to the maximum observed
frequency (MOF) between two radio systems. The MOF may differ for any of several
reasons: the ionosphere (e.g., foF2) may differ sufficiently from the median, the
signal may be caused by an over-the-MUF mode or some other process such as ground
scatter, or the signal may result from the sporadic-E mode. The 50 percent sporadic-
E MUF is available as an optional output. The predicted MUF corresponds to a
junction frequency, and is not normally measured. Note that no account of
ionospheric storms nor of operational characteristics is taken in the calculation of
the MUF. finally, note that the MUF is not the maximum frequency at which the
program will predict a mode existing between two points on the earth's surfaces.
High-angle rays, over-the-MUF modes, and possible Es modes will predict existing
frequencies over the predicted MUF.

Ionospheric Communications Enhanced Profile Analysis & Circuit (ICEPAC) Prediction Program Technical Manual
87
8.1 GEOMETRY OF THE MUF (JF)
A straightforward method to find the MUF would be simply to evaluate the
complete electron density profile, integrate to find the corresponding virtual
heights, and then use some search technique to find the predicted junction frequency.
In order to simplify the calculations, an alternate procedure has been devised which
is basically an extension of Lucas and Haydon (1966). The major insight is to devise
a method of finding the junction frequency curve as a function of the ionospheric
distance, and frequency. The basic parameter is XT, the ratio of the tangent
frequency ft to the critical frequency of the layer (e.g., foF1). The term tangent
frequency comes from the manual method of transforming a vertical incidence ionogram
into an oblique ionogram for a given distance using a transmission curve. The JF
curve is approximated in three steps. First the equivalent vertical sounding
frequency corresponding to the JF, Ft, is estimated using the equation:
(8.1)
where
Xt is the ratio of ft to the layer critical frequency,
ft is to correspond with the tangent point on the ionogram when using the
transmission curves (NBS, 1948),
ym is the semi-thickness of the layer,
hm is the height of maximum ionization of the layer,
α is an adjustment factor (α = 0.5).
For α = 1, Equation (8.1) is the equation for the point on the ionogram corresponding
to minimum time delay for propagation over a spherical earth and in a flat
ionosphere. When the corrected Martyn's theorem (see Section 3.7.4) is used, Xt
20.0 = 5.5110
= 5.5
hmE = ymE

Ionospheric Communications Enhanced Profile Analysis & Circuit (ICEPAC) Prediction Program Technical Manual
88
starts at the flat ionosphere value for zero distance and approaches the JF value for
longer distances. A value of α = 0.5 approximates the JF line somewhat better with
the ionosphere used in the program. For the F2 layer, a correction to Xt is used to
force the MUF to approach the zero MUF as a function of distance:
(8.2)
where
Xt is modified (i.e., as in FORTRAN),
A = -1. + 1./Xt,
B = 9.5,
D = ground distance,
Do = base distance (2000 km).
The JF curve given by Equation (8.2) with force the curve to rise (or fall) much more
sharply than the actual curve, thus giving a more conservative estimate of the MUF.
Note that the modified Xt approaches 1. at zero distance and approaches the original
value of Xt at Do .
The distinction between long paths and short paths exists for the MUF
calculation also. For long paths, the MUF is that corresponding to an elevation
angle of zero or the minimum angle desired. An electron density profile is
generated, Xt is calculated for each layer, table lookup is used to find the true
height, and the secant law is used to find the MUF (no correction factor as the true
height is used). The relevant equations are:
ft = Xt fc , (8.3)
where
ft = vertical tangent frequency,
) )DD/ (-B A + 1 ( X = X ott exp

Ionospheric Communications Enhanced Profile Analysis & Circuit (ICEPAC) Prediction Program Technical Manual
89
Xt = is given by Equation (57),
fc = zero MUF,
= foE for E layer,
= foF1 for F1 layer,
= foF2 + 1/2 fH for the F2 layer,
fH = gyrofrequency.
For the short path, the mode structure must be determined. This implies
calculation of the elevation angle, and thus use of the corrected form of Martyn's
theorem. The latter implies an integration of the electron density profile and an
iteration for the virtual height. For the E layer, the correction to Martyn's
theorem is small and may be omitted. The equations are:
(8.4)
where
N = number of hops. ([ ] here implies truncation and the first ∆ is zero or
minimum takeoff angle ∆),
D = ground distance,
a = earth radius,
φ' = angle at virtual height h',
ψ = hop distance angle,
1 +)a)] - - /2 ( D/( [ = N φπ ′∆

Ionospheric Communications Enhanced Profile Analysis & Circuit (ICEPAC) Prediction Program Technical Manual
90
φ = angle at true height hT,
ft = vertical tangent frequency.
For the E layer, using the parameters ymE = 20, hmE = 110 (which can be changed
by user via input), the value of Xt is
Xt = .957,
which gives, using the electron density profile described in Section 3,
hT = 104 as true height, and
h' = 130 as virtual height.
For the F1 and F2 layers, Equation (8.3) and (8.4) are used to find an initial
(h' , ∆) pair. Then the virtual height is corrected (as for corrected Martyn's
theorem) and a new ∆ and MUF is found. This corrective procedure is repeated until
the change is MUF is less than a specified value or until a maximum number of
iterations have been performed (only one repetition normally results).
The sporadic-E MUF is found using the predicted foEs and the secant factor with
the true height and virtual height taken as equal (normally 110 km in the program).

Ionospheric Communications Enhanced Profile Analysis & Circuit (ICEPAC) Prediction Program Technical Manual
91
9. ACKNOWLEDGEMENTS
This report is the result of the efforts of many groups and individuals. It is
a technical description of ICEPAC with orientation toward the PC computer use. The
wording is sometimes an extraction of reports describing the scientific basis for
this program. In regard to individuals, the following list may not include everyone,
but hopefully the majority will be mentioned. The author wishes to acknowledge the
contributions of Mr. J. Washburn, Mr. A.F. Barghausen, Dr. Mark T. Ma, Mr. D.H.
Zacharisen, Dr. E.L. Crow, Mr. G.W. Haydon, Mr. D.L. Lucas, Mr. J.L. Lloyd, Mr. G.R.
Hand, Dr. A.D. Spaulding, Dr. R.K. Rosich, Mr. L.R. Teeters, Mr. R.M. Davis Jr., and
many others who have been instrumental in the evolution of the propagation programs
and documentation.