Icelandic Seafood Market Report November 2015
32
November 2015 Icelandic Seafood Market Report
Transcript of Icelandic Seafood Market Report November 2015
November 2015
Icelandic SeafoodMarket Report

Publisher:
Íslandsbanki Research
Authors:
Elvar Orri Hreinsson 440 4747,
Ingólfur Bender 440 4635
Issue date: November 26th, 2015
Editor: Ingólfur Bender, Executive Director +3544404635

Fishing has been one of Iceland’s most important economic activities ever since the island was settled, thanks to the fact that some of the most bountiful fishing grounds in the North Atlantic lie within Iceland’s territorial waters. Access to and management of fishing off the coast of Iceland has played a vital role in transforming the country from one of Europe’s poorest countries to one of the wealthiest. The importance of fishing to the Icelandic economy has always been beyond dispute; however, in recent decades, the pillars of the economy have increased in number with the addition of aluminium production and the growth of tourism. In terms of current investment and innovation in the sector, it is clear that fishing will continue to play a leading role in the Icelandic economy for the foreseeable future.
Íslandsbanki has issued reports on the Icelandic fishing sector since 2003. The aim of the reports is to give domestic and foreign readers insight into recent developments and the current state of the industry. Íslandsbanki’s fishing industry reports have been published in both Icelandic and English.
Íslandsbanki Seafood Industry Team
Over the years, Íslandsbanki’s fishing industry reports have changed in line with the constantly changing Icelandic fishing sector, reflecting the Bank’s focus on analysing topics of current relevance. The present report includes discussions of the domestic labour market, oil prices, and the exchange rate of the Icelandic króna (ISK). As it did last year, the Bank benefited from the assistance of Deloitte in preparing the discussion of fishery operations. We extend our sincere thanks to Deloitte staff for their efforts.
Foreword
Ingi Fannar EirikssonLoan [email protected]
Halldor Ragnar GislasonLoan [email protected]
Timothy H. SpanosExecutive DirectorInternational Lending timothy.spanos @islandsbanki.is
Runölfur Geir BenediktssonExecutive DirectorSeafood and [email protected]
Ragnar GudjonssonBusiness [email protected]
Olafur Hrafn OlafssonBusiness ManagerSeafoodolafur.hrafn.olafsson @islandsbanki.is
Elvar Orri HreinssonAnalystResearchelvar.orri.hreinsson @islandsbanki.is
Vilhelm Mar ThorsteinssonManaging DirectorCorporate Bankingvilhelm.thorsteinsson @islandsbanki.is
4 Icelandic Seafood Market Report
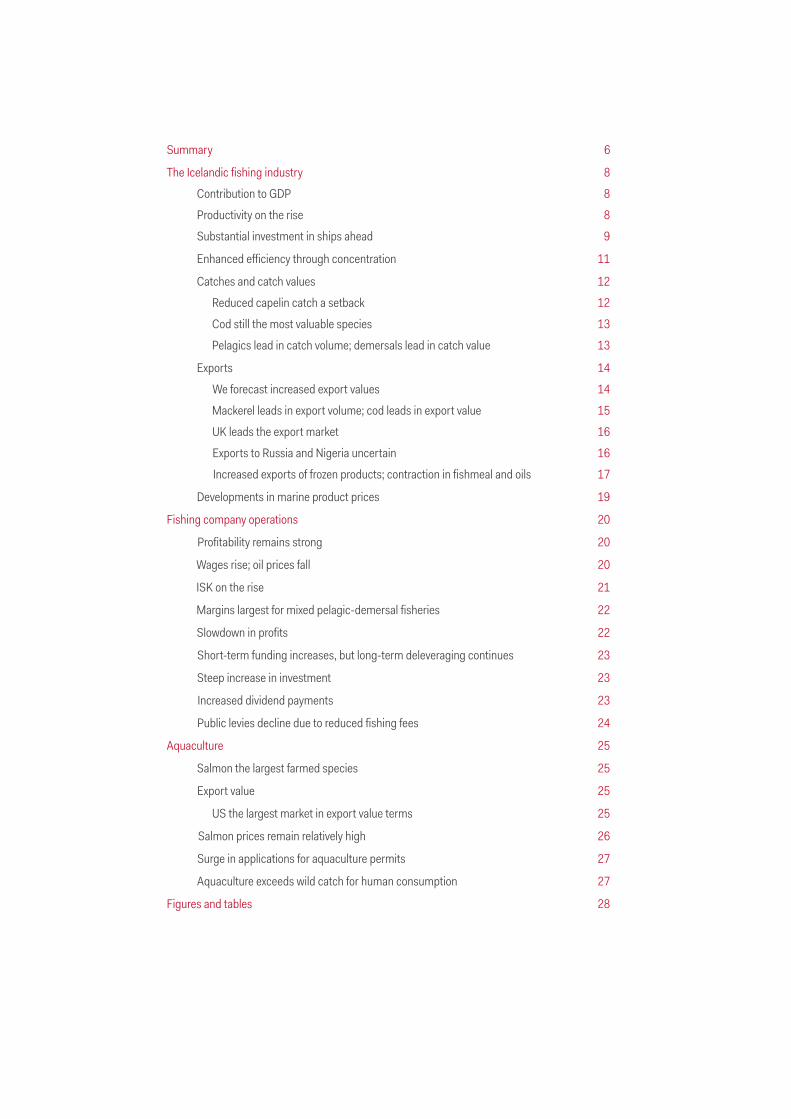
Figure 1. Íslandsbanki’s corporate loan portfolioby sector Q3/2015
Source: Íslandsbanki
Real estatefirms
Retail tradeand services
Industry and transport
Other
26%
22%
Fisheries
22%16%
14%
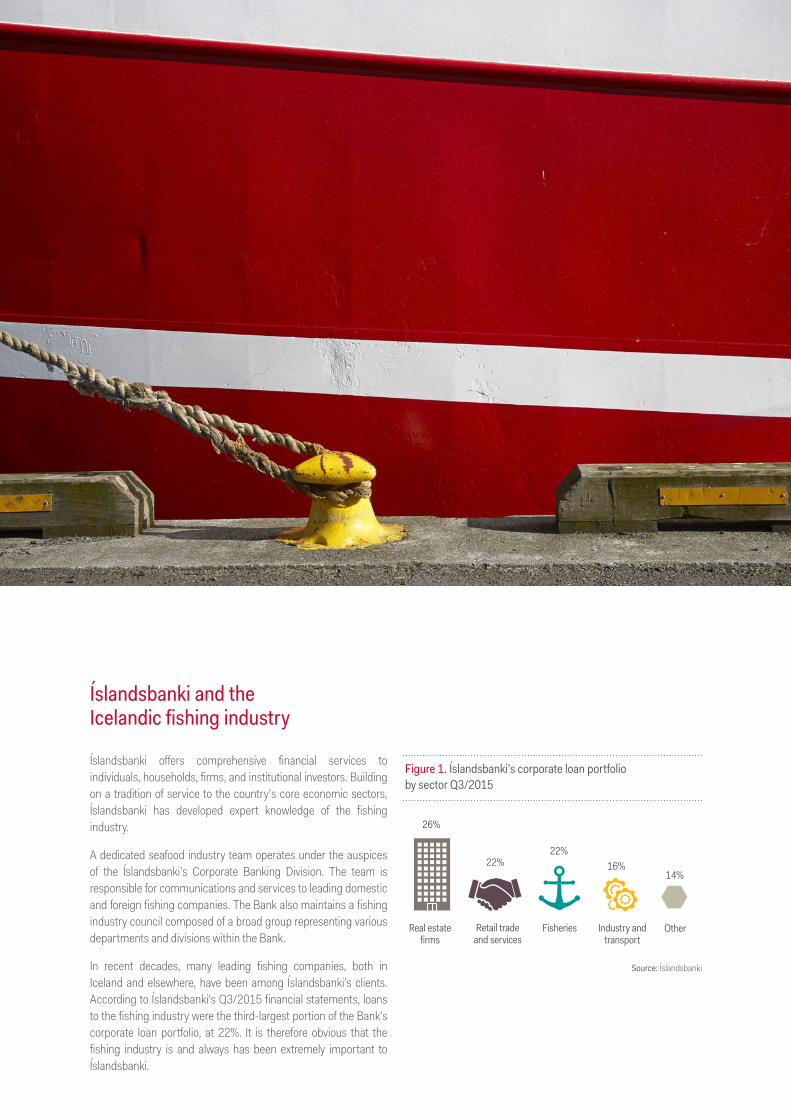
Íslandsbanki offers comprehensive financial services to individuals, households, firms, and institutional investors. Building on a tradition of service to the country’s core economic sectors, Íslandsbanki has developed expert knowledge of the fishing industry.
A dedicated seafood industry team operates under the auspices of the Íslandsbanki’s Corporate Banking Division. The team is responsible for communications and services to leading domestic and foreign fishing companies. The Bank also maintains a fishing industry council composed of a broad group representing various departments and divisions within the Bank.
In recent decades, many leading fishing companies, both in Iceland and elsewhere, have been among Íslandsbanki’s clients. According to Íslandsbanki’s Q3/2015 financial statements, loans to the fishing industry were the third-largest portion of the Bank’s corporate loan portfolio, at 22%. It is therefore obvious that the fishing industry is and always has been extremely important to Íslandsbanki.
Íslandsbanki and the Icelandic fishing industry
Summary 6
The Icelandic fishing industry 8
Contribution to GDP 8
Productivity on the rise 8
Substantial investment in ships ahead 9
Enhanced efficiency through concentration 11
Catches and catch values 12
Reduced capelin catch a setback 12
Cod still the most valuable species 13
Pelagics lead in catch volume; demersals lead in catch value 13
Exports 14
We forecast increased export values 14
Mackerel leads in export volume; cod leads in export value 15
UK leads the export market 16
Exports to Russia and Nigeria uncertain 16
Increased exports of frozen products; contraction in fishmeal and oils 17
Developments in marine product prices 19
Fishing company operations 20
Profitability remains strong 20
Wages rise; oil prices fall 20
ISK on the rise 21
Margins largest for mixed pelagic-demersal fisheries 22
Slowdown in profits 22
Short-term funding increases, but long-term deleveraging continues 23
Steep increase in investment 23
Increased dividend payments 23
Public levies decline due to reduced fishing fees 24
Aquaculture 25
Salmon the largest farmed species 25
Export value 25
US the largest market in export value terms 25
Salmon prices remain relatively high 26
Surge in applications for aquaculture permits 27
Aquaculture exceeds wild catch for human consumption 27
Figures and tables 28
6 Icelandic Seafood Market Report
• The fishing industry’s contribution to GDP measured 8.4% in 2014, a contraction of 1.1 percentage points year-on-year. The Icelandic Ocean Cluster has assessed the sector’s combined direct and indirect contribution to GDP at a much higher figure, or 25-30%.
• Each full-time position equivalent in the fishing sector currently generates more than twice as much value (at constant prices) as it did in 1997. Productivity has grown with the increased automation that accompanies technological advances in fishing and marine product processing. Increased efficiency in operation of fisheries and the value creation deriving from full utilisation of catches has also contributed to productivity growth in the sector.
• Fisheries’ revenues were unchanged year-on-year in 2014, at ISK 262bn. EBITDA was ISK 61bn, and EBITDA margins for 2014 were unchanged from the prior year. At constant 2014 prices, revenues contracted by 2% year-on-year, owing mainly to a contraction in catch values between years.
• The contribution margins of mixed pelagic and demersal fisheries are higher (27%) than those of demersal fisheries (22%) and demersal fishing and processing companies (19%). Nonetheless, mixed pelagic and demersal fisheries’ margins contracted between 2013 and 2014, while margins rose for the other two groups because the price of demersals developed more favourably than the price of pelagics.
• Fishing companies’ liabilities totalled ISK 363bn in 2014, an increase of just over 6% between years. They fell to a post-crisis low of ISK 341bn in 2013, after having risen by ISK 153bn, or 31%, since 2009.
• Investment totalled ISK 27bn in 2014, an increase of 145% between years. As a share of EBITDA, it measured 44%, up 26 percentage points from the prior year.
• Dividend payments to fishing company owners totalled ISK 13.5bn in 2014, a year-on-year increase of ISK 1.7bn, or 14%. As a share of EBITDA, dividends rose 3 percentage points, to 22%.
• Public levies paid by fisheries totalled ISK 22.9bn in 2014, having decreased by ISK 1.6bn, or 6.5%, between years. The greatest difference was in fishing fees, which fell ISK 1.6bn, or 16.5%, year-on-year. Income tax paid by fisheries in 2014 totalled ISK 8.8bn, an increase of 1.1%, and payroll tax was estimated at ISK 6bn, a decline of 1.6% year-on-year.
• Cod dominated the catch for the year, at 240,000 tonnes, or 22% of the total. Cod catches were up nearly 4,000 tonnes, or 1.5%, year-on-year, followed by blue whiting (183,000 tonnes), mackerel (171,000), herring (159,000), and capelin (12,000). Of major species, catches increased most for blue whiting (71%) and mackerel (11%).
Summary
7Icelandic Seafood Market Report
• The greatest value is in demersals, even though pelagic catches are much larger by weight, as more value is obtained for each kilogram of demersal fish caught than for each kilogram of pelagic fish. For example, demersal fish accounted for 39% of the total 2014 catch in terms of volume, yet it generated 68% of the year’s total catch value.
• We expect marine product exports to rise by 7.0% in real terms this year, followed by 3.1% in 2016 and 2.1% in 2017, owing to a large increase in the cod quota, a successful capelin season earlier this year, and other factors. We also expect marine product prices to rise by over 3% through 2017. After adjusting for this, the value of marine product exports will be about ISK 40bn higher in 2017 than in 2014.
• Cod generated the greatest export value in 2014, at ISK 89.6bn, or 37% of the total, exceeding the value of all pelagic species combined by ISK 26.6bn. The export value of cod was up ISK 1.8bn, or 2%, between years.
• Fresh products have contracted in volume terms by 47% since 2000, whereas their value has increased by 94% over the same period. Of all marine product categories, fresh products have increased most in value since 2000, or about 268%. In 2014, they generated the greatest value per tonne, at ISK 799,000.
• For the first time since 2006, salmon is Iceland’s leading aquaculture species. In 2014, a total of 3,965 tonnes were harvested, an increase of 900 tonnes year-on-year. Arctic charr was the second-largest farmed species, with a harvest of 3,411 tonnes in 2014, an increase of 200 tonnes from the prior year. The 2015 harvest is projected to reach an all-time Icelandic aquaculture record of 11,605 tonnes.
• The export value of farmed products was about ISK 5,482m in 2014, as opposed to ISK 4,874m in 2013. As before, the US was the largest market for aquaculture products, with about 40% of total value, followed by the UK, with about 9.8%, and Germany, with 8.2%.
• At present, Icelandic aquaculture permits have been issued for the production of 20,500 tonnes of farmed fish per year, and the National Planning Agency currently has pending applications for an additional 69,300 tonnes per year. Optimism appears to carry the day in the Icelandic aquaculture sector, and there is stiff competition for good fish farming areas.
8 Icelandic Seafood Market Report
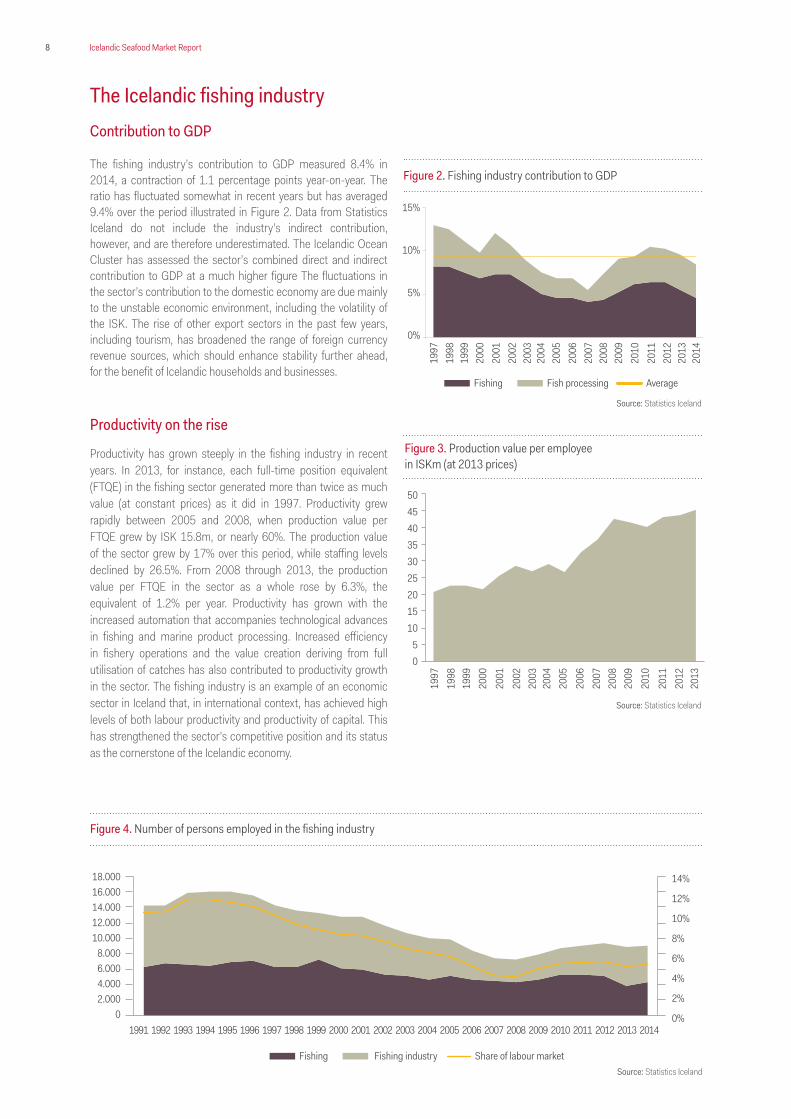
The Icelandic fishing industryContribution to GDP
The fishing industry’s contribution to GDP measured 8.4% in 2014, a contraction of 1.1 percentage points year-on-year. The ratio has fluctuated somewhat in recent years but has averaged 9.4% over the period illustrated in Figure 2. Data from Statistics Iceland do not include the industry’s indirect contribution, however, and are therefore underestimated. The Icelandic Ocean Cluster has assessed the sector’s combined direct and indirect contribution to GDP at a much higher figure The fluctuations in the sector’s contribution to the domestic economy are due mainly to the unstable economic environment, including the volatility of the ISK. The rise of other export sectors in the past few years, including tourism, has broadened the range of foreign currency revenue sources, which should enhance stability further ahead, for the benefit of Icelandic households and businesses.
Productivity on the rise
Productivity has grown steeply in the fishing industry in recent years. In 2013, for instance, each full-time position equivalent (FTQE) in the fishing sector generated more than twice as much value (at constant prices) as it did in 1997. Productivity grew rapidly between 2005 and 2008, when production value per FTQE grew by ISK 15.8m, or nearly 60%. The production value of the sector grew by 17% over this period, while staffing levels declined by 26.5%. From 2008 through 2013, the production value per FTQE in the sector as a whole rose by 6.3%, the equivalent of 1.2% per year. Productivity has grown with the increased automation that accompanies technological advances in fishing and marine product processing. Increased efficiency in fishery operations and the value creation deriving from full utilisation of catches has also contributed to productivity growth in the sector. The fishing industry is an example of an economic sector in Iceland that, in international context, has achieved high levels of both labour productivity and productivity of capital. This has strengthened the sector’s competitive position and its status as the cornerstone of the Icelandic economy.
Figure 3. Production value per employeein ISKm (at 2013 prices)
Source: Statistics Iceland
504540353025201510
50
1997
2003
2000
2006
2011
1998
2004
2009
2001
2007
2012
1999
2005
2010
2002
2008
2013
Figure 2. Fishing industry contribution to GDP
15%
10%
5%
0%
Fishing Fish processing Average
1997
2003
2000
2006
2011
1998
2004
2009
2001
2007
2012
1999
2005
2010
2002
2008
2013
2014
Figure 4. Number of persons employed in the fishing industry
Source: Statistics Iceland
Source: Statistics Iceland
1991 1992 1993 1994 1995 1996 1997 1998 1999 2000 2001 2002 2003 2004 2005 2006 2007 2008 2009 2010 2011 2012 2013 2014
Fishing Fishing industry Share of labour market
18.00016.00014.00012.00010.000
8.0006.0004.0002.000
0
14%
12%
10%
8%
6%
4%
2%
0%
9Icelandic Seafood Market Report
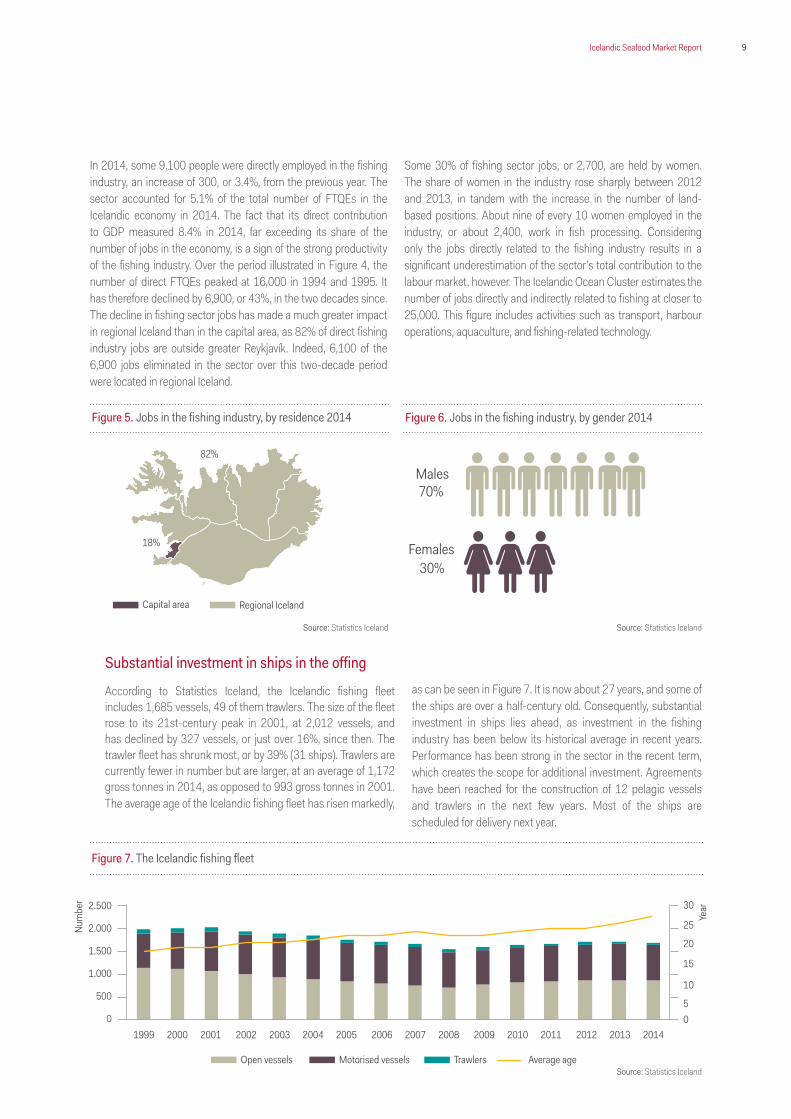
In 2014, some 9,100 people were directly employed in the fishing industry, an increase of 300, or 3.4%, from the previous year. The sector accounted for 5.1% of the total number of FTQEs in the Icelandic economy in 2014. The fact that its direct contribution to GDP measured 8.4% in 2014, far exceeding its share of the number of jobs in the economy, is a sign of the strong productivity of the fishing industry. Over the period illustrated in Figure 4, the number of direct FTQEs peaked at 16,000 in 1994 and 1995. It has therefore declined by 6,900, or 43%, in the two decades since. The decline in fishing sector jobs has made a much greater impact in regional Iceland than in the capital area, as 82% of direct fishing industry jobs are outside greater Reykjavík. Indeed, 6,100 of the 6,900 jobs eliminated in the sector over this two-decade period were located in regional Iceland.
Some 30% of fishing sector jobs, or 2,700, are held by women. The share of women in the industry rose sharply between 2012 and 2013, in tandem with the increase in the number of land-based positions. About nine of every 10 women employed in the industry, or about 2,400, work in fish processing. Considering only the jobs directly related to the fishing industry results in a significant underestimation of the sector’s total contribution to the labour market, however. The Icelandic Ocean Cluster estimates the number of jobs directly and indirectly related to fishing at closer to 25,000. This figure includes activities such as transport, harbour operations, aquaculture, and fishing-related technology.
Source: Statistics Iceland Source: Statistics Iceland
Source: Statistics Iceland
Figure 5. Jobs in the fishing industry, by residence 2014
Capital area Regional Iceland
18%
82%
Figure 6. Jobs in the fishing industry, by gender 2014
Females
Males70%
30%
2.500
2.000
1.500
1.000
500
0
30
25
20
15
10
50
Figure 7. The Icelandic fishing fleet
Open vessels Motorised vessels Trawlers Average age 1999 2000 2001 2002 2003 2004 2005 2006 2007 2008 2009 2010 2011 2012 2013 2014
Substantial investment in ships in the offing
According to Statistics Iceland, the Icelandic fishing fleet includes 1,685 vessels, 49 of them trawlers. The size of the fleet rose to its 21st-century peak in 2001, at 2,012 vessels, and has declined by 327 vessels, or just over 16%, since then. The trawler fleet has shrunk most, or by 39% (31 ships). Trawlers are currently fewer in number but are larger, at an average of 1,172 gross tonnes in 2014, as opposed to 993 gross tonnes in 2001. The average age of the Icelandic fishing fleet has risen markedly,
as can be seen in Figure 7. It is now about 27 years, and some of the ships are over a half-century old. Consequently, substantial investment in ships lies ahead, as investment in the fishing industry has been below its historical average in recent years. Performance has been strong in the sector in the recent term, which creates the scope for additional investment. Agreements have been reached for the construction of 12 pelagic vessels and trawlers in the next few years. Most of the ships are scheduled for delivery next year.
Num
ber
Year
10 Icelandic Seafood Market Report
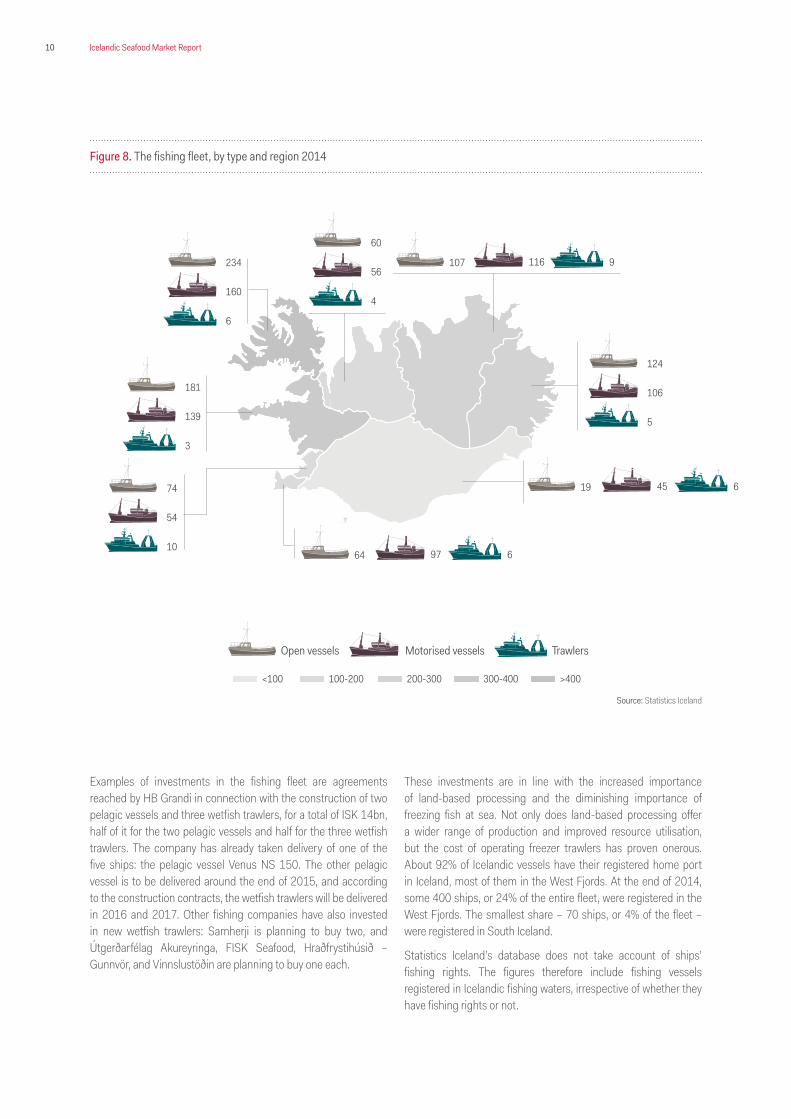
Examples of investments in the fishing fleet are agreements reached by HB Grandi in connection with the construction of two pelagic vessels and three wetfish trawlers, for a total of ISK 14bn, half of it for the two pelagic vessels and half for the three wetfish trawlers. The company has already taken delivery of one of the five ships: the pelagic vessel Venus NS 150. The other pelagic vessel is to be delivered around the end of 2015, and according to the construction contracts, the wetfish trawlers will be delivered in 2016 and 2017. Other fishing companies have also invested in new wetfish trawlers: Samherji is planning to buy two, and Útgerðarfélag Akureyringa, FISK Seafood, Hraðfrystihúsið – Gunnvör, and Vinnslustöðin are planning to buy one each.
These investments are in line with the increased importance of land-based processing and the diminishing importance of freezing fish at sea. Not only does land-based processing offer a wider range of production and improved resource utilisation, but the cost of operating freezer trawlers has proven onerous. About 92% of Icelandic vessels have their registered home port in Iceland, most of them in the West Fjords. At the end of 2014, some 400 ships, or 24% of the entire fleet, were registered in the West Fjords. The smallest share – 70 ships, or 4% of the fleet – were registered in South Iceland.
Statistics Iceland’s database does not take account of ships’ fishing rights. The figures therefore include fishing vessels registered in Icelandic fishing waters, irrespective of whether they have fishing rights or not.
Figure 8. The fishing fleet, by type and region 2014
Open vessels Motorised vessels Trawlers
60
56
4
74
54
10
19 45 6
64 97 6
107 116 9234
160
6
124
106
5
181
139
3
Source: Statistics Iceland
<100 100-200 200-300 300-400 >400
11Icelandic Seafood Market Report
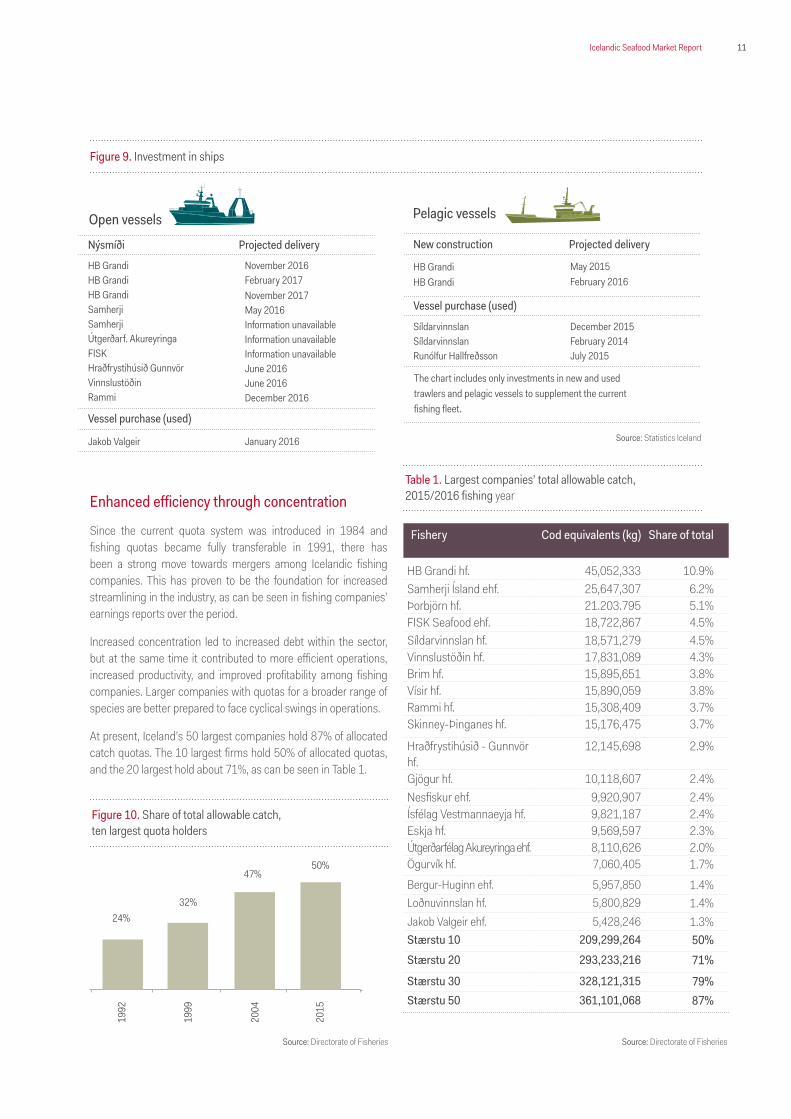
Enhanced efficiency through concentration
Since the current quota system was introduced in 1984 and fishing quotas became fully transferable in 1991, there has been a strong move towards mergers among Icelandic fishing companies. This has proven to be the foundation for increased streamlining in the industry, as can be seen in fishing companies’ earnings reports over the period.
Increased concentration led to increased debt within the sector, but at the same time it contributed to more efficient operations, increased productivity, and improved profitability among fishing companies. Larger companies with quotas for a broader range of species are better prepared to face cyclical swings in operations.
At present, Iceland’s 50 largest companies hold 87% of allocated catch quotas. The 10 largest firms hold 50% of allocated quotas, and the 20 largest hold about 71%, as can be seen in Table 1.
Open vessels
Nýsmíði Projected delivery
HB GrandiHB GrandiHB GrandiSamherjiSamherjiÚtgerðarf. AkureyringaFISKHraðfrystihúsið GunnvörVinnslustöðinRammi
November 2016February 2017November 2017May 2016Information unavailableInformation unavailableInformation unavailableJune 2016June 2016December 2016
Vessel purchase (used)
Jakob Valgeir January 2016
New construction Projected delivery
Vessel purchase (used)
HB GrandiHB Grandi
SíldarvinnslanSíldarvinnslanRunólfur Hallfreðsson
The chart includes only investments in new and used trawlers and pelagic vessels to supplement the current fishing fleet.
May 2015February 2016
December 2015February 2014July 2015
Pelagic vessels
Figure 9. Investment in ships
24%32%
47%50%
1992
1999
2004
2015
Figure 10. Share of total allowable catch,ten largest quota holders
Source: Directorate of Fisheries
Fishery Cod equivalents (kg) Share of total
HB Grandi hf. 45,052,333 10.9%Samherji Ísland ehf. 25,647,307 6.2%Þorbjörn hf. 21.203.795 5.1%FISK Seafood ehf. 18,722,867 4.5%Síldarvinnslan hf. 18,571,279 4.5%Vinnslustöðin hf. 17,831,089 4.3%Brim hf. 15,895,651 3.8%Vísir hf. 15,890,059 3.8%Rammi hf. 15,308,409 3.7%Skinney-Þinganes hf. 15,176,475 3.7%
Hraðfrystihúsið - Gunnvör hf.
12,145,698 2.9%
Gjögur hf. 10,118,607 2.4%Nesfiskur ehf. 9,920,907 2.4%Ísfélag Vestmannaeyja hf. 9,821,187 2.4%Eskja hf. 9,569,597 2.3%Útgerðarfélag Akureyringa ehf. 8,110,626 2.0%Ögurvík hf. 7,060,405 1.7%Bergur-Huginn ehf. 5,957,850 1.4%Loðnuvinnslan hf. 5,800,829 1.4%Jakob Valgeir ehf. 5,428,246 1.3%Stærstu 10 209,299,264 50%Stærstu 20 293,233,216 71%
Stærstu 30 328,121,315 79%Stærstu 50 361,101,068 87%
Table 1. Largest companies’ total allowable catch,2015/2016 fishing year
Source: Directorate of Fisheries
Source: Statistics Iceland
12 Icelandic Seafood Market Report
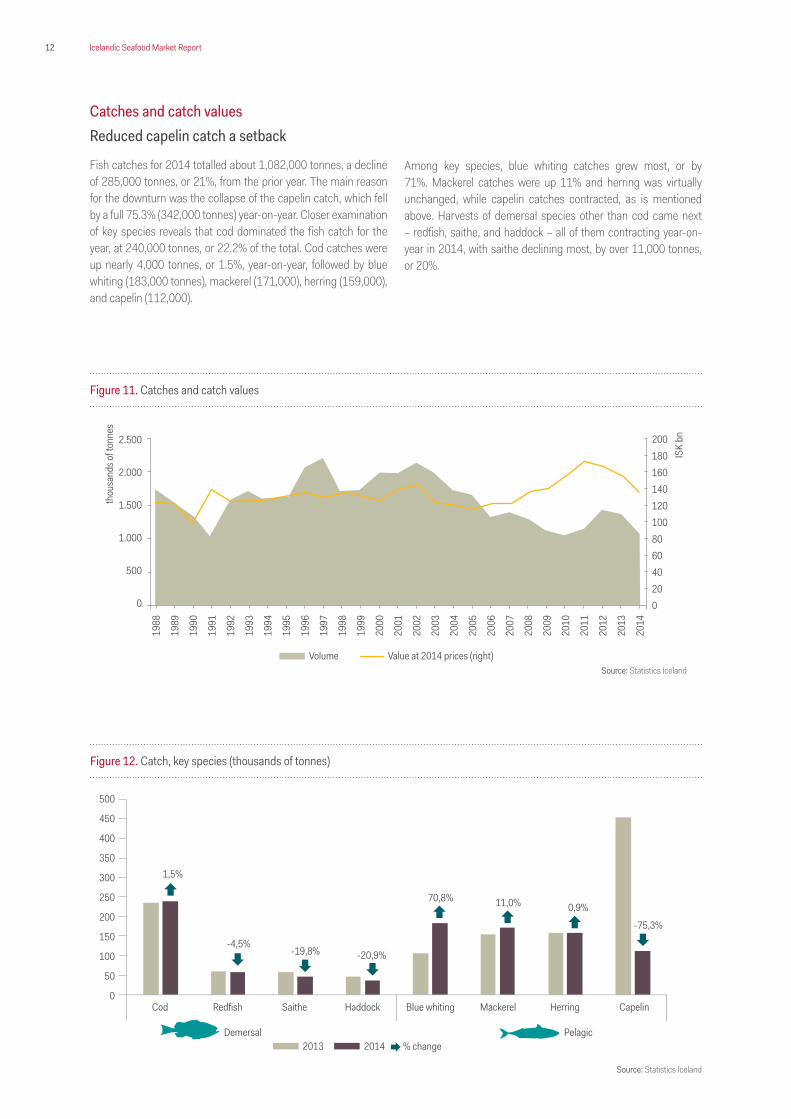
Catches and catch valuesReduced capelin catch a setback
Fish catches for 2014 totalled about 1,082,000 tonnes, a decline of 285,000 tonnes, or 21%, from the prior year. The main reason for the downturn was the collapse of the capelin catch, which fell by a full 75.3% (342,000 tonnes) year-on-year. Closer examination of key species reveals that cod dominated the fish catch for the year, at 240,000 tonnes, or 22.2% of the total. Cod catches were up nearly 4,000 tonnes, or 1.5%, year-on-year, followed by blue whiting (183,000 tonnes), mackerel (171,000), herring (159,000), and capelin (112,000).
Among key species, blue whiting catches grew most, or by 71%. Mackerel catches were up 11% and herring was virtually unchanged, while capelin catches contracted, as is mentioned above. Harvests of demersal species other than cod came next – redfish, saithe, and haddock – all of them contracting year-on-year in 2014, with saithe declining most, by over 11,000 tonnes, or 20%.
Figure 11. Catches and catch values
2.500
2.000
1.500
1.000
500
0
200180160140120100806040200
ISK
bn
thou
sand
s of t
onne
s
1988
1992
1996
2000
2004
2008
1989
1993
1997
2001
2005
2009
1990
1994
1998
2002
2006
2010
2012
1991
1995
1999
2003
2007
2011
2013
2014
Volume Value at 2014 prices (right)
Figure 12. Catch, key species (thousands of tonnes)
Cod Redfish Saithe Haddock Blue whiting Mackerel Herring Capelin
2013 2014 % change
500
450
400
350
300
250
200
150
100
50
0
1,5%
-4,5%-19,8% -20,9%
70,8% 11,0% 0,9%
-75,3%
Demersal Pelagic
Source: Statistics Iceland
Source: Statistics Iceland
13Icelandic Seafood Market Report
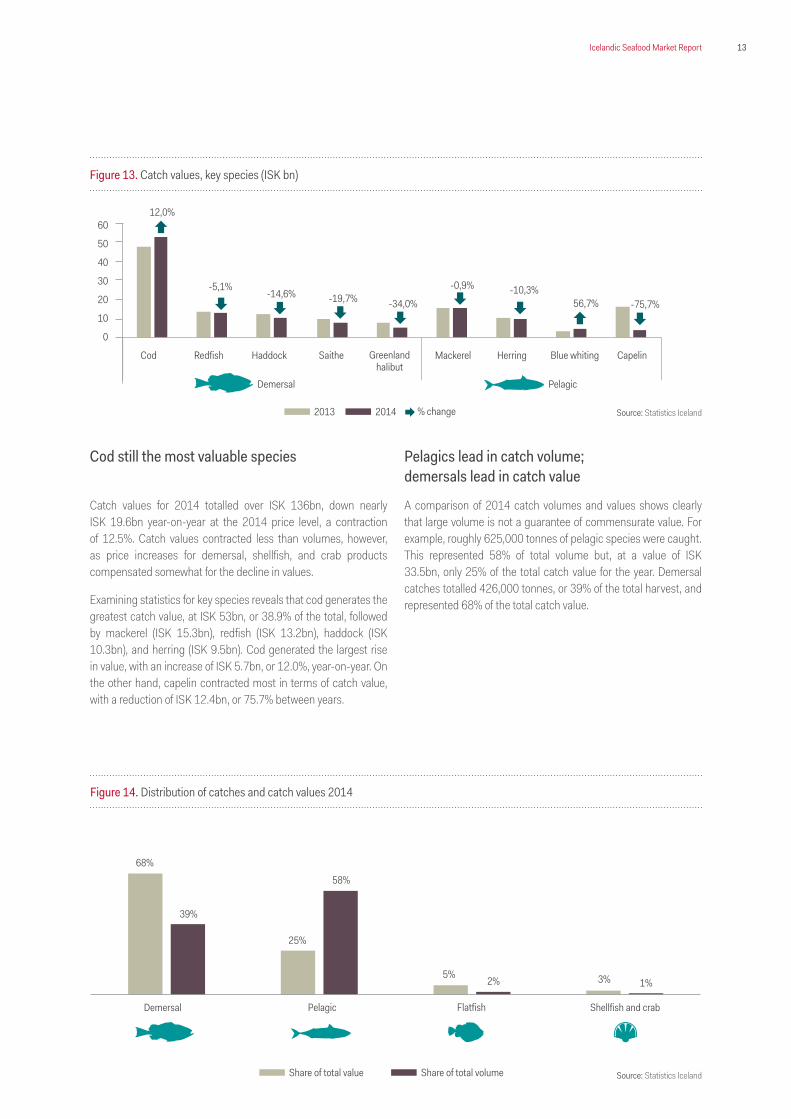
Cod still the most valuable species
Catch values for 2014 totalled over ISK 136bn, down nearly ISK 19.6bn year-on-year at the 2014 price level, a contraction of 12.5%. Catch values contracted less than volumes, however, as price increases for demersal, shellfish, and crab products compensated somewhat for the decline in values.
Examining statistics for key species reveals that cod generates the greatest catch value, at ISK 53bn, or 38.9% of the total, followed by mackerel (ISK 15.3bn), redfish (ISK 13.2bn), haddock (ISK 10.3bn), and herring (ISK 9.5bn). Cod generated the largest rise in value, with an increase of ISK 5.7bn, or 12.0%, year-on-year. On the other hand, capelin contracted most in terms of catch value, with a reduction of ISK 12.4bn, or 75.7% between years.
Pelagics lead in catch volume; demersals lead in catch value
A comparison of 2014 catch volumes and values shows clearly that large volume is not a guarantee of commensurate value. For example, roughly 625,000 tonnes of pelagic species were caught. This represented 58% of total volume but, at a value of ISK 33.5bn, only 25% of the total catch value for the year. Demersal catches totalled 426,000 tonnes, or 39% of the total harvest, and represented 68% of the total catch value.
Figure 13. Catch values, key species (ISK bn)
Cod Greenlandhalibut
Mackerel Herring Blue whiting CapelinRedfish SaitheHaddock
2013 2014
60
50
40
30
20
10
0
Figure 14. Distribution of catches and catch values 2014
Demersal Pelagic Flatfish Shellfish and crab
68%
25%
5% 3%
39%
58%
2% 1%
Share of total value Share of total volume
12,0%
-5,1% -14,6% -19,7% -34,0%
-0,9% -10,3% 56,7% -75,7%
Demersal Pelagic
Source: Statistics Iceland
Source: Statistics Iceland% change
14 Icelandic Seafood Market Report
Exports
We forecast increased export values
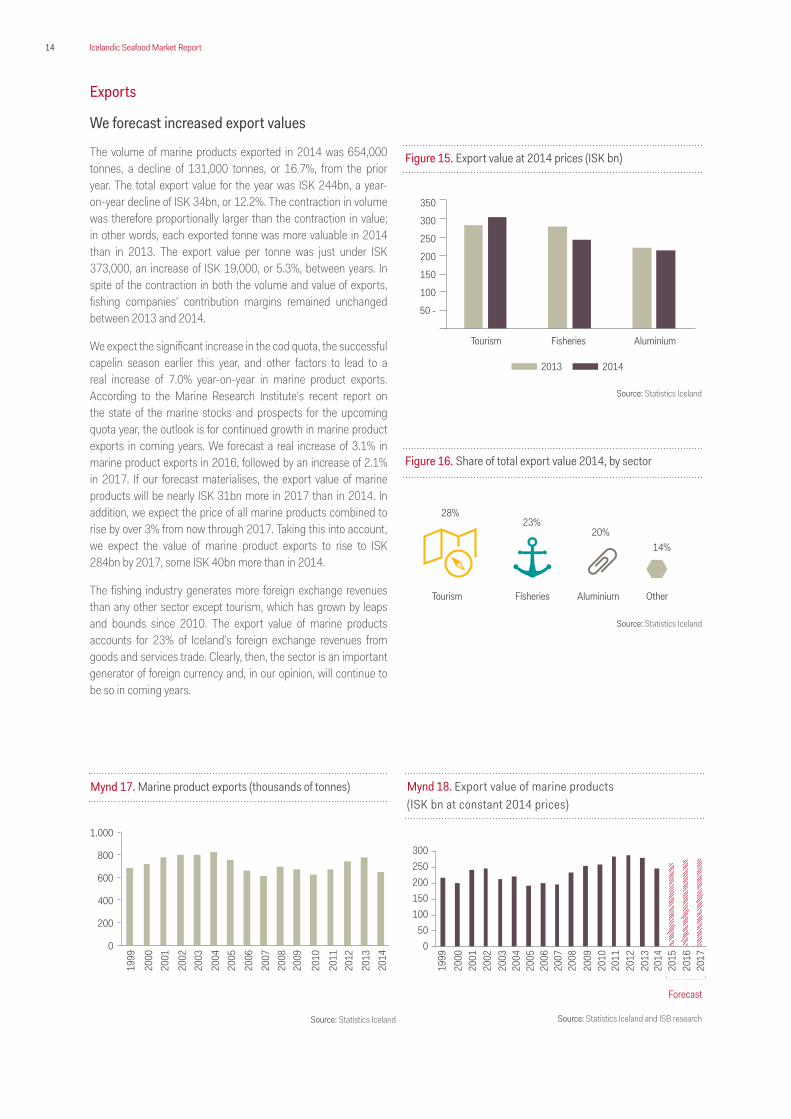
The volume of marine products exported in 2014 was 654,000 tonnes, a decline of 131,000 tonnes, or 16.7%, from the prior year. The total export value for the year was ISK 244bn, a year-on-year decline of ISK 34bn, or 12.2%. The contraction in volume was therefore proportionally larger than the contraction in value; in other words, each exported tonne was more valuable in 2014 than in 2013. The export value per tonne was just under ISK 373,000, an increase of ISK 19,000, or 5.3%, between years. In spite of the contraction in both the volume and value of exports, fishing companies’ contribution margins remained unchanged between 2013 and 2014.
We expect the significant increase in the cod quota, the successful capelin season earlier this year, and other factors to lead to a real increase of 7.0% year-on-year in marine product exports. According to the Marine Research Institute’s recent report on the state of the marine stocks and prospects for the upcoming quota year, the outlook is for continued growth in marine product exports in coming years. We forecast a real increase of 3.1% in marine product exports in 2016, followed by an increase of 2.1% in 2017. If our forecast materialises, the export value of marine products will be nearly ISK 31bn more in 2017 than in 2014. In addition, we expect the price of all marine products combined to rise by over 3% from now through 2017. Taking this into account, we expect the value of marine product exports to rise to ISK 284bn by 2017, some ISK 40bn more than in 2014.
The fishing industry generates more foreign exchange revenues than any other sector except tourism, which has grown by leaps and bounds since 2010. The export value of marine products accounts for 23% of Iceland’s foreign exchange revenues from goods and services trade. Clearly, then, the sector is an important generator of foreign currency and, in our opinion, will continue to be so in coming years.
Figure 15. Export value at 2014 prices (ISK bn)
350
300
250
200
150
100
50 -
Fisheries AluminiumTourism
2013 2014
Source: Statistics Iceland
Other
14%
Fisheries AluminiumTourism
23%20%
28%
Figure 16. Share of total export value 2014, by sector
Source: Statistics Iceland
Source: Statistics Iceland Source: Statistics Iceland and ISB research
Mynd 17. Marine product exports (thousands of tonnes)
1.000
800
600
400
200
0
1999
2000
2001
2002
2003
2004
2005
2006
2007
2008
2009
2010
2011
2012
2013
2014
Mynd 18. Export value of marine products(ISK bn at constant 2014 prices)
300250200150100
500
1999
2000
2001
2002
2003
2004
2005
2006
2007
2008
2009
2010
2011
2012
2013
2014
2015
2016
2017
Forecast
15Icelandic Seafood Market Report
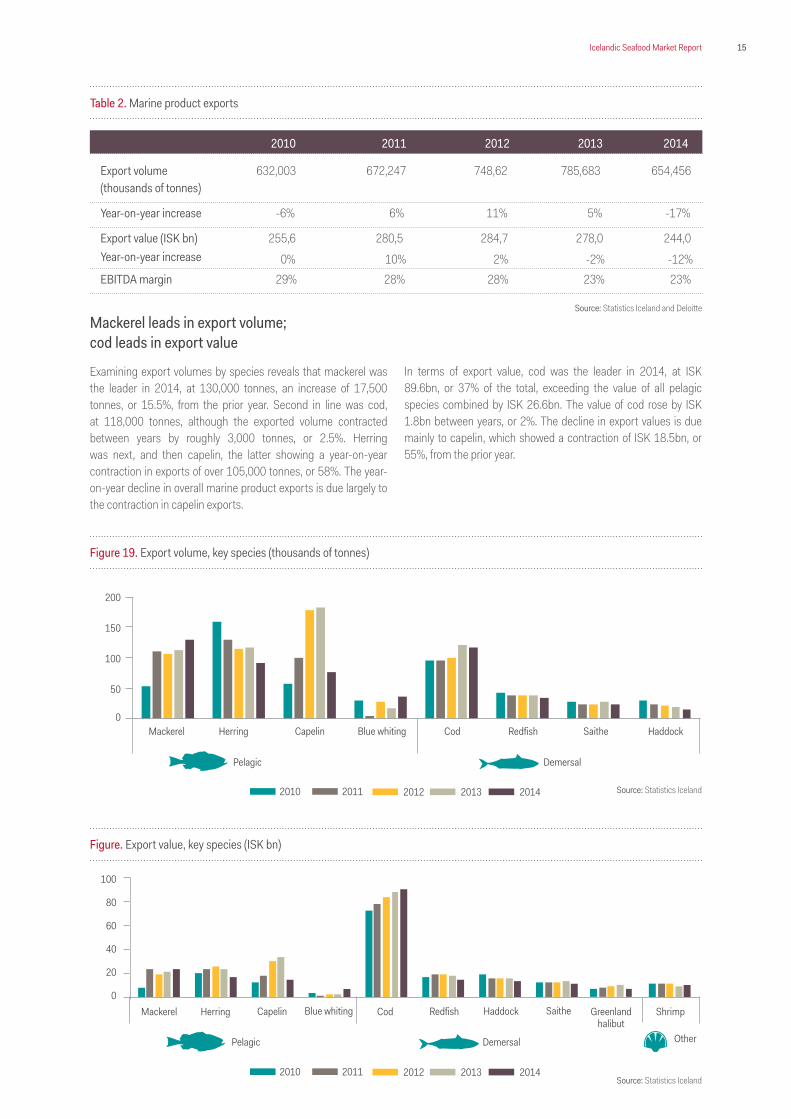
Mackerel leads in export volume; cod leads in export value
Examining export volumes by species reveals that mackerel was the leader in 2014, at 130,000 tonnes, an increase of 17,500 tonnes, or 15.5%, from the prior year. Second in line was cod, at 118,000 tonnes, although the exported volume contracted between years by roughly 3,000 tonnes, or 2.5%. Herring was next, and then capelin, the latter showing a year-on-year contraction in exports of over 105,000 tonnes, or 58%. The year-on-year decline in overall marine product exports is due largely to the contraction in capelin exports.
In terms of export value, cod was the leader in 2014, at ISK 89.6bn, or 37% of the total, exceeding the value of all pelagic species combined by ISK 26.6bn. The value of cod rose by ISK 1.8bn between years, or 2%. The decline in export values is due mainly to capelin, which showed a contraction of ISK 18.5bn, or 55%, from the prior year.
2010 2011 2012 2013 2014
Export volume (thousands of tonnes)
632,003 672,247 748,62 785,683 654,456
Year-on-year increase -6% 6% 11% 5% -17%
Export value (ISK bn)Year-on-year increase
255,6 280,5 284,7 278,0 244,0
0% 10% 2% -2% -12%EBITDA margin 29% 28% 28% 23% 23%
Table 2. Marine product exports
Source: Statistics Iceland and Deloitte
Figure 19. Export volume, key species (thousands of tonnes)
200
150
100
50
0CodMackerel Herring Blue whitingCapelin Redfish Saithe Haddock
2012 2013 20142010 2011
DemersalPelagic
Source: Statistics Iceland
Figure. Export value, key species (ISK bn)
100
80
60
40
20
0CodMackerel Herring Blue whitingCapelin Redfish SaitheHaddock ShrimpGreenland
halibut
2012 2013 20142010 2011
Demersal OtherPelagic
Source: Statistics Iceland
16 Icelandic Seafood Market Report
Haddock
UK leads the export market
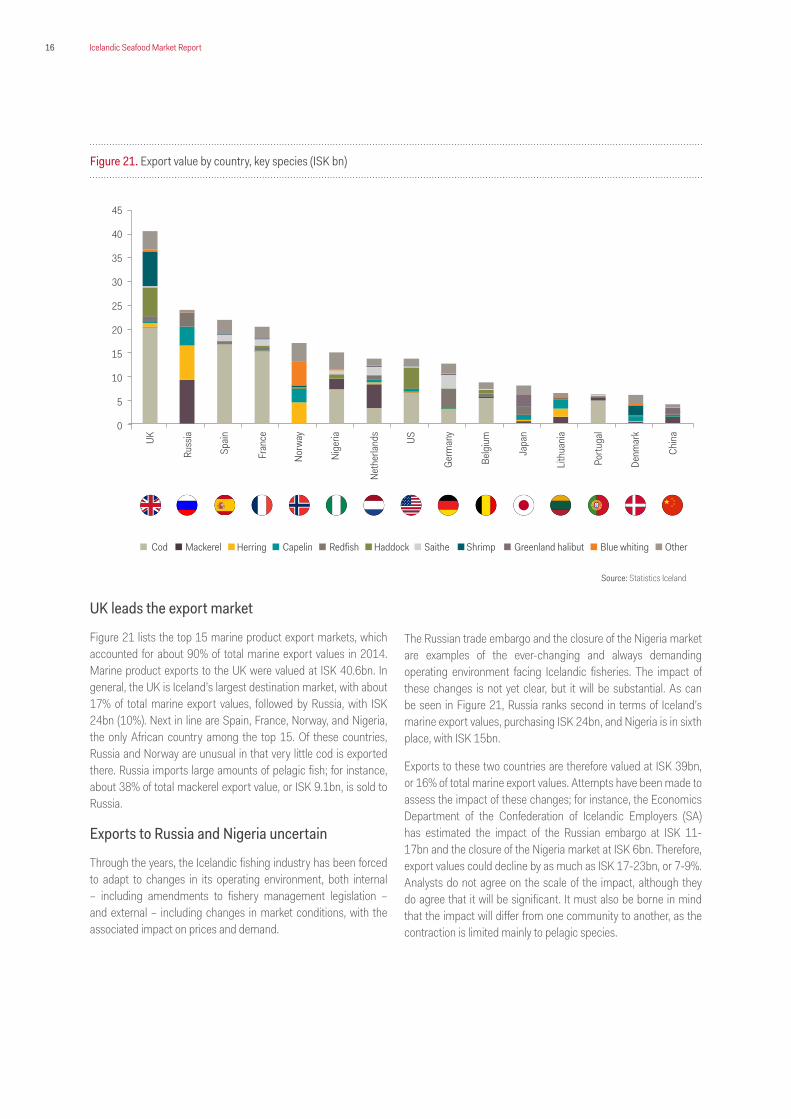
Figure 21 lists the top 15 marine product export markets, which accounted for about 90% of total marine export values in 2014. Marine product exports to the UK were valued at ISK 40.6bn. In general, the UK is Iceland’s largest destination market, with about 17% of total marine export values, followed by Russia, with ISK 24bn (10%). Next in line are Spain, France, Norway, and Nigeria, the only African country among the top 15. Of these countries, Russia and Norway are unusual in that very little cod is exported there. Russia imports large amounts of pelagic fish; for instance, about 38% of total mackerel export value, or ISK 9.1bn, is sold to Russia.
Exports to Russia and Nigeria uncertain
Through the years, the Icelandic fishing industry has been forced to adapt to changes in its operating environment, both internal – including amendments to fishery management legislation – and external – including changes in market conditions, with the associated impact on prices and demand.
The Russian trade embargo and the closure of the Nigeria market are examples of the ever-changing and always demanding operating environment facing Icelandic fisheries. The impact of these changes is not yet clear, but it will be substantial. As can be seen in Figure 21, Russia ranks second in terms of Iceland’s marine export values, purchasing ISK 24bn, and Nigeria is in sixth place, with ISK 15bn.
Exports to these two countries are therefore valued at ISK 39bn, or 16% of total marine export values. Attempts have been made to assess the impact of these changes; for instance, the Economics Department of the Confederation of Icelandic Employers (SA) has estimated the impact of the Russian embargo at ISK 11-17bn and the closure of the Nigeria market at ISK 6bn. Therefore, export values could decline by as much as ISK 17-23bn, or 7-9%. Analysts do not agree on the scale of the impact, although they do agree that it will be significant. It must also be borne in mind that the impact will differ from one community to another, as the contraction is limited mainly to pelagic species.
Figure 21. Export value by country, key species (ISK bn)
45
40
35
30
25
20
15
10
5
0
UK
Russ
ia
Spain
Fran
ce
Germ
any
Norw
ay
Belg
ium
Nige
ria
Japa
n
Neth
erlan
ds
Lithu
aniaUS
Portu
gal
Denm
ark
Chin
a
Cod Mackerel Herring Capelin Redfish Saithe Shrimp Greenland halibut Blue whiting Other
Source: Statistics Iceland
17Icelandic Seafood Market Report
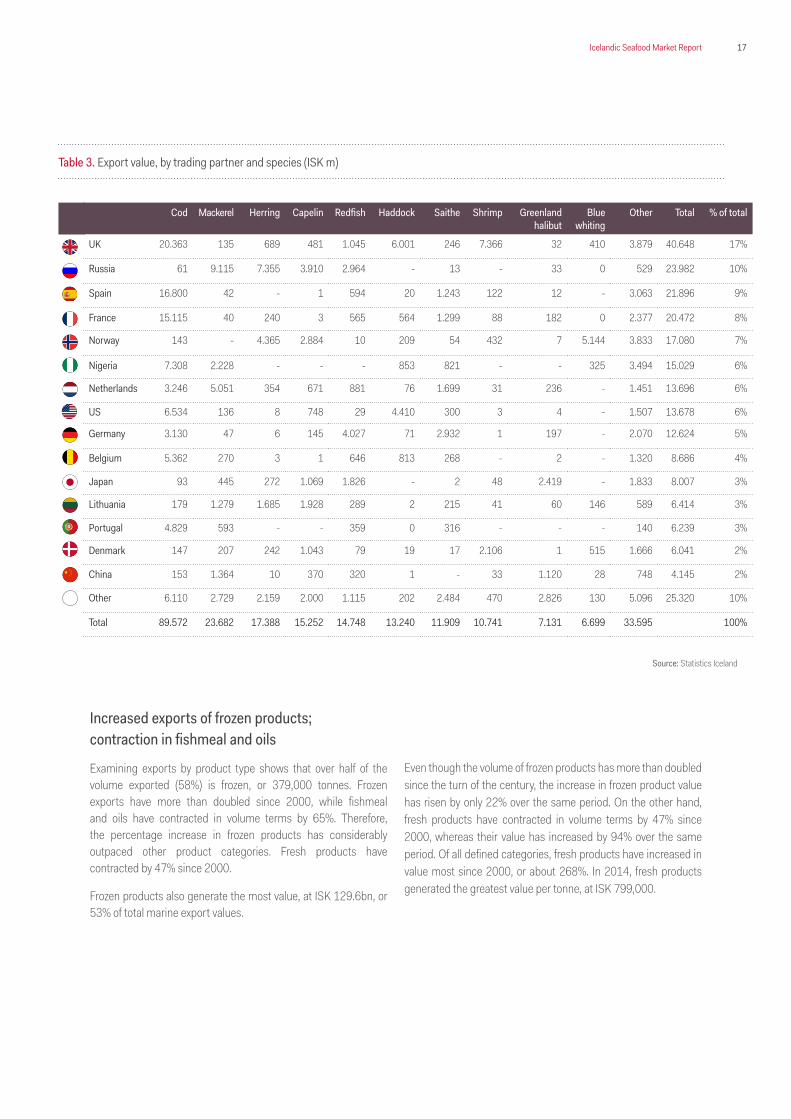
Table 3. Export value, by trading partner and species (ISK m)
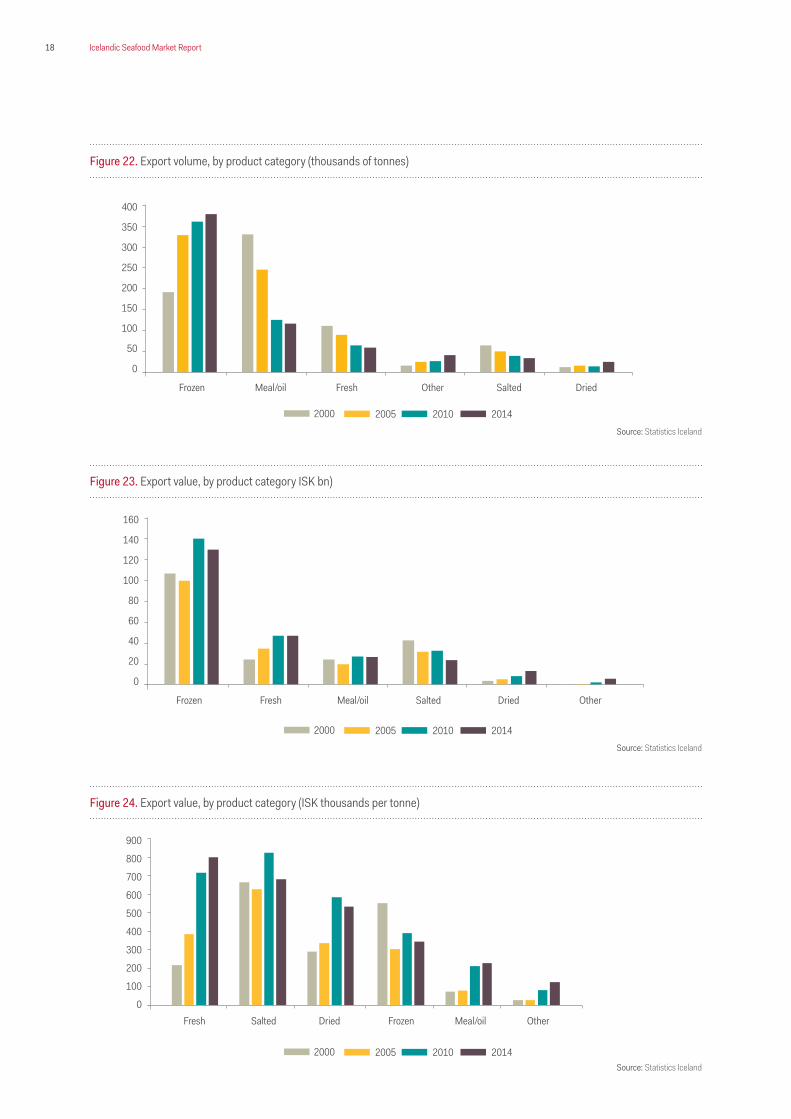
Increased exports of frozen products; contraction in fishmeal and oils
Examining exports by product type shows that over half of the volume exported (58%) is frozen, or 379,000 tonnes. Frozen exports have more than doubled since 2000, while fishmeal and oils have contracted in volume terms by 65%. Therefore, the percentage increase in frozen products has considerably outpaced other product categories. Fresh products have contracted by 47% since 2000.
Frozen products also generate the most value, at ISK 129.6bn, or 53% of total marine export values.
Even though the volume of frozen products has more than doubled since the turn of the century, the increase in frozen product value has risen by only 22% over the same period. On the other hand, fresh products have contracted in volume terms by 47% since 2000, whereas their value has increased by 94% over the same period. Of all defined categories, fresh products have increased in value most since 2000, or about 268%. In 2014, fresh products generated the greatest value per tonne, at ISK 799,000.
Cod Mackerel Herring Capelin Redfish Haddock Saithe Shrimp Greenland halibut
Blue whiting
Other Total
% of total
UK 20.363 135 689 481 1.045 6.001 246 7.366 32 410 3.879 40.648 17%
Russia 61 9.115 7.355 3.910 2.964 - 13 - 33 0 529 23.982 10%
Spain 16.800 42 - 1 594 20 1.243 122 12 - 3.063 21.896 9%
France 15.115 40 240 3 565 564 1.299 88 182 0 2.377 20.472 8%
Norway 143 - 4.365 2.884 10 209 54 432 7 5.144 3.833 17.080 7%
Nigeria 7.308 2.228 - - - 853 821 - - 325 3.494 15.029 6%
Netherlands 3.246 5.051 354 671 881 76 1.699 31 236 - 1.451 13.696 6%
US 6.534 136 8 748 29 4.410 300 3 4 - 1.507 13.678 6%
Germany 3.130 47 6 145 4.027 71 2.932 1 197 - 2.070 12.624 5%
Belgium 5.362 270 3 1 646 813 268 - 2 - 1.320 8.686 4%
Japan 93 445 272 1.069 1.826 - 2 48 2.419 - 1.833 8.007 3%
Lithuania 179 1.279 1.685 1.928 289 2 215 41 60 146 589 6.414 3%
Portugal 4.829 593 - - 359 0 316 - - - 140 6.239 3%
Denmark 147 207 242 1.043 79 19 17 2.106 1 515 1.666 6.041 2%
China 153 1.364 10 370 320 1 - 33 1.120 28 748 4.145 2%
Other 6.110 2.729 2.159 2.000 1.115 202 2.484 470 2.826 130 5.096 25.320 10%
Total 89.572 23.682 17.388 15.252 14.748 13.240 11.909 10.741 7.131 6.699 33.595 100%
Source: Statistics Iceland
18 Icelandic Seafood Market Report
400
350
300
250
200
150
100
50
0
Frozen Meal/oil Fresh Other Salted Dried
Figure 22. Export volume, by product category (thousands of tonnes)
Figure 23. Export value, by product category ISK bn)
160
140
120
100
80
60
40
20
0
Frozen Fresh Meal/oil Salted Dried Other
Figure 24. Export value, by product category (ISK thousands per tonne)
900
800
700
600
500
400
300
200
100
0Fresh Salted Dried Frozen Meal/oil Other
2005 2010 20142000
2005 2010 20142000
2005 2010 20142000
Source: Statistics Iceland
Source: Statistics Iceland
Source: Statistics Iceland
19Icelandic Seafood Market Report
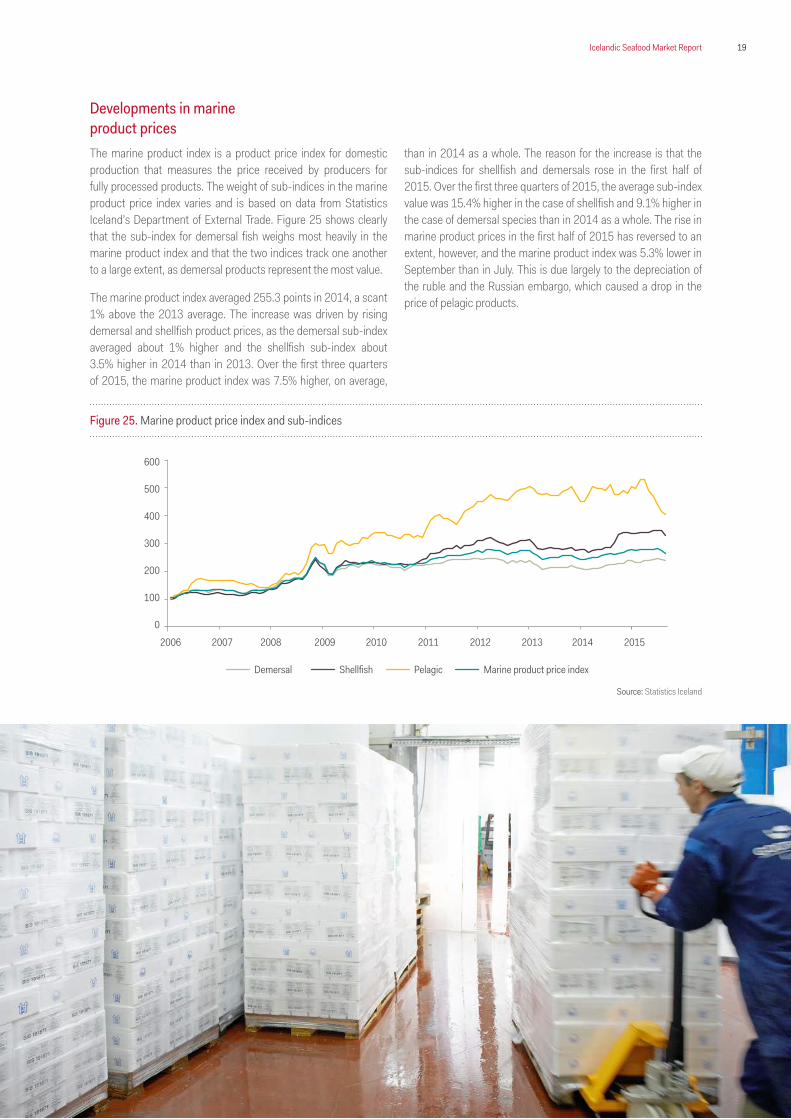
Developments in marine product pricesThe marine product index is a product price index for domestic production that measures the price received by producers for fully processed products. The weight of sub-indices in the marine product price index varies and is based on data from Statistics Iceland’s Department of External Trade. Figure 25 shows clearly that the sub-index for demersal fish weighs most heavily in the marine product index and that the two indices track one another to a large extent, as demersal products represent the most value.
The marine product index averaged 255.3 points in 2014, a scant 1% above the 2013 average. The increase was driven by rising demersal and shellfish product prices, as the demersal sub-index averaged about 1% higher and the shellfish sub-index about 3.5% higher in 2014 than in 2013. Over the first three quarters of 2015, the marine product index was 7.5% higher, on average,
than in 2014 as a whole. The reason for the increase is that the sub-indices for shellfish and demersals rose in the first half of 2015. Over the first three quarters of 2015, the average sub-index value was 15.4% higher in the case of shellfish and 9.1% higher in the case of demersal species than in 2014 as a whole. The rise in marine product prices in the first half of 2015 has reversed to an extent, however, and the marine product index was 5.3% lower in September than in July. This is due largely to the depreciation of the ruble and the Russian embargo, which caused a drop in the price of pelagic products.
Figure 25. Marine product price index and sub-indices
600
500
400
300
200
100
02006 2007 2008 2009 2010 2011 2012 2013 2014 2015
Demersal Shellfish Pelagic Marine product price index
Source: Statistics Iceland
20 Icelandic Seafood Market Report
Fishing company operations
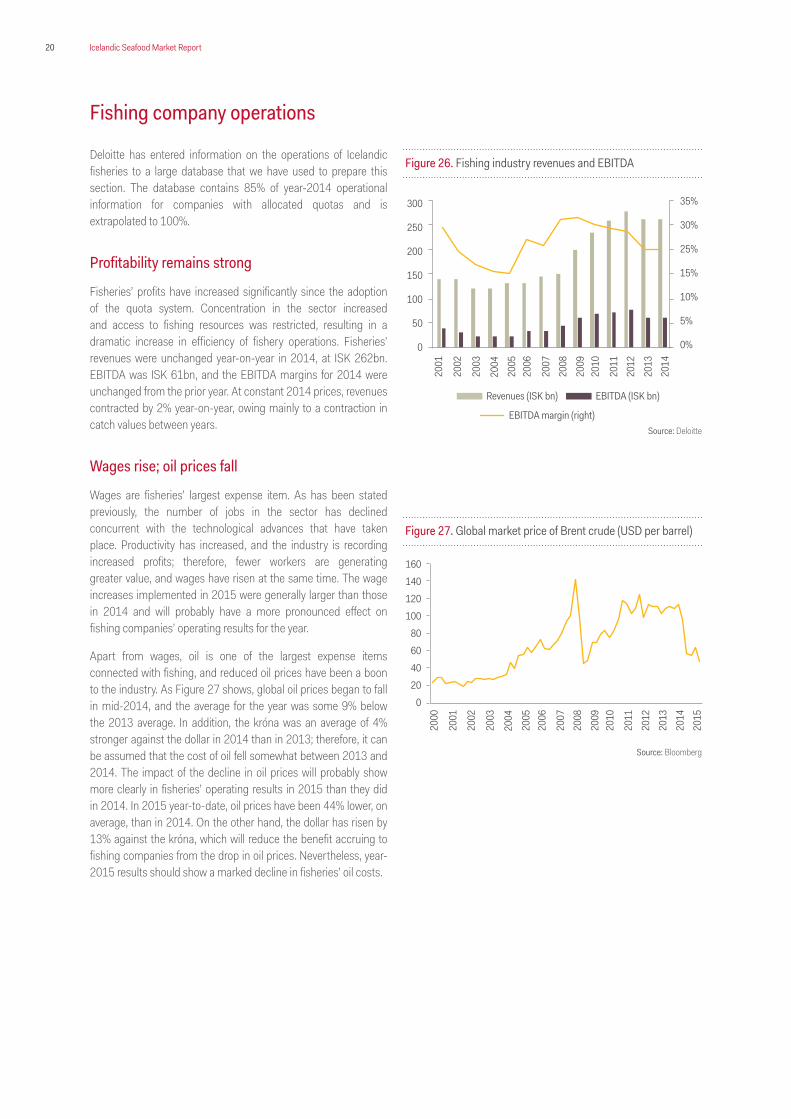
Deloitte has entered information on the operations of Icelandic fisheries to a large database that we have used to prepare this section. The database contains 85% of year-2014 operational information for companies with allocated quotas and is extrapolated to 100%.
Profitability remains strong
Fisheries’ profits have increased significantly since the adoption of the quota system. Concentration in the sector increased and access to fishing resources was restricted, resulting in a dramatic increase in efficiency of fishery operations. Fisheries’ revenues were unchanged year-on-year in 2014, at ISK 262bn. EBITDA was ISK 61bn, and the EBITDA margins for 2014 were unchanged from the prior year. At constant 2014 prices, revenues contracted by 2% year-on-year, owing mainly to a contraction in catch values between years.
Wages rise; oil prices fall
Wages are fisheries’ largest expense item. As has been stated previously, the number of jobs in the sector has declined concurrent with the technological advances that have taken place. Productivity has increased, and the industry is recording increased profits; therefore, fewer workers are generating greater value, and wages have risen at the same time. The wage increases implemented in 2015 were generally larger than those in 2014 and will probably have a more pronounced effect on fishing companies’ operating results for the year.
Apart from wages, oil is one of the largest expense items connected with fishing, and reduced oil prices have been a boon to the industry. As Figure 27 shows, global oil prices began to fall in mid-2014, and the average for the year was some 9% below the 2013 average. In addition, the króna was an average of 4% stronger against the dollar in 2014 than in 2013; therefore, it can be assumed that the cost of oil fell somewhat between 2013 and 2014. The impact of the decline in oil prices will probably show more clearly in fisheries’ operating results in 2015 than they did in 2014. In 2015 year-to-date, oil prices have been 44% lower, on average, than in 2014. On the other hand, the dollar has risen by 13% against the króna, which will reduce the benefit accruing to fishing companies from the drop in oil prices. Nevertheless, year-2015 results should show a marked decline in fisheries’ oil costs.
Figure 26. Fishing industry revenues and EBITDA
300
250
200
150
100
50
0
35%
30%
25%
15%
10%
5%
0%
Revenues (ISK bn) EBITDA (ISK bn)
EBITDA margin (right)
2003
2006
2011
2004
2009
2001
2007
2012
2005
2010
2002
2008
2013
2014
Figure 27. Global market price of Brent crude (USD per barrel)
160140120100
80604020
0
2003
2006
2011
2004
2009
2001
2000
2007
2012
2005
2010
2002
2008
2013
2014
2015
Source: Deloitte
Source: Bloomberg
21Icelandic Seafood Market Report
ISK on the rise
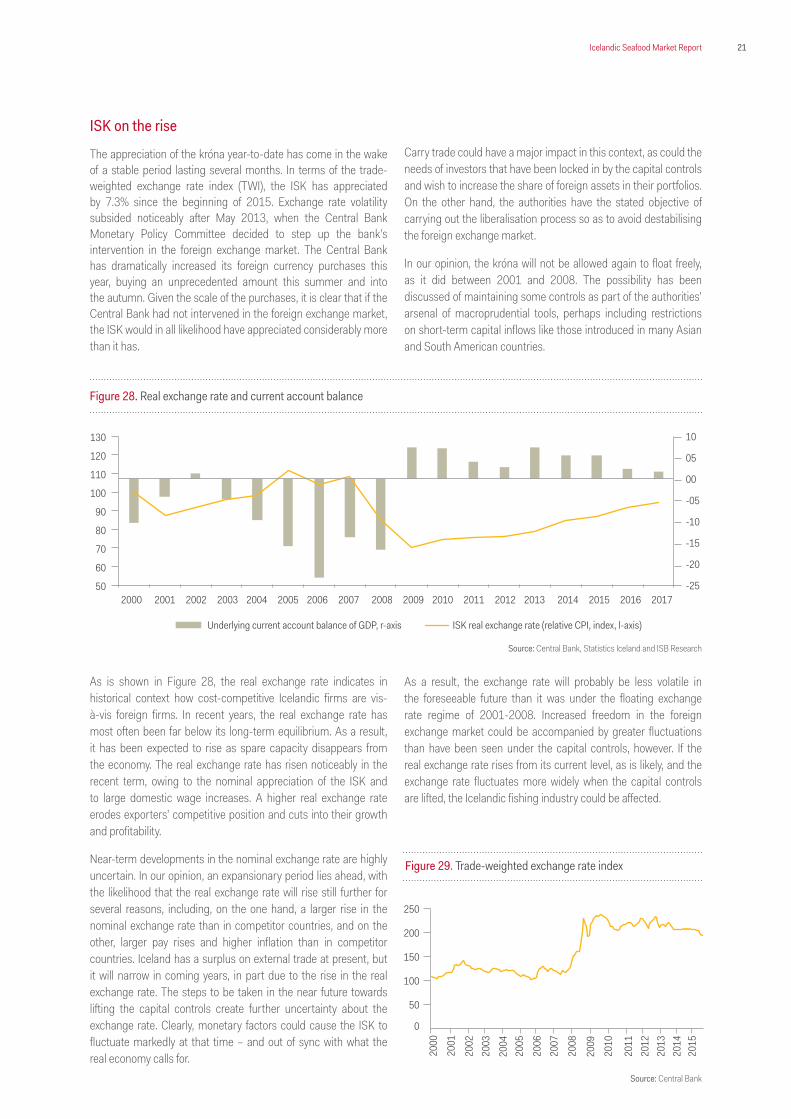
The appreciation of the króna year-to-date has come in the wake of a stable period lasting several months. In terms of the trade-weighted exchange rate index (TWI), the ISK has appreciated by 7.3% since the beginning of 2015. Exchange rate volatility subsided noticeably after May 2013, when the Central Bank Monetary Policy Committee decided to step up the bank’s intervention in the foreign exchange market. The Central Bank has dramatically increased its foreign currency purchases this year, buying an unprecedented amount this summer and into the autumn. Given the scale of the purchases, it is clear that if the Central Bank had not intervened in the foreign exchange market, the ISK would in all likelihood have appreciated considerably more than it has.
As is shown in Figure 28, the real exchange rate indicates in historical context how cost-competitive Icelandic firms are vis-à-vis foreign firms. In recent years, the real exchange rate has most often been far below its long-term equilibrium. As a result, it has been expected to rise as spare capacity disappears from the economy. The real exchange rate has risen noticeably in the recent term, owing to the nominal appreciation of the ISK and to large domestic wage increases. A higher real exchange rate erodes exporters’ competitive position and cuts into their growth and profitability.
Near-term developments in the nominal exchange rate are highly uncertain. In our opinion, an expansionary period lies ahead, with the likelihood that the real exchange rate will rise still further for several reasons, including, on the one hand, a larger rise in the nominal exchange rate than in competitor countries, and on the other, larger pay rises and higher inflation than in competitor countries. Iceland has a surplus on external trade at present, but it will narrow in coming years, in part due to the rise in the real exchange rate. The steps to be taken in the near future towards lifting the capital controls create further uncertainty about the exchange rate. Clearly, monetary factors could cause the ISK to fluctuate markedly at that time – and out of sync with what the real economy calls for.
Carry trade could have a major impact in this context, as could the needs of investors that have been locked in by the capital controls and wish to increase the share of foreign assets in their portfolios. On the other hand, the authorities have the stated objective of carrying out the liberalisation process so as to avoid destabilising the foreign exchange market.
In our opinion, the króna will not be allowed again to float freely, as it did between 2001 and 2008. The possibility has been discussed of maintaining some controls as part of the authorities’ arsenal of macroprudential tools, perhaps including restrictions on short-term capital inflows like those introduced in many Asian and South American countries.
As a result, the exchange rate will probably be less volatile in the foreseeable future than it was under the floating exchange rate regime of 2001-2008. Increased freedom in the foreign exchange market could be accompanied by greater fluctuations than have been seen under the capital controls, however. If the real exchange rate rises from its current level, as is likely, and the exchange rate fluctuates more widely when the capital controls are lifted, the Icelandic fishing industry could be affected.
Figure 29. Trade-weighted exchange rate index
250
200
150
100
50
0
2003
2006
2011
2004
2009
2001
2000
2007
2012
2005
2010
2002
2008
2013
2014
2015
Figure 28. Real exchange rate and current account balance
Underlying current account balance of GDP, r-axis ISK real exchange rate (relative CPI, index, l-axis)
130
120
110
100
90
80
70
60
50
10
05
00
-05
-10
-15
-20
-25 2000 2001 2002 2003 2004 2005 2006 2007 2008 2009 2010 2011 2012 2013 2014 2015 2016 2017
Revenues (ISK bn) EBITDA (ISK bn)
EBITDA margin (right)
Source: Central Bank, Statistics Iceland and ISB Research
Source: Central Bank
22 Icelandic Seafood Market Report
Figure 30. EBITDA margins, by fishing company category
Mixed pelagic and demersal Demersal fishing and processing Demersal
32%
23%20%
28%
19% 20%
27%
19%22%
20142012 2013
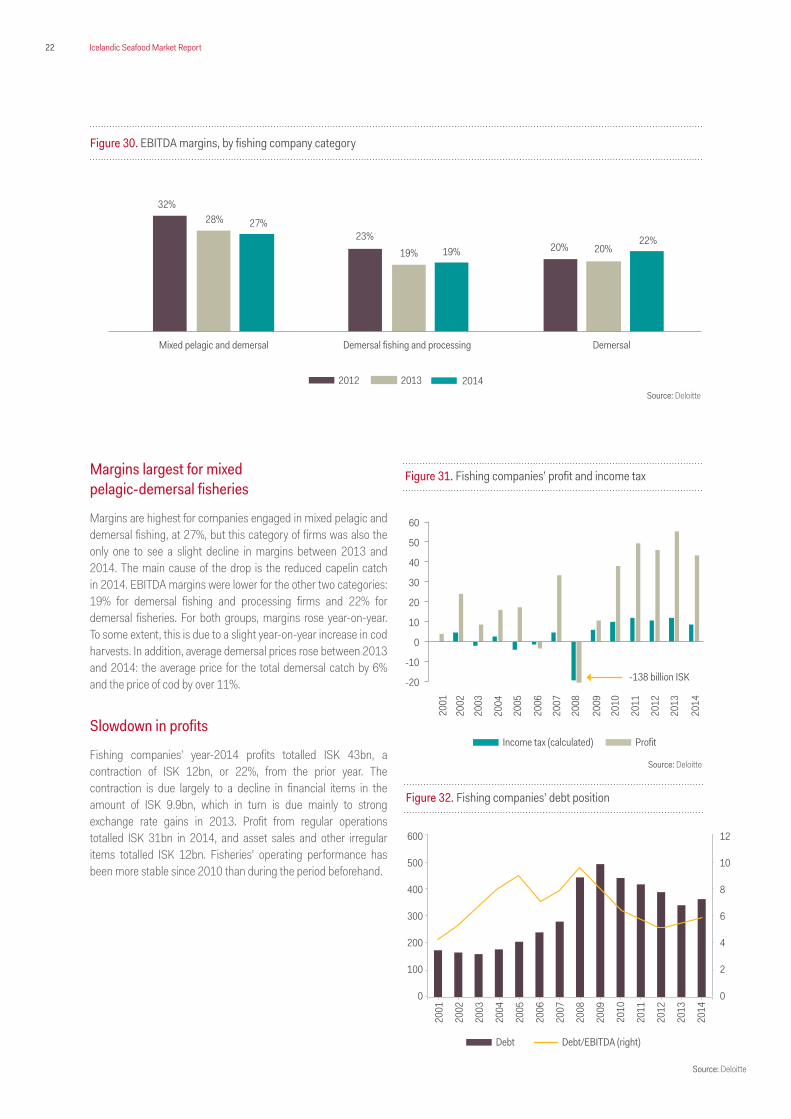
Margins largest for mixed pelagic-demersal fisheries
Margins are highest for companies engaged in mixed pelagic and demersal fishing, at 27%, but this category of firms was also the only one to see a slight decline in margins between 2013 and 2014. The main cause of the drop is the reduced capelin catch in 2014. EBITDA margins were lower for the other two categories: 19% for demersal fishing and processing firms and 22% for demersal fisheries. For both groups, margins rose year-on-year. To some extent, this is due to a slight year-on-year increase in cod harvests. In addition, average demersal prices rose between 2013 and 2014: the average price for the total demersal catch by 6% and the price of cod by over 11%.
Slowdown in profits
Fishing companies’ year-2014 profits totalled ISK 43bn, a contraction of ISK 12bn, or 22%, from the prior year. The contraction is due largely to a decline in financial items in the amount of ISK 9.9bn, which in turn is due mainly to strong exchange rate gains in 2013. Profit from regular operations totalled ISK 31bn in 2014, and asset sales and other irregular items totalled ISK 12bn. Fisheries’ operating performance has been more stable since 2010 than during the period beforehand.
Figure 31. Fishing companies’ profit and income tax
60
50
40
30
20
10
0
-10
-20
2003
2006
2011
2004
2009
2001
2007
2012
2005
2010
2002
2008
2013
2014
Income tax (calculated) Profit
-138 billion ISK
Figure 32. Fishing companies’ debt position
2001
2004
2007
2010
2002
2005
2008
2011
2003
2006
2009
2012
2013
2014
600
500
400
300
200
100
0
12
10
8
6
4
2
0
Debt Debt/EBITDA (right)
Source: Deloitte
Source: Deloitte
Source: Deloitte
23Icelandic Seafood Market Report
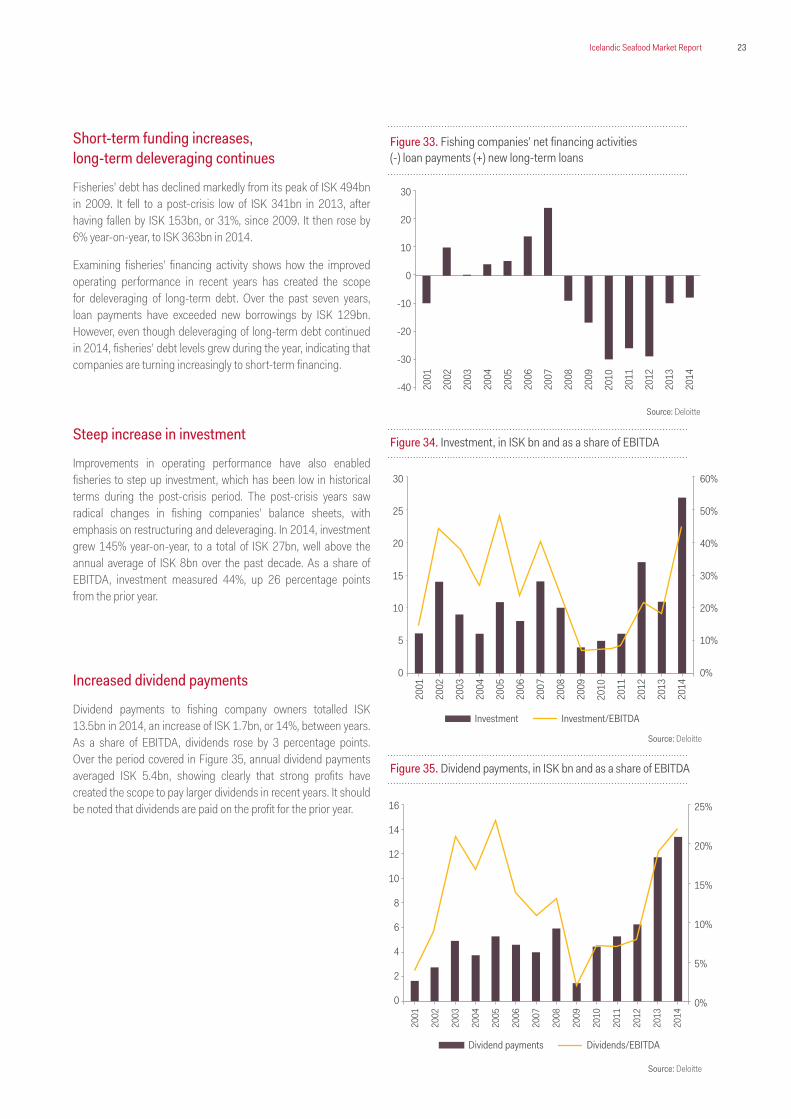
Short-term funding increases, long-term deleveraging continues
Fisheries’ debt has declined markedly from its peak of ISK 494bn in 2009. It fell to a post-crisis low of ISK 341bn in 2013, after having fallen by ISK 153bn, or 31%, since 2009. It then rose by 6% year-on-year, to ISK 363bn in 2014.
Examining fisheries’ financing activity shows how the improved operating performance in recent years has created the scope for deleveraging of long-term debt. Over the past seven years, loan payments have exceeded new borrowings by ISK 129bn. However, even though deleveraging of long-term debt continued in 2014, fisheries’ debt levels grew during the year, indicating that companies are turning increasingly to short-term financing.
Steep increase in investment
Improvements in operating performance have also enabled fisheries to step up investment, which has been low in historical terms during the post-crisis period. The post-crisis years saw radical changes in fishing companies’ balance sheets, with emphasis on restructuring and deleveraging. In 2014, investment grew 145% year-on-year, to a total of ISK 27bn, well above the annual average of ISK 8bn over the past decade. As a share of EBITDA, investment measured 44%, up 26 percentage points from the prior year.
Increased dividend payments
Dividend payments to fishing company owners totalled ISK 13.5bn in 2014, an increase of ISK 1.7bn, or 14%, between years. As a share of EBITDA, dividends rose by 3 percentage points. Over the period covered in Figure 35, annual dividend payments averaged ISK 5.4bn, showing clearly that strong profits have created the scope to pay larger dividends in recent years. It should be noted that dividends are paid on the profit for the prior year.
2001
2004
2007
2010
2002
2005
2008
2011
2003
2006
2009
2012
2013
2014
30
20
10
0
-10
-20
-30
-40
Figure 33. Fishing companies’ net financing activities (-) loan payments (+) new long-term loans
2001
2004
2007
2010
2002
2005
2008
2011
2003
2006
2009
2012
2013
2014
30
25
20
15
10
5
0
60%
50%
40%
30%
20%
10%
0%
Figure 34. Investment, in ISK bn and as a share of EBITDA
Figure 35. Dividend payments, in ISK bn and as a share of EBITDA
2001
2004
2007
2010
2002
2005
2008
2011
2003
2006
2009
2012
2013
2014
16
14
12
10
8
6
4
2
0
25%
20%
15%
10%
5%
0%
Investment Investment/EBITDA
Dividend payments Dividends/EBITDA
Source: Deloitte
Source: Deloitte
Source: Deloitte
24 Icelandic Seafood Market Report
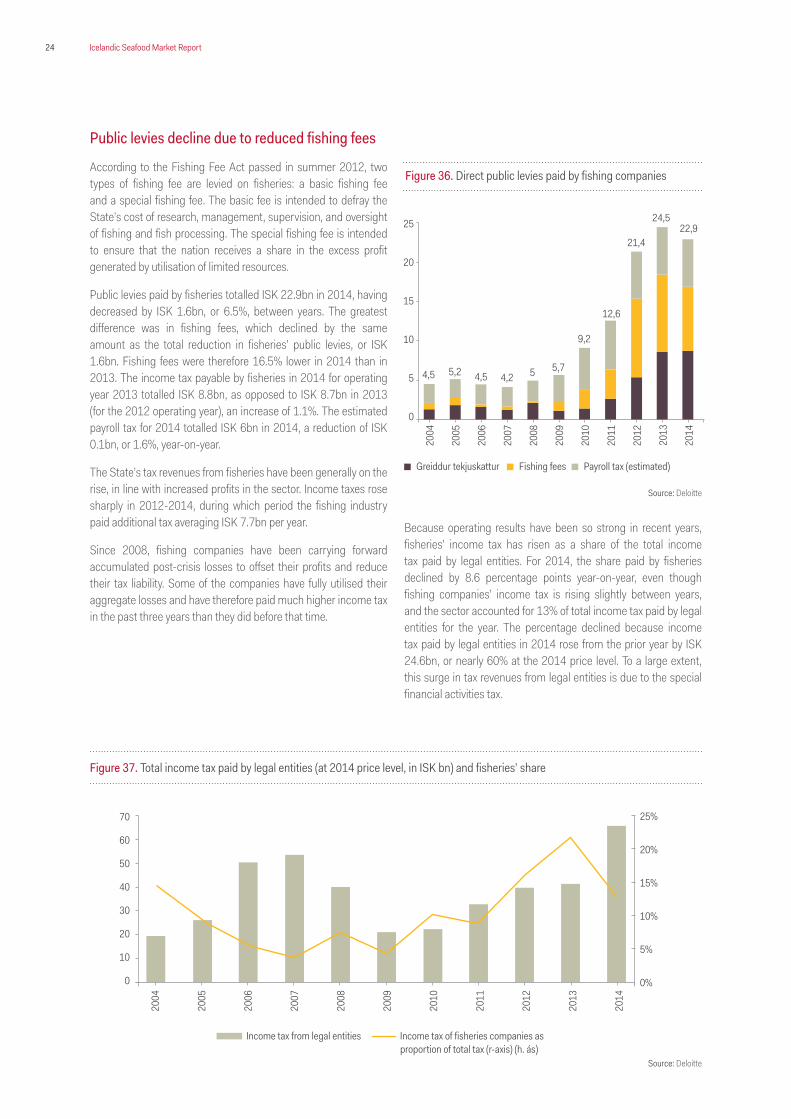
Public levies decline due to reduced fishing fees
According to the Fishing Fee Act passed in summer 2012, two types of fishing fee are levied on fisheries: a basic fishing fee and a special fishing fee. The basic fee is intended to defray the State’s cost of research, management, supervision, and oversight of fishing and fish processing. The special fishing fee is intended to ensure that the nation receives a share in the excess profit generated by utilisation of limited resources.
Public levies paid by fisheries totalled ISK 22.9bn in 2014, having decreased by ISK 1.6bn, or 6.5%, between years. The greatest difference was in fishing fees, which declined by the same amount as the total reduction in fisheries’ public levies, or ISK 1.6bn. Fishing fees were therefore 16.5% lower in 2014 than in 2013. The income tax payable by fisheries in 2014 for operating year 2013 totalled ISK 8.8bn, as opposed to ISK 8.7bn in 2013 (for the 2012 operating year), an increase of 1.1%. The estimated payroll tax for 2014 totalled ISK 6bn in 2014, a reduction of ISK 0.1bn, or 1.6%, year-on-year.
The State’s tax revenues from fisheries have been generally on the rise, in line with increased profits in the sector. Income taxes rose sharply in 2012-2014, during which period the fishing industry paid additional tax averaging ISK 7.7bn per year.
Since 2008, fishing companies have been carrying forward accumulated post-crisis losses to offset their profits and reduce their tax liability. Some of the companies have fully utilised their aggregate losses and have therefore paid much higher income tax in the past three years than they did before that time.
Because operating results have been so strong in recent years, fisheries’ income tax has risen as a share of the total income tax paid by legal entities. For 2014, the share paid by fisheries declined by 8.6 percentage points year-on-year, even though fishing companies’ income tax is rising slightly between years, and the sector accounted for 13% of total income tax paid by legal entities for the year. The percentage declined because income tax paid by legal entities in 2014 rose from the prior year by ISK 24.6bn, or nearly 60% at the 2014 price level. To a large extent, this surge in tax revenues from legal entities is due to the special financial activities tax.
Figure 36. Direct public levies paid by fishing companies
Greiddur tekjuskattur Fishing fees Payroll tax (estimated)
2004
2007
2010
2013
2005
4,5 5,2 4,5 4,2 5 5,7
9,2
12,6
21,4
24,522,9
2008
2011
2014
2006
2009
2012
25
20
15
10
5
0
Income tax from legal entities Income tax of fisheries companies as proportion of total tax (r-axis) (h. ás)
70
60
50
40
30
20
10
0
25%
20%
15%
10%
5%
0%
2004
2006
2008
2010
2012
2014
2005
2007
2009
2011
2013
Figure 37. Total income tax paid by legal entities (at 2014 price level, in ISK bn) and fisheries’ share
Source: Deloitte
Source: Deloitte
25Icelandic Seafood Market Report
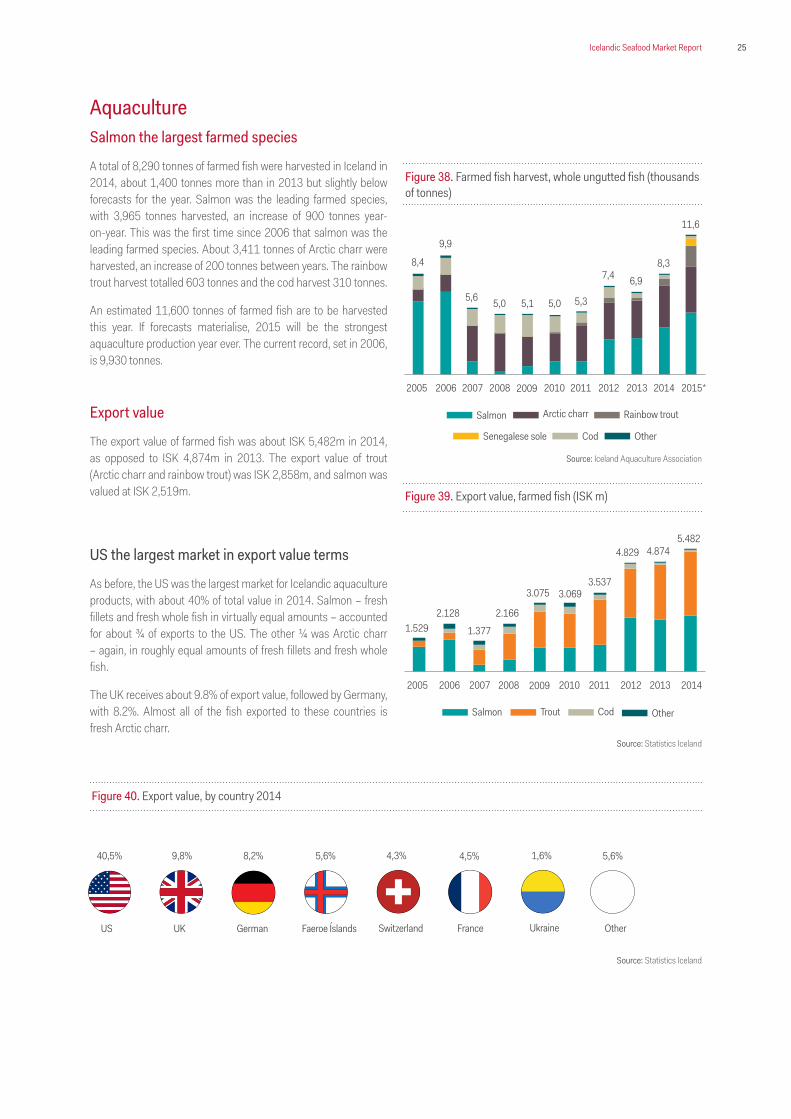
AquacultureSalmon the largest farmed species
A total of 8,290 tonnes of farmed fish were harvested in Iceland in 2014, about 1,400 tonnes more than in 2013 but slightly below forecasts for the year. Salmon was the leading farmed species, with 3,965 tonnes harvested, an increase of 900 tonnes year-on-year. This was the first time since 2006 that salmon was the leading farmed species. About 3,411 tonnes of Arctic charr were harvested, an increase of 200 tonnes between years. The rainbow trout harvest totalled 603 tonnes and the cod harvest 310 tonnes.
An estimated 11,600 tonnes of farmed fish are to be harvested this year. If forecasts materialise, 2015 will be the strongest aquaculture production year ever. The current record, set in 2006, is 9,930 tonnes.
Export value
The export value of farmed fish was about ISK 5,482m in 2014, as opposed to ISK 4,874m in 2013. The export value of trout (Arctic charr and rainbow trout) was ISK 2,858m, and salmon was valued at ISK 2,519m.
US the largest market in export value terms
As before, the US was the largest market for Icelandic aquaculture products, with about 40% of total value in 2014. Salmon – fresh fillets and fresh whole fish in virtually equal amounts – accounted for about ¾ of exports to the US. The other ¼ was Arctic charr – again, in roughly equal amounts of fresh fillets and fresh whole fish.
The UK receives about 9.8% of export value, followed by Germany, with 8.2%. Almost all of the fish exported to these countries is fresh Arctic charr.
Salmon Rainbow troutArctic charr
Senegalese sole Cod Other
Figure 38. Farmed fish harvest, whole ungutted fish (thousands of tonnes)
2006 201120092007 20122005 20102008 2013 2014 2015*
8,4
9,9
5,6 5,0 5,1 5,0 5,3
7,4 6,9
8,3
11,6
Salmon CodTrout Other
Figure 39. Export value, farmed fish (ISK m)
2006 201120092007 20122005 20102008 2013 2014
1.5292.128
1.377
2.166
3.075 3.0693.537
4.829 4.8745.482
US SwitzerlandUK FranceGerman UkraineFaeroe Íslands Other
40,5% 4,3%9,8% 4,5%8,2% 1,6%5,6% 5,6%
Figure 40. Export value, by country 2014
Source: Iceland Aquaculture Association
Source: Statistics Iceland
Source: Statistics Iceland
26 Icelandic Seafood Market Report
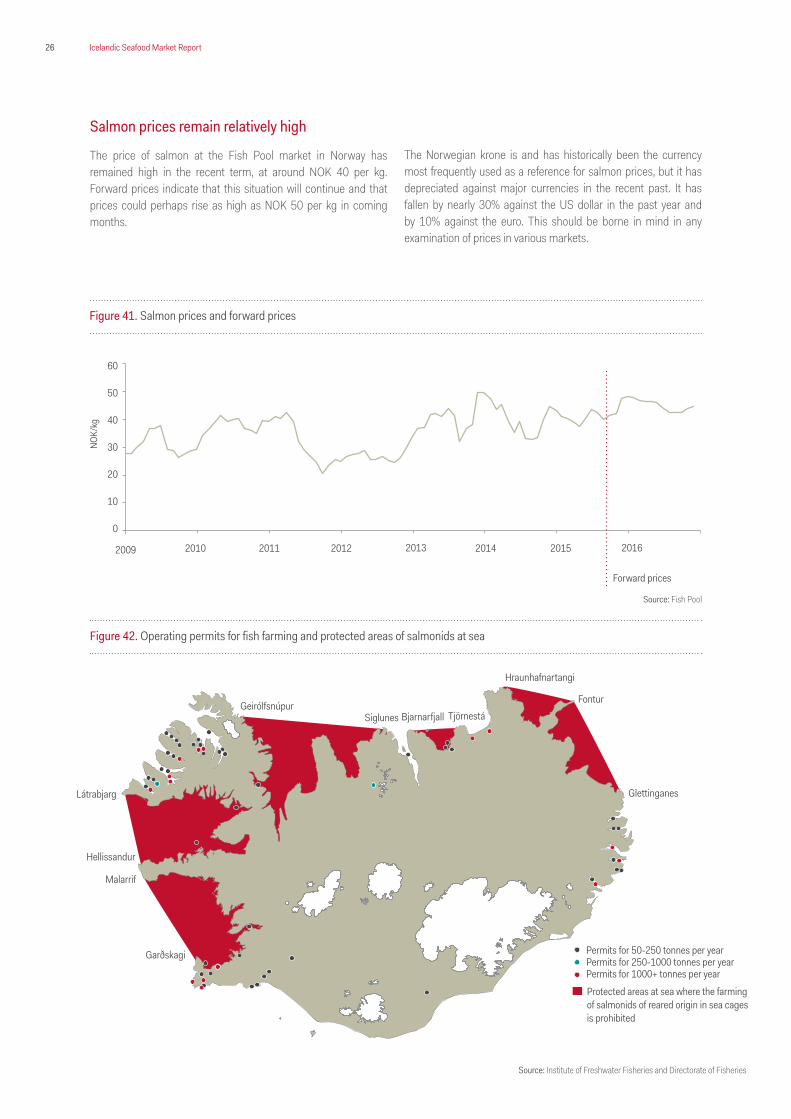
Salmon prices remain relatively high
The price of salmon at the Fish Pool market in Norway has remained high in the recent term, at around NOK 40 per kg. Forward prices indicate that this situation will continue and that prices could perhaps rise as high as NOK 50 per kg in coming months.
The Norwegian krone is and has historically been the currency most frequently used as a reference for salmon prices, but it has depreciated against major currencies in the recent past. It has fallen by nearly 30% against the US dollar in the past year and by 10% against the euro. This should be borne in mind in any examination of prices in various markets.
Figure 42. Operating permits for fish farming and protected areas of salmonids at sea
Fontur
Glettinganes
Tjörnestá
Hraunhafnartangi
BjarnarfjallSiglunesGeirólfsnúpur
Látrabjarg
Hellissandur
Malarrif
Garðskagi Permits for 50-250 tonnes per year
Permits for 1000+ tonnes per yearPermits for 250-1000 tonnes per year
Protected areas at sea where the farmingof salmonids of reared origin in sea cagesis prohibited
Figure 41. Salmon prices and forward prices
60
50
40
30
20
10
0
2009
NOK/
kg
2011 2013 20152010 2012 2014 2016
Forward prices
Source: Fish Pool
Source: Institute of Freshwater Fisheries and Directorate of Fisheries
27Icelandic Seafood Market Report
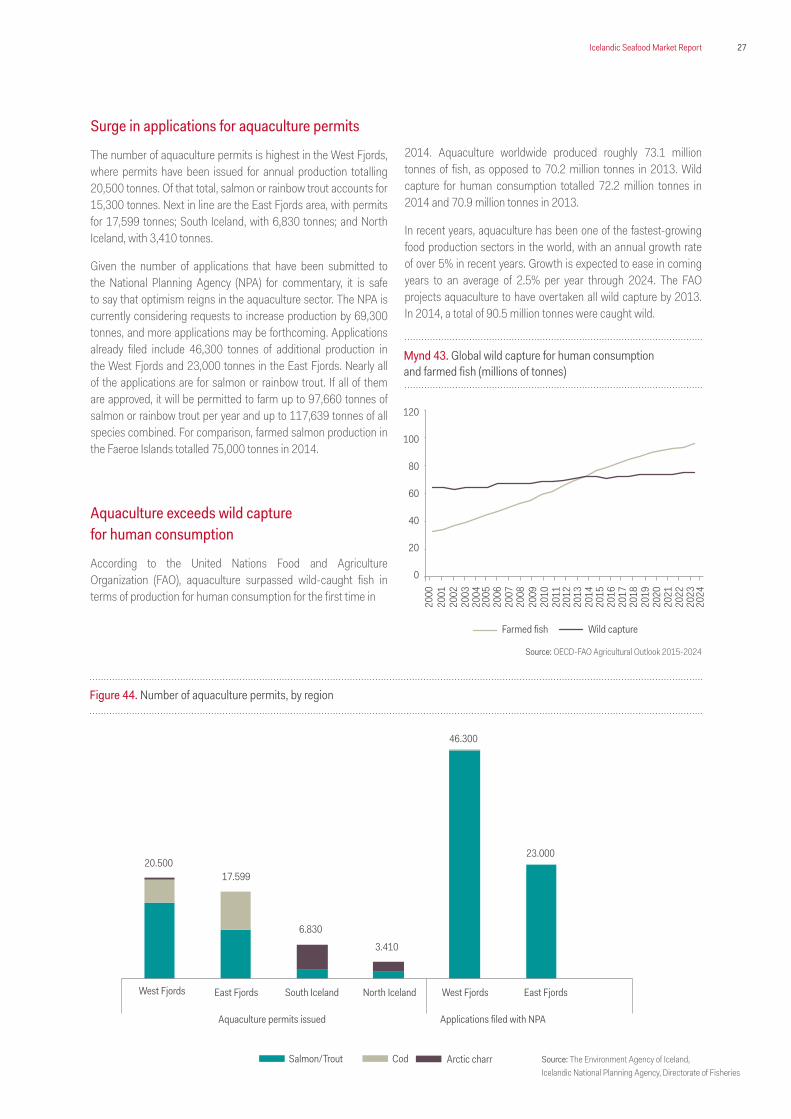
Surge in applications for aquaculture permits
The number of aquaculture permits is highest in the West Fjords, where permits have been issued for annual production totalling 20,500 tonnes. Of that total, salmon or rainbow trout accounts for 15,300 tonnes. Next in line are the East Fjords area, with permits for 17,599 tonnes; South Iceland, with 6,830 tonnes; and North Iceland, with 3,410 tonnes.
Given the number of applications that have been submitted to the National Planning Agency (NPA) for commentary, it is safe to say that optimism reigns in the aquaculture sector. The NPA is currently considering requests to increase production by 69,300 tonnes, and more applications may be forthcoming. Applications already filed include 46,300 tonnes of additional production in the West Fjords and 23,000 tonnes in the East Fjords. Nearly all of the applications are for salmon or rainbow trout. If all of them are approved, it will be permitted to farm up to 97,660 tonnes of salmon or rainbow trout per year and up to 117,639 tonnes of all species combined. For comparison, farmed salmon production in the Faeroe Islands totalled 75,000 tonnes in 2014.
Aquaculture exceeds wild capture for human consumption
According to the United Nations Food and Agriculture Organization (FAO), aquaculture surpassed wild-caught fish in terms of production for human consumption for the first time in
2014. Aquaculture worldwide produced roughly 73.1 million tonnes of fish, as opposed to 70.2 million tonnes in 2013. Wild capture for human consumption totalled 72.2 million tonnes in 2014 and 70.9 million tonnes in 2013.
In recent years, aquaculture has been one of the fastest-growing food production sectors in the world, with an annual growth rate of over 5% in recent years. Growth is expected to ease in coming years to an average of 2.5% per year through 2024. The FAO projects aquaculture to have overtaken all wild capture by 2013. In 2014, a total of 90.5 million tonnes were caught wild.
Figure 44. Number of aquaculture permits, by region
West Fjords East Fjords South Iceland North Iceland West Fjords East Fjords
Arctic charrSalmon/Trout Cod
Applications filed with NPAAquaculture permits issued
20.50017.599
6.830
3.410
46.300
23.000
Mynd 43. Global wild capture for human consumptionand farmed fish (millions of tonnes)
120
100
80
60
40
20
0
2000
2004
2008
2012
2016
2020
2001
2005
2009
2013
2017
2021
2002
2006
2010
2014
2018
2022
2003
2007
2011
2015
2019
2023
2024
Farmed fish Wild capture
Source: OECD-FAO Agricultural Outlook 2015-2024
Source: The Environment Agency of Iceland,Icelandic National Planning Agency, Directorate of Fisheries
28 Icelandic Seafood Market Report
Figure 1. Íslandsbanki’s corporate loan portfolio by sector, Q3/2015 Figure 2. Fishing industry contribution to GDPFigure 3. Production value per employee in ISK m (at 2013 prices)Figure 4. Number of persons employed in the fishing industryFigure 5. Jobs in the fishing industry, by residence 2014Figure 6. Jobs in the fishing industry, by gender 2014Figure 7. The Icelandic fishing fleetFigure 8. The fishing fleet by type and region 2014Figure 9. Investment in shipsFigure 10. Share of total allowable catch, ten largest quota holdersFigure 11. Catches and catch valuesFigure 12. Catch, key species (thousands of tonnes)Figure 13. Catch values, key species (ISK bn)Figure 14. Distribution of catches and catch values 2014Figure 15. Export value at 2014 prices (ISK bn)Figure 16. Share of total export value 2014, by sectorFigure 17. Marine product exports (thousands of tonnes)Figure 18. Export value of marine products (ISK bn at constant 2014 prices)Figure 19. Export volume, key species (thousands of tonnes)Figure 20. Export value, key species (ISK bn)Figure 21. Export value by country 2014, key species (ISK bn)Figure 22. Export volume, by product category (thousands of tonnes)Figure 23. Export value, by product category (ISK bn)Figure 24. Export value, by product category (ISK thousands per tonne)Figure 25. Marine product price index and sub-indicesFigure 26. Fishing industry revenues and EBITDAFigure 27. Global market price of Brent crude (USD per barrel)Figure 28. Real exchange rate and current account balanceFigure 29. Trade-weighted exchange rate indexFigure 30. EBITDA margins, by fishing company categoryFigure 31. Fishing companies’ profit and income taxFigure 32. Fishing companies’ debt positionFigure 33. Fishing companies’ financing activitiesFigure 34. Investment, in ISK bn and as a share of EBITDAFigure 35. Dividend payments, in ISK bn and as a share of EBITDAFigure 36. Direct public levies paid by fishing companiesFigure 37. Total income tax paid by legal entities (at 2014 price level, in ISK bn) and fisheries’ shareFigure 38. Export value of farmed fish (ISK m)Figure 39. Útflutningsverðmæti eldisfisks (m. kr.)Figure 40. Export value by country 2014Figure 41. Salmon prices and forward pricesFigure 42. Operating permits for fish farming and protected areas of salmonids at seaFigure 43. Global wild capture for human consumption and farmed fish (millions of tonnes)Figure 44. Number of aquaculture permits, by region
Figures

29Icelandic Seafood Market Report
Table 1. Largest companies’ total allowable catch, 2015/2016 fishing yearTable 2. Marine product exportsTable 3. Export value, by trading partner and species (ISK m)
Tables
30 Icelandic Seafood Market Report
This report was produced by Íslandsbanki hf.
The information in this report is based on publicly available dataand information from various sources deemed to be reliable. Theinformation has not been independently verified by Islandsbanki hf. (“Islandsbanki”) and Islandsbanki does not guarantee that the information is comprehensive or accurate. All views expressed herein are those of the author(s) at the time of writing and may change without notice. Islandsbanki holds no obligation to up-date, modify or amend this report or to otherwise notify readers or recipients of this report in the event that any matter contained herein changes or subsequently becomes inaccurate.
This report is informative in nature and should not be interpret-ed as a recommendation to take, or not to take, any particular investment action. This report does not represent an offer or a solicitation to buy, sell or subscribe to any particular financial in-struments.
Islandsbanki accepts no liability for any potential losses or other consequences arising from decisions based on information in this report. Any loss arising from the use of the information in this report shall be the sole and exclusive responsibility of the investor. Before making an investment decision, it is important to seek expert advice and to become familiar with the investment market and different investment alternatives.
Various financial risks are at all times present during investment activities, such as the risk of no yield or the risk of losing the capital invested. International investments include risks related to political and economic uncertainties as well as currency risk. Each investor’s investment objectives and financial situation is different. Past performance does not indicate or guarantee the future performance of an investment.
Reports and other information received from Islandsbanki are intended for private use only.
This material may not be copied, quoted or distributed, in whole or in part, without the prior written consent of Islandsbanki.
This report is a brief summary and does not purport to contain all available information on the subject covered herein.
Regulator: The Financial Supervision Authority of Iceland (www.fme.is)
United StatesNeither this report nor copies of this report may be distributed in the United States. Distributing the report in the United States may be a breach of applicable laws or regulations.
CanadaThe information provided in this publication is not intended to be distributed or circulated in any manner in Canada and should not be construed as any kind of financial recommendation or advice provided within the meaning of Canadian securities law.
Other countriesLaws and regulations of other countries may also restrict the dis-tribution of this report.
This summary does not constitute any solicitation of services byIslandsbanki in the United States or Canada.
For further information relating to this disclaimer see:https://www.islandsbanki.is
Disclaimer

31Icelandic Seafood Market Report

Icelandic Seafood Market ReportÍslandsbanki Kirkjusandi 155 Reykjavík Iceland Tel.: +354 440 4000
For more information, please visit our website:www.islandsbanki.is/[email protected]