ICE STORM ’98 - McGill · PDF fileThis material may be copied for purposes related to...
47
ICLR Research Paper Series – No. 1 ICE STORM ’98 by Eugene L. Lecomte with Alan W. Pang and James W. Russell © ICLR, December 1998
Transcript of ICE STORM ’98 - McGill · PDF fileThis material may be copied for purposes related to...
ICLR Research Paper Series – No. 1
ICE STORM ’98by
Eugene L. Lecomte
with
Alan W. Pang and James W. Russell
© ICLR, December 1998

The Institute for Catastrophic Loss Reduction (ICLR) was established in 1998 withthe mission to reduce the loss of life and property caused by severe weather andearthquakes through the identification and support of sustained actions to improvesociety’s capacity to adapt to, anticipate, mitigate, withstand and recover fromnatural disasters.
For further information, please contact:Institute for Catastrophic Loss Reduction151 Yonge Street, Suite 1800Toronto, Canada M5C 2W7Telephone: (416) 362-2031 – extension 374Fax: (416) 362-2062E mail [email protected]
Copies of this paper can be obtained from the Institutefor $25 plus taxes, shipping and handling.
The Institute for Business and Home Safety is an initiative of the insurance industryto reduce deaths, injuries, property damage, economic losses and human sufferingcaused by natural disasters.
For further information, please contact:Institute for Business and Home Safety73 Tremont Street, Suite 510Boston, Mass. 02108-3901, U.S.A.Telephone: (617) 292-2003Fax: (617) 292-2022E mail: [email protected]
The opinions expressed in this paper are those of the authors and not necessarily those ofthe Institute for Catastrophic Loss Reduction or the Institute for Business and HomeSafety.
This material may be copied for purposes related to the document as long as the authorsand copyright holders are recognized.

ICE STORM ’98by
Eugene L. Lecomte
with
Alan W. Pang and James W. Russell

ACKNOWLEDGEMENTS
The assistance of the individuals listed below is gratefully acknowledged. Without thesharing of their experiences, knowledge, information, expertise and free giving of theirtime, the material in this report would have been lacking in content and impossible tocompile.
André Cadieux, Supervisor, Consumer Information Centre, Insurance Bureau of Canada
Gilles Chevrier, Vice President, Indemnisation Assurances, AXA Assurances Inc.
François Côté, Director, Ministry of Public Security, Government of Quebec
Jean-François Gauthier, Political Attach�, Ministry of Public Security, Government ofQuebec
Jean-Bernard Guindon, Director, Civil Security Centre, Montreal Urban Community
Jacques Henault, Office of the Senior Scientific Advisor, Emergency PreparednessCanada
Paul Kovacs, Executive Director, Institute for Catastrophic Loss Reduction
Claude Lapointe, Manager Member Services, Insurance Bureau of Canada
Marc Lavallée, Assistant to the Deputy Minister of Public Security, Government ofQuebec
Simon Law, Researcher and Student, Malden, Massachusetts
Raymond Medza, General Manager, Insurance Bureau of Canada
Evan Mills, PhD., Director, Center for Building Sciences, Lawrence Berkeley NationalLaboratory
Eric Shipley, Executive Director, Emergency Preparedness Canada
Edward A. Thomas, Director, Operations Support Division, Region I, Federal EmergencyManagement Agency
Chris Tucker, Senior Scientific Advisor, Emergency Preparedness Canada
Tracy Waddington, Policy Analyst, Insurance Bureau of Canada
James Lee Witt, Director, Federal Emergency Management Agency

ABOUT THE AUTHORS
Eugene L. Lecomte is President Emeritus of the Institute for Business and Home Safety,Boston, Massachusetts. A veteran of more than 50 years in the insurance business Mr.Lecomte has served as President and CEO of the Insurance Institute For Property LossReduction, National Committee on Property Insurance and the Property Insurance PlansService Office. He also served as President of the Massachusetts Automobile andWorkers Compensation Rating Bureaus.
Alan W. Pang is Managing Director of the Institute for Catastrophic Loss Reduction,Toronto. Mr. Pang is on sabbatical from Aon Re Canada where he is a Vice President. Areinsurance broker, he has extensive experience in modeling and assessing the impact ofsevere weather on the insurance community.
James W. Russell, Ed.D. is Vice President of the Insurance Institute for Business andHome Safety and is responsible for outreach. Dr. Russell was associated with theMassachusetts Public School System for 33 years. He also served in the MassachusettsNational Guard for 37 years, rising to the rank of Colonel.

TABLE OF CONTENTSPage
Foreword ............................................................................................................................ 1
The Meteorology ............................................................................................................... 3
The Canadian Event ..................................................................................................... 3
The United States Event.............................................................................................. 8
The Occurrence .................................................................................................................. 9
The Canadian Experience............................................................................................ 9
The Chronology........................................................................................................... 9
Freezing Rain Facts ................................................................................................... 13
The United States Experience .................................................................................... 15
The Losses........................................................................................................................ 17
General Observations ................................................................................................ 17
Canadian Losses ........................................................................................................ 17
United States Losses.................................................................................................. 19
Mitigation Recommendations .......................................................................................... 21
General Observations ................................................................................................ 21
Canada’s Ice Storm Mitigation Efforts ..................................................................... 23
Role of Provincial Government................................................................................. 24
Role of Municipalities............................................................................................... 24
Role of Citizens......................................................................................................... 25
Insurance and the Role of Insurers ............................................................................ 25

TABLE OF CONTENTS (Continued)Page
Lessons Learned ............................................................................................................... 26
Provincial Government ............................................................................................. 26
Municipalities............................................................................................................ 26
Citizens...................................................................................................................... 26
United States’ Ice Storm Response and Mitigation Efforts ...................................... 26
Mitigation Recommendations ................................................................................... 28
General Recommendations ....................................................................................... 28
Incentives................................................................................................................... 29
Mitigation, Incentives and Insurers ........................................................................... 30
Mission Statements and Key Result Areas....................................................................... 31
Sustainable Development: Energy Sources and New Building Materials ....................... 32
Conclusions ...................................................................................................................... 37
References ........................................................................................................................ 38
Appendices
Appendix 1 500 kPa Height and Vorticity Analysis – 00Z Mon 5 Jan to Sat 10 Jan 98
Appendix 2 Surface Analysis – 00Z Mon 5 Jan to Sat 10 Jan 98
Appendix 3 Insurance Coverages
Appendix 4 News Release, Emergency Preparedness Canada – “Don’t Feel Powerless– Prepare for Electricity Outages.”
Appendix 5 Members of IBHS and ICLR


Ice Storm ’98 Page 1
Starting late on January 4, 1998 and continuing for the next six days untilJanuary 10, 1998, freezing rain fell on eastern Ontario, southwesternQuebec, and southern New Brunswick and Nova Scotia. These areas werepelted with 80 millimetres or more of freezing rain. The event doubled theamount of precipitation experienced in any prior ice storm. The result: acatastrophe that produced the largest estimated insured loss ($1.44 billionCdn) in the history of Canada. The combined Canadian and United Statesinsured loss stands in excess of $1.2 billion U.S. or $1.75 billion Cdn as atOctober 1, 1998.
The same storm slashed across northern New York and parts of Vermont,New Hampshire and Maine in the United States, leaving a vast trail ofdamage and destruction (approximately $200 million U.S. in insuredlosses). Nevertheless, the damage in the United States paled in contrast tothat sustained in Canada. (See Figure 1 above.)
In Canada, 28 deaths were attributable to the storm, while in the UnitedStates, 17 people lost their lives. According to Emergency PreparednessCanada, electric outages in the affected areas of Canada deprived 4.7
FOREWORD
Figure 1: Freezing rain accumulation Courtesy of the National Geographic Society
Ice Storm ’98 Page 2
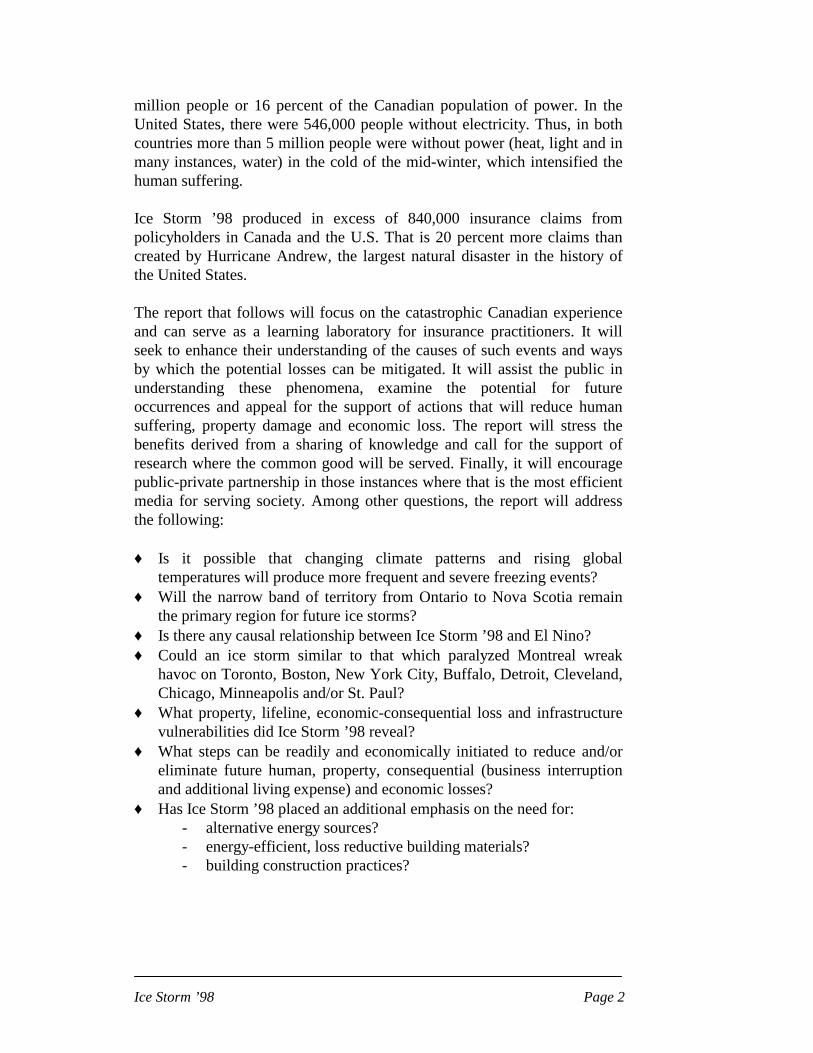
million people or 16 percent of the Canadian population of power. In theUnited States, there were 546,000 people without electricity. Thus, in bothcountries more than 5 million people were without power (heat, light and inmany instances, water) in the cold of the mid-winter, which intensified thehuman suffering.
Ice Storm ’98 produced in excess of 840,000 insurance claims frompolicyholders in Canada and the U.S. That is 20 percent more claims thancreated by Hurricane Andrew, the largest natural disaster in the history ofthe United States.
The report that follows will focus on the catastrophic Canadian experienceand can serve as a learning laboratory for insurance practitioners. It willseek to enhance their understanding of the causes of such events and waysby which the potential losses can be mitigated. It will assist the public inunderstanding these phenomena, examine the potential for futureoccurrences and appeal for the support of actions that will reduce humansuffering, property damage and economic loss. The report will stress thebenefits derived from a sharing of knowledge and call for the support ofresearch where the common good will be served. Finally, it will encouragepublic-private partnership in those instances where that is the most efficientmedia for serving society. Among other questions, the report will addressthe following:
♦ Is it possible that changing climate patterns and rising globaltemperatures will produce more frequent and severe freezing events?
♦ Will the narrow band of territory from Ontario to Nova Scotia remainthe primary region for future ice storms?
♦ Is there any causal relationship between Ice Storm ’98 and El Nino?♦ Could an ice storm similar to that which paralyzed Montreal wreak
havoc on Toronto, Boston, New York City, Buffalo, Detroit, Cleveland,Chicago, Minneapolis and/or St. Paul?
♦ What property, lifeline, economic-consequential loss and infrastructurevulnerabilities did Ice Storm ’98 reveal?
♦ What steps can be readily and economically initiated to reduce and/oreliminate future human, property, consequential (business interruptionand additional living expense) and economic losses?
♦ Has Ice Storm ’98 placed an additional emphasis on the need for:- alternative energy sources?- energy-efficient, loss reductive building materials?- building construction practices?

Ice Storm ’98 Page 3
The Canadian Event
Over the past four decades Canada has been the victim of numerous majorice storms – in February 1961, Montreal; in January 1968, Ontario; inMarch 1983, Winnipeg; in April 1984, St. John’s Newfoundland; in 1986Ontario/Quebec and most recently, in January 1998, from the MaritimeProvinces through the St. Lawrence and Ottawa Valleys.
Other sections of this report will focus on the devastation wrought by the1998 Storm. Included will be the insured, uninsured and economic losses;mitigation opportunities; and an examination of products which wouldsustain development while concurrently reducing human suffering as well asproperty and economic damage. But first, a look at the meteorologicalcauses of ice storms.
According to Lee Grenci, Pennsylvania State University, as reported inWeatherwise, May/June 1998, Glazed over, freezing rain occurs
when a layer of warm, moist air several thousand feet abovethe ground wedges between cold air at high altitudes and arelatively thin layer of cold air next to the earth’s surface. Indelicatessen terms, the atmosphere makes a warm airsandwich. When snowflakes fall into a meaty layer ofsandwiched warm air, they melt into rain drops. Then, ondescent into the thin slice of cold air, raindrops often become“supercooled” as their temperatures drop below 32 degreesFahrenheit. On touchdown, supercooled drops are primed tofreeze on contact with cold objects such as trees, power lines,and untreated roads, forming a treacherous, sometimesweighty glaze.
This concept has the concurrence of Etkin and Brun when they state thephysical processes of sleet and freezing rain:
The formation of sleet and freezing rain is a result of frozenprecipitation falling through an irregular vertical temperatureprofile. Normally, the air through which snow falls in winteris warmer – though still below freezing – closer to the
THE METEOROLOGY

Ice Storm ’98 Page 4
ground, and hence snowflakes remain frozen. Occasionally,instead of this characteristic temperature profile, a layer ofwarm temperatures hovers on the order of 100 meters abovethe surface (i.e. an inversion layer). In winter inversion layersare common just ahead of warm fronts and over large cities,though the main cause of freezing rain is due to inversionlayers associated with warm fronts. Cold air trapped invalleys as warmer air advances into a region can alsocontribute to this phenomenon. In cases where this inversionlayer is present, as snow falls towards the surface, it will passthrough a layer of warmer air. Depending on the thickness ofthis layer, snowflakes falling through it will melt eitherpartially or completely. When they pass into the lower colderlayer, they may completely refreeze or remain as supercooledliquid drops. If they refreeze, the original snow flakes aretransformed into solid pellets of ice, normally called icepellets in Canada or sleet in the US. If they becomesupercooled liquid drops, they produce freezing rain. Thedrops freeze instantaneously onto surface objects, forming athin coating of ice. In extreme events, tons of ice may formon a single tree or power transmission lines, causingextensive damage. (See Figure 2.)
Figure 2: Typical vertical temperature profile associated with freezing rain
The severe icing—freezing rain—began to fall on January 4 and continuedintermittently until January 10. Amounts of 80 mm or more fell in someareas. That precipitation was almost double the amounts of prior major icestorms.

Ice Storm ’98 Page 5
“Ice Storm ’98 - The Meteorological Event” prepared for Aon Re Canada byEnvironment Canada offers the following observations that fit the Grencidefinition of freezing rain and assist in understanding the meteorologicalaspects of the 1998 event:
Upper atmosphere features...
1. At the upper levels in the atmosphere, moderate to strongsouth to southwesterly winds (i.e. winds blowing fromthe southwest) pumped warm and very moist air from theGulf of Mexico area northwards to central and easternCanada [see Appendix 1 - 500 kPa Height and VorticityAnalysis, 00Z Mon 5 Jan 98 to 00Z Mon 10 Jan 98.]
2. A blocking circulation produced a strong highatmosphere ridge over the southern Atlantic Ocean calledthe Bermuda High. This strong ridge prevented thenormal eastward motion of weather systems in thesouthern air stream.
Surface or lower atmosphere features...
3. A large nearly stationary surface high pressure area fromHudson’s Bay to central and eastern Quebec with verycold temperatures associated with it [see Appendix 2 –Surface Analysis, 00Z Mon 05 Jan 98 to 00Z Sat 10 Jan98]. A circulation from the east to northeast out of thisHigh maintained a supply of very cold air in the lowestlevels of the atmosphere over the St. Lawrence andOttawa River Valley areas and parts of the Maritimes.
4. A nearly stationary surface trough of low pressures andassociated front from southern Lake Michigan to theMaritimes. The front formed when cold air at the loweraltitudes from central and eastern Quebec met warmmoist air at higher altitudes pushing northwards from theGulf of Mexico. When cold and warm air meet, the warmair tends to ride over or “overrun” the denser cold air,causing precipitation to form. These surface and upperaltitude flows led to temperature conditions in thevertical that favoured freezing rain.
The Environment Canada report goes on to state:
Prior to the ice storm, a low-pressure weather system overthe Texas Panhandle had pumped moist, warm air from the

Ice Storm ’98 Page 6
Gulf of Mexico into southern Ontario and Quebec at thehigher altitudes (cloud levels). By January 5, over Hudson’sBay, a large stationary Arctic high pressure area hadestablishes itself over central Quebec with its circulationpumping very cold air into Southwestern Quebec, the OttawaRiver valley, and the Maritimes. Because the warm air fromthe Gulf of Mexico was unable to dislodge the denser, coldair near the ground, the southerly (i.e. from the south) currentof moist air overrode the wedge of cold air at the surface,setting the scene for the onset of freezing precipitation.
Figure 3a – Snapshot of a typicalNorth American winter jet stream
Figure 3b – Snapshot of a typicalNorth American winter jet stream
In an El Niño year
Figure 3c – Meteorological factors whichcontributed to the Eastern Canada Ice
Storm of 1998
The question of whether El Niño was a contributing factor to the ice stormis an issue vexing the experts. Figures 3a to 3c display the typical NorthAmerican winter jet stream, the winter jet stream in an El Niño year andmeteorological factors which contributed to Ice Storm 98. There are thosewho contend that the Polar (North) jet stream’s normal pattern had beendisrupted as a consequence of El Niño, in the days prior to the ice storm,causing it to dip south when it reached central Canada. This causedextremely cold Arctic air to flow into the upper atmosphere above Ontarioand Quebec. Concurrently the Subtropical (South) jet stream was pursuingits normal pattern moving east across Southern California, Texas andFlorida. This year, however, there were exceptionally large amounts ofprecipitation and severe flooding in some of the southern states. The severeweather conditions in the south were also attributed by some scientists to ElNiño.

Ice Storm ’98 Page 7
The Environment Canada Report states: “Ice storms in eastern Canada arenot thought to be more frequent during El Niño winters.” Other experts alsodisclaim or discount any connection. Reuters News, however, quotesNOAA Research Director Joe Friday as saying that the warming conditionknown as El Niño was “probably the leading cause” for the ice storms in thenortheast and Canada. At this time the debate continues and the question ofwhether there was a causal relationship between El Nino and the ’98 IceStorm remains open.
The question of whether global climate change and accompanyingvariations in weather patterns will produce more frequent and severefreezing events is a topic requiring additional research. Although there isgrowing acknowledgment about Earth’s rising temperature, the questionlingers regarding its cause and whether it is cyclical or permanent in nature.In their report titled: Natural Hazards in Canada, Chapter 3.0. Etkin andBrun advise regarding climate model predictions:
The results of most numerical climate models predict thatover the next half century a doubling in CO2 will lead to:
♦ an average overall warming of the earth’s global climateby 1.5° C and 4.5° C; and
♦ a proportional increase in global average precipitation(Ahrens, 1984; Mitchell, et al., 1995; IPCC, 1995).
♦ The results of various theoretical and empirical studiesstrongly suggest an increase in certain types of extremeevents.
The Etkin and Brun report covers tropical cyclones, extra-tropical storms(mid-latitude cyclones), thunderstorms, extreme temperature events, floods,drought and other hazards and offers the following summary:
Conclusions on how climate change will affect thefrequencies and intensities of events in Canada are mixed. Ina warmer climate, it seems likely that the number ofconvective events (e.g. thunderstorms with extreme rainfall,tornadoes and hail), heat waves, floods and drought willincrease in many areas, while the frequencies of cold waveswill become rarer. The relationship between the frequencyand intensity of tropical cyclones and global warming isinconclusive.
Insurers recognize the importance of these issues but do not view them astopics that they should address, as they lack the scientific expertise toconduct such studies and/or investigations. Insurers believe that they should

Ice Storm ’98 Page 8
pursue the business of providing indemnification for fortuitous loss frominsured natural hazards and vigorously pursue ways by which those lossescan be reduced or eliminated.
Likewise, the question remains regarding whether freezing losses willcontinue to occur in the narrow band of territory that has produced amajority of the prior Canadian events. This question and its associatedissues require continued exploration.
The United States Event
The freezing losses that struck Maine, New Hampshire, New York andVermont from January 4 through January 10, 1998 had their genesis in themeteorological explanation provided from the Canadian event.
According to climatologist Stanley Changnon of Mahomet, Illinois, icestorms are likely to occur in the band of territory from central Missouriacross central Illinois and on into central Indiana and northern Ohio. Theorientation of these storms will be west-southwest to east-northeast,extending northeastward into upper New York state and southern Canada.
Experts concur that freezing losses similar to those which devastatedMontreal in 1998 could impact Toronto, Boston, New York City, Buffalo,Detroit, Cleveland, Chicago, Minneapolis and/or St. Paul. It isacknowledged that at present the ability to predict such occurrences is for allintents and purposes non-existent. This fact places an added urgency andimportance on setting in motion meaningful and effective mitigationstrategies and programs.

Ice Storm ’98 Page 9
The Canadian Experience
The severity of an ice storm increases depending on:
♦ the accumulation of ice;♦ the duration of the event;♦ the size of the affected area; and♦ the wind speeds.
These factors as well as other salient data will now be examined. A reviewof the following chronology prepared by Swiss Re Canada will set the stage.Among other things it depicts the human and emotional sufferingexperienced, identifies major areas of damage, and highlights many of theeconomic consequences.
The Chronology *
Sun. Jan. 4: Late in the day, freezing rain starts to fall on easternOntario and southwestern Quebec.
Mon. Jan. 5: Spotty power outages begin as ice loads on trees, poles,lines and pylons.
Tues. Jan. 6: Early estimates put at 650,000 the number of Ontarians andQuebecers who are without power.
Wed. Jan. 7: The crisis in Montreal begins as the Drummondville linefails. Montreal schools, universities and businesses close.More than one million Quebec customers are withoutelectricity and tens of thousands of eastern Ontario homesare blacked out.
Thurs. Jan. 8: The storm turns uglier as ice continues to accumulate.Hydro-Quebec seeks help and the first members of theCanadian Armed Forces reach Montreal. Much of easternOntario declares a state of emergency.
THE OCCURRENCE

Ice Storm ’98 Page 10
Fri. Jan. 9: The Quebec government asks for more troops on the “worstday of the crisis.” The number of Quebec customerswithout power peaks at 1.4 million. Much of Montrealloses its water supply after pumping stations lose power.The storm hits the Maritimes.
Sat. Jan. 10: Three million Quebecers — roughly half the province’spopulation, are without power.
Sun. Jan. 11: Hydro-Quebec predicts it will need up to two weeks torestore power fully in the area south of Montreal. Thenumber of soldiers in the affected area rise to 11,000.Crime is down 57 percent.
Mon. Jan. 12: Over 4,000 customers in New Brunswick are withoutpower. Police are given special powers to go door-to-doorto order Montrealers from their homes. The federalgovernment estimates storm damage at $500 million ormore.
Tues. Jan. 13: Soldiers are given the power of arrest. Hydro-Quebec turnsoff the giant illuminated Q on its headquarters and vowsnot to relight it until the crisis is over.
Wed. Jan. 14: Most of Montreal is back on line but outages still plaguethe south shore, parts of rural Quebec and eastern Ontario.Ottawa pledges aid of $50 million for Quebec and $25million for Ontario. The death toll reaches 15.
Thurs. Jan. 15: There is a minor setback in Quebec when 4,000 PointeClaire residents lose power. The downtown core ofMontreal is re-opened, a day earlier than expected.
Fri. Jan. 16: Warnings are still being issued to avoid downtownMontreal due to falling ice.
Sat. Jan. 17: Hydro-Quebec announces that it expects to have servicecompletely restored within 10 days. So far, 460transmission towers have been replaced. The MontrealGazette estimates that total costs attributable to the stormcould reach $1.5 billion.
Sun. Jan. 18: The number of Quebec customers without service drops to242,000 but still represents well over 500,000 people.

Ice Storm ’98 Page 11
Businesses in downtown Montreal are asked to open onlybetween 9 a.m. and 4 p.m. The death toll reaches 25.
Mon. Jan. 19: A major link is re-established in the ring of power thatsupplies Montreal after one 735-kilovolt line betweenBoucherville and Hertel is restored. About 500,000Quebecers and 50,000 Ontarians are still without power,Montreal high school and university students return toclasses. The Insurance Bureau of Canada reports that the250,000 claims filed as of noon total $365 million.
Tues. Jan. 20: Voluntary restrictions on business hours for downtownMontreal are lifted. However a four-hour blackout hits thestill-fragile system, affecting 110,000 customers in themetro area. About 200,000 Quebec customers are stillwithout power. Service is restored to 100,000 out of118,000 customers in eastern Ontario.
Wed. Jan. 21: Approximately 12,000 customers in Boucherville, Quebeclose power after regaining service only days before.Soldiers began leaving the province as part of a gradualwithdrawal. Ottawa announces it will help compensatedairy farmers and businesses affected by damaged mapleand fruit trees.
Thurs. Jan. 22: More than 400,000 Quebecers remain without power.Hydro-Quebec concedes that it can’t make its January 25deadline for getting all of its customers back on line.Ontario Hydro has restored power to over 110,000 of itscustomers in eastern Ontario, leaving about 8,125 withoutservice.
Fri. Jan. 23: The Conference Board of Canada estimates the cost of theice storm will be close to $1.6 billion. Ottawa creates a taskforce to deal with the city’s trees, more than 45,000 ofwhich were damaged or destroyed by ice.
Sat. Jan. 24: Three roofs collapse in Montreal under the weight of iceand 20 centimetres of new snow, which fell through thenight Friday.
Sun. Jan. 25: Crews restore power to a key sub-station that servesQuebec’s south shore. The utility says half of the 60,000customers are still without power – most in the Triangle of

Ice Storm ’98 Page 12
Darkness – will be hooked up within one week. About1,500 customers are still without power in eastern Ontario.
Mon. Jan. 26: At least 60,000 Quebec customers representing 150,000people are still without power. The Insurance Bureau ofCanada reports that the 378,000 claims filed as of noontotal $476 million.
Tues. Jan. 27: Over 220 linemen arrive from British Columbia andManitoba to help rebuild Quebec’s power grid. Hydro-Quebec announces that in just three weeks it has exhaustedits normal five-year supply of materials. Ontario Hydro saysdamage suffered to its system totals at least $100 millionand may double by the end of the crisis.
Wed. Jan. 28: Quebec’s Premier announces that an independentcommission will be set up to examine the handling of theice storm crisis. Hydro-Quebec says it will be February 15before power is fully restored in the province. OntarioHydro announces that only 10 year-round customers ineastern Ontario are without power. The utility says that85,000 insulators, 2,800 kilometres of wire and cable,11,647 poles and 2,100 transformers were delivered toeastern Ontario in the days following the storm.
Thurs. Jan. 29: At least 45,000 Quebec customers in 213 municipalities arestill without power, and some who were told they’d havetheir power back by January 25 hear they may have to waitas long as February 15.
Fri. Jan. 30: Canada’s Minister of Defence says the military’s bill tohelp clean up Quebec and Ontario after the ice storm is $60million. Power is fully restored in Ontario and theprovincial government starts to hand out relief cheques tofarmers – about $1,000 for every week the power was off,for a total of about $10 million.
Sat. Jan. 31: Over 50 shelters remain in operation, housing 1,700 peopleper night.
Sun. Feb. 1: Hydro-Quebec officials warn of more blackouts, saying itshastily repaired distribution system is still fragile.Thousands of people on the south shore enter their fourthweek without power.

Ice Storm ’98 Page 13
Mon. Feb. 2: Hydro-Quebec moves up its deadline for restoring power toall its customers from February 15 to February 8. Over19,500 customers representing 65,000 people remainwithout electricity in the province.
Tues. Feb. 3: Officials from Emergency Preparedness Canada andAgriculture Canada tell a House of Commons agriculturecommittee that the country should re-examine everythingfrom personal readiness and insurance to farming practicesfollowing the disaster. More than 36,000 farms wereaffected by the storm.
Wed. Feb. 4: Quebec’s Public Security Minister announces he willintroduce new legislation March 10 obliging municipalitiesto adopt emergency contingency plans and keep them up todate. One municipality affected by the storm had a plandated from 1980.
Thurs. Feb. 5: An estimated 1,900 Hydro-Quebec customers – or about4,800 people – are without electricity. The utility says allQuebecers should have power by February 6.
Fri. Feb. 6: With the exception of about 100 temporary customers(chalets, campgrounds and sugar shacks), power is fullyrestored in the province of Quebec.
* The dollar amounts shown in this chronology are expressed in the value of Canadiandollars. Also, care should be taken to recognize and distinguish between “customers”served by the Electric Power Companies and “people” affected.
Freezing Rain Facts
Figure 4: Total precipitation accumulations in millimetres from January 4-10, 1998.

Ice Storm ’98 Page 14
The freezing rain accumulated in amounts not previously experienced, asevidenced by the following readings: 73 mm in Kingston, 105 mm inCornwall, 85 mm in Ottawa and 100 mm in Montreal. These accumulationscollapsed electricity transmission lines, which in turn forced people fromtheir homes, caused businesses to close, adversely impacted livestockfarmers and resulted in public and private service provider organizationsbeing significantly hindered. According to Statistics Canada:
Several thousand kilometres of power lines and telephonecables were rendered useless; over 1,000 transmissiontowers, of which 130 were major structures worth $100,000each, were toppled; more than 30,000 wooden utility poles,valued at $3,000 each, were brought down.
The Canadian Geographic, March/April 1998 edition, in the article titled:Lethal Beauty, reported on the following outages:
Province No. of Customers without PowerQuebec 1,393,000Ontario 232,000New Brunswick 28,000Nova Scotia 20,000 Total 1,673,000
As a result of the occurrence, Statistics Canada reported these facts:
♦ Over 2.6 million people were impeded or prevented from gettingto work altogether. This represents 19 percent of all employmentin Canada.
♦ Canada’s economic output declined by a relatively modest 0.7percent in January.
♦ Canadian retail sales dropped by 1.6 percent in January.♦ Stores in Quebec have assessed their losses at $250 million
during the storm and its aftermath. Total retail sales, amountingto $4.4 billion, declined 5.0 percent in January.
♦ Farmers suffered financial losses from damage to barns andequipment, incurred costs in generator rentals and fuelpurchases, and lost cattle and other livestock. The ice storm hastranslated into huge losses for most farmers, especially thoseinvolved in sugar bush, orchards and greenhouse operations.
The economic loss is dependent upon a variety of issues and data which arenot fully identified, explored and/or analyzed in this report.

Ice Storm ’98 Page 15
According to Florent Gagné, Deputy Minister, Quebec Ministry of PublicSafety, the occurrence revealed the need for:
♦ high power generators for health establishments;♦ candles and batteries;♦ vehicles for transportation of the citizenry;♦ salt for roadways and sidewalks;♦ readily accessible fuel supplies, including wood;♦ a way to resolve cellular and telephone communications
problems;♦ 1,000 emergency beds;♦ programs and procedures to deal with widespread major
blackouts; and♦ a way to handle the problems associated with the stoppage of
water filtration plants.
Although plans had been made for many of the foregoing, considerationmust be given to the availability of huge reserves as well as to services thatare readily accessible.
The United States Experience
The factors which define the severity of an ice storm and are set forth underThe Canadian Experience are applicable to the losses in the States. Whiledevastating large areas of northern Maine, New Hampshire, Vermont andNew York, the ice storm struck the less populated centres of these states.The duration of the storms tracked with those of their northern neighbours,as did the rates of precipitation. Thus, the severity of the event in the Stateswas comparable to that impacting Canada.
The storm left more than 500,000 people without power. A by-statebreakdown follows:
State No. of Customers Without PowerMaine 315,000New Hampshire 67,586Vermont 33,200New York 130,000 Total 545,786
A Federal Emergency Management Report titled: A Blueprint for Action,chronicles the damage and destruction as described below:
Dairy farmers in the region suffered significant loss oflivestock, decreased milk production, and damaged farm

Ice Storm ’98 Page 16
equipment and fencing. In New York alone lost maple syrupproduction was estimated at $1.2 million U.S.; a $9.3 millionU.S. loss in livestock and a $12.7 million U.S. loss in milk.
The natural beauty of Maine, New Hampshire, Vermont andNew York which has long made these states a haven fortourist and outdoor enthusiasts sustained heavy damage anddestruction. In New Hampshire tourism, the state’s largestindustry sustained loss to its alpine ski industry estimated at$1.5 million U.S..
Ice damaged utility poles and downed electric lines causedwidespread power outages across the four-state region,leaving 500,000 or more customers without power.
Up to 70 percent of the forests (17.5 million acres) receivedsome form of damage. The timber industry was especiallyhard hit, as were loggers, sawmill owners, truckers, andcountless other businesses tied to the timber industry.
The foregoing does not account for the damage sustained by structures(residential or commercial) and their contents, including loss of food infreezers cut off from power or additional living expenses. The cost ofsheltering individuals forced from their homes by the loss of electricity(light and heat).
Regardless of whether the destruction occurred in Canada or the UnitedStates, the Ice Storm ’98 must be viewed as a historic event.
Ice Storm ’98 Page 17
General Observations
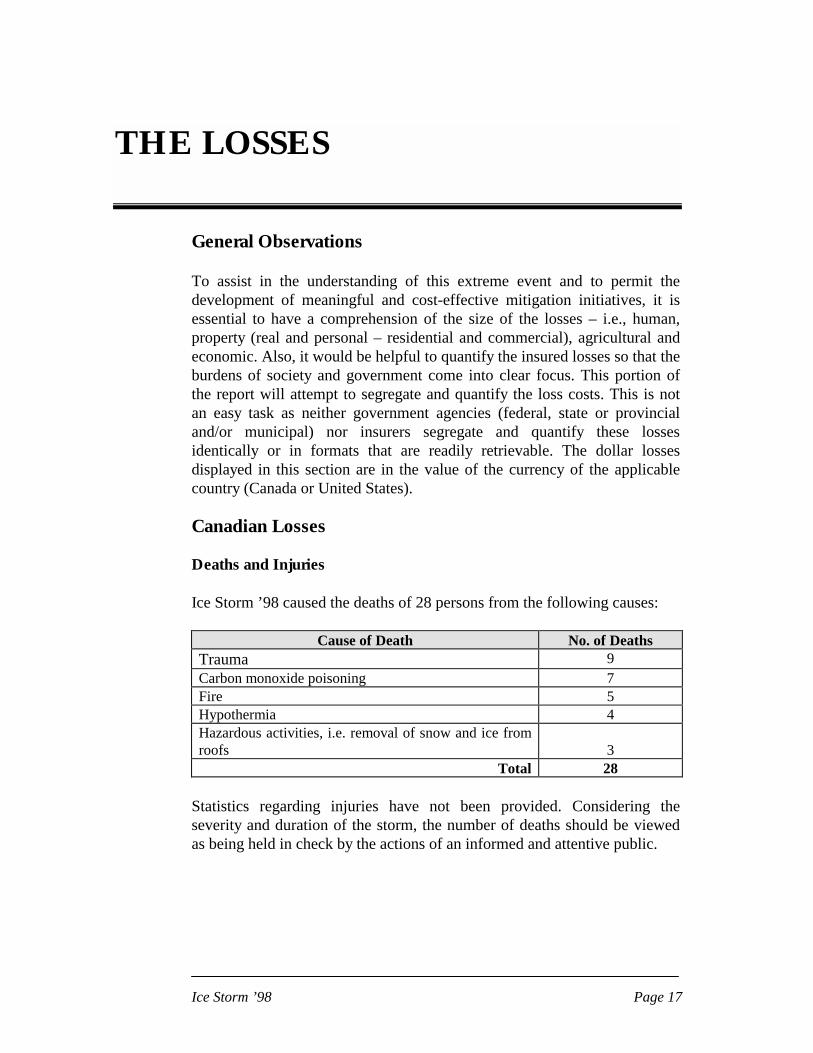
To assist in the understanding of this extreme event and to permit thedevelopment of meaningful and cost-effective mitigation initiatives, it isessential to have a comprehension of the size of the losses – i.e., human,property (real and personal – residential and commercial), agricultural andeconomic. Also, it would be helpful to quantify the insured losses so that theburdens of society and government come into clear focus. This portion ofthe report will attempt to segregate and quantify the loss costs. This is notan easy task as neither government agencies (federal, state or provincialand/or municipal) nor insurers segregate and quantify these lossesidentically or in formats that are readily retrievable. The dollar lossesdisplayed in this section are in the value of the currency of the applicablecountry (Canada or United States).
Canadian Losses
Deaths and Injuries
Ice Storm ’98 caused the deaths of 28 persons from the following causes:
Cause of Death No. of DeathsTrauma 9Carbon monoxide poisoning 7Fire 5Hypothermia 4Hazardous activities, i.e. removal of snow and ice fromroofs 3
Total 28
Statistics regarding injuries have not been provided. Considering theseverity and duration of the storm, the number of deaths should be viewedas being held in check by the actions of an informed and attentive public.
THE LOSSES

Ice Storm ’98 Page 18
Economic Losses
According to the Conference Board of Canada the manufacturing,transportation, communications and retail sectors sustained a short-term lossof $1.6 billion to Canada’s economic output – a 0.2 percent loss in overallreal gross domestic product (GDP). In addition to this, loss of income wasapproximately $1 billion. Contributing to this result was the fact that therewas a slight rise in unemployment, from 8.6 percent to 8.9 percent. Further,new housing starts dropped by 4 percent and the GDP dipped by 1.5percent.
The agricultural community incurred losses of $25 million ($14 million inQuebec and $11 million in Ontario). These losses primarily impacted thepoultry, livestock and maple syrup industries.
To the foregoing must be added the costs of repairing the Hydro-Quebecand Ontario Hydro electric towers and transmission lines, which areestimated to approximate $1 billion.
An estimated 2,000 dairy producers in Ontario and 3,500 dairy farmers inQuebec lost production. About 10 million litres of milk, worthapproximately $6 million, were dumped in Ontario and 3.5 million litres,worth nearly $1.8 million, were dumped in Quebec. Agriculture and Agri-Food Canada (AAFC) helped the Ontario and Quebec governments arrangefor generators to be supplied to dairy farms without power. Where localmilk processing plants had shut down, AAFC, the Canadian FoodInspection Agency, the Canadian Dairy Commission and the Department ofForeign Affairs and International Trade worked together to obtain temporaryauthorization from the U.S. Food and Drug Administration to exportunpasteurized milk to the United States for processing and return to Canada.
The costs to government and ultimately the taxpayers were increased by the:
♦ use of the federal military and national guard forces;♦ need for emergency and overtime police, fire and medical services;♦ necessity to undertake emergency repairs to infrastructure (bridges,
roadways etc.) and clear fallen trees, power lines and poles;♦ cost of sheltering and feeding thousands of individuals;♦ cost of operating administrative and emergency services; and♦ cost of debris removal and extra garbage collections.Added to these items must be the costs of disaster assistance and reliefpayments made to the victims.
A review of the assembled loss costs and estimates paints a vivid pictureregarding the size of this disastrous event, to which must be added the

Ice Storm ’98 Page 19
insured losses. These insured losses are described as the largest in thehistory of Canada’s insurance business.
In assessing the insured losses consideration should be given to theinsurance coverage that would have been available for individual risks. Theindemnification provisions vary and may have restricted the coverage. Inthis regard reference should be given to the Insurance Bureau of Canadapublication titled: Eastern Ontario Ice Storm, January 1998, InsuranceCoverage (see also Appendix 3).
Canadian Insured Losses as at July 21, 1998 *
ProvinceNo. ofClaims
% ofTotal
IncurredLoss Cdn. $
% ofTotal
Average Claim (Cdn $)
Nova Scotia Included IncludedNew Brunswick Included Included
Subtotal 600 .09 2,000,000 .18 3,333Quebec
Personal Prop. 512,971 697,070,666 1,359Commercial Prop. 35,762 312,522,745 8,739
Automobile P.D. 63,128 88,233,091 1,398Subtotal 611,861 87.83 1,097,826,502 99.80 1,794
OntarioPersonal Prop. 64,698 126,376 1,953
Commercial Prop. 14,861 81,227 5,466Automobile P.D. 4,580 5,510 1,203
Subtotal 84,129 12.08 213,113 0.02 2,533Combined Total 696,590 1,100,039,615 100.00 7,660
* Source: Insurance Bureau of Canada.Note: By October 1 the total had increased to $1.44 billion, although detailed claiminformation was not available.
United States Losses
Deaths and Injuries
The Ice Storm produced 17 deaths in the United States, the causes of whichparallel those in Canada. As in Canada, there was no central body to collectthe information pertaining to the nature or type of injuries sustained byindividuals.

Ice Storm ’98 Page 20
Economic Losses
The Federal Emergency Management Agency (FEMA) has documented thegeneral economic destruction and damage in its report titled: A Blueprintfor Action. The report delineates the following activities and losses:
♦ 500,000 homes and businesses were without power;♦ 70 percent of the forests in the region or 17.5 million acres of urban and
rural forests were damaged, creating an immediate safety hazard andlong-term economic loss;
♦ dairy farmers in New York alone reported a loss in livestock of $9.3million (U.S.) and a $12.7 million (U.S.) loss in milk;
♦ the loss of maple syrup production in the Empire State was set at $1.2million (U.S.);
♦ in Maine the snowmobile industry sustained staggering losses. The costof debris removal was set at $500,000 (U.S.) and loss of revenue fromthis tourist attraction was set at $2.5 million (U.S.).
These losses should be evaluated in conjunction with the limited area ofeach state that was involved, the sparseness of the population and the factthat no major population centres were involved. To these economic lossesmust be added the insured and other uninsured losses.
United States Insured Losses as at September 18, 1998
The loss statistics from Maine, New Hampshire, Vermont and New Yorkare summarized below.
Typeof Claim
No. ofClaims
% ofTotal
IncurredLoss
(U.S. $)
% ofTotal
Average Claim(U.S. $)
PersonalProperty
106,248 76.1 140,779,000 69.7 1,325
CommercialProperty
27,132 19.4 53,721,000 26.6 1,980
Automobile 6,270 4.5 7,541,000 3.7 1,371Total 139,650 100.0 202,041,000 100.0 1,447
Source: Property Claims Services.

Ice Storm ’98 Page 21
General Observations
To facilitate an understanding of the role of the federal governments, bothCanadian and American, in matters of national emergency, the followingbackground material is provided.
The Emergencies Act, (S.O.C.) 1988 Chapter 29, establishes and authorizesthe Canadian government to initiate “special temporary measures to ensuresafety and security during national emergencies…” Additionally, the Actgives Emergency Preparedness Canada (EPC) the responsibility for thepreparedness and coordination of emergency situations, thus establishing itas the paramount federal authority in these matters.
The Emergencies Act recognizes and defines the following four types ofnational emergency:
1. Public Welfare Emergency2. Public Order Emergency3. International Emergency4. War Emergency
While the other types of emergencies have or could have insurerimplications, Public Welfare Emergency is the one which is most pertinent.It is defined to mean an emergency that is caused by real or imminent (a)fire, flood, drought, storm, earthquake or other natural phenomenon, (b)disease in human beings, animals or plants, or (c) accident or pollution thatresults or may result in a danger to life or property, social disruption or abreakdown in the flow of essential goods, services or resources so serious asto be a national emergency.
The law recognizes that Canada’s geography and demographics varysignificantly, further than the ability of governments’ resources and services(i.e., both provincial and municipal) differ. Also, it recognizes the variety ofresources and services available in the private sector. Thus, the Actacknowledges that a uniform standard for national emergency arrangementsis neither practical nor possible and that planning must leave room forflexibility.
MITIGATIONRECOMMENDATIONS

Ice Storm ’98 Page 22
There is nothing in the Act that changes or alters the right, power or primaryresponsibility of the provinces to provide for the health and welfare of theirpopulations. Additionally it acknowledges certain basic planning principlesamong which are:
1. That the response is initiated by those affected, then augmentedby successive orders of government as additional resources areneeded.
2. That the operations are managed by the lowest order ofgovernment that can ensure an effective coordinated response.
The Emergency Preparedness Act prescribes the responsibilities of EPC.First among many is the development of policies and programs forachieving an appropriate state of national civil preparedness foremergencies.
The EPC publication titled Guidelines for National EmergencyArrangements provides detailed particulars to assist the provinces andmunicipalities in the planning and execution of their responsibilities. TheGuidelines examine, among others, the following subjects:
♦ the planning principle;♦ the steps of coordination;♦ federal/provincial coordination;♦ national emergency environments;♦ the need for a crisis management system;♦ an examination of the constitutional framework, and♦ planning assumptions.
The Emergencies Act and Emergency Preparedness Act provide theframework on which, under the leadership of EPC, the federal, provincialand municipal governments built co-operative and co-ordinated disasterresponse and mitigation programs. These are programs which recognize theuniqueness of Canada, its governments and the varying needs of its people.
In the United States the Federal Emergency Management Agency (FEMA)provides the federal point of contact for state and local governments onmatters regarding emergency preparedness and response for all disastersregardless of cause. Under the Robert T. Stafford Disaster Relief andEmergency Act of 1988 (P.L. 100-707) FEMA is given the authority toprovide for all disasters, regardless of cause. The Act lists FEMA’s disasterassistance programs and, in conjunction with the Federal Response Plan of1992, the process by which specialized assistance is afforded to victims.“Regardless of cause” has been defined to mean man-induced (caused)disasters as well as those resulting from environmental and natural sources.

Ice Storm ’98 Page 23
FEMA investigates the need for and identifies, designs and promotesmitigation initiatives. It develops and causes to be implementedpreparedness, response and recovery programs through its work with stateand local emergency managers.
In Disaster Management in the U.S. and Canada: The Politics,Policymaking, Administration and Analysis of Emergency Management,Richard T. Sylves and William L. Waugh describe FEMA’s traditionalstrategy as:
1. Enhancing the capability of state and local governments torespond to disasters;
2. Coordinating the 26 federal agencies assigned to provideresources to respond to disasters;
3. Giving federal assistance directly to citizens recovering fromdisaster;
4. Granting financial assistance to state and local governments; and5. Providing leadership, through grants, flood plain management
and other activities, for hazard mitigation.
Thus it can be observed that EPC and FEMA play similar, though notidentical, roles in the respective countries.
Canada’s Ice Storm Mitigation Efforts
Since the province of Quebec sustained the largest portion of the IceStorm’s damage and loss, the remainder of this section of the report willdraw on their response effort, which was built on the requirements of thefederal law.
Pursuant to the mandates of the federal Act, the civil security protectionenactments of the province require that “operations are managed by thelowest order of government that can ensure an effective coordinatedresponse”. Further, municipalities are required to identify the measures, takeadvantage of training offered by federal and provincial governments, andconduct drills or exercises. The point to be stressed is that mitigation, bothpre and post-event, is local and that effective, efficient programs begin andare implemented locally. Nevertheless, the roles of the federal andprovincial governments must be understood. To help with thisunderstanding, a brief explanation of their roles would be appropriate.
Some of the principal criteria found in the federal and provincial Actsprovide that: emergency operations are most effective when managed at thelowest level of government; the response structure should be built uponpermanent organizations; coordinated support from government (federal and

Ice Storm ’98 Page 24
provincial) should come from their external partners; intervention mustrespect the responsibilities of the participants; and that the response andrecovery structure must be flexible enough to accommodate allcircumstances.
Now for the key points in the roles of the major players.
Role of Provincial Government
The main role of the government is to coordinate all phases of the model,i.e., prevention, preparation, intervention and reconstruction. It carries outthese responsibilities by:
♦ establishing, implementing and maintaining an external supportsystem;
♦ providing an emergency manpower resource;♦ training the emergency responders;♦ providing management support; and♦ apprising all partners of their respective roles (duties and
responsibilities).
Role of Municipalities
The municipality shoulders the absolute responsibility for pre-eventplanning and preparation, event intervention and post-event response. Itaccomplishes its tasks by:
♦ identifying the risks in its territory;♦ developing and adopting measures to prevent or diminish, wherever
possible, these risks;♦ preparing for the deployment of emergency measures;♦ participating in training and exercises offered by the province; and,♦ maintaining, at all times, an Emergency Plan and a high level of
preparedness.
Role of Citizens
The citizenry bears the obligation of ensuring that they maintain minimumself-protection in times of disaster. The citizens are assisted in preparing forthe discharge of their responsibilities, by government, through:
♦ awareness and education programs;♦ news releases (electronic and print media);♦ public service announcements; and,

Ice Storm ’98 Page 25
♦ brochures and publications.
The roles of these key stakeholders must be clearly defined and understoodif mitigation and incentive programs are to be effectively developed andimplemented. Their roles place on them individually and collectively theobligation to assist in the elimination and/or reduction of the risk and, inturn of the potential loss.
Insurance and the Role of Insurers
In these discussions it must be remembered that while insurers haveconsiderable persuasive powers, they possess no public policy or policingauthority. Also, it should be recognized that insurers do not seek those typesof responsibility but rather contend that these authorities should continue tobe the prerogatives of government. Further, although insurers believe theyhave the confidence of their clientele and can be influential in developingattitudes, they do not seek to impose mitigation actions on theirpolicyholders. Because of their significant history, knowledge and expertisein matters relating to loss elimination, reduction and control, insurersbelieve that they should be consulted by government where appropriate.
What is insurance? What is the role of insurers?
Insurance is an economic institution that allows the transferof financial risk from an individual to a pooled group of risksby means of a two party contract. The insured party obtains aspecified amount of coverage against an uncertain event(e.g., an earthquake or windstorm) for a smaller but certainpayment (the premium).
The foregoing definition was excerpted from Paying the Price, published bythe John Henry Press.

Ice Storm ’98 Page 26
Ice Storm ’98 tested the “functional model” and provided lessons which ifheeded will provide for future efficiencies and loss reduction. In this sectionthe “lesson learned” and/or needs will be outlined.
Provincial Government
The following needs were identified:
♦ the creation of a civil security auxiliary team to facilitate increasedintervention activity;
♦ the publicizing of the roles and mandates of every participant; and♦ an explanation of the coordinating role of the Security Direction to
the partners and population.
Municipalities
These actions are deemed necessary:
♦ initiate steps to prevent or diminish the risk;♦ enhance the ability to rapidly deploy emergency measures;♦ devise alert and mobilization mechanisms; and♦ develop the ability to quickly and adequately intervene.
Citizens
They need to develop minimum self-protection reflexes.
In the remainder of this section, following brief comment regarding theUnited States, specific mitigation and incentive recommendations will beadvanced and the Missions of the Institute for Catastrophic Loss Reduction(ICLR) and Institute for Business and Home Safety (IBHS) discussed.
United States’ Ice Storm Response and Mitigation Efforts
The Federal Emergency Management Agency (FEMA) is the federal agencyresponsible for the United States’ mitigation policies and programs. FEMArecognizes that mitigation is a local issue and strives to create policies and
LESSONS LEARNED

Ice Storm ’98 Page 27
programs which are fully supported and implemented by the states, citiesand towns. FEMA endeavours to establish “collaborative partnerships,”which Michael Armstrong, Associate Director for Mitigation describes as:
based on open communication; mutually identified valuesand measures of success; [and] a working relationship thatcreatively seeks out and utilizes all opportunities andresources available to achieve the partnership’s goals andtrust.
Through these “partnerships,” which will comprise federal and stateagencies, voluntary agencies, the business community and other non-traditional organizations, FEMA will seek to bring about a nationalmitigation capability.
FEMA envisions a Comprehensive Partnership Mitigation Plan (CPMP) asincluding, at the federal level.
♦ technical support;♦ training;♦ policy dissemination;♦ guidance;♦ information clearinghouse functions;♦ coordination of federal agencies; and♦ policy resolution.
At the state level the CPMP would:
♦ develop and integrate statewide mitigation efforts,♦ manage state-based mitigation programs; and♦ provide local communities with training, technical assistance and
guidance.
In advancing the collaborative partnership concept, Associate DirectorArmstrong stated:
The limitations of the potential in some of the existingprocesses like mitigation planning combined with theseparation, if not isolation of programs (such as theEarthquake Program, Hurricane Program, NFIP, Dam Safetyand HMGP) have provided a dampening effect on thedevelopment of a holistic approach to mitigation.
While there are many similarities in the mitigation programs and efforts ofCanada and the United States, they are not identical, nor are the vexing

Ice Storm ’98 Page 28
problems which give rise to these initiatives. Nevertheless, where acommonality exists it behooves the two nations to share their experiencesand expertise in the interests of expediency and mankind. Ice Storm ’98 wassuch a situation.
Mitigation Recommendations
The mitigation recommendations which follow have been cast in broadcategories and terms, in anticipation that they will serve a twofold purpose:
1. to stimulate the thoughts and suggestions of those with hands-onexperience, and
2. to assist in developing specific recommendations.
When pursuing the development of specific recommendations, it issuggested that the Probable Maximum Loss (PML) event be defined. Whileacknowledging that PML can be defined in a number of ways, it isrecommended that it be established consistently as: the cost of repair(excluding business interruption) as a percent of the cost of replacementafter an event (i.e., 100 year flood; earthquake with a 475 year recurrence)with a 90 percent confidence level that the estimated repair cost will not beexceeded. Such a definition is needed to assist in the development ofmitigation initiatives and determination of their cost justification.
General Recommendations
The following areas are identified as requiring review and possible specificrecommendations:
♦ communications (cellular and telephone);♦ vulnerability of water filtration plants and water systems;♦ availability of large, heavy-duty generators for chronic care facilities,
hospices, nursing homes, hospitals and emergency operation centresboth public and private;
♦ development of alternative sources of energy to offset the staggeringdemands on normal sources at times of crisis;
♦ sheltering accommodations, food and feeding;.♦ medical, counseling, prescription services and security;♦ emergency fuel supplies – oil, gas (auto, diesel, propane) and wood.;♦ building, health, fire, safety and energy codes;♦ limited time pre-event actions; and♦ event response activities, (i.e., help lines and courtesy and
emergency transportation).

Ice Storm ’98 Page 29
Numerous sound mitigation initiatives can emanate from the foregoing.Also, specific pamphlets such as those published and distributed by bothCanadian and United States governments; EPC and FEMA; Canadian andAmerican Red Cross; the Institute for Catastrophic Loss Reduction and theInstitute for Business and Home Safety. By way of example, EPC’s newsrelease titled “Don’t Feel Powerless -- Prepare for Electricity Outages”(Appendix 4) is worthy of note.
Insurers have the knowledge, experience and expertise and can arguepersuasively on matters regarding loss control and reduction. These insurerattributes must be recognized, tapped and utilized as part of insurers’contributions to the mitigation efforts of government.
Incentives
As with matters relating to mitigation, insurers understand “incentives”,(their value, and how they function) and realize that they must be cost-justified. This reservoir of knowledge must likewise be tapped.
Iincentives can flow from many sources, including but not limited to:
♦ federal, provincial or state and municipal agencies;♦ financial markets;♦ banks;♦ private lenders; and♦ insurers.
Creative ideas and incentive sources must be developed to foster theundertaking of the mitigation initiatives. These could include:
♦ waiving of sales tax on items or materials used in the mitigationeffort;
♦ a reduction in property taxes that gives recognition to the lossreduction enhancements (contemplates a certification of the workundertaken).;
♦ discounting or waiving of the building permit, plan check orinspection fees when a retrofit is made in accordance with approvedstandards and procedures and the work is certified;
♦ low-interest loans for retrofitting;♦ discounts on new construction loans when the materials and
construction exceed the codes;♦ federal and state (provincial) income tax credits for retrofitting;♦ premium incentives;

Ice Storm ’98 Page 30
♦ reduced deductibles and coinsurance percentages reflecting changesin the risk from the implementation of mitigation initiatives; and
♦ availability of coverage and amounts that otherwise would not havebeen available.
To be effective the incentives must provide the property owner withsufficient remuneration to make the undertaking cost-justifiable and notcause financial strain. Incentives can have a favourable effect, but cannotbecome the burden of a single stakeholder.
Mitigation, Incentives and Insurers
Over the years insurers have championed the institution of both mitigationinitiatives and premium incentives. It was insurers who brought the first firedepartments into existence, initiated the first building codes, commencedboiler, machinery and elevator inspections, established the UnderwritersLaboratory (UL) and promoted the use of airbags in automobiles. Insurershave given premium credits (incentives) for the installation of sprinklersystems, smoke detectors, burglary alarms and the use of airbags. Likewise,insurers have been outspoken advocates for stronger building codes,stronger automobile standards and the enactment of land use measures suchas those that take people out of harm’s way while permitting the enjoymentof property rights. Insurers’ concern for the well-being of people andproperty continues and is evident by their establishment of the ICLR inCanada and of the IBHS in the United States.
The development of specific mitigation measures is well underway byinsurers; their trade organizations and other governmental agencies, firms,and academics. This report is designed to render an overview of themitigation responsibilities and to provide a context for the specifics beingdeveloped elsewhere.
ICLR’s and IBHS’s Mission Statements and key objectives provide visibleevidence of their on-going commitment to matters of personal safety andeconomic and property loss reduction.

Ice Storm ’98 Page 31
Institute for Catastrophic Loss Reduction (ICLR)
Mission Statement:
To reduce the loss of life and property caused by severe weather andearthquakes through the identification and support of sustained actions thatimprove society’s capacity to anticipate, mitigate, withstand and recoverfrom natural disasters.
Key Result Areas:
♦ building safer communities;♦ establishing safety partnerships;♦ enhancing industry awareness; and♦ promoting consumer awareness.
Institute for Business and Home Safety (IBHS)
Mission Statement:
To reduce deaths, injuries, property damage, economic losses and humansuffering caused by natural disasters.
Key Result Areas:
♦ public outreach;♦ community land use;♦ construction of new buildings;♦ retrofitting of existing structures; and♦ collection, analysis and dissemination of information.
ICLR and IBHS are similar, though not identical, organizations. Both arestriving to institutionalize mitigation as a national value. Working with allthe other stakeholders, that objective will be reached and society will beserved.
MISSION STATEMENTS ANDKEY RESULT AREAS

Ice Storm ’98 Page 32
The buzz words “sustainable development” have many definitions and areused in numerous ways by writers. For the purpose of this report thesewords will pertain to structures, their occupancy and use, and the economicvalue derived therefrom. In this context consideration will be given to thestructures’ ability to withstand the rigours of natural hazards and endureover time.
Advances in the science of building construction, when coupled with newand improved building materials, mean that structures can be erected whichare highly, though not totally, impervious to the impacts of seismic motions,water (flood), wind and ice. Buildings constructed in strict accordance withthe codes and made of the new damage-resistant materials should notreadily succumb to the effects of natural hazards. Likewise, structures whichare rehabilitated to incorporate construction strengthening technology andnew materials will have a significantly reduced failure potential.
During construction of new edifices and the retrofitting of existingstructures, consideration should be given to the improvements in thebuilding, fire, safety and health codes as well as to the many advances inenergy codes. Prudence dictates that attention be given to new materials andconstruction practices since all of these features (codes, materials andpractices) offer the potential of dramatic damage reduction and loss savings.
The savings derived from new energy codes, practices and materials couldbe particularly meaningful when consideration is given to society’sdependency on electricity. Electricity is used to heat and cool buildings;provide light; cook food; purify and pump water; operate computers,printers, and fax machines; pump fuel; operate life safety devices inhospitals, nursing facilities and homes; drive safety systems such as trafficlights, rail signals and air traffic control; maintain and operatecommunication links; run sewage plants; operate elevators, escalators andmoving sidewalks. It is clear that society has a heavy dependency on energy.It is also clear that efforts to mitigate loss from natural hazards must includeenergy considerations.
SUSTAINABLE DEVELOPMENT:ENERGY SOURCES AND NEWBUILDING MATERIALS

Ice Storm ’98 Page 33
Ice Storm ’98, with its destruction of 1,000 or more high-tension wirepylons, 25,000 to 35,000 wooden utility poles, and 120,000 kilometres oftransmission and distribution lines (enough to circle the globe three times),all of which left 5.2 million people in Canada and the United States withoutpower, light and heat, proved how vulnerable the electric service is. Asthere was no power to run elevators, offices, computer and manufacturingequipment, to pump water or provide heat in the cold of winter, business,commerce and manufacturing were brought to their knees. Reinforcing thedependency issue is the fact that Quebecers used electricity for 41.0 percentof their energy consumption in 1996 compared to the national average of23.8 percent. Thus, is it any wonder that energy must be elevated to a placeof greater prominence in the mitigation pecking order? Should not theapproach to hazards mitigation be holistic?
Consider the following “Holistic Approach to Mitigation” offered by Dr.Dennis S. Mileti of the University of Colorado:
We believe that continuing along the same hazards researchand practice will bring increased frustration (and losses) foreveryone. We need an approach with a much broaderperspective so that far more complexity in both natural andhuman systems can be taken into account. We need aparadigm that ensures true long-term mitigation and lossreduction that is as permanent as we can imagine, avoidingburdening future generations with risk. We need to be able toincrease the long term equilibrium between humans and theenvironment.
We propose a new framework for hazard research andmanagement. Although the new paradigm will embrace theidea of adjusting to the environment, it will go far beyondthat. It will be underlain by a global systems perspective; itwill embrace the concept of sustainability; and it will deriveits moral authority from local consensus. We call this newapproach “sustainable hazards mitigation.” Its goal is notsimply reducing losses, but building sustainable localcommunities throughout the nation. Under the new approach,actions to reduce losses would only be taken when they areconsistent with the five other principles of sustainability:environmental quality, quality of life, disaster resiliency,economic vitality, and inter- and intra- generational equity.
We emphasize that all five must be incorporated to achievetrue sustainability.

Ice Storm ’98 Page 34
Now is the time to discuss and debate this new mitigation paradigm, toacquire an understanding of what would be required and what would besaved by its implementation, and to set aside parochial considerations forthe benefit of all stakeholders.
Examination of this paradigm requires a through review and evaluation ofall hazards (earthquake, wind, tornado, hurricane, hail, flood, snow, ice,wildfire, etc.). The hazards analysis should be undertaken to giverecognition to the impact of that new and existing hazards would have onthe current and future life/business styles and dependencies of society.These hazards include geomagnetic storms. The report titled Coping withNatural Hazards in Canada: Scientific, Government and Insurance IndustryPerspectives delineates the hazard and risks from this type of event:
Geomagnetic storms are probably one of the least knownatmospheric hazards. They have wreaked considerable havocin the high northern mid-latitudes. For instance on themorning of March 13, 1989, a powerful geomagnetic stormoccurred causing a major power failure from northernQuebec to Montreal. The storm tripped a voltage regulatorand shut down one of the main lines stemming from the laGrande hydro electric complex in northern Quebec. Duringthe next 60 seconds, voltage levels became increasinglyerratic within the grid. Within 90 seconds, the entire 9,500megawatt power complex was isolated from the rest of thesystem. In all, the storm cost Hydro Quebec $10 million andits customers between $10 and $100 million (Lerner, 1995).
This same storm was responsible for the failure of three“fault tolerant” disk drives at the Toronto Stock Exchange,halting trading for three hours (Dayton, 1989).
Because of society’s dependency on electrical energy there must be anawareness of the problems that can flow from its disruption. An example isthe near-catastrophe which occurred on January 9, 1998 when atapproximately 12:20 p.m., both of the water filtration plants that provideMontreal and the 15 surrounding municipalities with drinking water shutdown simultaneously. Andre Lacroix describes this event in his article“Water Crisis – A Close Call for Montreal.” Without electricity to powerthe water pumping and filtration plants, homes, hospitals and businesseswould not have water for drinking, sanitation, air-conditioning and heatingsystems, or fire fighting. Depending upon the length of the interruption,serious health, fire suppression and business problems mount.

Ice Storm ’98 Page 35
If electricity and energy can give rise to problems, they also offeropportunities to maintain structures and their occupants. Increased energyefficiency can reduce, if not eliminate, the damage associated with “icedams.” A variety of energy efficiency measures can be applied to homes andbusinesses to mitigate this type of loss, including:
♦ better attic, roof, and eave insulation;♦ reduced filtration of warm air from living or working areas to attics;♦ sealing of heating ducts to prevent the escape of warm or hot air into
attics; and♦ the use of more efficient (less heat-producing) ceiling lighting
fixtures.
Particular opportunities abound in steel frame structures (an increasinglywidespread construction approach for both residential and commercialedifices) because the steel components conduct heat. If society avails itselfof the opportunities to control and mitigate loss in a holistic manner, naturalhazard events, while not eliminated, will be rendered manageable andcommunities safer.
Building, energy, fire, safety and health codes must be scrutinized andevaluated for their life and loss saving qualities. Code enforcementprofessionals will require training to meet the requirements and expectationsof the new paradigm. Also, the practices in use by inspectors must becarefully reviewed and updated where warranted.
New building materials must be sought and only those with the ability toreduce or prevent loss or damage and sustain the utility of the structureretained. The use of pressurized wood, waterproof exterior siding, enhancedwindow systems and glass, and insulation must be promoted so that they arethe builders’ choice and in demand by property owners.
Energy sources and alternatives (i.e., photovoltaic cells and windmill farms)must be thoroughly studied, evaluated and recommendations advanced.
It should be acknowledged that what will work in one place may not workin another. Flexibility in the design of the mitigation plan/strategy isessential, thereby providing room for alternative plans and procedures tofunction.
The new paradigm must not ignore politically difficult tasks or sensitiveissues. The issues associated with land-use measures must be confronted.How people and structures that are in harm’s way are handled is extremelyimportant to the sustainability of an environment that is subject to naturalhazard events.
Ice Storm ’98 Page 36
The holistic approach must evaluate the risks that are present and provide anindication of the potential loss frequency and severity facing inhabitants,businesses and governments that are susceptible to the vagaries of thevarious hazards. Also, the plan must give an indication of the cost benefitsto be derived if a comprehensive course of action is pursued. These facetsmust be accomplished using state-of-the-art technologies andmethodologies.
Insurers will need to evaluate the application of the “standards ofinsurability” in conjunction with the mandates of the new paradigm.Questions regarding the potential for catastrophe, occurrence cycles and theability of insurers to price the product must be addressed. In other words, aholistic approach should not be viewed as guaranteeing the availability oraffordability of insurance in the private sector.
The success of developing safer and more sustainable communities hingeson the willingness of those with knowledge, insights and expertise tochampion the concept. Ice Storm ’98 provided a real-world situation andserved to demonstrate the need for a holistic approach to mitigation. Thatapproach will succeed only if pursued vigorously by all stakeholders – i.e.,government at all levels (federal, state or provincial, municipal), insurersand banks, businesses (mercantile and manufacturing), utilities (public andprivate), academics, scientists and engineers, and the citizenry.

Ice Storm ’98 Page 37
Ice Storm ’98 is the costliest natural disaster to occur to date in Canada’shistory. It left 4.7 million people without electricity and heat for a prolongedperiod in the middle of winter. It caused property damage, insured anduninsured, and economic loss approximating $6.4 billion Cdn. Itdemonstrated the need for planning and the benefit of the emergencypreparedness work already undertaken. It also revealed the stoutheartednessof the Canadian people.
This storm placed a spotlight on the ability of insurers, both in Canada andthe United States, to underwrite those hazards which have catastrophicpotential, and raised questions regarding the possible frequency and severityof future events. It caused people to stop and think about the impact ofclimate on their lives. It brought to prominance issues relating to mitigation,land use, sustainable development and incentives for loss reductionactivities. It brought into focus the need for all stakeholders – government atall levels, including emergency planners and code officials, insurers andbanks, businesses and manufacturers, academics, scientists, engineers andjust plain people – to work together, to form partnerships and to toil in thespirit of full cooperation.
This event pointed out how dependent society has become on electricity. Itsignaled an urgency regarding the examination of how natural hazards arehandled and questioned whether the time has arrived for a holistic approach.It showed that natural hazards do not recognize national boundaries, andgave testimony to the importance of neighbouring countries planning andworking together to meet the challenges of these events. Through thesharing of experiences, knowledge and expertise, human suffering can bereduced, property destruction and damage lessened, infrastructure andcritical lifelines secured, and the sustainability as well as safety ofcommunities enhanced.
The matters outlined in this conclusion reflect noble goals and constitute thereasons for which the Institute for Catastrophic Loss Reduction (ICLR) andthe Institute for Business and Home Safety (IBHS), initiatives of theCanadian and United States insurance industries, have joined hands. TheInstitutes reach out to the other stakeholders and urge them to join us in ourcontinuing efforts to reduce deaths, injuries, property damage and economicloss caused by natural hazards
CONCLUSIONS


Ice Storm ’98 Page 1