IBUC 98 - Blaise · PDF fileof Blaise users, the International Blaise Users’ Conference,...
144
IBUC 98 5 th International Blaise Users Conference Lillehammer Norway 11. – 13. November 1998
Transcript of IBUC 98 - Blaise · PDF fileof Blaise users, the International Blaise Users’ Conference,...

IBUC 985th International Blaise
Users ConferenceLillehammer Norway
11. – 13. November 1998

Table of Contents
Experience of the Norwegian CAI-system ................................................................... 4Hilde Degerdal, Statistics Norway
What interviewers think about Blaise III? .................................................................... 9Vesa Kuusela Statistics Finland
The Health Survey for England -- Preserving consistency over multiple datasources ......................................................................................................................... 17Sven Sjödin, UCPR (UK)
Exploring Data Collection by the Internet.................................................................. 23Hans Wings and Ger Snijkers, Statistics Netherlands
The Models4 System: Simplifying data management in Blaise 4 Windows ........... 38Boris Allan, Westat (USA)
Imputation with Blaise and Manipula ......................................................................... 45Jelke Bethlehem and Lon Hofman, Statistics Netherlands
Diary and Office Processing : Integrating Blaise with other facilities..................... 64Michael DeMamiel and Fred Wensing, Australian Bureau of Statistics
Producing an error-free CAI instrument -- Is it possible? ........................................ 79Maureen Kelly, Office for National Statistics (UK)
Blaise III: Changing the data model after implementation ....................................... 92Pavle Kozjek and Marko Sluga, Statistical Office of the Republic of Slovenia
TADEQ: A Tool for Analysing and Documenting Electronic Questionnaires......... 96Jelke Bethlehem, Statistics Netherlands, and Tony Manners, Office for National Statistics (UK)
Redesign Labour Force Survey: Statistics Netherlands 1998 ............................... 104Marien Lina, Statistics Netherlands
The 1997 Census of Agriculture Experience at NASS ............................................ 115Roger Schou and Asa Manning, National Agricultural Statistics Service (USA)
The 1997 U.S. Residential Energy Consumption Survey’s Editing ExperienceUsing BLAISE III ......................................................................................................... 125Joelle Davis and Nancy L. Leach, Energy Information Administration (USA)
Using Blaise in a survey organisation where the researchers write the Blaisedatamodels ................................................................................................................. 130Tony Manners, Office for National Statistics (UK)

Preface
This book contents the papers that were presented at the fifth international meetingof Blaise users, the International Blaise Users’ Conference, IBUC’98. Theconference was held in Lillehammer, Norway on 11-13 November 1998.
Unfortunally the collection of papers is not complete. The main topics at theconference as well as in the book are: Interviewers and other data collection issues,Editing and processing, Design, testing and documentation, Case-studies of Blaisesurveys, Organisation and Users first look at Blaise 4 Windows. Two centralpresentations given at the conference, but not covered in the book are thepresentation of Blaise 4 Windows by Statistics Netherlands and the presentation onBlaise and EU survey harmonisation, given by Pieter Everaers at Eurostat.
The scienticfic committee consists of: Vesa Kuusela (Finland), Gilles Luciani(France), Mark Pierzchala (USA), Asa Manning (USA), Lon Hofman(Netherlands), Jelke Betlehem (Netherlands), Tony Manners (UK) and HildeDegerdal (Norway).The program Committee for the conferencee consists of: Tony Manners (UK), JørnLeipart and Hilde Degerdal (Statstics Norway).Hilde Degerdal has collected the paper for this book.

4
SSeeccttiioonn AA.. IInntteerrvviieewweerrss aanndd ootthheerr DDaattaa CCoolllleeccttiioonn IIssssuueess
Experience of the Norwegian CAI-system
Hilde Degerdal, Statistics Norway
The Norwegian system of Computer Assisted Interviewing was implemented in 1995.Then it differed from most other solutions in two main ways. Our interviewers hadlaptops with a full Windows version on, and it also offers, a opportunity to send e-mailbetween the interviewers. The main concern of our solution was to use standard programswith slight modifications. We chose Windows because it seemed certain that Windowswould become the computer environment in the future, and we thought that theinterviewers could get familiar with this from the start. Giving them a full Windowsversion also gave them the opportunity to use the laptops as a computer, not only as an«interviewing machine». In this paper I will describe our experience of this.
WindowsTo look back to 1995, of course we were worried about how to train 150 interviewers touse Windows. Our interviewerstaff consists of people in different age, 36% of them haveno experience in use of computer at all. For the interviewers that already were trained asinterviewers, we held separate 4 day’s computer courses. They learn to know theirlaptops, they were trained in Windows, the mail and Blaise. We divided the courses intotwo parts, so that they had some training time home by themselves. In this period they hadsome exercises to do, and they got familiar with the equipment.
Even though 60 % of those who attended courses for interviewers in 1995-1996, had usedWindows before, we gave them all the same training. We found it just to difficult testtheir skills.
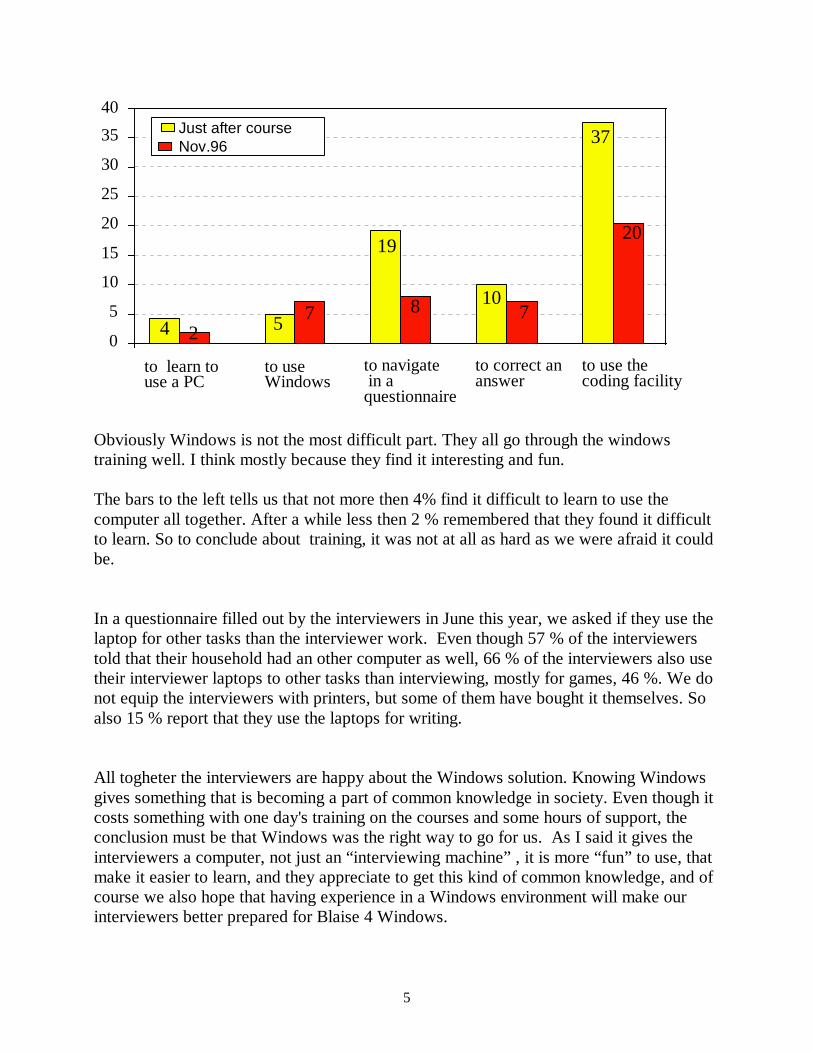
Those who were trained in the two first years got a questionnaire to fill in a couple ofweeks after the course. The data from this tells us that 5% find it difficult to useWindows. As a comparison 19% find it difficult to navigate in a Blaise questionnaire and37% to use the coding facility. So just 5% finding it difficult to use Windows is quitesurprising. In November 1996 we send a new questionnaire to the interviewers. Then werepeat some of the questions.
5
0
5
10
15
20
25
30
35
40 Just after course Nov.96
to use thecoding facility
to correct ananswer
to navigate in a questionnaire
to useWindows
to learn touse a PC
72
8 7
20
4 5
19
10
37
Obviously Windows is not the most difficult part. They all go through the windowstraining well. I think mostly because they find it interesting and fun.
The bars to the left tells us that not more then 4% find it difficult to learn to use thecomputer all together. After a while less then 2 % remembered that they found it difficultto learn. So to conclude about training, it was not at all as hard as we were afraid it couldbe.
In a questionnaire filled out by the interviewers in June this year, we asked if they use thelaptop for other tasks than the interviewer work. Even though 57 % of the interviewerstold that their household had an other computer as well, 66 % of the interviewers also usetheir interviewer laptops to other tasks than interviewing, mostly for games, 46 %. We donot equip the interviewers with printers, but some of them have bought it themselves. Soalso 15 % report that they use the laptops for writing.
All togheter the interviewers are happy about the Windows solution. Knowing Windowsgives something that is becoming a part of common knowledge in society. Even though itcosts something with one day's training on the courses and some hours of support, theconclusion must be that Windows was the right way to go for us. As I said it gives theinterviewers a computer, not just an “interviewing machine” , it is more “fun” to use, thatmake it easier to learn, and they appreciate to get this kind of common knowledge, and ofcourse we also hope that having experience in a Windows environment will make ourinterviewers better prepared for Blaise 4 Windows.
6
The MailsystemThe communication part of our CAI-system is a slightly modified version of MicrosoftMail. The modifications consist of facilities to receive interview tasks at the laptops andto return interview data. These facilities work almost automatically. The regular functionsof the MS Mail are not influenced by the modifications, so it is open for sending mailsbetween all users of the system. It means between interviewers and the office, and alsobetween one interviewers and another.
We are contented with this solution. E-mail is a convenient way to communicate. Themail system offers an efficient and cheap way to send messages and questions to theinterviewers, and vice versa.
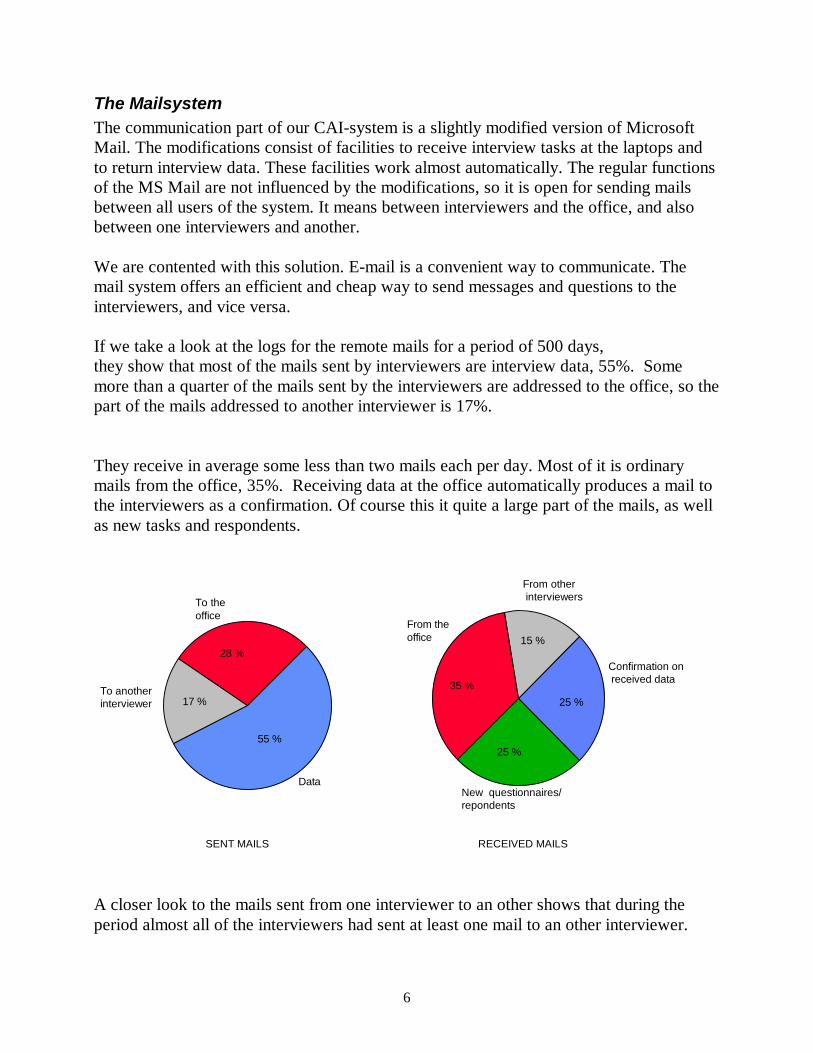
If we take a look at the logs for the remote mails for a period of 500 days,they show that most of the mails sent by interviewers are interview data, 55%. Somemore than a quarter of the mails sent by the interviewers are addressed to the office, so thepart of the mails addressed to another interviewer is 17%.
They receive in average some less than two mails each per day. Most of it is ordinarymails from the office, 35%. Receiving data at the office automatically produces a mail tothe interviewers as a confirmation. Of course this it quite a large part of the mails, as wellas new tasks and respondents.
25 %
25 %
35 %
15 %From theoffice
New questionnaires/repondents
From other interviewers
Confirmation on received data
RECEIVED MAILS
To theoffice
Data
To another interviewer
SENT MAILS
28 %
17 %
55 %
A closer look to the mails sent from one interviewer to an other shows that during theperiod almost all of the interviewers had sent at least one mail to an other interviewer.

7
The frequency of use differs very much. One fourth had sent more than 150 mails toanother interviewer. They have as you can see produced 80 % of the mails. The same sizeof part had sent less than 5 such mails.
30 %
20 %
10 %
0 %
40 %
50 %
60 %
70 %
80 %
90 %
100 %
10 20 30 40 50 60 70 80 90 100 110 120 130 140 150 160
Percentage of mails betweeninterviewers
Number of interviewers
To work from home as an interviewer is a lonely occupation, with very poor contact withcolleagues. So in the questionnaire in June almost everybody said they prefer to have thisopportunity to keep in touch, for example with people that they got to know on thecourses, or that work in the same area.Even though 97 % of the interviewers want the possibility, less then 2 % gave the answerthat they use this way of contacting colleagues very often. Nearly 70 % said they never orseldom do. Those who send mails to other interviewers, usually send it to somebody theylearned to know on the courses.
Of course the content in a mail from one interviewer to another is not known by us in theoffice. It can be a little worrying not to know what is going on out there. But often whenthey are mailing, they also send a copy to someone in the office. Some of the mails arejust social talk, jokes, cake recipes and things like that, but sometimes also more usefultopics like sharing experiences, giving hints, discussiongroups and so on. Mostly we findthe mails harmless. But we also have got to know some cases of undesirable use of themail system. From time to time you have interviewers that are not too happy about theirworking conditions When they start to discuss those matters by sending mails to all theinterviewers, somebody wants to say they agree or disagree, and then it sort of "takes off".Most of the interviewers do not like that sort of public grumbling at all. And we certainlydo not like it. But it is not easy to stop, because then they complain that we are not letting

8
them discuss matters in mails, that we ourselves have the possibility to discuss during thelunch breaks. But we do not feel that those few cases actually represent a problem.
The interviewers are not exactly paid for the time used for mailing. Even though oursystem of payment is based on hours used, time used for mailing and other administrationtasks, has been paid as four hours work each month.
So to conclude about the experience of having a mailsystem that offer a possibility ofmailing among the interviewers; it is something that the interviewers benefit of, they cankeep in contact with colleagues, it gives a way of sharing experiences, discussions ofworking conditions, sometimes useful and sometimes not. And it does not cost much.

9
What interviewers think about Blaise III?
Vesa KuuselaStatistics Finland
Introduction
In Statistics Finland (SF), Blaise III was introduced in May 1997 simultaneously with the newlaptops. Previous laptops were not powerful enough for Blaise III instruments and therefore theconversion was not possible earlier. Blaise III applications replaced Blaise 2.x applicationsgradually so that all new questionnaires were written by Blaise III, and by the end of same yearpractically all old questionnaires were converted to the new platform. The conversion wascarried out so that no visible changes were made to the user interface of interviewers’ laptop (seeKuusela, 1995). Of course, some changes were necessary in the initiation of an interview butthey were embedded in the shell software and they did not have an effect on the interviewers’daily routines.
Before Blaise III was implemented, the user interface of DEP was translated in Finish and theinterface was adjusted both to Finish language (changing hot keys), and to the object-based CAPIinformation system of Statistics Finland, as far as it was possible. For instance, most of the itemsin the File menu were not needed anymore, because of the architecture of the information system.
In Blaise III there are many new functions, but basically interviewing by a Blaise III instrumentdoes not differ much from a 2.x instrument. The major change is the interface of DEP, which inBlaise III is based on the drop-down menus and ‘hot keys’. On the other hand, there are manyminor changes, which have a direct effect on the interviewer’s usual working routine.
Still, the nature and the extent of the changes in the data entry interface were considered to callfor one-day interviewer training. The training included only the use of DEP menus and the newfunctions in DEP. Additionally trigram coding was included in the training because it was notapplied earlier. In the same context, also the new coding procedure was taught.
It is self-evident that interviewers are experts in interviewing. However, it is not always clearlyrecognised that they are also experts in the use of survey software and their opinions should be animportant factor in the design of the interface of the data entry software. In many organisations,lots of effort is put on improving the quality of surveys. The actual data collection is a critical partin the quality process that may lead to many kinds of errors and biases if disturbed some way.Interviewing as such is a delicate occasion, especially in a face-to-face interview, and thetechnical apparatus should be as transparent as possible so that it does not interfere with theinterview. Otherwise, the benefits gained by CAI may be lost.
Despite the evident importance of the usability testing of interviewers’ interface there appears tobe no reports or studies on that. However, the user organisations have little or no possibilities toinfluence the functions or appearance or survey software. Yet, monitoring interviewers’ feelings

10
and opinions is possible. In that purpose the interviewers of SF were asked about some features ofthe new software.
Study material
In June 1998, approximately one year after Blaise III was introduced, interviewers were askedabout their experience and feelings of the new system. Nearly all interviewers (n=133) completeda questionnaire where they were asked how they use different DEP function and what they thinkof the new features. In the present study are included also the 15 new interviewers hired after theintroduction of Blaise III and hence they had not use Blaise 2.x.
The longer-standing interviewers were mostly middle-aged women and most of them had fouryears experience with CAPI. The new interviewers were younger women and in their selectionwas applied the experiences on how the old interviewers had learned the use of the computer (seeKuusela, 1996). For instance, all the new interviewers were already familiar with computers andthey had more education than the older interviewers. Comparing the answers of the new and thelonger-standing interviewers had been interesting, but unfortunately the results based on 15casesare not very reliable.
Results
The CAPI information system in SF is based on object-based architecture (see Kuusela andParviainen, 1997, Gray, 1995). That means that every interview is stored in a separate file and theshell module initiates the interview and gives DEP the sequence number of the sample point. Thesequence number connects the form to the sample frame. If the sequence number in an openedform is changed, the link disappears and the probable consequence is that the case will end up astechnical non-response.
DEP asks the primary key regardless whether it was given during the initiation or not, andtouching any key (except enter) while the field is active will erase the entire field. Then, if theinterviewer does not remember the (sometimes eight digits long) sequence number, the case willbe lost. Also other organisations have faced the same problem (Sjodin, 1997). During the trainingthe danger was brought up and stressed many times and interviewers were advised how to bypassit. However, occasionally accidents have happened. The interviewers’ experiences were asked bythe following question:
Question: The sequence number is shown every time during the initialisation of an interviewand you must not change it. Have you ever changed it by accident?
Never 88%Sometimes but rarely 12%
The result means that 12% of interviewers have sometimes accidentally changed the sequencenumber, but it is not clear how many interviews actually have been lost. Probably not a very largeamount. On the other hand, the result shows that the danger is real and some cases will be losteven in the future unless the primary key field may be protected or hidden.
11
Selection of menu items
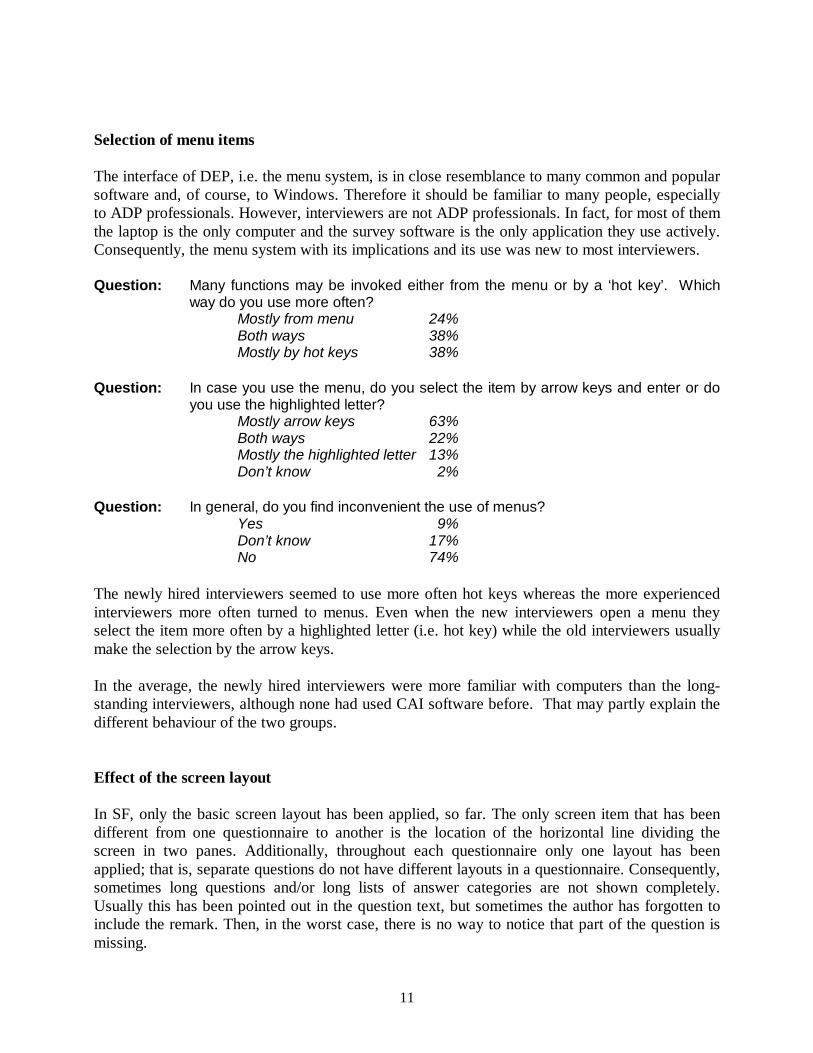
The interface of DEP, i.e. the menu system, is in close resemblance to many common and popularsoftware and, of course, to Windows. Therefore it should be familiar to many people, especiallyto ADP professionals. However, interviewers are not ADP professionals. In fact, for most of themthe laptop is the only computer and the survey software is the only application they use actively.Consequently, the menu system with its implications and its use was new to most interviewers.
Question: Many functions may be invoked either from the menu or by a ‘hot key’. Whichway do you use more often?
Mostly from menu 24%Both ways 38%Mostly by hot keys 38%
Question: In case you use the menu, do you select the item by arrow keys and enter or doyou use the highlighted letter?
Mostly arrow keys 63%Both ways 22%Mostly the highlighted letter 13%Don’t know 2%
Question: In general, do you find inconvenient the use of menus?Yes 9%Don’t know 17%No 74%
The newly hired interviewers seemed to use more often hot keys whereas the more experiencedinterviewers more often turned to menus. Even when the new interviewers open a menu theyselect the item more often by a highlighted letter (i.e. hot key) while the old interviewers usuallymake the selection by the arrow keys.
In the average, the newly hired interviewers were more familiar with computers than the long-standing interviewers, although none had used CAI software before. That may partly explain thedifferent behaviour of the two groups.
Effect of the screen layout
In SF, only the basic screen layout has been applied, so far. The only screen item that has beendifferent from one questionnaire to another is the location of the horizontal line dividing thescreen in two panes. Additionally, throughout each questionnaire only one layout has beenapplied; that is, separate questions do not have different layouts in a questionnaire. Consequently,sometimes long questions and/or long lists of answer categories are not shown completely.Usually this has been pointed out in the question text, but sometimes the author has forgotten toinclude the remark. Then, in the worst case, there is no way to notice that part of the question ismissing.

12
Question: Long questions and/or long lists of answer categories are not shown completelyon the screen and that has not been indicated every time. Have you facedproblems due to that?
Never 32%Sometimes but rarely 61%Repeatedly 7%
Less than one third of the interviewers have not faced problems with long questions. Bearing inmind that even researches make mistakes, this feature of Blaise III is a potential source of seriouserrors. In some cases there has been doubts whether the cause of a curious distribution was apartly ‘hidden’ list of answer categories.
Question: Scrolling the text of the long questions and/or long lists of answer categories ispossible by changing the active pane by pressing F6. Have you experienced it toocomplicated? Have you faced problems with that?
Never 42%Sometimes but rarely 56%Repeatedly 2%
The use of F6 to display the whole question text is appears convenient enough, but manyinterviewers have expressed that in Blaise 2.x this was handled in a better way. In Blaise III, thisproblem could be solved by different screen layouts, but their definition is so complicated that inthe usually very tight time limits it is not possible to design them.
Question: The question text may be shown in a separate screen by pressing F9 and thescreen may be enlarged by F5. Have you used this option?
Never 41%Sometimes but very rarely 52%Repeatedly 7%
Displaying the question text by the F9&F5 key combination is awkward and its applicability iseven more restricted because of the fact that the interviewer cannot make any selection in it.Therefore few interviewers use it.
Question: In multiple choice questions answer categories may be selected by first pressingkey F6 and then by arrow keys. Have you used this method?
Never 1%Sometimes but very rarely 10%Repeatedly 89%
The selection and marking the answers in a multiple choice questions by arrow keys suits well inthe situation, because both presenting and answering this type of questions if different from theother questions types.
Interviewing with Blaise III
Three questions dealt with the interviewing practice with Blaise III, that is marking the answers,browsing forms and moving in a form.
13
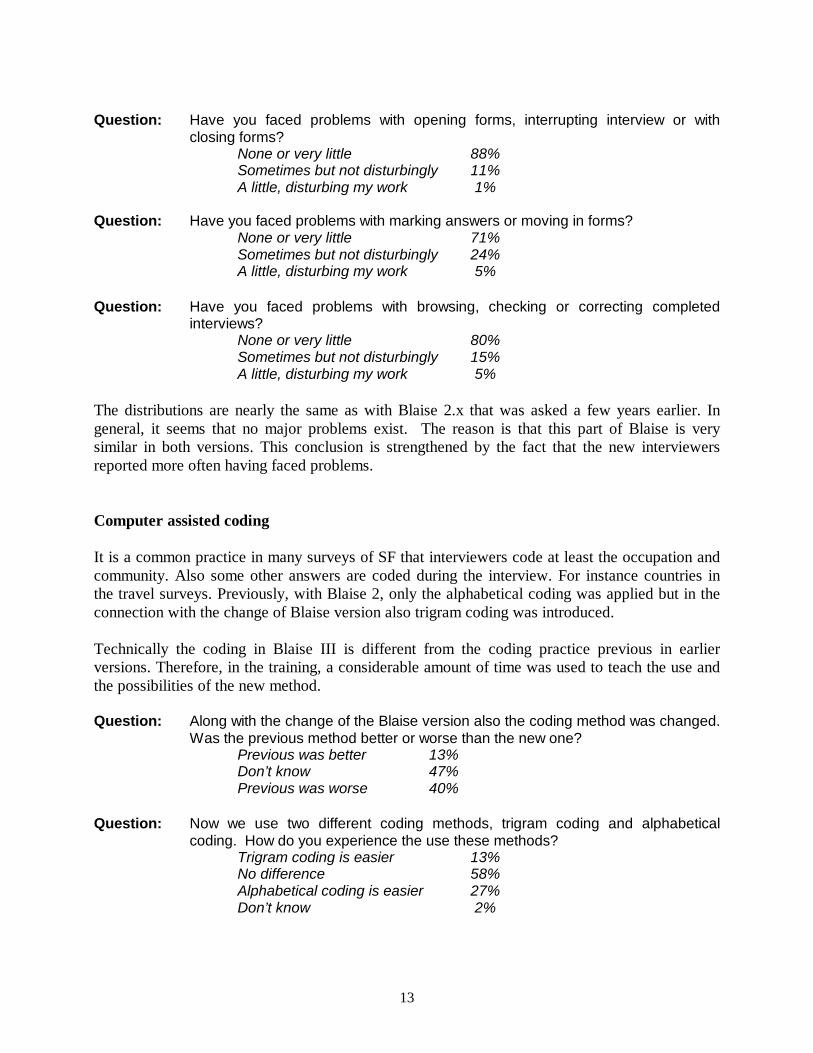
Question: Have you faced problems with opening forms, interrupting interview or withclosing forms?
None or very little 88%Sometimes but not disturbingly 11%A little, disturbing my work 1%
Question: Have you faced problems with marking answers or moving in forms?None or very little 71%Sometimes but not disturbingly 24%A little, disturbing my work 5%
Question: Have you faced problems with browsing, checking or correcting completedinterviews?
None or very little 80%Sometimes but not disturbingly 15%A little, disturbing my work 5%
The distributions are nearly the same as with Blaise 2.x that was asked a few years earlier. Ingeneral, it seems that no major problems exist. The reason is that this part of Blaise is verysimilar in both versions. This conclusion is strengthened by the fact that the new interviewersreported more often having faced problems.
Computer assisted coding
It is a common practice in many surveys of SF that interviewers code at least the occupation andcommunity. Also some other answers are coded during the interview. For instance countries inthe travel surveys. Previously, with Blaise 2, only the alphabetical coding was applied but in theconnection with the change of Blaise version also trigram coding was introduced.
Technically the coding in Blaise III is different from the coding practice previous in earlierversions. Therefore, in the training, a considerable amount of time was used to teach the use andthe possibilities of the new method.
Question: Along with the change of the Blaise version also the coding method was changed.Was the previous method better or worse than the new one?
Previous was better 13%Don’t know 47%Previous was worse 40%
Question: Now we use two different coding methods, trigram coding and alphabeticalcoding. How do you experience the use these methods?
Trigram coding is easier 13%No difference 58%Alphabetical coding is easier 27%Don’t know 2%

14
It seems that there was some discomfort with the new coding method. Nearly half theinterviewers could not say was the new method better or worse than the previous one. The reasonmay be the coding interface that is not very user-friendly.
Also interviewers’ attitudes on the trigram coding was slightly diffuse, although theoretically itshould be much better the alphabetical coding. Unfortunately interviewers were not asked tospecify why some of them found the alphabetical coding easier than trigram coding.
Three quarters of the new interviewers found no difference between the methods whereas nearly30% of the longer-standing interviewers found alphabetical coding easier.
General impression of Blaise III
In addition to the single features, the overall appearance of Blaise III is different from Blaise 2.x.For Instance, the wider possibilities to use colours gives many new possibilities for the designersand the colours make the looks of DEP more appealing. Consequently screens contain moreinformation which is fairly easy to grasp. Also some additional new functions (e.g. fornavigation) facilitate interviewers work. Some features interviewers cannot see because theyaffect the structure of a questionnaire, but they may make the forms functionally better, which onturn interviewers notice. This area of Blaise is difficult to cover with specific questions. It washoped that the questions below cover this aspect:
Question: Generally speaking, what do you think of Blaise III compared with the previousversion?
Blaise III is much better 21%Blaise III is better 69%Versions are equal 9%Blaise III is worse 1%
Question: Have there been problems in the use of Blaise III?Yes 12%No 88%
The specified problems were diverse and diffuse. Most reported problems were caused byunstable or otherwise badly designed questionnaires, not directly by Blaise. Yet, someinterviewers reported confusions with the use of the F6 key.
Interesting option in Blaise III is the inherent calculator but it was not clear would interviewersaccept it.
Question: In DEP, there is also a calculator. Have you used it?Yes 11%No 89%

15
Judged by the first impression, which was not very enthusiastic, it was slightly a surprise that11% of interviewers had really used the calculator. Probably its usage would by more frequent ifcopying the results to the form was easier.
Interestingly enough, the newly hired interviewers used the calculator more often.
Most of the major surveys carried out by SF are both in Finish and Swedish. When Blaise 2.x wasin use this was solved by installing two surveys in the bilingual interviewers’ laptops. The resultwas problematic in many ways and the possibility to use several languages in a singlequestionnaire was a major improvement. No one of the 15 bilingual interviewers regarded the oldversion better and only a few problems were reported. They were mainly caused by problems inswitching the language in the middle of an interview in questionnaires, which included imputedquestion texts.
Discussion
Overall, Blaise III data entry module was accepted well by the interviewers and they considered itbetter than previous Blaise versions. Some considered Blaise III as a major improvement.
Some functions were not accepted as well. For instance, interviewers’ opinions of the codingmodule were ambivalent. Probably the reason is the interface that is rigid and a little awkward. Afeature that may be a source of errors is the screen that sometimes ‘hides’ part of the questiontext. Especially when part of the list of answer categories is neither shown nor indicated thedanger is real.
As a final observation, we must remember that this study demonstrates only one aspect.Interviewers compared Blaise III to the previous version Blaise that they had used for manyyears. The results may have been different if interviewers were asked to compare Blaise to otherCAI software or to some totally different software.
As noted earlier, data capture is a key element in improving the quality of surveys. One part ofthis is the technical apparatus they (have to) use. It should be as transparent as possible so thatinterviewer may concentrate on interviewing and not having to think the functions of theinterface. In the development of data entry interfaces interviewers’ opinions and usability testingis important.
References
Gray, J.: An Object-Based Approach for the Handling of Survey Data. In Kuusela, V. (ed.):Essays on Blaise 1995. Statistics Finland, 1995
Kuusela, V.: Interviewer Interface of the CAPI system of Statistics Finland. In Kuusela, V.(ed.): Essays on Blaise 1995. Statistics Finland, 1995

16
Kuusela, V.: The Impact of Interviewer Background an Attitudes on Learning to Use theComputer. Presentation in InterCASIC ‘96 conference, San Antonio, 1996
Kuusela, V. Parviainen A.: An Object-Oriented Case management System for CAPI Surveys. InProceedings of the Fourth International Blaise Users Conference. INSEE, 1997
Sjodin, S.: Oral presentation in Fourth International Blaise Users Conference. Paris, 1997

17
The Health Survey for England -- Preserving consistency over multipledata sources
Sven Sjödin,SCPR (UK)
1. About the Survey
The Health Survey for England is sponsored by the Department of Health. It is a continuoussurvey conducted every year throughout the year. A new sample is issued every month. Themonthly sample size for the 1998 survey is 1140 addresses. The survey started in 1991 and hasbeen running continuously since 1993. The SCPR has conducted the survey since 1994 incollaboration with the University College of London.
The Health Survey for England is a household survey in the sense that most of the householdmembers are eligible for interview. The current rules for eligibility allow for ten adults and twochildren aged two to fifteen. Each interview starts with a household section to collect householdlevel information. The interviewer will then select up to four respondents for each session ofconcurrent interviewing to gather person level information. The person level data is partlycollected through self-completion booklets.
Concurrent interviewing is a method for increasing the efficiency of household surveys. Thesessions are built up by a succession of tables that enables the interviewer to progress with morethan one respondent at a time. The tables are short sequences of questions which are repeated foreach respondent in the session.
On agreement, each respondent will be visited by a nurse. The nurse records variousmeasurements and collects samples. The samples are then sent to a laboratory for analysis. Eachsample and measurement requires a signed consent by the respondent. Because of the nature ofthe survey, there is an obligation to report the medical results to the respondents, who are alsoasked for their consent for the results to be given to their GP (physician).
Apart from the laptops and any paper documents, the interviewers and the nurses carry a fairamount of equipment. The interviewers measure height and weight using stadiometers andelectronic scales. The nurses have Dinamaps for blood pressure readings; various tape measures;equipment for taking blood samples; and straws for saliva samples.
2. Problems in the Old Days
It is of vital importance for the quality of the survey that the person identifiers in each part of thedata are consistent and correct. The Health Survey for England has an unusual number of datasources that contribute to the final data set. In addition to the main and nurse interviews, there areself-completion booklets, consent booklets and various laboratory results.
This has always generated a vast effort to detect and solve inconsistencies, even once the mainquestionnaires were converted to CAPI in 1995. All the information passed between the

18
interviewer and the nurse was on paper. An error could occur each time a serial number or aperson number was transcribed. The only measure used to counter this problem was the use of therespondent's date of birth to supplement these internal identifiers. For this reason the date of birthwas typically recorded seven or eight times per respondent. Every time an inconsistency wasdiscovered a very complex set of rules was applied to resolve it.
The data collected with the nurse paper questionnaire also required a substantial amount ofediting. As every measurement is repeated at least twice there was an obvious risk of error frommisreading the equipment, recording the wrong value or recording a value in the wrong place.
3. Nurses going CAPI
The 1998 survey faced the need to minimise the risk of such inconsistencies. By converting theNurse Questionnaire to CAPI (Blaise III), we expected a significant reduction in the editing work.Most of the edit checks on consistency can be implemented in the data model. There are also theusual advantages of CAPI compared to paper such as enforcing the route; control over valueranges; and the possibility of recording the time spent interviewing. All the nurses are nowequipped with laptops and modems and are given the appropriate training.
Converting the Nurse Questionnaire to CAPI reduces the risk of internal inconsistencies. But itdoes not actually address the problem of inconsistencies between these different sources of data.A mechanism is required to pass data from the interviewer to the nurse in a way that is morereliable than paper forms. The situation is very similar to that of a panel survey. To control forconsistency, data from previous waves are sent out for each new wave.
Ideally, the nurse starts each case with all the relevant information already present. The nurseinterview is then coupled to the main interview so that, by definition, the identity of each personis consistent between the two.
We set out to achieve this by amending our in-office system. From the incoming main interviews,we generate data records which are made available to the nurses to download on to their laptops.The Survey Management system writes out ASCIIformat data files and the appropriate laptop identifier. The ASCII files are then converted toBlaise files for the nurse data model to use as external information.
This transfer information is a household level record with a set of person level sub-records. Itstores the name, age, sex and date of birth of each eligible household member. For children agedtwo to fifteen, it also holds information about the parents in the household.
4. Time Is Of The Essence
Our initial approach was to let the transfer mechanism drive the allocation of cases to nurses.That is, the nurses were only given access to the cases that had passed through the in-officesystem. This hard coupling guaranteed the consistency between the main and the nurse interview.
However, there were are three main time factors that ruled out this approach:

19
• First, unlike a panel survey wave, the nurse appointment can come very soon after themain interview. An interviewer can make an appointment for the nurse for the very same day.The transfer system needs at least one day to turn over the data and it is not operative overweekends. Therefore, the nurses have to be able to conduct the interview before they receivethe transfer information. In such cases the nurse has to enter the corresponding data from apaper form. This means that the nurses have to be issued with the same set of sampledaddresses as the interviewers. A further implication is the fact that the nurse data model has tobe a household level, rather than a person level, questionnaire.
• Second, the interviewer may not finish the whole household in one single appointment.Some households can take weeks to complete. Our standard procedure is to book in cases onlyif they have a final outcome code. For the Health Survey for England we also need to be ableto process incomplete households in case there is information to pass on to the nurse. Thenurse data model will then have information about the composition of eligible respondents, butwill not know whether or not each respondent agrees to see the nurse.
• Third, the same time factor applies to these residual respondents as apply to the wholehousehold. The nurse has to be able to start the interview before the final nurse agreementdata are available. In fact, we also have to allow the nurse to interview respondents whoexplicitly rejected seeing her at the time of the main interview. They may well have sincechanged their minds.
The nurse agreement data are sent out as a separate data file which is shared by all the nurses.The reason for this is the fact that, while the transfer information is produced just once perhousehold and requires some manual intervention, the agreement data may arrive at the office at alater date. The initial nurse agreement data, usually blank, are created for each eligible person atthe same time as the transfer information. It is then updated automatically each time newrespondents have completed the main interview. This information is needed to warn the nurse ifshe tries to interview a person who has rejected, or yet agreed, to see her.
Whenever a nurse opens a household or selects a person within a household and the data modelcannot find the corresponding transfer record or agreement data, the nurse has to override awarning to continue. These warnings are implemented as conditional fields. On the householdlevel, the field also gives the nurse a way of screening out addresses that do not require a nursevisit.
5. The Nurse Data Model
All these complications make the nurse data model very elaborate. It has to cater for severaldifferent scenarios. It has to record whether or not it is started in a manual or automatic mode, i.e.if the transfer information is present on opening the case. It also has to recognise when thisinformation subsequently arrives. If the household was opened in a manual mode and the transferinformation has since become available it has to cross check the information entered by the nurseagainst the transfer information.
The table below explains the different scenarios and their implications for the nurse data model.Each scenario starts with the state of the household when the transfer information is downloadedto the laptop.
Table 1. Scenarios and Nurse Data Model Behaviour

20
1 The household is not yet opened. The ideal situation. The transfer information isread and stored. No checking is required.
2 The nurse has entered all thehousehold information
The transfer information is read and checkedagainst the nurse entries. These entries are notaltered, but any inconsistent person level recordsare marked out. If so, the nurse is prompted tocorrect inconsistent person numbers.
3 The nurse has entered some of thehousehold information.
The transfer information is read and checkedagainst the nurse entries as above. Any residualperson level records are added to the householdcomposition data.
The nurse data model consists of a short household level section and up to twelve NurseSchedules for person level data, declared as parallel blocks. The household section contains ahousehold grid which is either filled in by the nurse (manual mode) or automatically from theexternal data file. It also handles the hidden mode control fields. Each Nurse Schedule is madeactive in the main RULES section if the nurse has manually entered a nurse agreement code orthe person record is found in the nurse agreement external file.
There are also up to twelve parallel drug coding schedules. This is where the nurses code therecorded drug names according to the British National Formulary (BNF) coding scheme.Declared as parallel, they are independent of the RULES section of the Nurse Schedule and canbe completed at any point during the interview.
6. Challenges Along The Way
Any Blaise III data model that depends on heavy initial computations and checking has to beprogrammed with great caution. For the nurse data model it is essential that each step ofcalculations is completed before the next step can start. The Blaise III dynamic checkingmechanism, however, will try to execute all the RULES sections in what seems like asimultaneous manner unless it is stopped by appropriate conditions. It has taken a great deal ofexperimentation to find these conditions.
The most time consuming parts of the Blaise programming were:
• The section in the main questionnaire in which the interviewer selects respondents forsessions of concurrent interviewing; and
• The initial control structures of the nurse data model.
In both cases the difficulties arose out of the need to find ways of stopping the dynamic checkingmechanism from setting vital control variables before the previous calculations and interviewerinputs are properly validated.
Both interviewers and nurses can be expected to need more than one appointment to completeeach household. This has special implications for the design of the data model. For example, thekey routing fields have to be safeguarded so that keying errors on re-entry will not take wholesections of the questionnaire off the route.

21
A different kind of technical challenge was posed by the nurse agreement data. If it fails to updateon the nurse laptops there is a risk that nurses cannot proceed with some person level interviews.The corresponding file on the network is almost constantly in use as it is downloaded each time alaptop connects to the office. This sometimes leaves very short time slots during which it can beupdated. It has taken some time both to recognise and to solve this problem.
7. The Future
Although the data has not yet been edited, we believe that the current setup will greatly reduceinconsistencies within the nurse interview data and between the main data and the nurse data,thereby reducing the editing effort.
Looking into the future, are there any ways to further improve the consistency between themultiple sources of data in the survey?
One obvious possibility relates to the self-completion section of the main questionnaire. Byturning this into a Computer Assisted Self Interviewing (CASI) section we could eliminate therisk of attaching an incorrect person identifier to the data. This has been considered, but rejected,as it would defy the principle of concurrent interviewing if the laptop has to be passed betweenrespondents and other respondents have to wait for their turn.
It is possible that we can improve the in-office system or use other electronic channels, e.g. theInternet or email, to speed up the data transfer from interviewers to nurses. If this can be achievedwe can also return to the ideal situation of only issuing nurses with the appropriate cases and atthe more suitable person level.
At the more futuristic end of the scale, we could minimise the risk of inconsistently labelledpaper components once laptops have built in label printers or printers are small enough to beportable. This would also work for nurse sample labelling.
In an ever growing market of home medical kits, e.g. pregnancy tests and DNA tests, it is notimpossible that one day we will be able to supply the nurses with blood and saliva analysisequipment, thereby cutting out the laboratories altogether.
For the 1999 survey there will be yet more challenges. Part of the sample will be aimed at ethnicminorities with interviews conducted in languages other than English. We have opted for a scriptbased system, rather than the Blaise languages facility, as six extra languages using non-Latincharacters would pose too much of a maintenance problem.
To improve the probability of finding ethnic minority households we will apply a method calledfocussed enumeration. For selected sample points the interviewers will call at the threeaddresses to the right of and the three addresses to the left of the sampled address in search ofethnic minority households.
A related issue is that, for multi-ethnic households, we will need to be able to re-allocate halffinished interviews to interviewers with the appropriate language skills.

22
8. Summary
The Health Survey for England is a survey with multiple sources of data. Apart from the mainand the nurse questionnaires, there are self-completion booklets, consent booklets and variouslaboratory results. There is a clear risk of inconsistent case and person identifiers between thedata sources. The task of identifying and solving these inconsistencies is very time consumingand prone to error.
For the survey year 1998 we have tried to reduce the risk of such inconsistencies with specialattention paid to the coupling of the main and the nurse interviews. By converting the nursequestionnaire to CAPI and implementing an automatic transfer of data from the main interview tothe nurse laptop, we have sought to reduce the risk of inconsistencies both within the nurseinterview and between the main interview and the nurse interview.
Some time related factors complicate the system. First, the first nurse visit can follow veryshortly after the main household interview, before the household composition data can betransferred. Second, the nurse may want to interview respondents before downloading anyinformation on whether or not they agree to see her.
These factors make the nurse data model very complex. It has to cope with different scenariosdepending on the state of the interview when the external data is transferred. It also has to caterfor the Blaise III dynamic checking mechanism as this will prematurely try to assign values tovital control fields unless stopped by appropriate conditions.
The way forward is to quicken the transfer of data from the main interview to the nurse. Ideally,this should also drive the allocation of person level cases to the nurses. The risk ofinconsistencies can never be completely eliminated, but there are some possible technicaldevelopments that may further reduce them.

23
Exploring Data Collection by the InternetHans Wings and Ger Snijkers, Statistics Netherlands
Summary: At Statistics Netherlands a pilot has been carried out to investigate the possibilities of e-mail for business data collection. The intention of Statistics Netherlands is to use e-mail and theInternet for data collection on a larger scale within a couple of years. These modern modes shouldbe integrated within a mixed mode design of data collection (together with more traditional modeslike paper and fax) where sampled businesses may decide on which mode to respond in. Thepurpose of this pilot was to find out how many and what kinds of businesses were willing toparticipate. Thus, an empirically based policy with regard to this modern mode can be developed.In this paper the design, response and characteristics of the participating businesses will bedescribed.
An aspect that is of great importance with regard to the usage of the Internet for data collection ona larger scale is a well designed measuring instrument, that looks ‘fancy’ on the screen and is easyto use. For Statistics Netherlands efficient data processing is an important issue. Blaise on theInternet (ConQuest) will deal with these aspects.
Keywords: Data collection, E-mail, Internet, Blaise.
1 IntroductionWithin Statistics Netherlands Electronic Data Interchange (EDI) has been a research topic for several yearsnow. The purpose of EDI is to collect business data that are stored in administration databases (primaryEDI) or in client administration databases (secondary EDI). However, not all data collected by StatisticsNetherlands can be gathered by means of EDI, simply because not all business data are available inelectronic databases. Thus, these data have to be collected in other ways, e.g. with use of self-administeredforms. Up till now these forms have been paper forms. An additional research program has been initiated todevelop ways of data collection by means of the Internet or e-mail: the EDI-Sheets program. The ultimategoal of this program is to collect the bulk of business data electronically within a couple of years.
To collect data in electronic ways several aspects of the survey have to be adapted, like the measuringinstruments (electronic forms in e.g. ASCII or HTML), the data collection process (like the transmission offorms) and the data processing. Within the EDI-Sheets program a pilot has been carried out to investigatethe possibilities of data collection by e-mail1. The design of the pilot may be qualified as self-administeredpaper-and-pencil interviewing with ‘paper-and-pencil’ replaced by a computer screen and a keyboard. Insection 2 this pilot will be described. In this section also several comments and suggestions forimprovements with regard to the design of the pilot will be described. As it turns out, these issues typicallydeal with Computer Assisted Interviewing (CAI). A CAI-tool is Blaise. In section 3 attention will be givento a new development regarding Blaise: Blaise on the Internet. In section 4 some conclusions are drawn.
1 This pilot has been carried out in co-operation with the subject matter department.

24
2 Data collection by e-mail: a pilot2.1 Design and responseTo investigate the possibilities of data collection by e-mail, a pilot study was carried out. In this pilot thequestionnaire of the monthly Survey on Short Term Economical Indicators was sent to businesses by e-mail.The survey-questionnaire is a short paper form with 10 questions: 9 closed questions and 1 open question.The survey describes the development of commissions in the manufacturing industry.
In order to get the e-mail addresses, respondents were asked to participate in an e-mail test for the month ofApril 1998. The recruitment was done in February. Two questions were added to the February form: one onwillingness to participate and one on the e-mail address. This resulted in 205 respondents who filled in theire-mail address (from a sample of 1547 businesses, of which 1355 returned a completed form). Almost allrespondents who filled in their e-mail address were willing to participate in the e-mail test: 192 (94%). Thismeans that, in relation to the total sample of businesses that received a paper form (1547), about 12% werewilling to participate in the test. These e-mail addresses were registered in the survey database.
The 13 respondents who filled in their e-mail address but who were not willing to participate were re-contacted by phone. They replied that they had no intentions to participate. Also 30 non-respondents withregard to the e-mail test were re-contacted by phone. Most of them replied that they simply did not have ane-mail address (24 non-respondents). A small number said that the business had an e-mail address, but thatthey could not use it (5), or that they did not know how to use it (1).
At the start of the test in April the recruited respondents received a letter to announce the forthcoming formby e-mail. The letter also included the registered e-mail address, in order to check this address. As a result,about 25 respondents replied with a corrected address. At the beginning of the fieldwork again about 25 e-mail addresses appeared to be incorrect. Most of these addresses could be changed. However, 9 addressescould not be corrected, so these respondents could not be reached by e-mail. Altogether, 51 of the registerede-mail addresses (27%) were incorrect. There are several reasons for this:• addresses had been written down incorrectly by a respondent;• addresses had changed;• addresses had been entered incorrectly into the survey database by Statistics Netherlands employees who
were not familiar with the conventions of e-mail addresses (data entry error), like the use of ‘@’ anddots;
Editing of the e-mail addresses in the survey database turned out to be a very time-consuming process.Eventually, 183 e-mail addresses were used to receive the electronic form by e-mail.
The electronic form transmitted was an ASCII form (a simple text file), that can be completed by use of anytext editor. At the start of the pilot some experiments were done using an HTML and a Blaise form.However, for several reasons it was decided to use an ASCII form:• an ASCII form is hardware and software independent;• an ASCII form is a small file, so a limited amount of data has to be transmitted to the respondent;• for both the sender and the receiver the system (sending and receiving an e-mail) is simple and hence
considered to be user friendly.Consequently, the received e-mails had to be entered with Blaise to make the answers available in anelectronic form.
A Blaise form was not discussed as an alternative because additional software (e.g. the Blaise Data EntryProgram) had to be transmitted to the respondent. Another alternative considered was the use of an HTML-form that can be filled in with an Internet browser like Microsoft Internet Explorer or Netscape Navigator.However, at that moment there was no software and hardware infrastructure available to handle the receivedforms.

25
The forms were sent to the respondents over a period of three days: 40 forms on Wednesday 22 April, 75forms on 23 April, and 77 on 24 April. With this way of transmission, the burden of having to deal with a lotof problems at the same time was reduced. Thus, respondents who called or mailed with a problem could behelped almost instantaneously. From that moment on two members of the project group were standing by tohelp respondents. It turned out that not many respondents needed help. Only about 5 respondents called forhelp: they could not read or open the message.
On Wednesday 6 May a reminder was sent to the respondents by e-mail, followed by a reminder by fax (apaper form) on Tuesday 12 May. All together, 157 completed forms were returned by e-mail. This is aresponse rate of 86%. The response figures for number of days within a form was returned, are listed in table1. Within two weeks a little more than 60 percent of the respondents had returned a form; within threeweeks 80% had responded. Some delay in completing and returning the form may be caused by the fact thatat the time of transmission some respondents did not yet have the data to fill in the form. After we received acompleted form a receipt of delivery was sent to the respondent by e-mail.
Table 1. Response after … number of daysReturned(within numberof days)
Responded Total Response
Spontaneously
After reminder No Numbers Rates (%)
e-mail Fax 1 32 - - - 32 32 11 2 -< 8 41 - - - 41 73 40 8 -< 15 23 16 - - 39 112 6115 -< 22 1 26 8 - 35 147 8022 -< 30 0 0 10 - 10 157 86Non-response - - - 26 26Total 97 42 18 26 183
During the preparations of the pilot extensive attention was given to safety measures to be taken, likeencryption of the completed and returned forms. Several encryption programs have been investigated withregard to the following criteria:• the program must have a limited size (since it had to be mailed to the respondent);• it must be hardware independent;• it must be easy to use by the respondent;• the encryption must be hard to decode.None of the programs seemed to fit all criteria. So, it was decided to add a disclaimer to the questionnaire,referring to the risks of data transmission by e-mail. But, for those who would like to encrypt the completedform, this possibility was offered. To do this, they had to call one of the members of the project group whowould tell them what to do. Only 6 respondents called to ask for encryption.
2.2 Analysis of participating businesses and respondentsIn order to analyse the pilot with regard to the participating businesses and respondents, 11 extra questionson background variables were added to the survey questionnaire:

26
1? The first two additional questions asked for comments and suggestions for improvement by therespondent (thus offering the respondent a way to express his feelings about the test).
2? Then two questions followed on the time needed to complete the survey questionnaire and the numberof persons involved.
3? Followed by two questions on the computer organisation of the business and two questions on the use ofthe Internet: business and personal. (Other business characters, like the activity code and business size -the number of employees-, werealready known from the Business register.)
4? And at the end three questions on personal characteristics (gender, age and education level) were asked.
Ad 1. As for the comments and suggestions about 40 respondents reacted with about 60 suggestions intotal. Regarding the comments, the following may be concluded in either positive (+) or negative (–) way:+ The respondent regards the use of e-mail to transmit questionnaires as a positive development.+ There were only a few technical problems reported. About 5% of the respondents reported a technical
problem. These problems concerned not being able to read or open the message. Therefore, we mayconclude that the respondents who have an e-mail address know how to use it.
+ No surprising technical problems were reported. Therefore, we regard the use of e-mail to be a reliablemode for data collection, with data quality comparable to the traditional paper mode.
– The electronic form (see figure 1) should be improved. 28 Comments and suggestions concerned theperformance and the presentation of the ASCII form, including:• scrolling and the use of the cursor keys were considered annoying;• answering a question neither positions the cursor on the next question automatically nor places the
next question on the screen;• answering a question changes the layout of the text (e.g. text moves on the screen);• answer possibilities were not adjacent to the question. However, these comments were expected beforehand, since we ourselves had these comments, based onthe experiments we had done at the start of the pilot. Although, with the use of ASCII these properties(except for the last one) were inevitable, still it was decided to choose ASCII (as discussed in section2.1).

27
Figure 1. The ASCII form on the computer screen (as presented by Microsoft Exchange)
It turned out that the safetymeasures taken (encryption) wereconsidered relatively unimportant.It seems that respondents are notaware of the privacy risks that areinvolved in the use of the Internet.
Ad 2. The average time needed tocomplete the survey questionnaire(with exclusion of the additionalquestions) was 9.5 minutes, aboutone minute longer than for thepaper form2. The difference in timemay be explained by the newsystem (extra time needed foropening and reading the form) andthe properties of the ASCII form asmentioned before. It is expectedthat this difference will disappearwith repeated e-mail measurement.The average number of peopleinvolved was 1.25.
Ad 3. The participatingbusinesses may be characterised asfollows:• In the sample only industrialbusiness were included.• Relatively more larger
businesses participated in the test than smaller businesses (see table 2). This effect is significant. Thefigures in table 2 show that 32% of the largest businesses (with more than 500 employees) was willing toparticipate in the test, while for the smallest businesses this was about 7%.
• The businesses that participated are businesses with a modern computer organisation (see table 3): theyhave an internal computer network, use Windows, and are connected to the Internet for browsing.
2 This question was also printed on the paper form, since it is policy of Statistics Netherlands to measure (and reduce)the interview burden for businesses.

28
Table 2. Number of businesses for willingness to participate and number of employeesNumber ofemployees
Willingness to participate Total
1 Yes No 11 Number Row-% Number Row-% 1
10 -< 20 10 6.7 140 93.3 150 20 -< 50 32 8.1 361 91.9 393 50 -< 100 30 8.9 308 91.1 338100 -< 200 41 13.3 268 86.7 309200 -< 500 38 16.6 191 83.4 229 > 500 41 32.0 87 67.0 128Total 192 12.4 1355 87.6 1547
Table 3. Computer-organisation of the businessesA. Internal computer network
Operating system Total
Windows Othersystem
3/3.11 95/NT *)Yes 23 84 30 2 139No 0 9 5 0 14Don’t know 0 0 0 1 1Missing 0 0 1 2 3B. Connected to the Internet (for browsing)Yes 14 83 30 2 129No 9 8 5 1 23Missing 0 2 1 2 5Total 23 93 36 5 157*) Windows version is missing
Ad 4. The respondent (who participated in the e-mail test) may be characterised as a highly educatedman, between 30 and 50, who is computer minded. 91% of the respondents is male, with an average age of39 years. The average age of the female respondents is 33. (See table 4 -age and education level- and table5 -use of the Internet).

29
Table 4. Age and education of the responding employeeAge Highest education level Total
Lbo 1),mavo 2)
Mbo 3),havo 4),vwo 5)
Hbo 6) University Missing
21 -< 25 0 3 2 0 0 525 -< 30 0 2 13 2 0 1730 -< 35 2 8 15 12 0 3735 -< 40 0 3 16 7 0 2640 -< 45 0 5 6 3 0 1445 -< 50 0 6 11 1 0 1850 -< 55 1 10 7 4 0 2255 -< 60 0 3 2 1 1 7Missing 0 1 0 0 10 11Total 3 41 72 30 11 157
Average age of the male respondents (139): 39 yearsAverage age of the female respondents (13): 33 years1? lbo: lower vocational education2? mavo: advanced elementary education3? mbo: intermediate vocational education4? havo:secondary education5? vwo: secondary education6? hbo:higher vocational education
Table 5. Use of Internet: business and personalBusiness Internet-use Personal Internet-use Total
Yes No MissingYes 69 23 1 93No, but there is a connection 15 20 1 36No, there is no connection 4 19 0 23Missing 1 0 4 5Total 89 62 6 157
2.3 Internal evaluation of the pilotAlso internally the pilot has been evaluated. Apart from the conclusions already mentioned in the lastsection, the following main aspects may be concluded, both positively (+) and negatively (–):+ The pilot resulted in a lot of information, on response rates, the scope for using e-mail for data-collection,
the perception of the respondents with regard to e-mail and the electronic questionnaire, the number oftechnical problems.
+ E-mail is considered a reliable mode for data collection.– Not much attention was given to the processing of the collected data. This meant that the completed e-
mail forms were printed out and the data were entered into the survey database manually. As for the pilotthis was no problem, but for a monthly production process this has to be automated.
Despite the fact that many respondent reactions concerned the ASCII form (as expected), we consider thechoice for a simple design the right one. Thus, the data collection procedures and the technological aspects

30
were simple. In this way, e-mail seems an additional tool for data collection. E-mail can be used for thetransmission of simple questionnaires in a mixed mode design (in which the respondent decides on the modefor responding, like paper, fax, e-mail, etc.).
However, data collection by the Internet has to be explored more fully.
3 Blaise on the Internet3.1 Developing an interviewing tool for the InternetAs stated in section 2.2 and 2.3, still some issues (as carried out in the pilot) have to be improved to get adesign for data collection by the Internet that satisfies both: the respondents (with respect to entering data inelectronic forms) and Statistics Netherlands (with respect to the data collection procedures and dataprocessing). CAI tools (Computer Assisted Interviewing) typically solve such issues. Alternative modernelectronic forms and ways to collect the data have to be developed e.g. HTML-forms; Excel spreadsheets, oronline filling in of an electronic form. The latter is discussed here.
Statistics Netherlands has used the Blaise system to conduct surveys for years. From this point of view it isobvious to develop an interviewing tool for the Internet based on the Blaise system. The effort to developsuch a tool is limited to developing a front-end tool, which will replace the Data Entry Program of the Blaisesystem in an Internet environment. In fact, this CAWI tool (Computer Assisted Web Interviewing) isnothing less than an alternative input tool beside the already existing CAI tools. To develop such a toolStatistics Netherlands has started a project called ConQuest (Processing Questionnaires at your InternetConsole).
3.2 Objectives of ConQuestEventually, ConQuest should become a tool, which covers the complete functionality of the current DataEntry Program of Blaise. For the short term the objectives are less ambitious: develop an interviewing toolfor the Internet which can be incorporated in the current statistical process and which covers a wide range ofsimple questionnaires. Then, in successive versions the tool will be extended with more Blaise features. Inthe following sections the architecture of the ConQuest System is explained. We emphasise on theconsiderations, which are the basis of some important design decisions.
3.3 Architecture of ConQuestWhile designing an interviewing tool for the Internet we have to take into account two software solutions:on the one hand a software component which presents the questionnaire to the respondent and on the otherhand a software program at the Internet server which processes the transmitted data.
3.3.1 The presentation of the questionnaireThe presentation softwareWhen choosing software for the presentation of the questionnaire it is important to take into account thediversity of environments respondents might use. All kinds of computer platforms are possible. It is obviouswe don’t want a software solution, which depends on the computer infrastructure of the respondent.However, we also don’t want the respondent to meet certain hardware requirements or to install additionalsoftware. Investigating the possible technical solutions, the use of an Internet browser seems to be the mostobvious choice:• On almost all main stream computer platforms some kind of Internet browser is available or will be soon;

31
• Browsers are part of the standard software installed when connecting to the Internet and can be obtainedfree of charge.
• HTML, the language that defines the content of a page in a browser, offers sufficient elements to presenta questionnaire on the screen.
Choosing Internet browsers as the client software raises the question of which browsers should be supportedby the system. Several studies indicate that supporting Microsoft Internet Explorer 3.x and higher andNetscape Navigator 3.x and higher will cover 80 - 90% of the browsers, which are used by the Internetpopulation at the current time.The questionnaire logicThe questionnaire logic consists of the routing instructions and the consistency checks as defined in theBlaise data model. Not only rules defined in a data model can be complex and large, but also themechanism to evaluate this rules is very complex and hence a large piece of software. If we want toexecute this questionnaire logic at the computer of the respondent we have to transmit the rulesinformation and the software component that handles the rules to that respondent. Technically this ispossible with Java applets. However, the amount of data to transmit to the respondent is considered to betoo large. Several seconds waiting time in an interview situation is not acceptable. Consequently, theConQuest System executes the questionnaire logic at the server.To restrict the amount of transmitted data and the frequency of server requests the ConQuest Systemexecutes the range check of a field in the browser itself. This is realised with JavaScript, a simpleprogramming language that can be executed by the browser. The range check of a classification field inthe browser implies that the complete classification of that field has to be transmitted to the browser. But,a classification may be very large and in addition a classification field is usually answered through aclassification dialog. As stated before, we want to avoid transmitting large amounts of bytes to thebrowser. Hence the ConQuest System does not support classification fields for the time being.Executing the questionnaire logic at the server and the intrinsic possibilities of HTML to describe thecontents of a browser page imply that the ConQuest System presents one question per HTML-page only.The content of a browser page defined with HTML is static and can’t be changed, so it is not possible tovisualise for example a change in the routing of the questionnaire in a HTML-page which contains morethan one question.Because the functionality of Internet browsers will evolve and the transmission speed will increase as aconsequence of the available bandwidth on the Internet, most of the above mentioned constraints willbecome invalid. It is evident: in future versions of ConQuest parts of the questionnaire logic will shiftfrom the server to the browser.
3.3.2 The server softwareConsidering the IT-infrastructure at Statistics Netherlands, the server software of the ConQuest System isdeveloped for a Microsoft NT server with Microsoft IIS (Internet Information Services). Amongst otherthings an important advantage is the scalability of the system. The number of concurrent users ofConQuest depends on sufficient hardware resources only. The server software makes use of severalcomponents, which we will discuss briefly.The ConQuest Dep ManagerThe ConQuest Dep Manager contains the application logic. It handles the active interview sessions,redirects all received browser requests to the appropriate interview sessions, stores answers in the Blaisedatabase and executes the questionnaire logic of an interview session. It is the intermediate between thepresentation of the questionnaire and the Blaise database.The data storageThe data is stored in a Blaise database, so all Blaise tools can use the data collected with ConQuestinstantaneously.The ConQuest Web ManagerThe ConQuest Web Manager contains a set of HTML-templates (comparable with templates in forexample Microsoft Word). The HTML-templates define for example the base layout of an HTML page to

32
present a question. The layout of the HTML-pages resembles the default layout of the Windows version ofBlaise as much as possible. Depending on the current state of the interview, such as ‘ask the nextquestion’, the ConQuest Web Manager takes the appropriate HTML-template and completes it to a finalHTML-page, which will be transmitted to the browser.
33
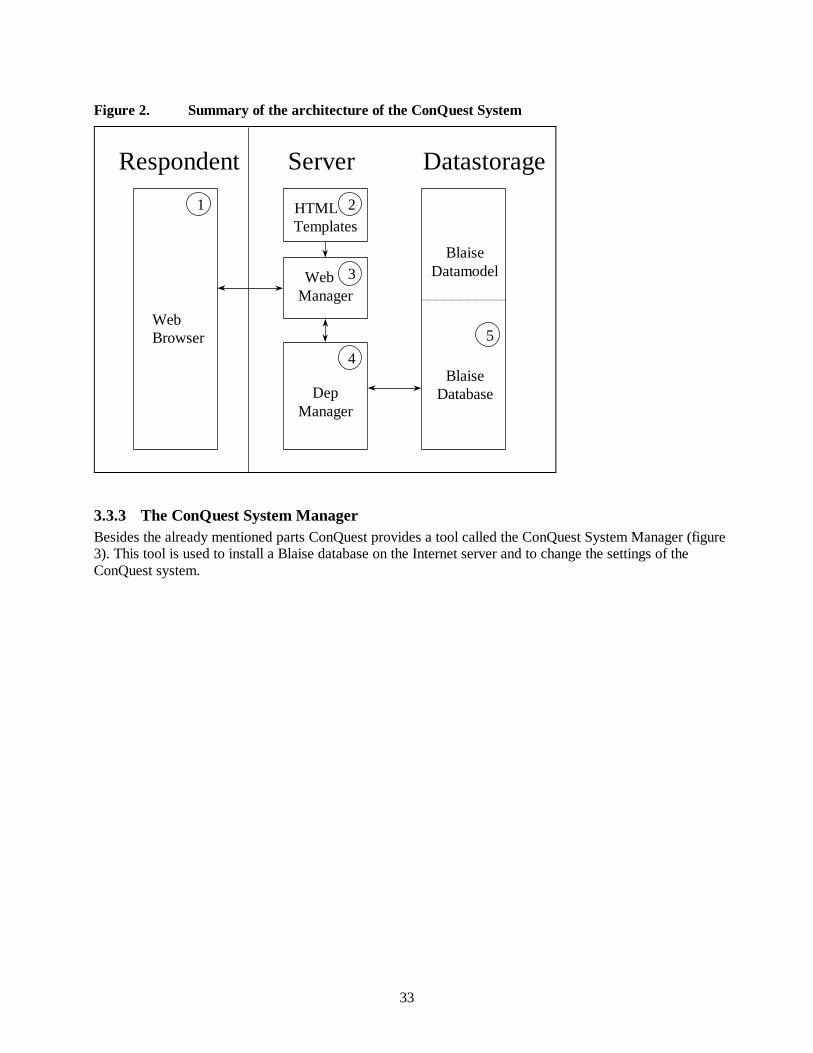
Figure 2. Summary of the architecture of the ConQuest System
WebBrowser
BlaiseDatamodel
DepManager
HTML Templates
Web Manager
BlaiseDatabase
1
3
4 5
2
ServerRespondent Datastorage
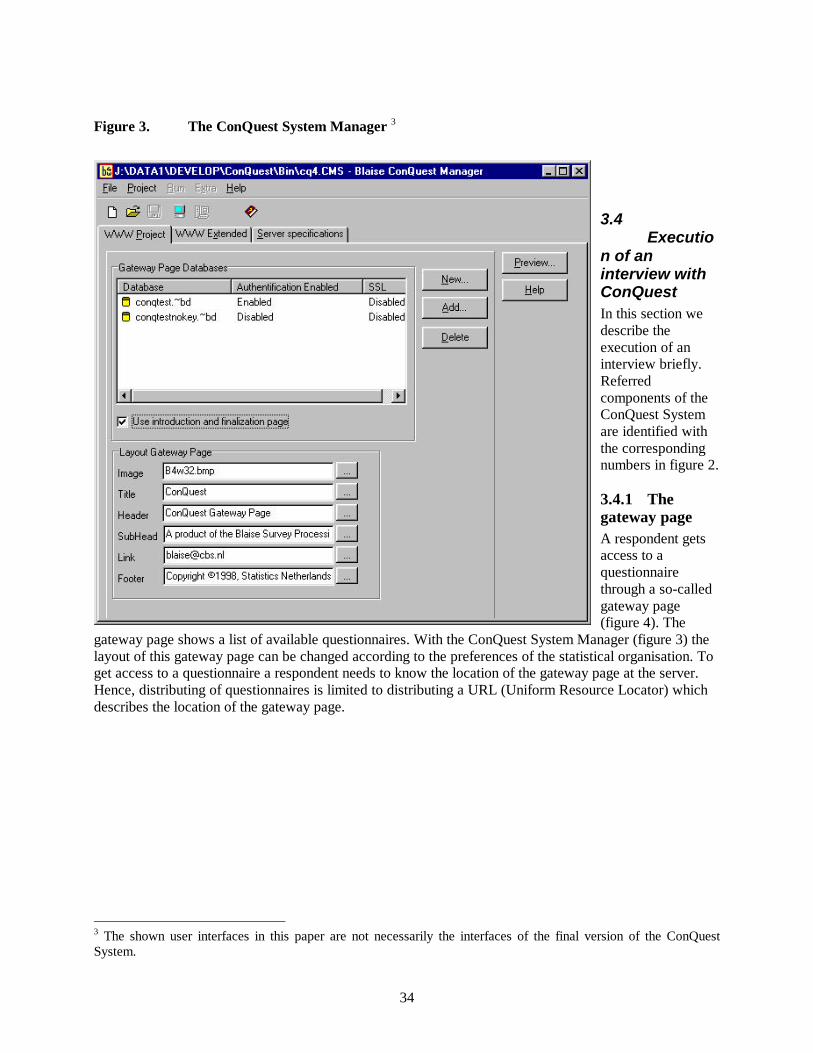
3.3.3 The ConQuest System ManagerBesides the already mentioned parts ConQuest provides a tool called the ConQuest System Manager (figure3). This tool is used to install a Blaise database on the Internet server and to change the settings of theConQuest system.
34
Figure 3. The ConQuest System Manager 3
3.4Executio
n of aninterview withConQuestIn this section wedescribe theexecution of aninterview briefly.Referredcomponents of theConQuest Systemare identified withthe correspondingnumbers in figure 2.
3.4.1 Thegateway pageA respondent getsaccess to aquestionnairethrough a so-calledgateway page(figure 4). The
gateway page shows a list of available questionnaires. With the ConQuest System Manager (figure 3) thelayout of this gateway page can be changed according to the preferences of the statistical organisation. Toget access to a questionnaire a respondent needs to know the location of the gateway page at the server.Hence, distributing of questionnaires is limited to distributing a URL (Uniform Resource Locator) whichdescribes the location of the gateway page.
3 The shown user interfaces in this paper are not necessarily the interfaces of the final version of the ConQuestSystem.

35
Figure 4. Example of a Gateway Page
3.4.2 Theinterview sessionThe respondentchooses aquestionnaire on thegateway page andsubmits this choice tothe server. Thisinitialises aninterview session atthe server. At theserver the ConQuestDep Manager (4)computes the firstquestion to be askedaccording to theBlaise data model of
this particular questionnaire. Then the ConQuest Web Manager (3) chooses the appropriate HTML template(2), completes this template to an HTML page for this question (figure 5) and transmits this page back the tothe Web browser (1) of the respondent. This first question starts the interview.
3.4.3 Answering a questionAfter an answer has been filled in the respondent submits the content of the HTML-form back to theserver. The Dep Manager (4) assigns the answer to the correct interview session, stores the answer in thematching Blaise form, activates the Blaise rules and computes the next state of the interview. According tothis state the whole cycle is repeated again: complete the appropriate HTML-template to an HTML-pageand transmit it to the browser. If the last question of the interview has been answered the Dep Manager (4)stores the Blaise form in the Blaise database (5).

36
Figure 5. Example of an enumerated field
3.5 Supported Blaise functionality of ConQuestAs stated before the first version of ConQuest will support a subset of the Blaise DEP functionality only.In this section we will summarise this subset.
3.5.1 Functional limitations• The first version of ConQuest supports all Blaise defined field types except the classification type.
Classification fields are usually answered through a classification dialogue, which can't be implementedwith standard HTML or JavaScript yet.
• ConQuest does not support the usage of external files through a lookup dialogue. As for the classificationdialogue, the lookup dialogue can not be implemented with HTML and JavaScript.
• ConQuest does not support alien routers. Because the client is assumed to be platform independent thecurrent implementation of alien routers through DLLs can't be used with the Conquest system.
3.5.2 Different look and feelBecause the Internet environment differs from the Windows environment it is not possible to achieve thelook and feel of the Dep of Blaise for Windows exactly. ConQuest tries to come as close to the look and feelof the Windows Dep as possible. Some differences are:• answering an open question: the open question is not answered in a separate so-called modal window but
through a so-called textarea-control on the HTML-page;• layout of a Blaise page: the layout information of the Blaise datamodel is not used, but a standard layout
is used only.
4 ConclusionsThe e-mail test resulted in a lot of information. Both respondents and the project group at Statistics

37
Netherlands consider e-mail (with an ASCII form) to be a reliable mode for data collection, with fewtechnical problems and data quality that seems comparable to the paper mode. For the businesses thatparticipated in the pilot, response rate was high (86%). Based on these results, the department responsiblefor the Survey on Short Term Economical Indicators has decided to use e-mail for data collection on apermanent basis, along with the traditional paper form. But, as we have seen, several aspects need to beimproved.
With the use of Blaise on the Internet the presentation and the performance of the questionnaire (automatedrouting, range checks), the data collection procedures and the data processing (data entry) will bemodernised. When Blaise on the Internet is operational, another pilot project will be started to extend thedifferent ways of electronic data collection for businesses further.
However, as we have seen, the scope for using e-mail in the manufacturing industries still is limited. Datacollection by e-mail on a larger scale does not seem possible yet. All together, about 12% of the sampledbusinesses were willing to participate in the pilot. From these businesses, relatively more larger businesseswere willing to participate than smaller businesses: 7% of the businesses with 10 to 20 employees, up to30% of the businesses with more than 500 employees. Most of these businesses that participated, have amodern computer organisation with an internal computer network and a connection to the Internet.
But, access to the Internet and the use of e-mail is rapidly increasing. So, to be ready for the future, datacollection by e-mail and the Internet should be explored now. Modern and traditional modes (like e-mail, theInternet, paper and fax) can be integrated in a mixed mode design in which sampled businesses decide onthe way to respond. Thus, a respondent friendly system of data collection may be established.

38
SSeeccttiioonn BB.. EEddiittiinngg aanndd PPrroocceessssiinngg
The Models4 System: Simplifying data management inBlaise 4 WindowsBoris Allan, Westat (USA)
SummaryThe Models System for Blaise III4 performed the following actions:1. The data model was split into component data models (.BLA files), where each of the component data
models was equivalent to an ASCIIRELATIONAL file. A batch file was created to drive theremaining steps.
2. Each data model produced as a result of the previous step was then prepared to create metainformation (.~MI) files.
3. A chosen Cameleon translator was then applied to each meta information file.We were able to take large data models, and produce SAS macro descriptions for the whole model, whereeach SAS macro corresponded to an ASCIIRELATIONAL file. The SAS macros were created by aspecial translator SASMACRO.CIF.With the release of Blaise 4 Windows, some of the command-line parameters for Manipula and Cameleonchanged slightly, and batch files did not seem to fit well with a Windows environment. I decided,therefore, to change the models methodology to incorporate these new features, which included animproved Cameleon interpreter. The Models4 System follows a different sequence of actions:1. The data model is split into component data models (.BLA files), where each of the component data
models is equivalent to an AsciiRelational file (the new version uses improvements in the Blaise 4Cameleon interpreter). At the same time, a reference file is written (.REF), where each record in thereference file has the name of a component data model and its folder.
2. Each record in the reference file designates a data model to be prepared to create a meta information(.~MI) file.
3. Each record in the reference file also, therefore, designates the meta information file to which a chosenCameleon translator is applied.
One consequence of this new approach is that it is possible to construct a reference file containing a list offiles (without the .BLA extension), prepare the named files, then apply the same Cameleon translator to allthese files (see The elements of Models4).
The background to Models4At Westat, we often have to deal with very large instruments where we cannot write or read a file withrecords that contain all the fields for an instrument. We have to divide the fields into manageable chunkscorresponding to blocks, and those chunks are AsciiRelational5 files. As an example, one "very large"study has a data model with over 166 different AsciiRelational files and a meta information (~MI) filegreater than 3.5 MB. 4 Automatic generation of data descriptions for ASCIIRELATIONAL files, International Blaise User GroupNewsletter, July 1998.
5 I try to distinguish between MSDOS and Windows versions of (say) files by using all UPPERCASE for MSDOSand MixedCase for Windows.
39
Because of the work involved in managing this amount of information, we had to find a way of makingthe task less labour-intensive. For example, for the data model with 166 different files, the file producedby the Blaise 4 Cameleon translator AsciiRel.CIF has 8060 lines. Developing a Manipula setup to writeAsciiRelational files is a simple task (one need only use the Wizard) and the fact that the Manipula setupmight take a long time to write the files is unimportant. I, for one, can easily find other things to do whilstthat is happening — usually involving food.We needed an equivalent of the Manipula Wizard to produce data models that were equivalent to theformats of the AsciiRelational files. These formats are implicit in the output of AsciiRel.CIF but haveto be made explicit, because all the data models are in one file and cannot be prepared until the file isedited, and each data model copied to a separate file. Once we have these separate files, we have toprepare each data model.If you think of the amount of work involved in splitting a file into 166 data models, and preparing those166 models, then you can see why automation sung sweetly. For many of our studies, Models4 is the onlyway we can conveniently manage the conversion of Blaise data into other forms for analyses.
The development of Models4In the days of Blaise III, the original task was resolved by basing a Cameleon translator on the Blaise IIIASCIIREL.CIF translator, with certain modifications. Called BLKMODEL.CIF, the translator had toovercome certain limitations in the Blaise III CAMELEON.EXE interpreter:♦ One limitation was structural, in that you could not declare arrays of variables in the [VAR ...]
section, and it was difficult to keep track of repeated types .♦ Only types and embedded blocks at the top level were specified in the data model corresponding to
Block 1 (the original data model). For data models corresponding to other blocks, type definitions(and similar) had to be copied from the top-level definitions.
♦ In a TYPESLOOP ... ENDTYPESLOOP, the only types tracked were types that had been defined at thelevel of the block, not types for the whole data model. Looping through types at the data model leveldid not include types defined at lower levels. BLKMODEL.CIF had to take a field at the block level,and search through the tree structure for enclosing blocks, until the top level was reached, to find thecorresponding type definition (a reverse recursion). As each field had to be treated separately, andthere was no central repository of types, type definitions were repeated.
Another program, a Manipula setup called CLEANTYP.MAN, was used to remove duplicate definitions.♦ ASCIIREL.CIF did not deal with classifications, and so a procedure to regenerate a classification was
implemented.♦ To deal with embedded blocks, and nested embedded blocks, special procedures had to be
implemented for blocks at lower levels, if those blocks had fields referring to embedded blocks intheir declarations.
♦ Various problems arose with the way the CAMELEON.EXE interpreter treated Blaise III SET OFdeclarations, and with the way the interpreter treated the Cameleon meta data distinction betweenDEFINEDTYPENAME and PREVIOUSTYPENAME.
Some of these points have been addressed in the Blaise 4 Cameleon.EXE interpreter, and the Blaise 4AsciiRel.CIF translator. The Blaise 4 equivalent of my BLKMODEL.CIF is my Create_Models.CIF,which is based on ideas in the Blaise 4 AsciiRel.CIF translator, with some modifications. Generallyspeaking, Blaise 4 Cameleon is much more reliable than before, and this is reflected in the improvedquality of the supplied sample translators.

40
Models_System.MAN: The interface to Models4To start the Models4 System, you use the Maniplus setup Models_System.MAN, with the followingdialog box:
In this example dialog:♦ The Source Data Model is SocEco4, a variant of the SocEco sample provided with Blaise 4 — the
listing of SocEco4.BLA is in the Appendix.♦ The Source Folder is \progra~1\statneth\blaise\samples (using the abbreviation progra~1
for "program files" because the version with the space can cause confusion for some of theBlaise 4 system command-line interpreters).
♦ The CIF File is at location \progra~1\statneth\blaise\tools\cameleon\sas .♦ The Destination Folder for all the created models, meta information files, and Cameleon translations is
\test (I believe in originality in choice of folder names).♦ The Confirm Info: selection is used to stop the dialog being closed prematurely, if you hit an enter key
by mistake. The dialog will only close if Accept or Reject is selected. The Maniplus setup runs theCreate_Models.CIF translator to write a whole series of data model files, and to write a referencefile (SocEco4.REF) in the working directory, containing the fully specified names of the data modelfiles:
\test\soceco4_A01\test\soceco4_A02\test\soceco4_A04\test\soceco4_A05\test\soceco4_A06\test\soceco4_A03
The first part of the name is the meta-information file name (SocEco4) and the second part (after theunderscore) is the extension for the appropriate AsciiRelational file name. Listings of SocEco4_A01.BLAand SocEco4_A06.BLA are in the Appendix.The SAS file written for SocEco4_A06.BLA is in the Appendix.
The elements of Models4Apart from Models_System.MAN, the key elements of Models4 are the following:♦ Create_Models.CIF♦ Generate_MetaInfo.MAN (and, of course, Generate_MetaInfo.MSF)Each file can be executed separately, and for Create_Models.CIF the command line is:CAMELEON Create_Models /B /DSourceDataModelPath /PDestinationFolder
♦ The SourceDataModelPath is the fully specified path and name of the source data model — forexample, \progra~1\statneth\blaise\samples\soceco4 .

41
♦ There is one parameter: the DestinationFolder is the folder in which the models are created — forexample, \test.
The command line for Manipula/Maniplus is (one line, though I have it split over two):MANIPULA Generate_MetaInfo /ISourceDataModelName.REF /Q /PCifFilePath;DestinationFolder;DoPrepare;DoCIF /RSourceDataModelName.MSG
♦ The SourceDataModelName is the name of the source data model, to which is appended .REF —for example, soceco4.REF (this is the reference file). When Generate_MetaInfo.MAN is being runindependently of the Models4 System, you can use any approriate file name.
♦ There are four parameters that follow the /P:
CifFilePath (corresponds to CIF File in the dialog);DestinationFolder (corresponds to Destination Folder in the dialog);DoPrepare, that is, are the names in the reference file to be prepared? (Y if true);DoCIF, that is, are the names in the reference file to be translated by a CIF? (Y if true).
♦ The SourceDataModelName is the name of the source data model, to which is appended .MSG — forexample, soceco4.MSG (this is the message file). When Generate_MetaInfo.MAN is being runindependently of the Models4 System, you can use any approriate file name.
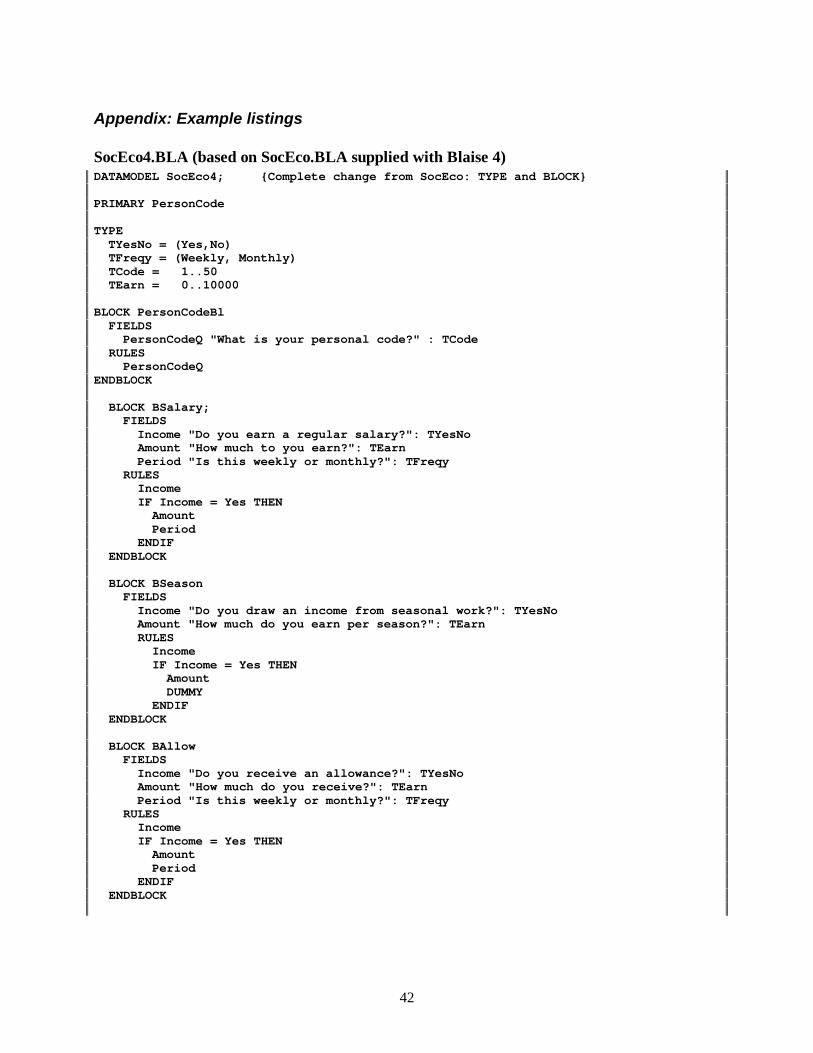
42
Appendix: Example listings
SocEco4.BLA (based on SocEco.BLA supplied with Blaise 4)DATAMODEL SocEco4; {Complete change from SocEco: TYPE and BLOCK}
PRIMARY PersonCode
TYPE TYesNo = (Yes,No) TFreqy = (Weekly, Monthly) TCode = 1..50 TEarn = 0..10000
BLOCK PersonCodeBl FIELDS PersonCodeQ "What is your personal code?" : TCode RULES PersonCodeQENDBLOCK
BLOCK BSalary; FIELDS Income "Do you earn a regular salary?": TYesNo Amount "How much to you earn?": TEarn Period "Is this weekly or monthly?": TFreqy RULES Income IF Income = Yes THEN Amount Period ENDIF ENDBLOCK
BLOCK BSeason FIELDS Income "Do you draw an income from seasonal work?": TYesNo Amount "How much do you earn per season?": TEarn RULES Income IF Income = Yes THEN Amount DUMMY ENDIF ENDBLOCK
BLOCK BAllow FIELDS Income "Do you receive an allowance?": TYesNo Amount "How much do you receive?": TEarn Period "Is this weekly or monthly?": TFreqy RULES Income IF Income = Yes THEN Amount Period ENDIF ENDBLOCK

43
TABLE TIncome "Income specification" FIELDS Salary: BSalary Season: BSeason Allowance : BAllow RULES Salary Season AllowanceENDTABLE
FIELDS PersonCode: PersonCodeBl Income: TIncome
RULES PersonCode IncomeENDMODEL
SocEco4_A01.BLA (An example data model)DATAMODEL SocEco4 {FileNumber:= 1}
FIELDS FPrimary: STRING[2] InstanceNumber: 0..99999 PersonCode: 0..99999 Income: 0..99999ENDMODEL {SocEco}
SocEco4_A06.BLA (An example data model)DATAMODEL BAllow {FileNumber:= 6}
TYPE TYesNo = (Yes, No) TEarn = 0..10000 TFreqy = (Weekly, Monthly)
FIELDS FPrimary: STRING[2] InstanceNumber: 0..99999 Income "Do you receive an allowance?": TYesNo Amount "How much do you receive?": TEarn Period "Is this weekly or monthly?": TFreqyENDMODEL {BAllow}
SocEco4_A06.SAS (An example SAS data description)TITLE 'BAllow';
PROC FORMAT;
VALUE TE_1F 1='Yes' 2='No';
VALUE TE_2F 1='Weekly' 2='Monthly';

44
RUN;
DATA FILE;INFILE 'soceco4_A06.ASC';INPUT FPrimary $ 1 - 2 Instance 3 - 7 Income 8 - 8 Amount 9 - 13 Period 14 - 14;
LABEL FPrimary = 'FPrimary' Instance = 'InstanceNumber' Income = 'Do you receive an allowance?' Amount = 'How much do you receive?' Period = 'Is this weekly or monthly?';
FORMAT Income TE_1F. Period TE_2F.;
RUN;

45
Imputation with Blaise and Manipula
Jelke Bethlehem and Lon Hofman, Statistics Netherlands
1. Introduction
Statistical surveys are always affected by non-response. There is item non-response, in which only theanswers to some questions are missing, and there is also unit non-response, in which the answers to allquestions are missing. For many years now Statistics Netherlands has been confronted with severe non-response problems. This is mainly unit non-response. Consequently, research has concentrated oncorrection techniques for this type of non-response. One of the products of this research is the programBascula for adjustment weighting.
The last couple of years there has been increased attention for item non-response. This is usually takencare of by means of imputation techniques. Imputation comes down to making an estimate for the missinganswer according to some model, and substituting these synthetic values in the data file. The paperpresents a methodological overview of various imputation methods, and shows how they can beimplemented using Blaise and Manipula.
2. The non-response problem
Survey sampling is a well-established sampling method. By choosing a proper sampling design, it ispossible to compute accurate estimates based on relatively small samples. This allows for cost-effectivedata collection and timely publications. However, there also is another side to this coin. Not everything isunder control. There are practical problems hindering a smooth execution of sample surveys. One of themost important problems survey organisations have been facing over the last decades is non-response.
Non-response is the phenomenon that elements (persons, households, companies) in the selected sampledo not provide the requested information, or that the provided information is useless. The situation inwhich all requested information on an element is missing is called unit non-response. If information ismissing on some items only, it is called item non-response. This chapter will only handle unit non-response.
Due to non-response the sample size is smaller than expected. This leads to less accurate, but still valid,estimates of population characteristics. This is not a serious problem. It can be taken care of by taking theinitial sample size larger. A far more serious problem caused by non-response is that estimates ofpopulation characteristics may be biased. This situation occurs if, due to non-response, some groups in thepopulation are over- or underrepresented, and these groups behave differently with respect to thecharacteristics to be investigated.
Indeed, estimators must be assumed to be biased unless very convincing evidence of the contrary isprovided. Bethlehem and Kersten (1987) discuss a number of surveys of Statistics Netherlands. A follow-

46
up study of the Victimisation Survey showed that people who have fear when they are alone at night, areless inclined to participate in the survey. In Housing Demand Surveys it turned out that people who refuseto co-operate, have a lesser housing demand than responding people. For the Survey on the Mobility of thePopulation it is obvious that mobile people are relatively under-represented among the respondents.

47
Figure 1.1. Non-response percentages of some Statistics Netherlands surveys
Year LabourForce
Survey
ConsumerSentiments
Survey
Survey onWell-being
MobilitySurvey
HolidaySurvey
1972 291973 12 231974 25 281975 14 22 141976 28 23 2) 131977 12 31 30 191978 36 33 221979 19 37 35 3) 31 261980 39 39 32 261981 17 35 32 261982 40 36 2) 34 291983 19 37 42 34 261984 35 1) 36 311985 23 31 39 321986 29 41 41 341987 40 1) 29 411988 41 32 451989 39 32 421990 39 32 451991 40 31 431992 42 31 55 431993 42 54 441994 41 48 1) 451995 40 46 461996 42 48 481997 44 501) Revision 2) Young people only 3) Old people only
The magnitude of the non-response in many Dutch sample surveys is increasing to such an extent thatwithout special adjustment techniques one has to reckon with a decrease of the quality of the results.Figure 1.1 presents non-response figures of a number of surveys carried out Statistics Netherlands.
It is difficult to compare response rates from different surveys but for each of the surveys one can study itsnon-response figures over the years. The magnitude of the non-response is determined by a large numberof factors, including the subject of the survey, the target population, the time period, the length of thequestionnaire, the quality of the interviewers, the fieldwork in general, etc. It is also clear from figure 1.1that non-response is a considerable problem. It has an impact on the costs of a survey, since it takes moreand more effort to obtain estimates with the same precision as originally specified in the sampling design.

48
Figure 1.2. Reasons for non-response
Non-respondents can be classified in three important groups, see figure 1.2. People in the first grouprefuse to co-operate. Sometimes it is possible to make an appointment for an interview at some later date.However, frequently the refusal can be considered permanent. Possible causes are fear of privacyintrusion, and interview fatigue. The second group of non-respondents is the not-contactable. No contact ismade due to the fact people are not at home, due to removal or due to other circumstances like watchdogs,dangerous neighbourhoods or houses which are difficult to reach. Generally speaking, people areincreasingly hard to contact. Important factors are smaller family sizes, greater mobility and a largeramount of spare time that is spent out-of-doors. The third group of non-respondents consists of peoplewho are physically or mentally not able to co-operate during the fieldwork period. Also languageproblems can cause this type of non-response.
To be able to build a well-founded theory of non-response adjustment it is necessary to incorporate thephenomenon of non-response in the theory of sampling. The literature on non-response contains twodifferent basic views on how non-response occurs. Here, these views are labelled the Random ResponseModel and the Fixed Response Model.
The Random Response Model assumes some kind of random mechanism determining whether or not aselected person will respond. Each element in the population is assigned an imaginary random numbergenerator. This generator can only produce either the value 0 or 1. A value 1 means response, and a value0 non-response. The probability with which the random number generator assumes the value 1, is differentfor each element in the population. All response probabilities are assumed to be unknown. Under theRandom Response Model, there are two random processes controlling the availability of data: the sampleselection mechanism defined by the researcher, and the response mechanism that is not under his control.
The Fixed Response Model assumes the population to consist of two mutually exclusive and exhaustivesub-populations: the response stratum and the non-response stratum. Elements in the response stratumwould participate in the survey with certainty, if selected in the sample, and elements in the non-responsestratum would not participate with certainty, if selected. The Fixed Response Model can be regarded as aspecial case of the Random Response Model in which the response probabilities are either 0 or 1. Manyauthors consider the Fixed Response Model a too simple and unrealistic model.
Both models can be used to study the effect of non-response on estimates of population estimates, and theconclusions from both models are the same: generally, these estimates will be biased, and the size of thebias is determined by two factors:
• The non-response rate. The higher the non-response rate, the larger the bias. For very small non-response rates, the bias may be ignored, but high non-response rates may incur a substantial bias.

49
• The extent to which non-respondents differ from respondents. The larger the difference between theaverage values of respondents and non-respondents, the larger the bias will be. If the non-respondentscan be considered to be a random sub-sample, there will be no bias.
In practice, it is very difficult to asses the possible negative effects of non-response. And even if sucheffects can be detected, it is no simple matter to correct for them. A correction is only possible if auxiliaryinformation is available. For example, if there is an auxiliary variable that has been measured in thesample, and for which population characteristics are know, then this variable can be used to check whetherthe available data show unbalancedness, i.e. they are not representative for the population.
An example illustrates this. Suppose, a sample of municipalities is selected in order to estimate theaverage milk production. Due to non-response not all municipalities provide information. Suppose thatalso the number of farms per municipality is measured as an auxiliary variable. If the average number offarms per municipality in the sample is 69, and it is known that the population average is 91, then there issomething wrong. Apparently, municipalities with a small number of farms are over-represented in thesurvey. Taking into account that these small municipalities will also have a small milk production, it islikely that the average milk production will be under-estimated.
3. Correction for non-response
There are two approaches to non-response correction. The first approach relates to unit non-response, thesituation in which all requested information on an element is missing. To correct for a possible bias due tounit non-response, often a weighting method is carried out.
The basic principle of weighting is that every observed element is assigned a specific weight. Byprocessing the weighted values instead of the values themselves estimates for population characteristicsare obtained. The easiest and most straightforward method used to compute weights is post-stratification.The population is divided into strata after selection of the sample. If each stratum is homogeneous withrespect to the target variable of the survey, then the observed elements resemble the unobserved elements.Therefore, estimates of stratum characteristics will not be very biased, so they can be used to constructpopulation estimates.
To carry out post-stratification, discrete auxiliary variables are needed, and preferable auxiliary variableshaving a strong relationship with the target variable. All observed elements within a stratum are assignedthe same weight, and this weight is computed such that the weighted sample distribution of the auxiliaryvariables agrees with the population distribution of these variables. If the relationships are strong enough,also the weighted sample distribution of the target variable will agree with its population distribution.
There are also more advanced weighting methods, see e.g. Bethlehem and Keller (1987), and Deville andSärndal (1992). Several types of weighting have been implemented in the package Bascula. For moreinformation about Bascula, see Bethlehem (1997).
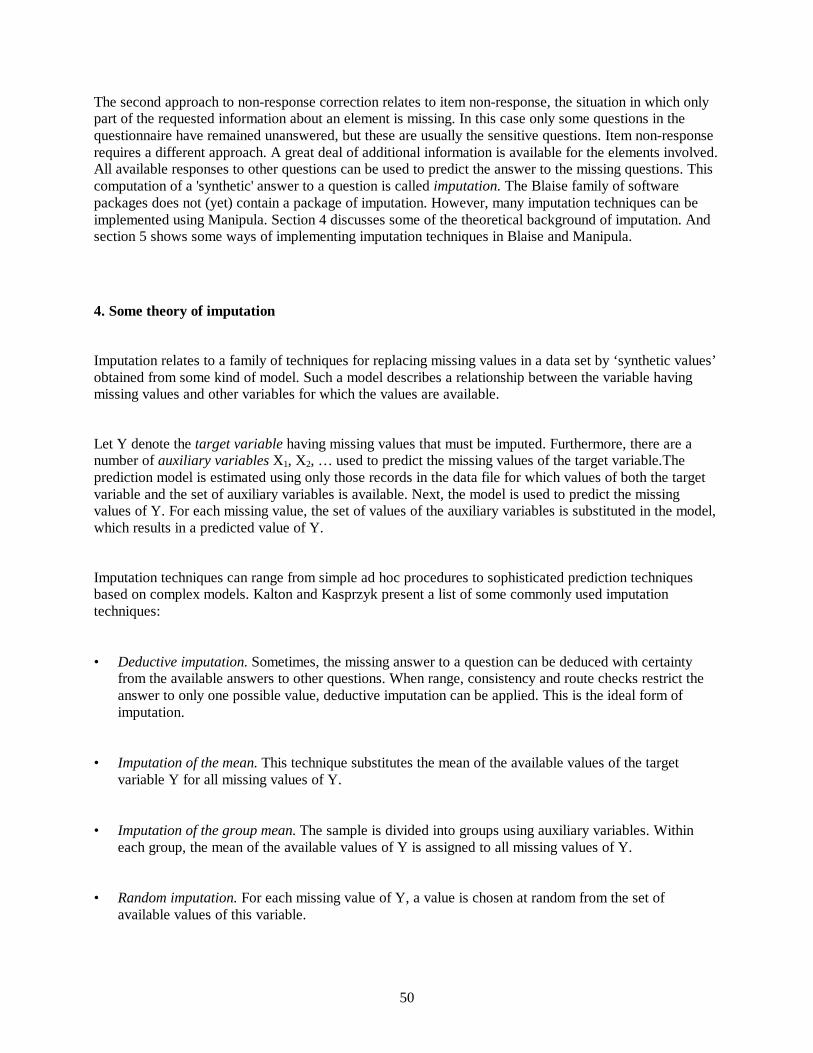
50
The second approach to non-response correction relates to item non-response, the situation in which onlypart of the requested information about an element is missing. In this case only some questions in thequestionnaire have remained unanswered, but these are usually the sensitive questions. Item non-responserequires a different approach. A great deal of additional information is available for the elements involved.All available responses to other questions can be used to predict the answer to the missing questions. Thiscomputation of a 'synthetic' answer to a question is called imputation. The Blaise family of softwarepackages does not (yet) contain a package of imputation. However, many imputation techniques can beimplemented using Manipula. Section 4 discusses some of the theoretical background of imputation. Andsection 5 shows some ways of implementing imputation techniques in Blaise and Manipula.
4. Some theory of imputation
Imputation relates to a family of techniques for replacing missing values in a data set by ‘synthetic values’obtained from some kind of model. Such a model describes a relationship between the variable havingmissing values and other variables for which the values are available.
Let Y denote the target variable having missing values that must be imputed. Furthermore, there are anumber of auxiliary variables X1, X2, … used to predict the missing values of the target variable.Theprediction model is estimated using only those records in the data file for which values of both the targetvariable and the set of auxiliary variables is available. Next, the model is used to predict the missingvalues of Y. For each missing value, the set of values of the auxiliary variables is substituted in the model,which results in a predicted value of Y.
Imputation techniques can range from simple ad hoc procedures to sophisticated prediction techniquesbased on complex models. Kalton and Kasprzyk present a list of some commonly used imputationtechniques:
• Deductive imputation. Sometimes, the missing answer to a question can be deduced with certaintyfrom the available answers to other questions. When range, consistency and route checks restrict theanswer to only one possible value, deductive imputation can be applied. This is the ideal form ofimputation.
• Imputation of the mean. This technique substitutes the mean of the available values of the targetvariable Y for all missing values of Y.
• Imputation of the group mean. The sample is divided into groups using auxiliary variables. Withineach group, the mean of the available values of Y is assigned to all missing values of Y.
• Random imputation. For each missing value of Y, a value is chosen at random from the set ofavailable values of this variable.

51
• Random imputation within groups. The sample is divided into groups using auxiliary variables. Withineach group, a missing value is substituted by a randomly chosen value from the set of available valuesof Y within the group.
• Hot-deck imputation. This is a special implementation of random imputation within groups. For eachgroup, a donor record is maintained. The records in the file are processed sequentially. If the field ofthe variable to be imputed contains a ‘real’ value, the value is copied to the donor record. If the valuein the field is missing, the value from the donor record is copied to the field.
• Regression imputation. A regression model is constructed that explains the values of the targetvariable Y from the values of auxiliary variables X1, X2, … Then, the fitted regression model is usedto predict the answer in missing cases. To conserve the distributional properties of the data, often aresidual, drawn from some normal distribution, is added to the prediction.
At the first sight, these techniques appear to be rather diverse. Still, most of them can be put into a generalframework. Let Yi denote the value of the target variable Y in the i-th record (for i = 1,2, … , n). Supposethere are p auxiliary variables X1, X2, … , Xp. The values of these variables in the i-th record are denotedby Xi1, Xi2, … , Xip. If the value Yi is missing, a general expression of the imputed value can be obtainedfrom
∑=
++=p
1jiijj0i ,EXbbY (4.1)
where iY denotes the imputed value, Xij the value of the j-th auxiliary variable, b0, b1, … , bp areregression coefficients, and Ei is the value of a random variable E obtained by drawing a value from somespecific distribution depending on the chosen imputation technique.
It is clear that expression (4.1) includes regression imputation. If all values of E are set to 0, the imputedvalue is the value predicted by the regression model. Often a residual noise variable is added to theprediction by the regression model. This is done to conserve the distributional properties of the targetvariable Y. The value of the noise variable is obtained by drawing some value from a normal distribution.
If the auxiliary variables are taken to be dummy variables representing imputation groups, expression (4.1)can be used for imputation of the group mean. For this, b0 and the Ei’s must be set to 0. The remaining bj’smust be taken equal to group means of Y, i.e.
,Yb jj =

52
for j = 1, 2, … , p. Within this framework, imputation of the mean is the special case of imputation of thegroup mean. It is obtained by introducing only one group, i.e. there is one auxiliary variable X1, and italways has the value 1.
Random imputation within groups is obtained by adding a noise variable to the model for imputation ofthe mean. The auxiliary variables are dummy variables representing the groups, b0 = 0, and b1, b2, … , bp
are the group means of Y. For each group j, a set of values
ijjij YYE −=
(for i=1,2,… ) is formed. The Yij denote the values of Y in the j-th group. The noise value Ei is obtained byselecting a random value from the proper set of values, i.e. if record i belongs to group j, Ei is selectedfrom E1j, E2j, … . Random imputation is a special case. It is obtained by using only one group.
Hot-deck imputation is a special implementation of random imputation within groups. If the order of therecords in the data file is completely random, both techniques are more or less equivalent.
The success of an imputation technique depends on properties of the mechanism generating item non-response. Little and Rubin (1987) consider three types of patterns leading to missing data:
1? The probability of a missing value of Y is independent of the value of Y and independent of the valueof the X’s. This case is called Missing Completely At Random (MCAR). Then the observed values ofY form a random sub-sample from the sample. The mean of the observed values is an unbiasedestimate of the population mean.
2? The probability of a missing value of Y depends on the value of X but is independent of the value ofY’s. This case is called Missing At Random (MAR). Then the observed values of Y do not form arandom sub-sample of the sample. However, they are a random sub-sample within the classes definedby the values of the X’s. The auxiliary variables can be used to effectively correct for a bias due tomissing values.
3? The probability of a missing value of Y depends both on the value of Y and the values of X’s. Thenthe observed values of Y do not form a random sub-sample of the sample. Also, they are not a randomsub-sample within the classes defined by the values of X. Therefore, the auxiliary variable cannot beused to effectively correct for a bias due to missing values.

53
There are several considerations that play a role in selecting an imputation technique. One is the type ofthe target variable. All techniques listed above can be applied routinely on qualitative (continuous)variables. However, some of the techniques cannot be applied to quantitative (discrete or categorical)variables, because imputed values will not necessarily belong to the domain of valid values. For example,imputation of the mean or regression imputation for a variable Sex with two possible values (1 for male,and 2 for female) may easily produce a value like 1.4. So, for a qualitative variable it is better to only userandom imputation (possibly within groups) or hot-deck imputation. These techniques always produce‘real’ values.
Imputation techniques can be classified as random or deterministic, depending on whether a noise variableis used or not. The deterministic techniques usually work in such a way that the mean of all values(observed and imputed) is equal to the mean of the observed values. For the random imputation methods,the expected value (over the residual producing mechanism) of the mean over all values is equal to theobserved mean. So both methods have the same effect on the bias of estimates. However, adding noiseintroduces an extra source of variation, and therefore reduces the precision of estimates. This may be areason to prefer deterministic techniques for estimating the population mean.
Deterministic techniques have the disadvantage that they distort the properties of the distribution of thevalues of the variable. These techniques tend to predict values in the middle part of the distribution. Thedistribution of Y in the imputed data set is much more peaked and much more concentrated than theoriginal distribution. Therefore, standard errors computed from the imputed data set are generally toosmall. They create a too optimistic view of the precision of estimates. Random imputation methods do nothave this nasty property. They are much better able to preserve the original distribution.
A final point to take into consideration is the effect of imputation on relationships between variables.Imputation of the overall mean and random imputation causes covariances and correlations to be biased.This occurs because imputed Y values are uncorrelated with the values of other variables in the records.By applying imputation within groups, the bias is decreased, but not avoided. Also, regression imputation(with or without a residual) introduces a bias in the covariance.
It is clear that the ideal imputation technique does not exist. A researcher always has to be careful in theanalysis of a data set that has been subject to imputation (unless the amount of imputation is small).Research for new imputation techniques is still in progress. An example is the multiple imputationtechnique proposed by Rubin(1979). This technique computes a set of, say m imputed values for eachmissing value. This results in m imputed data sets. Inference is based on the distribution obtained bycomputing the estimate for each of the m data sets.
Also, application of neural networks and of evolutionary algorithms looks promising. Experiments haveshown that there are situations in which these techniques are useful. However, further research isnecessary.
5. Imputation in Blaise

54
Simple deductive imputation can be carried out with the Data Entry Program (DEP) of Blaise itself. Bymeans of compute instructions in the rules section answers to questions can be computed. Most otherimputation techniques require information from other records, or from all records. Since the DEP is a formoriented utility, it is less convenient to use, or even impossible for these techniques. Manipula is muchmore suitable in these cases.
This section shows how a number of imputation techniques can be implemented in Manipula. A simpleexample is used to illustrate these techniques. A data file has been constructed for females with a job inthe country of Samplonia. The file contains three variables: Province (with two values Agria andInduston), Age (in the range from 20 to 65), and Income (in the range from 0 to 1500). In five records thevalue of Income is missing. We will show what happens if various imputation techniques are used toreplace the missing values of income by imputed values.
In Samplonia, there is a clear relationship between income, age and province. Figure 5.1 shows ascatterplot of this relationship. Two distinct clusters can be distinguished. The upper cluster relates to theprovince of Induston, and the lower cluster contains data from Agria. Apparently, incomes are higher inInduston, and increase with age. Incomes in Agria are low and independent from age. Of the five missingobservations, two are from Induston, and three from Agria. A good imputation technique will take thestructure into account, and produce imputed values that fit nicely in these clusters.
Figure 5.1. The relationship between income, age and province for females in Samplonia
Inco
me
Age2 0 6 4
1 0 1
1 4 4 2
Figure 5.2. contains the Manipula setup for the simplest imputation technique. It is imputation of theoverall mean of the available values of income.
Figure 5.2. Manipula setup for imputation of the mean
SETTINGS
AUTOREAD = NO
USES
BlaiseData 'Samfem'
UPDATEFILE
UpFile: BlaiseData ('Samfem', BLAISE)
SETTINGS
CHECKRULES = YES
AUXFIELDS
RMean: REAL

55
IMean: INTEGER
RecNum: INTEGER
N: INTEGER
MANIPULATE
FOR RecNum:= 1 TO UpFile.RECORDCOUNT DO
UpFile.READNEXT
IF Income <> EMPTY THEN
RMean:= RMean + Income
N:= N + 1
ENDIF
ENDDO
IMean:= RMean / N
UpFile.RESET
FOR RecNum:= 1 TO UpFile.RECORDCOUNT DO
UpFile.READNEXT
IF Income = EMPTY THEN
Income:= IMean
Imputed:= 1
UpFile.Write
ENDIF
ENDDO
In the Settings section AUTOREAD is set to NO. This makes it possible to make several runs through thedata file in the same setup. In this example, there are two runs. In the first run, the mean is computed, andassigned to the temporary variable IMean. Note that the check IF Income <> EMPTY sees to it that themean is computed over all ‘real’ values. The variable N counts the number of these observations. In thesecond run the value of the mean is assigned to the variable Income in all cases for which the value ofIncome is missing.
The Blaise model contains a field with the name Imputed. This field records whether the value of Incomeis ‘real’ or imputed. Such an imputation flag may be important for future analyse of the data.
In this example, the value of the overall mean is equal to 429. This value lies somewhere between the twoclusters in the scatterplot. Therefore it is bad imputation technique in this case. The overall mean ofincome is not affected, but the structure of the relationship between income and age is distorted.

56
Figure 5.3. contains the Manipula setup for imputation of the group means, where in this case the groupsare the two provinces.
Figure 5.3. Manipula setup for imputation of the mean within groups
SETTINGS
AUTOREAD = NO
USES
BlaiseData 'Samfem'
UPDATEFILE
UpFile: BlaiseData ('Samfem', BLAISE)
SETTINGS
CHECKRULES = YES
AUXFIELDS
RMean: ARRAY[1..2] OF REAL
IMean: ARRAY[1..2] OF INTEGER
N: ARRAY[1..2] OF INTEGER
RecNum: INTEGER
I: INTEGER
MANIPULATE
FOR RecNum:= 1 TO UpFile.RECORDCOUNT DO
UpFile.READNEXT
IF Income <> EMPTY THEN
RMean[Province]:= RMean[Province] + Income
N[Province]:= N[Province] + 1
ENDIF
ENDDO
FOR I:= 1 TO 2 DO
IMean[I]:= RMean[I] / N[I]
ENDDO
UpFile.RESET
FOR RecNum:= 1 TO UpFile.RECORDCOUNT DO
UpFile.READNEXT
IF Income = EMPTY THEN
Income:= IMean[Province]
Imputed:= 1

57
UpFile.Write
ENDIF
ENDDO
The difference with the previous setup in figure 5.2 is that now group means are computed for eachprovince separately. So there is now an array of group means. The number of ‘real’observations in eachgroup is also counted in an array.
The imputed group mean for the province of Induston is equal to 995. For missing values in Induston thisis a better value than for imputation of the overall mean. Nevertheless, it is not ideal. The elderly peoplewith high incomes (up to a value of 1405) would also get an imputed value of 995. The imputed value istoo low. And for young people the imputed value would be too high. For the province of Agria, theimputed value is 153. This looks reasonable, since income seems to be more or less constant in thisprovince.
Figure 5.4 contains the Manipula set for random imputation. Also for this technique, two runs must bemade through the data file: one to collect all ‘real’values of income, and one to randomly assign valuesfrom this set to records having missing values.
Figure 5.4. Manipula setup for random imputation
SETTINGS
AUTOREAD = NO
USES
BlaiseData 'Samfem'
DATAMODEL MValues
PRIMARY
RecNr
FIELDS
RecNr: INTEGER[4]
Income: 0..6000
ENDMODEL
UPDATEFILE
UpFile: BlaiseData ('Samfem', BLAISE)
SETTINGS
CHECKRULES = YES

58
TEMPORARYFILE
Values: MValues
SETTINGS
AUTOCOPY = NO
AUXFIELDS
RecNum: INTEGER
N: INTEGER
MANIPULATE
FOR RecNum:= 1 TO UpFile.RECORDCOUNT DO
UpFile.READNEXT
IF Income <> EMPTY THEN
N:= N + 1
RecNr:= N
Values.WRITE
ENDIF
ENDDO
UpFile.RESET
FOR RecNum:= 1 TO UpFile.RECORDCOUNT DO
UpFile.READNEXT
IF Income = EMPTY THEN
Values.GET(RANDOM(N) + 1) { read random record }
UpFile.Income:= Values.Income { the actual imputation }
UpFile.Imputed:= 1
UpFile.Write
ENDIF
ENDDO
Note that the ‘real’values of income are stored in a temporary file Values. As primary key for this file therecord number is used. The total number of ‘real’ values is counted in the variable N. The function callRANDOM(N) generates a random integer from the set 0 up to and including N-1. So, to get a value in therange from 1 to N, we have added 1 to the result of the function call. The GET instruction is used toretrieve a record with a ‘real’ income value from the temporary file Values.

59
Application of this imputation technique will result in assignment of random income values to recordswith missing values. It is possible that the missing income in the province of Agria will be replaced by anincome value from the province of Induston. It will be clear that random imputation will distort thestructure of the relationship between income and age within the provinces.
Figure 5.5 contains the Manipula setup for random imputation within groups. It is an extension of thesetup in figure 5.4. The temporary file has been extended with the variable Province. This variable hasalso been included in the primary key of the temporary file. All ‘real’ income values are again written tothe temporary file with the appropriate value for the primary key. For each group, missing income valuesare replaced by a randomly selected ‘real’ income from the temporary file.
Figure 5.5. Manipula setup for random imputation within groups
SETTINGS
AUTOREAD = NO
USES
BlaiseData 'Samfem'
DATAMODEL MValues
PRIMARY
Province, RecNr
FIELDS
Province: (Agria, Induston)
RecNr: INTEGER[4]
Income: 0..6000, EMPTY
ENDMODEL
UPDATEFILE
UpFile: BlaiseData ('Samfem', BLAISE)
SETTINGS
CHECKRULES = YES
TEMPORARYFILE
Values: MValues
SETTINGS
AUTOCOPY=NO
AUXFIELDS
N: ARRAY[1..2] OF INTEGER
RecNum: INTEGER
MANIPULATE

60
FOR RecNum:= 1 TO UpFile.RECORDCOUNT DO
UpFile.READNEXT
IF Income <> EMPTY THEN
N[Province]:= N[Province] + 1
RecNr:= N[Province]
Values.WRITE
ENDIF
ENDDO
UpFile.RESET
FOR RecNum:= 1 TO UpFile.RECORDCOUNT DO
UpFile.READNEXT
IF Income = EMPTY THEN
Values.GET(Province, RANDOM(N[Province]) + 1) { read random record }
UpFile.Income:= Values.Income { the actual imputation }
UpFile Imputed:= 1
UpFile.Write
ENDIF
ENDDO
Random imputation within groups is better than random imputation. Still, it suffers from the samedrawbacks as imputation of the group means: elderly people (with a high income) in Induston could beassigned the value of the income of a younger person, and thus would get a too low income.
Figure 5.6 contains the Manipula setup for a hot-deck imputation technique. The big advantage of hot-deck imputation is that it requires only one run through the data file. In this example there are two groups,corresponding to the two provinces. For each group, the last encountered value of income in that group isstored in the array Donor. When a missing value is encountered, it is replaced by the value in the donorarray.
Note that in the present form, the setup has a shortcoming. The setup assumes the donor array will befilled with ‘real’ values at the moment the first missing value is encountered. If the first record in the datafile contains a missing value, a value of 0 will be imputed. In a real production situation, the setup must beadapted to take care of this situation. Under the assumption that the order of the records in the data file ismore or less arbitrary, hot-deck imputation has more or less the same properties as random imputationwithin groups.
Figure 5.6. Manipula setup for hot-deck imputation
SETTINGS

61
AUTOREAD = NO
USES
BlaiseData 'Samfem'
UPDATEFILE
UpFile: BlaiseData ('Samfem', BLAISE)
SETTINGS
CHECKRULES = YES
AUXFIELDS
Donor: ARRAY[1..2] OF INTEGER
RecNum: INTEGER
MANIPULATE
FOR RecNum:= 1 TO UpFile.RECORDCOUNT DO
UpFile.READNEXT
IF Income <> EMPTY THEN
Donor[Province]:= Income
ELSE
Income:= Donor[Province]
Imputed:= 1
UpFile.WRITE
ENDIF
ENDDO
Figure 5.7 contains the final Manipula setup to be considered. It contains an example of regressionimputation. At first sight, this also seems to be a case of one run through the data file. But this is not true.In order to compute the coefficients of the regression model, also a run through the file must be made.Manipula is not the most convenient package for regression analysis. There are many statistical analysispackages that are better equipped for this purpose. Fortunately, Blaise offers tools to use these packages ina convenient way. For the current example, Cameleon was used to export to data to SPSS. A regressionanalysis was carried out in SPSS, and this resulted in the following model:
Income = 160 × (2 – Province) + (209 + 20 × Age) × (Province – 1).
For a missing value in the province of Agria, the value of the variable Province is equal to 1, and so themodel reduces to
Income = 160.

62
Apparently, always a value of 160 is predicted for Income, and this is not so bad if we look at thescatterplot in figure 5.1. For a missing value in the province of Induston, the value of the variable Provinceis equal to 2, and so the model reduces to
Income = 209 + 20 × Age.
The imputed value of income increases with age. The straight line corresponding to this model follows theupper cluster of points in the scatterplot. Clearly, this regression imputation is the best imputation of thetechniques discusses in this section.
Figure 5.6. Manipula setup for regression imputation
SETTINGS
AUTOREAD = NO
USES
BlaiseData 'Samfem'
UPDATEFILE
UpFile: BlaiseData ('Samfem', BLAISE)
SETTINGS
CHECKRULES = YES
AUXFIELDS
RecNum: INTEGER
MANIPULATE
FOR RecNum:= 1 TO UpFile.RECORDCOUNT DO
UpFile.READNEXT
IF Income = EMPTY THEN
Income:= (2 - Province) * 160 + (Province - 1) * (209 + 20 * Age)
Imputed:= 1
UpFile.WRITE
ENDIF
ENDDO
6. Conclusion

63
Imputation is a much-used technique to get rid of missing values in a data file. That is what is does and notmuch more. Particularly if the pattern of missing values is not random, imputation may distort theproperties of distribution of the variables. So care must be taken to select a proper imputation technique.
Although the Blaise System has no dedicated tools for imputation, it is not very difficult to implement it.Manipula seems to have all that is needed for carrying out imputation.
7. References
Bethlehem, J.G. & W.J. Keller (1987): Linear weighting of sample survey data. Journal of OfficialStatistics, 3, pp. 141-154.
Bethlehem, J.G. & H.M.P. Kersten (1987): The Non-response Problem, Survey Methodology 7, pp. 130-156.
Bethlehem, J.G.(1997): Bascula, Current Status and Future Developments. In: INSEE, Acte de la 4eConférence Internationale des Utilisateurs de BLAISE, Paris, 5-7 Mai 1997, pp. 21-44.
Deville J.C and C.E. Särndal (1992): Calibtation Estimators in Survey Sampling. Journal of the AmericanStatistical Association 87, pp. 376-382.
Kalton, G. and D. Kasprzyk (1986): The Treatment of Missing Survey Data. Survey Methodology 12, pp.1-16.
Little, R.J.A. and D.B. Rubin (1987): Statistical Analysis with Missing Data. Wiley, New York.
D.B. Rubin, D.B. (1979): Illustrating the use of multiple imputations to handle non-response in samplesurveys. Bulletin of the International Statistical Institute, Book 2, pp. 517-532.

64
Diary and Office Processing : Integrating Blaise with other facilitiesMichael DeMamiel and Fred Wensing, Australian Bureau of Statistics
1. IntroductionThe Australian Bureau of Statistics (ABS) first made use of Blaise (version III) in a production applicationin 1996, when it was used for the collection of data in the longitudinal Survey of Employment andUnemployment Patterns. This followed almost two years of testing and development of systems associatedwith computer assisted interviewing (CAI). Since then, Blaise software has been used successfully forcomputer assisted interviewing in a number of other surveys, as well as for office based data capture ofdiary records from the Time Use Survey.While Blaise has been used primarily for data capture, it has also been used successfully in thedevelopment of office management systems for CAI (Henden et al, 1997). The success of Blaise in theseapplications, together with its flexibility and versatility, made it a strong contender for capturing diaryrecords from the 1998/99 Household Expenditure Survey.This paper describes the systems that have been developed for diary data capture and how they have beenintegrated into the ABS computing environment. The paper also discusses some of the issues that had tobe dealt with.
2. Household Expenditure SurveyThe Household Expenditure Survey (HES) is a national survey conducted by the ABS approximatelyevery five years. The current HES has a target sample of around 8,000 households and is being conductedover a 12-month period, which commenced in July 1998.The data collection and input processing methodology for the current HES is significantly different to themethodologies used for the last three surveys. This time, the field interviewers are using CAI technology(Blaise III) to collect the initial household and individual data. After electronic transmission to the office,this part of the data is then coded and "cleaned" through the Office Management System (in Blaise) beforeit is exported to other systems for output processing.Detailed personal expenditure data is collected using diaries, which are left for respondents to completeover the two weeks following their initial interview. While the collection of dairy data uses the samemethodology as for previous surveys, the data entry of these diaries is being done through a Blaise DiaryProcessing System, which links with the CAI Office Management System previously mentioned. Thediary data capture and coding processes are carried out at a single HES Processing Centre to ensureconsistency in coding. Over the 12 months of the survey the Centre is expected to process around 32,000diaries (two per adult in each responding household).In addition to the Office Management System and Diary Processing System, it was also necessary toestablish some additional process management facilities to keep track of the diaries, assist with qualitycontrol and resolve coding queries. While both systems are Blaise-based, the process managementfacilities have been built in Windows-based Lotus Notes for reasons which are discussed in the nextsection.The following diagram shows the various components of the HES diary system.

65
Figure 1. HES Diary System diagram
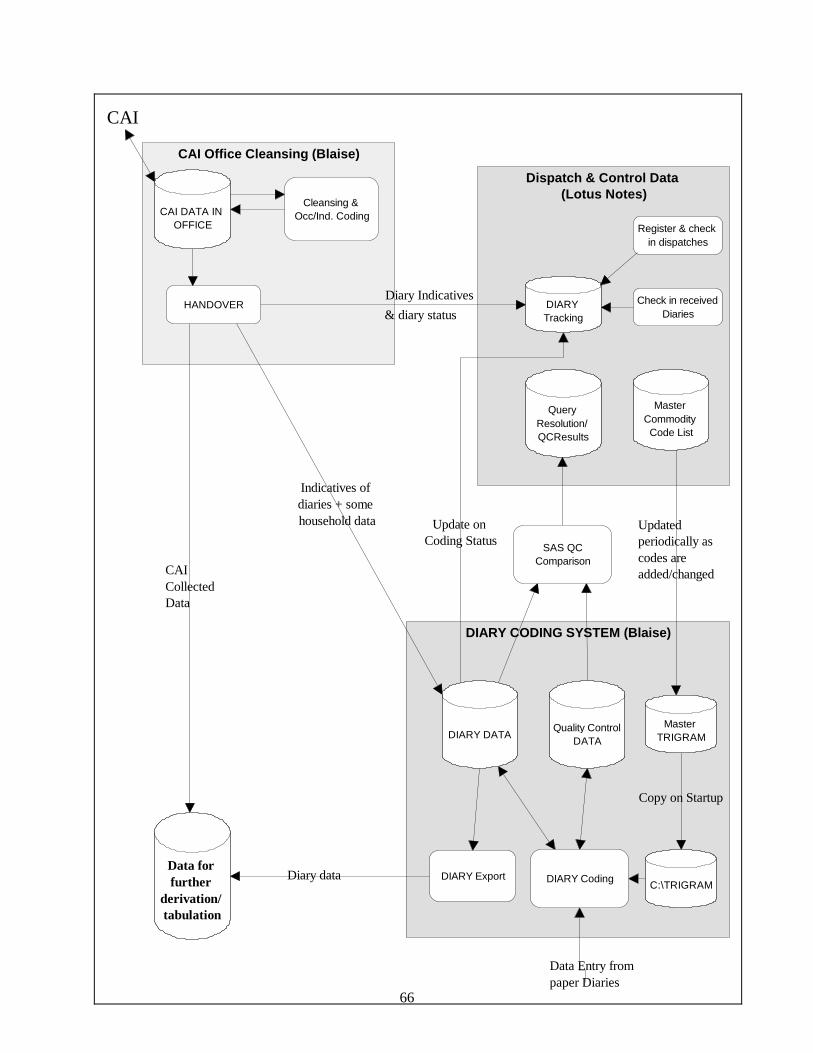
66
CAI Office Cleansing (Blaise)
DIARY CODING SYSTEM (Blaise)
Dispatch & Control Data (Lotus Notes)
DIARY Tracking
Query Resolution/ QCResults
Master Commodity
Code List
HANDOVER
CAI DATA IN OFFICE
Data for further
derivation/ tabulation
Cleansing & Occ/Ind. Coding
Diary Indicatives & diary status
DIARY DATA
DIARY Coding C:\TRIGRAMDIARY Export
Master TRIGRAM
Updated periodically as codes are added/changed
Update on Coding Status
CAI
Data Entry from paper Diaries
Indicatives of diaries + some household data
Register & check in dispatches
Check in received Diaries
CAI Collected Data
Quality Control DATA
SAS QC Comparison
Copy on Startup
Diary data

67
3. Computer infrastructure issuesThe ABS computer environment consists of approximately 3,200 personal computers, connected to avariety of platforms including the mainframe, native UNIX servers, and Notes (Lotus) and Banyanservers. This network provides universal access to all computer services from any desktop PC.The main desktop software is Lotus Notes which not only provides Email and document management, butalso provides functionality for development of smaller applications, including support for workflowapplications.In the past 7 years there has been a tendency to migrate the larger statistical processing systems from themainframe computer to client-server on the midrange platform. In recent years the ABS has alsodeveloped a central corporate information warehouse which is used to store and disseminate allpublishable data, and provides a single "one-stop shop" for all statistical output.Many smaller applications are now being built in the Windows/Notes environment, or at least with aWindows/Notes front-end. Regardless of the platform or software being used, it is ABS policy that allstatistical and processing applications must have metadata links to the corporate information warehouseand deliver their final data to it.While there has been use of Blaise (version III) in the ABS since 1994, that was mainly for computerassisted interviewing in the field. Only limited use of Blaise has been made in the office and that haslargely been associated with the management and cleaning of CAI data. Once the data has been clearedthrough these office management facilities it is generally exported and processed further in SAS or usingother corporate software.All desktop computers were converted to use Windows 95 by early 1997 and since that time very fewapplications make use of DOS. This has made the position of DOS-based Blaise software rather tenuousalthough the Windows 95 release of Blaise 4 should counteract this.Most office-based staff of the ABS are now accustomed to using Windows based technology for theirapplications. This is a significant consideration when deciding which software should be used to buildvarious parts of the diary processing system. There was a clear preference for Windows/Notes to be usedfor those parts which are used for monitoring and control because that is the familiar environment for staffinvolved in that activity. Use of Notes for monitoring and process control would also make thatinformation more readily accessible to other staff throughout the ABS. The abundance of skilled Notesprogrammers as compared to those skilled in Manipula and Maniplus was also a relevant factor. Thefollowing components of the diary processing system were therefore built in Lotus Notes:• Diary tracking facility - to keep track of all diaries, their location and status;• Facility to manage the commodity code list and entries used for trigram coding;• Query resolution facility - to record and resolve coding problems that arise;• Facility for quality control - records the results of quality control checking.These are described in more detail later.
4. Choice of Blaise for diary captureWhile the decision to use Notes for the diary management facilities was relatively straightforward, thequestion of which software to use for the data entry and coding processes was not so easy. The presence ofa Windows interface was a factor to be considered but it rated as only a minor issue compared tofunctionality and performance.As mentioned in the introduction, the successful use of Blaise for data capture in other surveys, togetherwith its flexibility and versatility, made it a strong contender for capturing diary records. The othercontender for diary data capture was an ABS developed facility known as IPS (Input Processing System)which is used extensively for business surveys (involving mail out questionnaires) and some householdsurveys. IPS was developed in Oracle/SQL-Windows/C and provides a standardised environment for dataentry of form based data.Both data entry facilities were considered to be capable of being used for capturing HES diaries and therewas sufficient experience and existing infrastructure for a system to be built using either. It was thereforedecided to conduct a small-scale test of both options, using working prototypes of the data capture

68
instrument, to examine the relative performance of each. The test was carried out by two coding staff whocoded the same diaries using both systems. Each system was tested for two days in succession andperformance measures were taken as follows:• total number of diaries entered;• elapsed time to enter each diary;• number of entries per diary;• quality of coded data (missing entries, errors in coding, etc);• load on ABS infrastructure (UNIX load, Banyan server load, network load and
storage).In addition to these measures, the coding staff were asked to comment on the performance and useabilityof each system. When the testing was completed, estimates were then made of the projected cost of usingboth systems for all diaries.The detailed results of testing are summarised in tables at Figure 2.
Figure 2. Comparison of test results between Blaise and IPS (a)Diaries entered Blaise IPSTotal number of diaries entered 88 52Time to enter diary (Minutes) Mean
Median15.38.4
26.119.5
Entries per diary MeanMedian
45.729.0
48.630.5
Mean time per entry (Seconds) 20.3 31.0Quality of data entered Blaise IPSNumber of entries checked Items 1891 461Proportion of total entries Percent 47.0% 17.6%Missing items 0.42% 0.87%Incorrect amount entered 0.63% 0.65%Incorrect code selected 2.01% 4.99%Incorrect description selected (correct code) 0.37% 0.00%Incorrect day selected (b) 1.75% 1.08%Incorrect diary key entered 0.00% (b) 12.15%Other errors 0.05% 0.43%Total errors 5.25% 20.17%
Estimated errors in production system (b) 4.56% 8.02%IT Infrastructure Load Blaise IPSTotal UNIX load(CPU seconds / UPUs)
N/A 262.7349.26
Total Banyan server load (Requests) 245,106 N/ANetwork load (Bits per second) Mean
Median22,5247,501
23,94117,597
Total disk storage (Bytes) 1,401,022 20,541,604IT Costs Blaise IPSTotal UNIX prime UPU (Dollars) N/A 22.17Total Banyan prime requests (Dollars) 7.35 N/ATotal disk storage (Dollars per month) 0.47 6.86
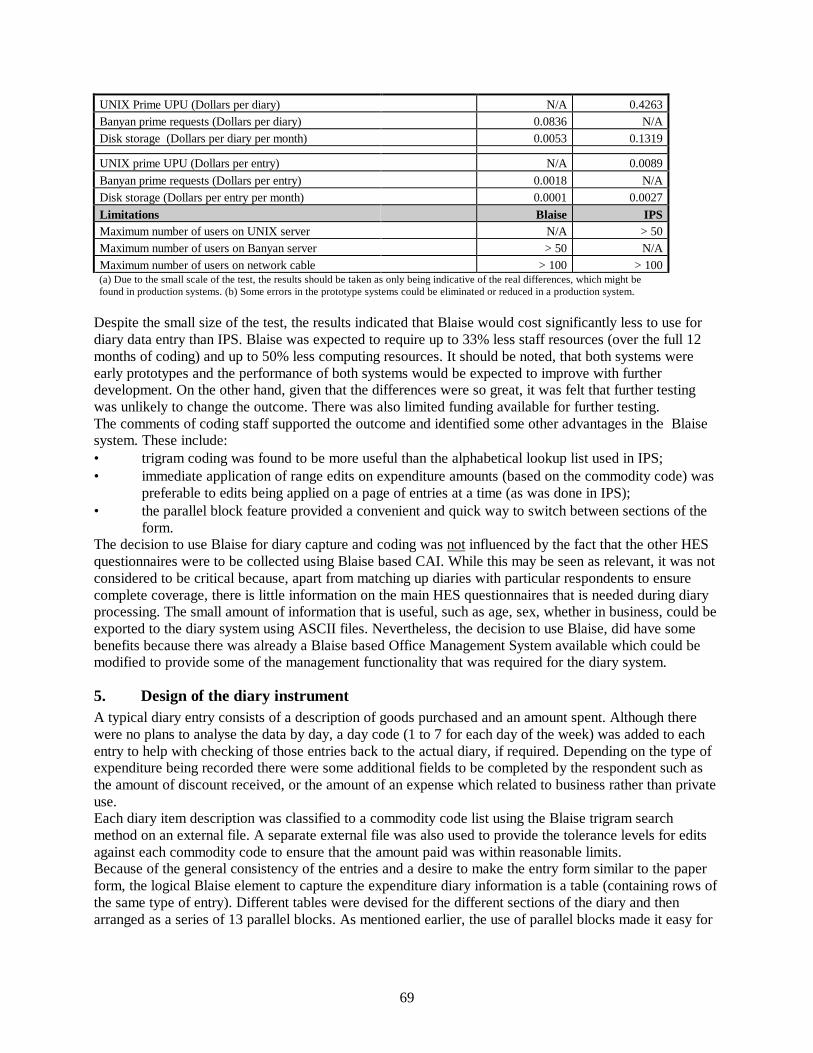
69
UNIX Prime UPU (Dollars per diary) N/A 0.4263Banyan prime requests (Dollars per diary) 0.0836 N/ADisk storage (Dollars per diary per month) 0.0053 0.1319
UNIX prime UPU (Dollars per entry) N/A 0.0089Banyan prime requests (Dollars per entry) 0.0018 N/ADisk storage (Dollars per entry per month) 0.0001 0.0027Limitations Blaise IPSMaximum number of users on UNIX server N/A > 50Maximum number of users on Banyan server > 50 N/AMaximum number of users on network cable > 100 > 100(a) Due to the small scale of the test, the results should be taken as only being indicative of the real differences, which might befound in production systems. (b) Some errors in the prototype systems could be eliminated or reduced in a production system.
Despite the small size of the test, the results indicated that Blaise would cost significantly less to use fordiary data entry than IPS. Blaise was expected to require up to 33% less staff resources (over the full 12months of coding) and up to 50% less computing resources. It should be noted, that both systems wereearly prototypes and the performance of both systems would be expected to improve with furtherdevelopment. On the other hand, given that the differences were so great, it was felt that further testingwas unlikely to change the outcome. There was also limited funding available for further testing.The comments of coding staff supported the outcome and identified some other advantages in the Blaisesystem. These include:• trigram coding was found to be more useful than the alphabetical lookup list used in IPS;• immediate application of range edits on expenditure amounts (based on the commodity code) was
preferable to edits being applied on a page of entries at a time (as was done in IPS);• the parallel block feature provided a convenient and quick way to switch between sections of the
form.The decision to use Blaise for diary capture and coding was not influenced by the fact that the other HESquestionnaires were to be collected using Blaise based CAI. While this may be seen as relevant, it was notconsidered to be critical because, apart from matching up diaries with particular respondents to ensurecomplete coverage, there is little information on the main HES questionnaires that is needed during diaryprocessing. The small amount of information that is useful, such as age, sex, whether in business, could beexported to the diary system using ASCII files. Nevertheless, the decision to use Blaise, did have somebenefits because there was already a Blaise based Office Management System available which could bemodified to provide some of the management functionality that was required for the diary system.
5. Design of the diary instrumentA typical diary entry consists of a description of goods purchased and an amount spent. Although therewere no plans to analyse the data by day, a day code (1 to 7 for each day of the week) was added to eachentry to help with checking of those entries back to the actual diary, if required. Depending on the type ofexpenditure being recorded there were some additional fields to be completed by the respondent such asthe amount of discount received, or the amount of an expense which related to business rather than privateuse.Each diary item description was classified to a commodity code list using the Blaise trigram searchmethod on an external file. A separate external file was also used to provide the tolerance levels for editsagainst each commodity code to ensure that the amount paid was within reasonable limits.Because of the general consistency of the entries and a desire to make the entry form similar to the paperform, the logical Blaise element to capture the expenditure diary information is a table (containing rows ofthe same type of entry). Different tables were devised for the different sections of the diary and thenarranged as a series of 13 parallel blocks. As mentioned earlier, the use of parallel blocks made it easy for

70
the coding staff to navigate to a particular section before entering data. A sample table of the diary entryscreen is shown Figure 3.
Figure 3. Sample screen of diary entry for payments and purchases
Once a table becomes filled with a large number of entries it was found that there was a smalldeterioration in performance associated with the internal checking (of the rules) that Blaise does as eachentry is added. Since this deterioration in performance is more noticeable with large tables, it was decidedto have a separate parallel block for each day of the week. The largest table was then kept to 150 linesrather than the 500 or so lines that may be needed if all days were coded in the same table. Separateparallel blocks for each day of the week also save unnecessary keystrokes by entering the day codeautomatically in each case.To remind the coder of the details of the diary that is being coded, the record identifiers and basicdemographics (sex, age, summary of family members) were added to each screen through the label on thefield defining the block. In that way, the respondent information is displayed constantly throughout theinstrument.To assist in defining the completeness of a diary, coding staff are required to enter "EOP - End of page"into the last entry of each parallel block when they have finished coding the corresponding entries (seeFigure 3 for an example of such an entry). For blocks which require the entry of day codes, a day code of"0" (zero) is an alternative way of indicating that no further entries are required for a that block. When thediary is closed, a Manipula subroutine then examines each diary entry to locate "EOP" or Day zero codesas well as the presence of "QUERY" references (see Query resolution communication in section 6) todetermine the status of coding for that diary and marks a field in the record with the corresponding result.The status of a diary record can then be used to control which other processes may be used on it. Forexample, only "completed" diaries can be exported for further processing.A special feature of the diary instrument is the ability to "switch off" the discount column in the tables ofgeneral expense items and thereby reduce the keystrokes required for most entries. This was done throughthe use of an "Edit discount" field in the main block of the instrument which could be set by the coder to"Yes" to enable the discounts to be entered or "No" to skip the discount column. The discount column canalso be "switched on" at any time by navigating to the main block and changing the "Edit discount" fieldaccordingly. To assist the coder in applying a discount to a series of consecutive entries, such as might beapplied for a staff discount at a grocery store, a small Manipula utility was written that uses the linereferences for a series of entries to be discounted (see figure 4). This utility can be called from the

71
Maniplus interface and asks the coder for the line references to which the discount is to be applied (for aparticular diary record and a particular day).
Figure 4. Dialog screen for discount details to be applied
6. Communication between the diary system and other facilitiesThe decision to use Blaise for the data capture and coding of diaries created the issue of communicationbetween these facilities and the Notes-based diary management facilities.The Notes-based Diary Tracking facility needed to be provided with regular updates of the codingoperations so that progress could be monitored daily. There also needed to be a way that problems withdiary coding could be "notified" to the Query resolution facility for resolution. Separate solutions weredeveloped for each of the situations mentioned.Diary Tracking communicationThe Diary Tracking facility is notified of coding progress through Email messages which are generated atthe end of each coding session. The text of the message contains a log file written by a Manipulaprocedure which is activated whenever a diary is completed (as determined by the status checkingsubroutine mentioned in section 5). The entry in the log contains the record indicative, date, time, ID ofthe coder and the status of the diary. A extract of the Manipula which writes to the log file is shown atFigure 5. Once an entry is written to the log the record is then flagged as having been "Emailed" to theNotes diary tracking system. This avoids the possibility that a diary could be notified more than once(unless the status has changed again).

72
Figure 5. Manipula code which writes each record (if changed) to the log fileOUTPUTFILE fNotesMail : mNotesFile ('', ASCII)SETTINGS OPEN = No CONNECT = NO MAKENEWFILE = No TRAILINGSPACES = No
..............MailID := Households.CaseID.PSU + '/' +Households.CaseID.BlockChk + '/' +Households.CaseID.Dwelling + '/' +Households.CaseID.Household + '~' +TempCt + '~' + DiaryCount
IF ((Households.OfficeFields.Diary1MailSent[aCount] = EMPTY) OR(Households.OfficeFields.Diary1MailSent[aCount] = 0)) THEN IF (Diaries.DiaryStatus = Done) THEN fNotesMail.line := MailID + '~Coded~' + datetostr(sysdate) + '~' + Diaries.CoderID fNotesMail.WRITE aSendMail := 1
Households.OfficeFields.Diary1MailSent[aCount] := 1 ELSEIF (Diaries.DiaryStatus = Uncodable) THEN fNotesMail.line := MailID + '~' + Coding.DiaryStatus + '~' + datetostr(sysdate) + '~' + Diaries.CoderID fNotesMail.WRITE aSendMail := 1 Households.OfficeFields.Diary1MailSent[aCount] := 1 ENDIFENDIF
PROCEDURE ProcWriteMail fNotesMail.CLOSE IF aSendMail = 1 THEN Res := RUN('L:\utils\mailsend\mailsend '
+ '"HES Diary Dispatch" "Completed Diary Indicatives" "/'+ aNotesFileName + '"')
ENDIFENDPROCEDURE
The "sending" is carried out by an ABS developed windows console application which is "run" by theManipula when the coding session is completed. When the message is received by the Diary Trackingfacility it is processed to update the status of each diary involved. A sample of the generated message andthe form which is created for each is shown in Figure 6.

73
Figure 6. Sample Email produced by the systemand the form generated in the Diary Tracking facility
When the messages are collated they can be used to produce a variety of reports on the status of coding, byasking Notes to present the records in different "views" (see Figure 7 for sample view). From this view,various processes can be activated using the buttons provided.
Figure 7. Sample view of all diary records showing summary and detail elements
Query resolution communication

74
When a problem diary or difficult coding instance is encountered, it is necessary for the coder to check theproblems database and raise a "Query" which lodges the details of that query into the facility where asupervisor can find it and then resolve the problem. Given that the entry system is being operated from aDOS session within Windows 95 (and a Windows DLL cannot be used), it should be a simple matter ofthe coder switching to the Email system (using ALT-TAB) and typing a message or filling in a form. Theproblem with this solution was how to ensure that the details of the problem record were accuratelyrecorded in the text of the message. The solution which was devised involves using the ALT-PRINT keycombination to take a dump of the DOS screen and then paste it into a special field in the Windows basedquery form. By setting the font in the special field to a System font, the screen dump was converted to asimple text form. Figure 8 shows a sample of such a form after the DOS screen dump has been pasted intoit. While the solution is not elegant, it does ensure that the information which was on screen for the coderis accurately copied to the query system.
Figure 8. Sample Notes-based HES Query form
Once the query has been registered, the coder then enters the registered query number into the problemdiary. This is done by entering "QUERY" into the item column in the diary entry and entering the querynumber (number 420 for the example shown in Figure 8) into the amount column. The presence of thisentry in the diary prevents it from being cleared for further processing. When the query has been resolved,the coder can then readily identify where to inse t the resolved entry.

75
7. Trigram coding issuesAs mentioned previously, the descriptions of purchases were classified to a commodity code list using thetrigram search method.The code list consists of 625 codes arranged in a loosely structured 2-level framework and a lookup listconsisting of over 6,300 separate descriptions. The trigram search method was considered to beappropriate for coding of purchases because of the large number of items involved and the way that themethod returns a variety of possible entries when only a small number of letters are entered. It wascertainly considered more appropriate than an alphabetical list.Facilities were developed in a Lotus Notes database to assist with the display and maintenance of thecoding list and the edit limits. As and when it was considered necessary, the updated list was exportedfrom the database to an ASCII file which was then loaded into the Blaise system.A Notes database was considered preferable to a Blaise maintenance utility because it could be readilyaccessed from the Windows desktop. The database also has the ability to present the coding list in avariety of "views" so that maintenance staff can readily examine which entries are coded to whichcategory. The Notes facility also provided version control functionality, by keeping track of changes andretaining "deleted" entries. A sample view from the utility is shown in Figure 9.
Figure 9. Sample view of commodity list maintenance
In order to assist with maintenance of the coding list, a local Notes "agent" was developed to test thebehaviour of the trigram method. This was done so that the various pick lists which come up when asearch string is entered could be examined. The agent scores each entry in the database against thetrigrams that are found in the search string and presents the results in a temporary view, ranked by thetrigram score. The method was set up to replicate the way that trigram searching is done in Blaise. In thatway any changes to the list could be immediately tested without having to export and load the data to aBlaise datamodel first. A similar "testing" facility is available from the main screen of the Blaise system toassist with query resolution.

76
Figure 10. Sample view showing the return of trigram search using the string "stru"
Whenever the commodity list has been updated it is exported to the LAN for compilation into a Blaisedatamodel for the diary coding system. The next time that a coder logs into the system he/she will then usethe updated code list.
8. Verification of diary codingEnsuring and maintaining the overall quality of the coding is a very important aspect of the processingwork. The high volume of coding to be done over a 12 month period means that systematic errors madeby one or more coders can impact significantly on the quality of the final data. The ability to identifypatterns of errors in the work of coders, for example, due to the misinterpretation of the coding rules, is anessential requirement of the diary coding system. To ensure that an adequate level of coding quality ismaintained, a strategy has been developed which entails the check coding of a selection of diaries.Initially 100% of all diaries are check coded. For each coder, the level of checking drops to 1 in 5households provided that the error rate is less than 10%, and a further drop to 1 in 8 households occursonce the error rate is less than 2%. The error rate is calculated to be the number of errors as a proportion ofthe total possible number of entries in a sample of diaries extracted from a single workload (about 60diaries). The diaries to be checked are selected by applying the relevant skip interval continuously acrossall workloads. When the mismatch between original and checked diaries is less than 2% then the entriesare considered acceptable and not changed. When the mismatches are greater than 2%, they are assessedand the error rate determined. If the error rate is greater than 10% then the entire workload is re-coded by adifferent coder.In building the checking facilities, it was initially considered having a parallel set of diary entries in thesame instrument with the relevant path defined by whether the person was coding or checking. Under thisparallel coding design it would be possible to identify each difference as it occurs. Although some tests ofthis design were made, it proved difficult to keep the parallel entries in the record while trying to make thebehaviour of the instrument appear the same for both operations. In addition there were concerns about thecheck coder being influenced by existing entries whenever a difference was notified and about thenecessity to carry a duplicate set of fields in the record. Consequently it was decided that check codingwould be done using a duplicate set of records which would be checked against each other later.The Blaise based diary coding system was enhanced to enable the generation of duplicate records (selectedaccording to the relevant skip interval) for check coding purposes and access them from the sameinterface. The functionality associated with the check coding processes was then identical to the original

77
coding processes. No direct checks are made between the original diary and the check copy. Comparisonof the two coded diaries is done later.In the same way as the Diary Tracking facility, it was a preferred requirement of the checking system thatthe results of the check coding were supplied to a Notes based utility where office staff could readilyaccess them. The Blaise diary data and the corresponding check data is exported to ASCII files forexamination via a SAS program which matches all the diary entries and identifies the differences. Thesummary results are written by the SAS program directly into a report document in the Notes databasewith the detailed listing of discrepancies in each case accessible via a "button" in the document. Figure 11shows a sample report form and summary view of the check coding results with calculated error rates. Thechoice of SAS in this process was partly a result of the requirement to write directly into the Notesdatabase and partly a result of the skills of available staff.
Figure 11. Sample report form and summary view of results
9. ConclusionsThe HES diary coding system, as developed at the ABS, illustrates how it is possible to integrate BlaiseDOS-based software with Windows-based facilities through innovative use of Email, screen dumps andexporting data to ASCII. Mixing Blaise and Windows-based software provides the opportunity to exploitthe advantages of each. In the case of Blaise, the data entry functions and relative efficiency are exploited,whereas in Notes the Windows presentation of data and reports is exploited. While a Windows version ofBlaise should make integration somewhat easier it should not preclude using other software where itprovides useful functionality.Another conclusion from the experience with this system development is that it is worthwhile conductingsome performance tests, even on a small scale, before committing to a particular solution. In this case, the
78
comparative tests identified considerable efficiencies to be gained from the use of Blaise for thosefunctions that it is good at.
10. AcknowledgmentsThe authors would like to acknowledge the work of Ken Smith, Reece Guihot and Gary Edwards whodesigned and built the systems described in this paper. Acknowledgment is also given to ManoGeorgopoulos who contributed significantly to the design of the systems and conducted the comparativeanalysis of Blaise and IPS.
ReferencesHenden M, Wensing F, Smith K, Georgopoulos M : An Office Management System in Blaise III,Proceedings of the Fourth International Blaise Users Conference, Institut National de la Statistique et desEtudes Economiques, France 1997, pp107-122.

79
SSeeccttiioonn CC.. DDeessiiggnn,, TTeessttiinngg aanndd DDooccuummeennttaattiioonn
Producing an error-free CAI instrument -- Is it possible?
Maureen Kelly, Office for National Statistics (UK)
1. Introduction
The data collected by Social Survey Division (SSD/ONS) are published in high profile Governmentstatistics (for example the Retail Price Index, unemployment statistics). They are widely used by publicpolicy makers. It is therefore essential that the data are as accurate as possible. Computer AssistedInterviewing (CAI) has had a major impact in improving data quality in our surveys. Implementation of asurvey instrument is more controlled. For example, interviewer errors in following the correct routing incomplex instruments have been eliminated.
These improvements, and the quality of the resulting statistics, depend on the accurate design of thesurvey instrument. Moreover, CAI has allowed much more complex routing to be designed, since theinterviewer is no longer required to work it out on the spot. CAI instruments can include edit checks. As aresult, CAI instruments tend to be more complex than paper questionnaires.
Testing plays an essential part in reducing errors in CAI instruments. For large and complex surveys of thekind typical in public sector social research, the theoretical possibilities for testing are almost limitless.The challenge is to find ways of testing both thoroughly and cost-effectively. Surveys that are carried outcontinuously offer more opportunities to learn from testing than do ad hoc surveys. This paper will look atthe problems encountered when trying to test the Blaise instruments used for continuous social surveys.The main example will be the U.K. Labour Force Survey (LFS).
An important aspect of producing error-free instruments is the way in which the CAI program is written.This paper will look at ways to structure and write Blaise programs so that errors are less likely to occur,and at ways to provide a basis for efficient testing.
Finally, the paper will look at the different problems encountered when developing and testing completelynew instruments as compared with maintaining and amending instruments already in use.
2. Time and resources
The major constraints on the thorough testing of Blaise instruments are the amounts of time and resourcesthat are available for testing. As the theoretical possibilities for testing are almost limitless, if anorganisation had infinite resources and no timetables to meet, each instrument could be tested at leisureuntil it was perfect. In practice, Aas development timetables are shorten and survey managers tend toeconomise on the timetable elements with most elasticity, such asto over to testing. However, it could beargued that testing is particularly important when it is probably more essential (as when the instruments

80
may have been written under stringent timetableincreased pressure that makes themand therefore may bemore error-prone.)
Another problem is the increased flexibility that an electronic instrument givesn to clients to change thequestionnaire specification at late notice;. It is technically feasible, if not advisable, to make changes rightup to usually just before the beginning of fieldwork. The later any changes are made, the less time there isto test them. For example, Tthe LFS was market tested in 1995, after which all aspects of the timetablewere accelerated, including the crucial development phase; for writing and testing the Blaise instrument.The new contract also allows the clients to make changes to the questionnaire up to two weeks beforefieldwork begins. The later any changes are made, the less time we have to test them.
Given the constraints on both time and money, whatever testing that is carried out needs to be organisedand prioritised in a such a way as to ensure the instrument is as correct as possible whilst making the mostefficient use of people’s time.
3. The testing process
There are two major strands to efficient testing:
• ensuring that there is a well-structured and systematic procedure for testing the instruments; and• good management of the testers and the testing process.
good organisation of the testing process, that is, deciding who is doing the testing and making the best useof their time; and? ensuring the testers are testing the instruments in a well-structured and systematic way.
The two strands are inter-related; how the testing can be carried out is, to some extent, dependent on whowill be doing the testing. There are several distinct testing phases that a CAI instrument should pass through before it is used as aninterviewing tool. Each phase is important, buthowever on itstheir own it they would not constitute athorough test of an instrument. When a new version of an existing instrument is required, an author makes the necessary changes to theCAI programs. The author usually does the first phase of testing; testing the amendments they have madeas they go along. This is seldom done is not usually in a very systematic way, as the authors tends toconcentrate on the changes they have just made. andAuthors often fail todoes not check if there are anyadversethat the effects of the changes on other have not adversely affected another parts of the program. Once all the author is satisfied that all the changes have been made, a second stage of testing is required.whichThis is carried out on a completed instrument. ItThis stage is the most important stage and isdiscussed in further detail below in Section 3.1. All tThese stages are iterative.; iIf errors are found, the CAI program is amended., tThe instrument isrecompiled and the new instrument is re-tested in the same way. This process is repeated until all theerrors have been corrected.

81
Finally, once all the testing of the instrument is complete, the interface between the final instrument andthe softwareoperating systems used by the interviewers need to be tested. Parts of the instrument mayuserely utilise external information or programs (for example, DOS environment variables, Dynamic LinkLibraries and external Blaise files and libraries). In addition, the interviewer's systems may need to useinformation written out in ASCII from the Blaise instrument. (The need for this is reduced inorganisations that use Maniplus for case management.), writing out of ASCII files). For the LFS, there aretwo interviewers' systems with interfaces to Blaise: • Casebook, used by the face-to-face interviewers on their laptops, and• a CATIPC-based Call Scheduling system for the telephone interviewers. Once the testing is complete, the instrument can be made available to the interviewers, to conductinterviews. Figure 1 shows a summary of the testing process.
Figure 1
Amend program according tospecification
Correct any errors Author test changes as they go
through
Test version of instrument
Correct any errors Thorough testing of complete
instrument
Final instrument
Correct any errors Test instrument on software
systems
Send instrument out to
interviewers
3.1 Structured testing of the complete instrument Thorough testing requires independent testers. There are two common methods of testing instruments:entering data into the instrument; or examining the source code. Only someone who can read CAIprograms can do the latter. InWithin SSD/ONS, many of the independent testers are unfamiliar with Blaiseprograms. Therefore mostthe majority of the testing is done interactively by inputting data into theinstrument. Examination of the source code is usually only used when to trying to correct a identifiedproblem that has been identified by the first methodwith the code. Moreover, the only way to test layouts,question woording and text substitution is by looking at the instruments on screen. An independent specification, that is, one that has not been generated by the CAI program itself, is anecessary tool for testing. Firstly, the authors needs it to make all the necessary changes. Secondly the

82
independent testers should use it to check thatese the changes have implemented correctly. Theisspecification needs to be understandable to testers unfamiliar with the CAI programs. For this reason,many survey researchers use flow charts to show the routing of the instrument. Survey researchers do notalways have formal specifications from customers. Customers sometimes state their requirements forquestions in general terms. The researcher then has to translate these requirements into a specification androuting for the CAI program. Tests ofWhen testing routing, checks and signals should examine all possible combinations of data shouldbe tested. It is important to check it is important that the ‘negatives’ are tested as well as the ‘positives’.That is, that the correct sub-groups of people are asked the question and that people not in the specifiedgroup are not asked the question.., It is, of course, far worse to collect too little information than too much.If too much is collected, the data can be edited after the interview. However, asking respondents questionswhich do not apply to them is to be avoided if possible, to reduce respondent burden and costs, and avoiddisruption of the flow of the interview would be affected as respondents are asked questions that are notapplicable to them. The ‘negative’ testing is always more time consuming then testing positives. There are usually morecombinations of routing that result in the question not being asked than being asked. Example 1 Five questions QA, QB, QC, QD and QE have the answer categories ‘yes’ and ‘no’ and the routing is asfollows: QA IF (QA = YES) THEN QB IF (QB = YES) THEN QC ENDIF ENDIF QD IF (QA = YES AND QD = YES) THEN QE ENDIF To test QB, four responses to QA need to be tested: yes, no, don’t know (Ctrl+K) and Refusal (Ctrl+R).These give the following results: QA _QB__ Yes_ Asked__ No _ Not Asked__ Don’t Know (Ctrl+K) _ Not Asked__ Refusal (Ctrl+R) _ Not Asked__
It is important to test that the correct question attributes have been used and what effect the missing values(Ctrl+R, Ctrl+K) have on the routing of the instrument. They are sometimes overlooked, but they can havean affect on the routing. In this example, it is fairly obvious that the Don’t Know and Refusal will not be

83
routed to QB. In others it is not so clear. As the routing gets more complex, the number of different combinations that need to be tested increases.The routing toof QE involves two variables: QA and QD. Each question has four possible answers,resulting in 16 combinations. Only one of them should resulting in the question being asked:
84
QA_ QD_ QE__ Yes_ Yes_ Asked__ Yes_ No_ Not Asked__ Yes_ Ctrl+K_ Not Asked__ Yes_ Ctrl+R_ Not Asked__ No_ Yes_ Not Asked__ No_ No_ Not Asked__ No_ Ctrl+K_ Not Asked__ No_ Ctrl+R_ Not Asked__ Ctrl+K_ Yes_ Not Asked__ Ctrl+K_ No _ Not Asked__ Ctrl+K _ Ctrl+K_ NotAsked__ Ctrl+K_ Ctrl+R_ Not Asked__ Ctrl+R_ Yes_ Not Asked__ Ctrl+R_ No_ Not Asked__ Ctrl+R_ Ctrl+K_ Not Asked__ Ctrl+R_ Ctrl+R_ Not Asked__ 12 out of the 16 combinations involve the Ctrl+K and Ctrl+R categories. In many cases the Don’t Knowsand Refusals are treated in the same way. To save time, test in most cases it would be sufficient to testeither Ctrl+K or Ctrl+R at each question but not both. In the example given above this reduces the numberof combination from sixteen to nine. Note thatIf a question has different attributes, for example when thereis an explicit 'don’tk know' response category and therefore the attribute NODK is often attached to avoidgiving the interviewer two ‘don’t know’ options. A question like this should be checked to make sureCtrl+K cannot be entered. If the question is used in the routing for other questions the routing of Ctrl+Rhas to be tested. Particular attention should be paid when NOT conditions are used in routing. It is may be unclear whatshould be routed to the question, and particularly easy to overlook the routing for the missing values. Once the routing for QB has been satisfactorily tested, then QC can be tested, and so on. The nesting ofthe questions within a block facilitates this testing process. If one question relies totally on the informationfrom a preceding question that has already been tested, then you do not need to go back and retest therouting to the preceding question. For example, the routing of QC relies totally on QB. Once the routing toQB has been tested and found to be correct, QC can be tested without the need to go back and retest therouting to QB. In an ideal world the routing to all the questions within the instruments would be tested. This wouldusually take more time than is usually available for testing. The testing can be separated into several stagesso that the instrumeemnt is thoroughly tested without having to test every single question: • testing the changes made;• testing the remainder of the instrument;• overall testing of the instrument.? testing late changes.
85
T3.1.1 Testing changes The main focus of testing amended instruments for continuous surveys is to ensure that all the necessarychanges have been implemented correctly. There are different types ofdifferent changes that can be madeto an instrument, all of which need to be tested_: • new questions introduced;• old questions removed;• changes to routing;• changes to wording – question text and answer categories;• changes to answer ranges;• new/amended checks and signals;• new/amended text substitution;• changes to computations;• changes to layout;• changes to attributes (e.g. EMPTY, DON’T KNOW, REFUSAL)• changes to parameters;• updating of coding files. In some instances, the changes may fall into more than one category. For example, . Wwhen adding a newquestion, all the wording, routing and layout need to be checked. Changing the routing to an existingquestion may also result in checks, signals and, text substitution being amended. Adding an extra answercategory to a question may also require a layout change to ensure that it fits on the same screen as theoriginal answer categories. Routing, checks, signals, computations and text substitution can be checked at the same time together asthey all appear and are affected by the RULES paragraph of the program. SimilarlyIn a similar way,question wording, layout of the question text and on-screen instructions can be checked together. When testing changes, a ‘test’ version of the instrument can be used. This shows fields and auxfields thatwould normally be hidden in order that computations can be easily tested. The author has to remember tohide these fields before the instrument is finalised. It is usually a good idea to make testers aware thatsome fields appear which they will not see in the final version. 3.1.2 Testing the remainder of the instrument Once all the code for the intentional changes to the instrument hasve been tested, the remaaminder of theinstrument needs to be tested to ensure that none of the new code haschanges have adversely affected theconditions forrouting to any other questionsvariables, checks or computations. The hierarchical blockstructure of the CAI program and the nesting of questions within these blocks facilitate this process. If the routing to any questions, or checks, or computations, remains as beforehave not changed but theconditions for these itemsy use include variables for whichwhere they routing has been changed, thenthese items too should be tested. This includes both questions within the same block as the amendedquestion, and in other blocks.{tm - I don't understand the need for the last sentence}

86
If the routing to a particular question is amended, the routing to all the subsequent questions within thesame block should be tested. Simple mistakes such as putting an ENDIF in the wrong place can causeramifications throughout the routing of the remainder of the program.
Example 2 The specification for four questions is as follows and an amendment needs to be made to QB: QA – ask everyone
QB – ask only if QA = YES (previous routing – ask everyone) QC – ask everyone QD – ask only if QC = YES The routing was written as:
IF QA = YES THEN QB QC ENDIF IF QC = YES THEN QD ENDIF
The routing to QB (the IF condition) is correct. The ENDIF that should come after QB was placedincorrectly after QC. Therefore the routing to QC is incorrect. Even though the routing to QD is writtencorrectly, not all the people who should be asked QD are routed to it. The error in the routing to QC iscarried through to QD. After testing the change to QB, there still needs to be a test of routing to QC and QDif the tester is to find the error. If a block has not been amendedSometimes a whole block is unaffected by the current revision. No codewithin it needs to be changed. None of the conditions for any of its component questions invokesamended questions in other blocks. The routing to unamended blocks still need to be tested. In the aboveexample, the questions QC and QD could relate to blocks of questions. The error would then affect twowhole blocks of questions. To test the routing to a block, some questions within that block need to be tested. Only certain questionsneed to be tested: the first question in the block, any other questions at the highest level within the block(that is, with no IF/ENDIF statements), and questions with references to questions outside the block. Thenesting of questions within a block mneans that most questions are dependent only on answers to previousquestions within that block. , and tOherefore only a few questions that have references to questions outsidethat block. Testing the routing to all the ‘un-nested’ questions is sufficient to test that the whole block iscorrect. ‘Un-nested’ questions are the first question in the block, those at the highest level within the block(with no IF/ENDIF statements), and those with references to questions outside the block. The routingwithin the block can be assumed to be correct before any amendments were made to the program. The

87
CAI programs used before the amendments are usually the ones used to create the instruments that arecurrently in the field. Testing the ‘un-nested’first and highest level questions ensures that the routing to theblock is correct. Testing questions with references to questions outside the block ensures and that thetransfer of information between blocks is correct. Testing the routing to all the ‘un-nested’ questions issufficient to test that the whole block is correct. This process should be repeated for each block within theprogram, so the whole instrument is tested.
3.1.3 Overall testing of the instrument Once the testers are satisfied with the changes to all the necessary individual questions have beensatisfactorily tested, they should carry out more general testing of the instrument questionnaireis should becarried out. Many surveys, including the LFS, do this by entering On the LFS, they Imaginary householdsare created and enter data enter for imaginary test householdsed into the instrument to check that thequestions appear as expected. The LFS questionnaire is made up of a household section followed bybe andindividuala series of interviews for each person in the household. Imaginary Severalrespondents arecreated to reflect the important sub-groups the LFS is trying to identify, such as. For example: full timeemployees; full-time students with and without a part-time job; housewives, not working and looking aftersmall children; retired old age pensioners; and unemployed people looking for work. Theis next phase of is followed by testing is for different types of households and the full range oftestingthe various household outcomes. As with testing ‘negative’ routing, it is important to checkthat the Blaisecode applying to ineligible and non-responding households are checked and are working correctly. Mostof the testing concentrates on what occurs during an interview with , and that respondents are asked thecorrect questions. Experience from the LFS has shown that interviewers can encounter serious problems,such as unresolvable check messages, if testers overlook cases where there is no respondent.this part of thetesting is overlooked. Similar tests are appropriate for surveys of persons rather than households.
{Tm - I'm not sure that this section adds anythingLate changes
There are usually late changes made to the program just before it is finalised when there is no time to fullytest the instrument again. Depending on what these changes are, it is may be advisable, but not essential,for another person to check the amendments. For example, if a spelling mistake is corrected it is probablynot necessary to check it. However, if an important computation or piece of routing is changed, someoneshould check that the amendments are correct.}
3.2 Organisation of the testing process 3.2.1a) Who should do the testing InWithin SSD/ONS, the author of the Blaise instrument usually has overall responsibility for ensurtestingthat the instrument to ensure that it delivers what is expected. Although the author is usually involved inthe testing it is not usual, or advisable, that they alone shouldauthor solely tested the questionnaire alone. Authors can sometimes let errors slip through as they can suffer from ‘seeing what is expected’ rather thanwhat is there. Therefore other people should be involved in the testing: other researchers working on the

88
project, administration or field staff, and interviewers. The number of people and amount of time availablefor testing will depend upon the project and the resources available. On the LFS, at least one otherresearcher and alongside a number of telephone interviewers from the CATI unit test the instrument. Sincethe unit is centralised, it is easy to discuss the instrument with these experienced interviewers and costs arelow. Testing by interviewers, in addition to other testing, is the norm for CAI instruments in SSD/ONS. Provided there is careful management,Usually the more people who look at the questionnaire the better.For example if there is only one day set aside for testing, it would probably be better to use two people tolook at it for half a day each, rather than one person for a full day. This has the advantage that one personmay pick upyou an error the other has accidentally missed. Also, tTesting questionnaires is a laborious anddull task, so the time any one and tester spends on the task should be short.s are likely to get bored, andtherefore may be more likely to miss errors if they have to test the instrument for a long period of time.{Tm - I'm not clear from this para and the next if we want to check each other's work or not - the parasseem to give conflicting advice. I think one of the paras has to go.} Only a moderate amount of duplication of testing amongst testers is necessary. Poorly organised testingleads to excessive duplication can occur which is a waste of valuable time and resources. The more peopleinvolved in the testing, the more likely there is to be a unnecessary amount of duplication of effort, withthe testers testing the same part of the questionnaire at the same time and therefore finding the same errors.Although a moderate amount of duplication is inevitable and necessary, so that more than one person hastested each part of the questionnaire, too much is just a waste of time and resources.
In the past, wWhen the LFS interviewers first became involved in testinged the questionnaire, they weregiven very little guidance or co-ordination as to how they should test the questionnaire. Unsurprisingly,they all tended to start This resulted in the interviewers usually starting to test the questionnaire at thebeginning and duplicate their efforts and findings. , and all coming across the same errors. It also meantthat Mmore time was spent ontesting the beginning of the questionnaire than on its later sections, findingthe errors which left less time for testing the latter parts of the questionnaire. One way the LFS sought to reduce the amount of duplication was to split the testing of the changes intosections. The testers esters are made responsible for testing individual sections, such as householdinformation, employment details, job search activities, education, administration etc. The work isorganised so that each section is tested by at least two people. Splitting the questionnaire into sections alsomade the task more manageable for the testers, some of whom admitted that they felt daunted by having totest the entire questionnaire. Theis results of giving the testers ownership of a clearly defined andmanageable task is that in each section of the questionnaire is, being thoroughly tested. In the previoussituation, arather than number of people superficially checkeding the whole questionnaiiare rathersuperficially.
3.2.2b) Documentation Testers need documentation so that they know what to test. As well as the independent questionnairespecification, the LFS testers also found the following documents useful: • TThe specification for the previous version of the instrument. As they were testing the amendments to
an existing questionnaire, they found it useful to be able to compare the two specifications, as well asthe instruments.
• A list of all the changes made to the instrument, which they would have to test.
89
• A list of all the other questions that needed to be tested (see 3.1.2 – Structured testing. Testing theremainder of the instrument).
• A structure diagram of the instrument. Many of the testers are unfamiliar with Blaise and the blockstructure of the instrument. They found a structure diagram useful to see how all the sections fittogether, which is not always obvious from a paper specification.
• A set of test data list of imaginary respondents and households to test the whole instrument.
3.2.3c) Communication
Good communication is essential for an efficient testing process. This includes communication amongstthe testers and also between the testers and the program author. One problem identified by with the LFSCATI interviewers in their roles as testers is that they work fairly independently of each other. It isparticularly difficult to share information across shifts. , working on different shifts in the Telephone Unit.One tester could discover a problem and inform the author, only to discovernot realising that another testerhad already found it. Email was usually used to communicate between the author and the testers,. Thiswhich provided a useful record of the reported problems for the author, but not for the testers. To improvecommunication, aHowever, the testers also decided that a log of the problems found was set up.would alsobe useful, which It listed: a description of the problem, which variables it affected; which tester had foundthe problem; when it was found and when it was corrected.The log was particularly important in recording when a problem had finally been corrected. It wasimportant to find out when the problem had been corrected as testers could spend a lot of time checkingknown errors before they have been corrected. The testers usually get more than one version of thequestionnaire to test: they test the original version and, they test it, find some errors;, the author correctsthem errors and producesgives them another version. They interviewers then test the new versionis to seeif the errors have been corrected. This process is continued until all the errors have been eliminatcorrected.However, there are some problems which are harder to solve than others, and it may be the case that theauthor has to you issue an interim version of the instrument, which only corrects some but not all of thereported problems. It is essential that the author communicates to the testers when the amendedinstruments are available to use and which problems have been corrected, otherwise vital testing time canbe wasted.
3.2.4 Timetable
One of the major problems encountered when testing instruments is the time available for testing. It isimportant for all the people involved in the process to know whenwhne the testing will take place, andhow long they will have to test the instruments. This includes when they will get revised questionnaires.This will help the testers plan their work and make the most of the time available.
4. Good practice in questionnaire design
So far, this paper has focussed on the issues surrounding the problems of testing instruments after, oncethey have been changed. Another important aspect of providing error-free instruments is trying to avoidproducing the errors in the first place. There are many ways to improve instrument design. Two commonexamples may illustrate the point.
The simplest way to minimise error is to make as few changes as possible to a well-tested instrument.Usually, the less changes that are made to a program the smaller the number of errors can occur. However,when testing instruments for continuous surveys the majority of the testing concentrates on ensuring the
90
changes have been implemented correctly. Even in these cases, the way in which the program is writtencan have an affect on the number of errors that are likely to occur. Before the LFS moved to Blaise III (inSeptember 1996), there was a major revision of the program each quarter. Every year, About 10% of theinstrument changed the similar changes were made to each quarter. The quarterly instruments were eachas large as Blaise 2 could handle’s questionnaire. When the LFS moved to Blaise III made itit waspossible to create an annual questionnaire, which contained the routing for all four quarterlyquestionnaires. This consolidatedreduced the amendments made to the questionnaire into a single annualrevision and thus reduced the potential for errors. On other surveys, Blaise III made it possible toconsolidate previously separate household and individual instruments, resulting in similar improvementsNow, only one major revision of the questionnaire is carried out each year.
Good design of routing is critical in reducing the scope for errors. Routing should be at the highest levelpossible.; Iif a particular condition applies to all the questions within a block, that condition should beused in the routing to the block rather than the routing to the questions within the block. This will reducethe number of questions that would need to be tested after all the intentional changes within a block havebeen tested (see 3.1.2 – Structured testing. Testing the remainder of the instrumentpart (b)). Also,dDuplication of routing at the two levels, which sometimes occurs under time pressures if the Blaise writerdoes not plan changes carefully, is particularly toshould be avoided. Not only is it inefficient,, butas it iseasier for errors to creep in later when one level is amended and the other is not.
It may be useful to create dDerived variables (DVs) can be used for complicated conditions that are usedin several different places within the program and are likely to change. For example, on the LFS thequestions on on work-based government schemes regularly change. They are widely used in theinstrument. The current definitionand is currently defined as (YTETMP =1,2,4) OR (SCHEME = 5) OR(PROJWK = 2, 4). AIf a derived variable (DV) might usefully bewas computed for this set of conditionsand then used throughout the instrumentprogram., Wwhen the definition changes,d only the DV wouldrequire amendment. At present, if the definition changes, the routing to all individual questions which usethat definition in their conditions requires amendment. Errors are therefore more likely to occur than if aDV is used. The fewer changes that need to be made, the less likely errors are to occur. It should be notedthat good practice requires the name of the DV to be changed if its substantive content changes. If this isnot done, there is a risk of introducing errors at the analysis stage. Analysts of the data may assume -reasonably but, in this case, incorrectly - that a variable with a single name has the same meaningthroughout a longitudinal dataset. It is easy to add an incremental number to the DV name through thesearch and replace function.
5. Differences between developing new instruments and maintaining instruments forcontinuous surveys
This paper has concentrated on the amending and testing of instruments for continuous surveys. Thisaccounts for a considerablemajor part of the work carried out within SSD/ONS. However, SSD/ONS alsodoes manya number of one off ad -hoc projects using CAI. The instruments for these surveys arecompletely new. They need to be designed and tested. As with continuous surveys, ad -hoc surveys mustbe designed under stringentalso suffer from the budgetary and time constraints. However tThe majordifference between instruements for ad -hoc and continuous surveys is that testers cannot concentrate onparticular parts oftesting changes to the instrument, as everything is new.
One way in which SSD/ONS has tried to address this problem is to use standardised blocks and templates.For example, there are standard blocks to ask questions on economic activity, and household composition.The author does not then have to worry about writing or testing these blocks and can concentrate on thesurvey- specific blocks. The routing within these standard blocks has already been tested. When the testing

91
the ad hoc instruments, the testers can test the routing to these blocks is correct in the same way as theywould test unamended blocks on a continuous survey.
6. Conclusion
Producing error-free instruments is vital in producing good quality data. Practical survey work is doneunder stringent limits on time and resources, so it is impossible to test literally every combination of thevariables and their categories. Fortunately, the strong structure-building features of Blaise and thepossibilities for good design provide a basis for prioritising the testing.It is extremely difficult, if notimpossible, to create a perfect Blaise instrument, particularly given the time and resources available tosurvey producers. Nearly a decade of continuous and ad hoc survey work with Blaise in SSD/ONS hasshown that data quality is much improved over paper questionnaires in the areas of instrument design thatwe attempt to improve through testing, such as routing. Testing aspires to be as scientific as possible, butthe constraints under which it is done mean that there is value in the kinds of practical experience recordedin this paper..
________________
See also ‘Blaise Testing Protocol’ for a fuller list of all items that can be tested. Blaise Services at Westat,January 1997
92
Blaise III: Changing the data model after implementation
Pavle Kozjek and Marko Sluga, Statistical Office of the Republic of Slovenia
1. Introduction
Recent development of statistical methods and techniques has opened many new possibilities in surveyprocessing. Modern tools were developed to help statisticians and informaticians to get results - statisticalinformation - in shorter time and with less effort. But, on the other hand, less and less time, money andhuman resources are available to get the same statistical information. Timeliness became a problem formany developers, and it usually results in lack of time to completely design and test the application.With CAI (particularly CAPI) applications this can lead to serious problems, when such an application isinstalled to many laptops, and some data are already collected and edited. Changing data definition meansincompatibility of data files, which usually can not be solved without developers.This paper describes one of the possible solutions for this problem, when the survey application is alreadyin production. It can be used with the Blaise III applications. At the Statistical Office of Slovenia (SORS)it was successfully used with the continuos Household Budget Survey, conducted since February 1997,with the Pilot Census 1998 and some other surveys.
2. Slovenian Household Budget Survey - a short description
HBS in Slovenia has been carried out since 1963 on a larger sample (every five years about 3,200households) and on a smaller sample (every year about 1,000 households). Since 1997 the SlovenianStatistical Office started with a continuos HBS. Every year about 1,200 (net) households shall beinterviewed. Since this sample is too small for more detailed calculations, the data shall be aggregatedtogether for 3 years. Every year the "oldest" 1,200 households shall be eliminated from the sample and the"newest" 1,200 households shall be included.Becoming continuos, the survey was radically changed, with new survey and questionnaire design, newnumber of interviews, diaries were introduced and complete data processing was defined in a differentway. A pilot survey (which was contemporary a Blaise III test survey at SORS) was conducted in October1996. In February 1997 we started with the continuos HBS.Compared with the annual Household Budget Survey, the continuos HBS was expected to have someadvantages:♦ Always current data of higher quality and lower costs♦ Better organisation of the fieldwork and methodology of the survey because of the continuity♦ Better trained and experienced interviewers♦ More detailed results, derived from more subsequent years aggregated dataThe main questionnaire is divided into two parts and interviewers visit each household twice. At the firstvisit, the first part is asked and the diaries (two types on paper forms, recording period 14 days) areexplained. After two weeks the second part of the main questionnaire is entered and the completed diariesare collected.

93
3. The survey application design
From developer's point of view, the main problem with the Household Budget Survey was lack of time forapplication development. HBS is one of the most complex surveys: paper questionnaire consists of 72pages and over 3,000 possible fields to be entered. The final version (February 1997) of the CAPI Blaiseinstrument consisted of 98 screens, mainly tables. But there were only about four weeks and one personavailable to develop the Blaise instrument, together with the entire case management.Processing of the HBS main questionnaire data is completely independent from processing of diaries. Themain questionnaire is processed in Blaise III as a multi-mode survey: there are 22 interviewers withlaptops, using CAPI instrument and 4 data entrists, entering data from paper forms (PAPI/CADI). Aftercoding of PAPI/CADI data (CAPI data are coded by interviewers), all data files are combined into one fileand sent to SAS system for further processing.CADI application for diary processing is still a Blaise 2.5 application. Coding is the most important part ofit, so all three available types of coding are enabled: alphabetical, hierarchical and trigram.
If we wanted to follow the terms and to realise the education for interviewers, the application had to beinstalled to the laptops on the same day the last question was coded into Blaise language. So absolutely notime for testing was available. Furthermore, due to lack of time only the most important edits wereincluded in the first production version of the Blaise instrument.First small errors were discovered and removed already on the first day of interviewer's training. Since thesecond training day was a week later, time was used to improve and re-install the application andinterviewer's interface. The interviewers were expected to start data collection and editing immediatelyafter the second meeting, so that should be the final version.But some more errors were found after the second installation, mainly not very important for datacollection and editing (e.g. some unnecessary questions with an "empty" attribute were on the route). Moreimportant was the absence of some edits, which should be performed during the interview, but were notincluded in the first production version. Interviewers could start their job in time, but it was reallynecessary to improve the data entry and editing application.After a month the HBS Blaise instrument was finally satisfactory and tested enough to preventunexpected surprises. Some questions were removed from the route and many new edits were added. Ofcourse, this changed data definition, and already collected data were not compatible with it.
4. Re-installing the survey application
When re-installing the HBS application we followed the instructions from the Blaise III Developer'sGuide. Due to some difficulties in newly established modem communications between interviewers andthe Statistical Office, we decided to send a new installation diskette to each interviewer, together withshort printed instructions.We were a little bit afraid of data conversion because of complexity of the questionnaire and especiallybecause of additional interviewer's burden. Having this in mind, we prepared the re-installation procedurevery carefully and made it as simple as possible, a real "push-one-button" solution. Interviewers were onlyasked to start the batch procedure, which installed some files and the new main interface menu, where theyhad to choose the new option called "Conversion to a new data definition". This option executed thefollowing steps:
1. Creating the OLD directory and copying the existing data files into it2. Installing the new improved survey application to a working directory3. Installing and executing of Manipula conversion setup (from old to new data definition)
94
The Manipula setup to convert data from the old to the new data definition can be generated automaticallyany time during survey processing on the basis of metadata definitions, which are always present.Therefore, the conversion procedure can be executed more than just once, if necessary. Automatic linkingof different data models is the key of the entire procedure: development of the conversion applicationwould be much too time consuming.When working, the interviewers use the new application exactly in the same way as the old one. A backupversion of old data and metadata was automatically saved in a separate directory.
Conversion to the new data model in production was quite successful. Only with two interviewersproblems occurred, mainly because they didn't exactly follow the instructions. Re-installation procedurewas developed in a such way, that it was possible to repeat it without loosing the necessary files, so alsothese problems were solved relatively fast.With the new data definition and new editing rules, some errors appeared also in previously clean recordsand the interviewers had to check all the records again. Since changes did not require another contact withalready interviewed households, it was not too hard a job.The same procedure was performed on the centralised part of the survey application, on PAPI/CADI datafiles at the Statistical Office. The old and the new data definition were the same as in CAPI instrument,and new data files from both modes of data collection were combined into one file again. New SAS setupwas produced from the new data definition and data were sent to further processing.
5. New possibilities for application developers
A unified strategy for an improved editing process starts at the design phase and ends only when the finalresults are published. The desired final result is high quality statistical information. The aspects of qualityof statistical information are accuracy, timeliness and costs6. It's not hard to conclude that the possibility ofchanging the survey design after implementation could improve especially timeliness, which usuallyaffects also the other aspects. And which benefits we can get from using this possibility? We found somefrom our experience with the HBS:♦ The survey data collection can start in time even if the data model is just roughly designed and tested♦ The subject matter people can make last corrections in survey contents even after implementation (if
really necessary)♦ Interviewer's remarks can be considered and used in the final version of the application♦ Edits can be added or removed during the survey data processing♦ Development and production of the survey can run concurrently
There are some disadvantages, too:♦ Additional interviewer's burden (even if small...)♦ Adding new fields usually means repeated interview♦ More survey administration
In case of our HBS the advantages were clearly prevailing, so this approach or a similar one will beprobably used also in some other surveys at SORS, especially when rapid application development isnecessary.
W.A.M. de Jong: Designing a Complete Edit Strategy; Combining techniques

95
The same approach was used with the 1998 Pilot Census. Like in the HBS, it was impossible to anticipateand define all the relevant edits before data entry had started. Since it was a CADI survey, data conversionbetween different models was relatively simple.
Both applications fully utilised the possibility of ASCII-relational reading blocks of data out of Blaise,which enable efficient loading of Oracle database and analysis of individual blocks of data. This isspecially important with large data models. Concerning relations to other systems, this option seems to beone of the most important improvements in Blaise (of course, we are all looking forward to ODBC inBlaise 4 Windows).
5. Conclusion
Growing needs for faster and more accurate statistical information are often in conflict with developer'spossibility to complete and test the survey application in time. With tools and methods, which enablecompleting and finalising the survey even after its implementation, some extra time could be acquired. Inmany cases only little extra time for development means the difference between interviewer's exhaustinghard work and easy, user-friendly data collection and editing. The possibility of redefining the survey afterimplementation can improve timeliness as well as the quality of collected data.
6. References
Bethlehem, J. (1995), "A Control Centre for Computer-assisted Survey Processing". Report, Voorburg:Statistics Netherlands.
De Jong, W.A.M. (1996), "Designing a Complete Edit Strategy; Combining Techniques". Research paperno. 9639, Voorburg, Statistics Netherlands.
Schou, R. (1995), "Developing a Multi-Mode Survey System". Third International Blaise Users'Conference, Helsinki.

96
TADEQ: A Tool for Analysing and Documenting ElectronicQuestionnaires
Jelke Bethlehem, Statistics Netherlands, and Tony Manners, Office for National Statistics(UK)
Introduction
National Statistical Institutes (NSIs), research institutes, and commercial marketing researchorganisations are increasingly using computer-assisted interview (CAI) systems for collectingsurvey datai. The paper questionnaire is replaced by a computer program that guides therespondent through the questionnaire and checks the answers on the spot. The growingpossibilities of computer hardware and software have made it possible to develop very large andvery complex electronic questionnaires. Unfortunately, it has become more and more difficult fordevelopers, interviewers, supervisors, and managers to keep control of the content and structureof CAI instruments. Secondary analysts of the microdata - and even some of the analysts withinthe agencies collecting data by CAI - have found it difficult to use the questionnairedocumentation, which looks completely different from the documentation they are used to (i.e.paper questionnaires). Sometimes, the CAI documentation is no more than the questionnaireprogram or a simple listing of the questions without routing information (so the user is forcedback to the program). Some CAI software packages can produce a paper questionnaire versionfor simple surveys, but the social surveys typically carried out by NSIs and research institutes aremuch larger and more complex than these can cope with. Moreover, CAI instruments can includeimportant information about the questions which paper questionnaires do not, such as edit checksand detailed interviewer instructions. This paper argues that CAI documentation ought to makeall this information available, in a range of easily accessible options, for the different types ofusers with their varying needs.
With 4th Framework funding from the European Commission, a research project has been set upunder the leadership of Statistics Netherlands (see Section 5 below) to develop a tool for human-readable presentation of the electronic questionnaire. This tool is called TADEQ (Tool for theAnalysis and Documentation of Electronic Questionnaires). The output of such a tool can serve todocument (on paper, or electronically in hypertext form) an electronic questionnaire in a human-readable way. Such a tool should not only provide a useful documentation of the contents andstructure, but also help to analyse the questionnaire, and report possible sources of problems in itsstructure.
This contribution contains a description of the TADEQ project. Section 2 gives some backgroundwith respect to the phenomenon of computer assisted interviewing. Section 3 explains theproblem of documenting electronic questionnaires. Section 4 describes the possible analysisfunctions of the proposed tool.
2? Computer assisted interviewing

97
Our complex society experiences an increasing demand for statistical information. Suchinformation enables policy makers and others to take informed decisions for a better future.Although administrative records in registers and other databases can sometimes provide therequired information, more often they cannot. In this case, the sample survey is a powerful meansto collect new information
Carrying out a survey is often a complex, costly and time-consuming process. The first step in theprocess is the survey design phase, in which the statistician specifies the population to beinvestigated, the data to be collected, and the characteristics to be estimated. Also a questionnairehas to be designed, containing the questions to be asked of the respondents. Furthermore, in thecase of a sample survey, the sampling design must be specified, and the sample must be selectedaccordingly.
The second step in the process is data collection. Traditionally, in many surveys thequestionnaires are completed in face-to-face interviews. The quality of the collected data tends tobe good. However, since it typically requires a large number of interviewers, who may all have todo much travelling, it can be expensive and time-consuming. Therefore telephone interviewing issometimes used as an alternative. However, there are limits. Telephone interviewing is notalways feasible: only connected people can be contacted, and the questionnaire should not be toolong or too complicated. A mail survey is cheaper still: no interviewers at all are needed.Questionnaires are mailed to potential respondents with the request to return the completedforms. Although reminders can be sent, the persuasive power of the interviewer is lacking, andtherefore response tends to be lower in this type of survey, and so does the quality of collecteddata.
If the data are collected by means of paper forms, completed questionnaires have to undergoextensive treatment. In order to produce high quality statistics, it is vital to remove any errors.This step is called data editing. Routing, range and consistency errors have to be detected andcorrected, but this can be very difficult if it has to be done afterwards, at the office. In manycases, particularly for household surveys, respondents cannot be contacted again, so other wayshave to be found to do something about the problem. Sometimes it is possible to determine areasonable approximation of a correct value by means of an imputation technique, but in othercases an incorrect value is replaced by the special code indicating the value is ‘missing’.
The computer has always played in important role in processing survey data. In the early days ofthe computer era, the computer was only used for sorting, tabulation, and checking. In the sixties,the computer was increasingly used for statistical analysis. The rapid development of informationtechnology in recent decades made it possible to use microcomputers for computer-assistedinterviewing (CAI). The paper questionnaire is replaced by a computer program containing thequestions to be asked. The computer takes control of the interviewing process. It performs twoimportant activities:
• Route control. The computer program determines which question is to be asked next anddisplays that question on the screen. Such a decision may depend on the answers to previousquestions. Hence it relieves the interviewer of the task of taking care of the correct routethrough the questionnaire. As a result, it is not possible anymore to make route errors.

98
• Error checking. The computer program checks the answers to the questions which are entered.If an error is detected, the program gives a warning and one or more of the answers concernedcan be modified. The program will not proceed to the next question until all detected errorshave been corrected.
Application of computer-assisted data collection has three major advantages. In the first place itsimplifies the work of interviewer (no more route control), in the second place it improves thequality of the collected data, and in the third place data is entered in the computer during theinterview resulting in a clean record, so no more subsequent data entry and data editing isnecessary.
The first mode of interviewing for which computers were used, was Computer AssistedTelephone Interviewing (CATI). This is a form of telephone interviewing in which the computerselects the proper question to be answered. This question is displayed on the computer screen,and thus can be asked by the interviewer. The answer is typed in and the computer checks it forrange errors and consistency errors. If an error is detected, the computer warns the interviewerthat something is wrong, and corrections can be made.
A more recent technique is Computer Assisted Personal Interviewing (CAPI). It is a form of face-to-face interviewing in which interviewers use a small laptop computer to ask the questions andto record the answers, instead of the traditional paper form. It is like CATI except thatinterviewers equipped with laptops visit respondents, usually at their home addresses. The laptopscommunicate with the central office by telephone, sending completed interviews and other dataabout the sample and receiving new CAPI instruments, new addresses, email and other electronicitems.
Mail surveys are also becoming more and more automated. This form of computer assistedinterviewing is called Computer Assisted Self Interviewing (CASI). In a CASI survey, theelectronic questionnaire is sent to the respondents (on diskette, or by modem). The respondentsrun the interview program on their own computers, answer the questions, and the data is sentback in the same way it came.
CATI, CAPI and CASI are the main forms of CAI. New varieties are constantly underdevelopment, such as CASI via the Internet and audio-CASIii.
There are related forms of electronic data collection, such as Electronic Data Interchange (EDI)and passive observation methods such as linking supermarket bills with personal information onloyalty cards. This paper, like the project it describes, is confined to electronic data collectionwhere the data to be collected do not already exist in accessible electronic form, i.e. where someform of interview or self-interview is required to obtain the information.
The growing possibilities of computer hardware and software have made it possible to developvery large and very complex electronic questionnaires. It is not uncommon for electronicquestionnaires to have thousands of questions, although only a sub-set will apply to any particularrespondent. Routing structures and filter questions see to it that respondents are only askedrelevant questions for the particular sub-population to which they belong. Another aspect of

99
complexity concerns the structure of the instrument. Many survey questionnaires are of ahierarchical nature. A relatively simple but common example is a health survey, with questions atthe household level, then at the level of each member of the household. Within each person theremay be questions for each medical problem or each visit to the doctor.
Due to the increasing size and complexity of electronic questionnaires, it has become more andmore difficult for developers, users and managers to keep control of their content and structure.Although several computer assisted interviewing systems have high level authoring languages tospecify questionnaires, it takes a substantial amount of knowledge and experience to understandlarge and complex questionnaires. It has become more and more difficult to comprehendelectronic questionnaires in their entirety, and to understand the process that leads to responses toeach of the questions as they ultimately appear on data files.
This raises the question of the feasibility of a tool to represent the content and logic of anelectronic questionnaire in a human-readable way. Such a tool should not only provide a usefuldocumentation, but also help to analyse the questionnaire, and report possible sources ofproblems.
2? ? Documenting electronic questionnaires
When surveys were conducted with paper questionnaires, there was no need for separatedocumentation of questions and routing. Interviewers' instructions and edit checks carried out inthe office were usually available in separate documents, though if these were computer programsthey tended to be even less readable than CAI programs. Nevertheless, the paper questionnaire,developed for the interviewer’s use, contained all the information available about the questions.Routing instructions were kept simple, in order to allow the interviewers to process the skipinstructions themselves.
Computer assisted interviewing brought about two changes: the paper document was replaced bya computer program, and it became possible to implement more complex route logic. So, datacollection instruments are more complex, and there is less documentation to understand them.
In the early days of computer assisted interviewing, when electronic questionnaires weredeveloped for computers of limited memory size and speed, it was still possible to producedocumentation by hand. There are ample examples of hand-made flow charts. The recentdevelopments in information technology have made it possible to create such large and complexquestionnaires that the cost of creating and maintaining documentation by hand has becomeprohibitive.
An additional problem of manual documentation is that it can be a source of errors. Whatevermeans are used to express the contents and logic of the questionnaire in a way accessible to abroad group of users, the information is conveyed in a form essentially different form theauthoring language of the CAI system. Human translators only can perform their documentationtask if they completely understand the electronic questionnaire specification. This is a subjectiveand error-prone task. Subtle errors are easily introduced. Moreover, it is difficult in practice toensure that updates to the CAI program are carried over into the documentation, particularly as

100
these updates tend to be made under extreme time pressures. The errors from manual translationwill usually go by unnoticed, causing the user of the documentation to form an erroneous picture.
Consistent and error-free documentation can only be obtained if it is generated automatically. Allinformation about the content and structure is in essence available in the electronic questionnaire.What is needed is a software tool capable of automatically translating this questionnairespecification into a human-readable format.
4? ? A documentation tool
A documentation tool for electronic questionnaire should be able to produce human-readabledocumentation both in paper and electronic form. On the one hand, this tool must be able to makeclear what the global structure of the questionnaire is, and on the other, it must provide means tofocus on the details of parts of the questionnaire.
The global structure of the questionnaire can be represented by a routing graph. This is a graph inwhich each vertex represents a question, and each edge a possible transition to a next question.The challenge of the project is to display the routing graph of large and complex questionnaires.Due to the limited size of a sheet of paper and a computer screen, this is not a simple task. It mustbe accomplished without affecting the readability. It means a lot of attention has to be paid tolayout issues.
The documentation of the questionnaire will be used by different kinds of people involved in thesurvey process. For many of them, the documentation will need to be in a more accessible formthan even the highest level CAI language can provide. Examples of the different types of usersinclude:
• The questionnaire developer, who wants accessible documentation for a variety or reasons,such as the important role it may play in independent testing that the CAI program meets theoriginal specification (it may be cost-effective to employ for this testing staff who lack theskills to understand the CAI program). Proper documentation may also reduce the efforts tobe spent on subsequent versions of the survey.
• The customers and managers who have to give formal approval for carrying out the survey. Itis not surprising that customers and managers, while welcoming the cost-effectiveness of thetransition to CAI, have often expressed their concern at the disappearance of the paperquestionnaire. They perceive the paper questionnaire as a readily accessible means tounderstand what is going in the survey, and are dismayed by the absence of an acceptablesubstitute in CAI systems.
• The interviewers. It can be difficult for interviewers to get an overall picture of the interviewand all its possible routes from running the CAI instrument. A paper document of thequestionnaire can be of great help in the interviewer's preparation for fieldwork.

101
• The data analysts, who need a well-documented codebook if they are to work efficiently.Before CAI, the paper questionnaire was usually the starting point for producing such acodebook.
Different users may require different formats of the questionnaire documentation. Customers andsenior managers may wish to concentrate on the questions asked, without getting lost in the detailof the edit checks and interviewers' instructions. Other users, such as secondary analysts workingon the microdata, may need more detail. The same users may need more than one format: forexample, interviewers may need a summary view of the main topics and their order in theinterview and also a detailed listing of the questions. So, the proposed documentation tool mustbe flexible. The users of this tool must have some control on adjusting the documentation.Research must show what is required and by whom.
The documentation tool must not only display the routing graph, but also additional information.Since each vertex of the routing graph corresponds to a question, information about the questioncan be display closed to each vertex. Depending on the CAI system used, all kinds of questioninformation can be displayed: the identification of the questions, the text of the question (possiblyin different languages), the specification of the type of accepted answers, etc. The availableamount of space in the graph is too limited to display all this information. Moreover it mightaffect readability. Therefore, a documentation tool must provide the means to select theinformation shown, and possibly also means to display information in different ways, e.g.adjacent to the graph.
The same problems apply to the routing information. It is important to display the conditionsdetermining transitions from one question to another. Such conditions may be quite complex.Solutions have to be found to show this information without affecting readability andinterpretability.
A questionnaire documentation tools must be able to generate output in at least two differentformats:
• Paper documentation. This is static documentation. Once printed it is not possible any more tomanipulate the information. The challenge of the paper format is that two, almost conflicting,goals must achieved. On the one hand, it must be able to show the global structure of thequestionnaire in a simple way without being distracted by a wealth of detailed information. Onthe other, the user must be able to find detailed information about a specific question or routeinstruction.
• Electronic documentation. Although the small size of a computer screen causes even morelimitations then a piece of paper, electronic documentation has the advantage that it can bedynamic. It provides possibilities like zooming in to specific parts of the questionnaire,clicking on vertices or edges to obtain more information, and using hypertext techniques tonavigate through the documentation.
A tool for the automatic documentation of electronic questionnaires must obtain its informationabout the questionnaire from the CAI system used to design the questionnaire. There are several

102
general CAI systems in use in the world. Examples are Autoquest, Blaise and Cases. Each ofthese systems uses a different authoring language. Therefore, it is difficult to build adocumentation tool capable of reading electronic questionnaire definitions of any CAI system. Tosolve this problem, a two-step procedure is proposed.
The first step is to design a neutral file format for the documentation tool. The file structureshould be such that all information required for documenting the questionnaire is contained in thefile. So, it must contain information about both the questions and the routing. The documentationtool will acquire its information from this type of file.
The second step is to create conversion tools for CAI systems. It depends on the structure of thequestionnaire specification of the CAI system how complex this job is. Within the framework ofthis project it is proposed to develop a prototype of one such tool. It is the conversion tool for theBlaise system. The reasons for this choice are that there is extensive Blaise knowledge among theparticipants in this project, and moreover, the use of Blaise is widespread among the memberstates of the EU.
4? ? A diagnostic tool for analysing the CAI instrument
A tool like the one described in the previous section could have much more potential then justdocumenting a questionnaire. It could also play an important role as an instrument to measure thequality and performance of the questionnaire. As a diagnostic instrument, it could be used in thedesign process. The tool can provide information like
• The number of different possible routes through the questionnaire• Longest route, shortest route, average route• The conditions under which specific questions are answered
The last item in the list may provide particularly useful information. It helps to make clearwhether questions are indeed answered by the intended respondents. It may also show errors inthe questionnaire design, like routes that never will be followed, and questions that will never beanswered.
There can also be a role for the documentation tool after the fieldwork has been completed. Thetool's importance to data analysts has already been mentioned. One example of a new kind ofway that the tool could help analysts to check their data quickly (as an improved way ofexamining frequencies) could be to compute how many respondents followed certain edges in theroutings graphs. Such information can be represented in a numerical way, but also in a graphicalway (e.g. by taking the width of the line in the graph proportional to the number of trespassers).
In view of the interesting possibilities, it is proposed to extend the documentation tool withdiagnostic functions for analysing the CAI instrument. Hence, it becomes a Tool for Analysis andDocumentation of Electronic Questionnaires. The acronym TADEQ will be used for this tool.

103
5. The project
The TADEQ project is being carried out by a consortium consisting of five partners. The main contractor isStatistics Netherlands. The second partner is the Max Planck Institute in Saarbrücken in Germany. It will beresponsible for providing the necessary mathematical knowledge and experience in handling, analysing, anddisplaying graph-like structures. It is expected to deliver software modules required for graphicallydisplaying the routing structure of an electronic questionnaire. The third partner is the Office for NationalStatistics in the United Kingdom. This national statistical institute is long time user of CAI techniques. Withthe help of Statistics Netherlands, it has produced a Blaise Automatic Documentation tool which goes partof the way to answer users' needs; however, much remains to be done. Also, ONS has many contacts withCAI users in Europe and elsewhere in the world. It will be responsible for surveying and defining userrequirements, and will co-ordinate evaluation and testing of prototypes. The fourth partner is StatisticsFinland. This national statistical institute has substantial experience with CAI techniques, and thedevelopment of CAI management systems. Statistics Finland will contribute user requirements and testprototypes. The fifth partner is Instituto Nacional de Estatística in Portugal. This national statistical institutehas experience in using CAI for major surveys. It also participates in other European projects in the field ofautomated data collection (EDI).
To create the TADEQ, a stepwise approach has been implemented:
1? Evaluation of user’s experiences and wishes with respect to documentation of electronicquestionnaire. This means consultation with several users of CAI systems in Europe.
2? ? Development of the TADEQ neutral file format. A number of major CAI packages will beevaluated in order to make an inventory of what they produce with respect to question androute information.
3? Development of a module capable of producing paper documentation. Initial exploration hasshown that this function has priority. A key requirement of Blaise users, particularly the largecorporate licence holders, has been for rapid development of a means for producing paperdocumentation automatically. Early development of a prototype within the TADEQ projectwill be an efficient means to meet this need and avoid the requirement for a separate project toprovide a short-term solution.
1? Development of a module capable of producing electronic documentation.
2? Incorporating analysis functions.
It is important that users of the CAI are involved in the development process. At some points aselection of users will be offered prototypes for evaluation purposes. Their comments andremarks will be taken care of in the subsequent phases of the development process. The projectaims for a prototype to be available for testing by the end of the millennium.

104
SSeeccttiioonn DD.. CCaassee--ssttuuddiieess ooff BBllaaiissee ssuurrvveeyyss
Redesign Labour Force Survey: Statistics Netherlands 1998
Marien Lina, Statistics Netherlands
Methodological design
Sampling methodology: Kees van Berkel
Questionnaire design: Wieneke Groot
Technical design
Blaise implementation: Marien Lina
Panel system/Maniplus: Henk Fuchs
Credits
Cornelis van Bochove, Annemarie Boelen, Piet Boersma, Jo Bogman, The Blaise Development Team,
Tom Boves, Paul Bracke, Frans Brouns, The GEP Help Desk, Bert Geurts, Anja van de Graaf, The
Interviewer teams, Catrien Jacobi, Frans Kerssemakers, Cor Kragt, Isje Kuijpers, Jo van de Laarschot,
Lydia Leers, Ron Lemmens, Annemiek Luijten, Mirjam Janssen, Ren‚ Nijman, Arno Plucinski, Jo
Ploum, Piet Prak, Marielle Reemers, Wilfred Riksen, Jos Schiepers, Hub Schings, Ger Sleijpen, Edith
Schobben, Jo Thomas, Jaques Thijssen, Johan van der Valk, Heleen Voogdt, Mariette Vosmer and
Willem Wetzels
Contents:
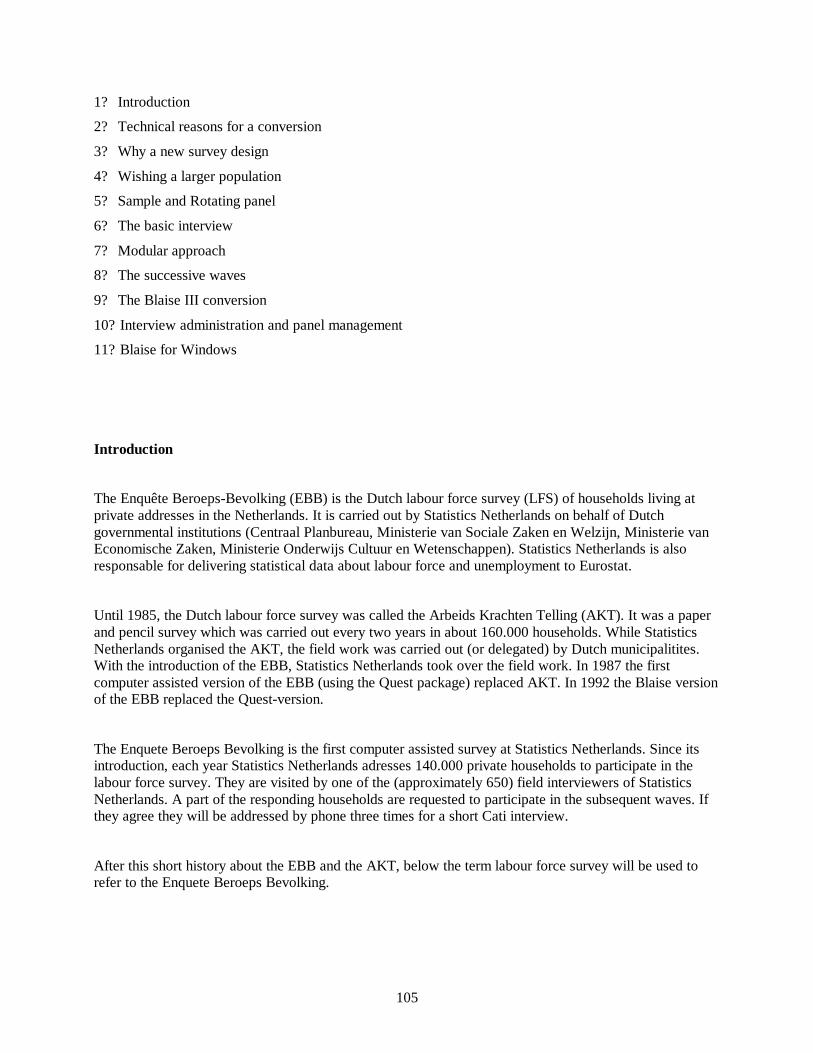
105
1? Introduction
2? Technical reasons for a conversion
3? Why a new survey design
4? Wishing a larger population
5? Sample and Rotating panel
6? The basic interview
7? Modular approach
8? The successive waves
9? The Blaise III conversion
10? Interview administration and panel management
11? Blaise for Windows
Introduction
The Enquête Beroeps-Bevolking (EBB) is the Dutch labour force survey (LFS) of households living atprivate addresses in the Netherlands. It is carried out by Statistics Netherlands on behalf of Dutchgovernmental institutions (Centraal Planbureau, Ministerie van Sociale Zaken en Welzijn, Ministerie vanEconomische Zaken, Ministerie Onderwijs Cultuur en Wetenschappen). Statistics Netherlands is alsoresponsable for delivering statistical data about labour force and unemployment to Eurostat.
Until 1985, the Dutch labour force survey was called the Arbeids Krachten Telling (AKT). It was a paperand pencil survey which was carried out every two years in about 160.000 households. While StatisticsNetherlands organised the AKT, the field work was carried out (or delegated) by Dutch municipalitites.With the introduction of the EBB, Statistics Netherlands took over the field work. In 1987 the firstcomputer assisted version of the EBB (using the Quest package) replaced AKT. In 1992 the Blaise versionof the EBB replaced the Quest-version.
The Enquete Beroeps Bevolking is the first computer assisted survey at Statistics Netherlands. Since itsintroduction, each year Statistics Netherlands adresses 140.000 private households to participate in thelabour force survey. They are visited by one of the (approximately 650) field interviewers of StatisticsNetherlands. A part of the responding households are requested to participate in the subsequent waves. Ifthey agree they will be addressed by phone three times for a short Cati interview.
After this short history about the EBB and the AKT, below the term labour force survey will be used torefer to the Enquete Beroeps Bevolking.

106
Technical reasons for a conversion.
There were two main reasons to adapt the labour force survey thoroughly. Firstly, technical developments(the development of Blaise III) asks for more than a one-to-one conversion. Blaise III offers moresophisticated development options, enabling a larger and more complex survey design. Secondly, the needfor more information asked to combine the conversion with a complete redesign.
This second reason explains why Statistics Netherlands has waited some time to convert the labour forcesurvey from Blaise 2.5 to Blaise III. The labour force survey-version in Blaise 2.5 is still active for datacollection. Currently, the revised field edition in Blaise III has been converted successfully. At thismoment this version is tested in a field experiment.
However, there may have been some resistance to switch to Blaise III. Interviewers are used to the oldversion. To a large extent, the Blaise 2.5 version of the labour force survey does what it is supposed to do,and to some extend it was feared that the creation of a new measurement instrument could have causedbias in the unemployment figures. These and other problems still cause a delay in the implementation ofthe new version of the labour force survey as soon as possible. However, the technical reasons for theconversion have become more and more urgent. Blaise 2.5 does not meet the requirements of the currentnetwork under Windows NT at Statistics Netherlands.
The conversion means a complete system change. The CAPI-interview had to be made suitable for BlaiseIII. A first one-to-one conversion proved to result in an unworkable version. To face this problem, atechnical redesign was necessary. As Blaise III enables to call a block (or field) on different places in theroute, similar blocks in the Blaise 2.5 version could be reduced to one block (or field). The old versioncontained much of these similar blocks. Using a modular approach the model of the revised labour forcesurvey became much more transparant.
The purpose of such a conversion is not restricted to take advantage of the technical features of Blaise III.The policy of Statistics Netherlands is directed towards a situation in which all surveys are integrated inone system. This policy asks for the conversion of the labour force survey. As the extensive POLS (LifeSituation Survey) interview is readily available as a Blaise III interview, the same is desirable for thelabour force survey. Using the same Blaise version for all surveys at Statistics Netherlands facilitates theorganisation of the statistical production process.
The wish to integrate the surveys is not restricted to the Blaise version for the Capi and Cati interviewapplication. All surrounding systems are part of the statistical process. When it comes to datacommunication procedures, panel management, mixed-mode management, Capi- and Cati-administrations, payment administration for interviewers and coding procedures, the mentioned policyasks identical systems for all surveys at Statistics Netherlands. Also, hardware and system requirementsfor laptops in the field should be uniform for all surveys.
When it became clear that the Blaise III conversion implied more than a simple conversion this madestatisticians start to think of a complete new survey design.
107
Why a new survey design
The reasons for a new survey design are not surprising. The information requests on developments inemployment and unemployment are rapidly increasing. The main users of statistics in this field in theNetherlands (Centraal Planbureau and Ministerie van Sociale Zaken en Welzijn) and the EuropeanStatistical office Eurostat require labour and unemployment figures each quarter of the year. This does notonly imply the addition of new topics and questions in the interview, but also an increase in the number ofdesired responses.
Changing the number of CAPI and CATI interviews within the acceptable level of expenses made it
possible to increase reliability and precision of data by changing the population size and the number ofwaves.
While on the one hand there is a wish to extend the survey with relevant new sources of information, onthe other hand the economical principle asks to avoid gathering redundant and unused data. In practice,over the years, a survey tends to grow larger and larger. Each small revision may lead to an increase ofgathered information. It is seldom heard that the statistical department asks to stop gathering certaininformation. In the redesign project, an evaluation has been organised to check whether it may be better tostop asking certain redundant questions and to put an end to gathering useless and unused information.
The conclusion is the conversion and redesign served more than one purpose. Technical reasons,uniformity of applications, the need for more information and the need to keep it simple and avoid uselessdata gathering are some of the ingredients for the discussions about the revision at Statistics Netherlands.
The project team consists of engineers from various departments and different disciplines. Differentobjectives between disciplines and departments means a risk. While running the project, the mainobjective was to keep the overall aim of the project in mind.
Wishing a larger population
The redesign did not only affect the content of the questionnaire. Also the sampling method has beenreconsidered. As well Eurostat as Dutch user's of labour statistics asked for higher levels of reliability.
The sample population of the Labour Force Survey in the Netherlands is a random part of its inhabitorsaged 16 years or older. For sub-populations consisting of about 5% of the entire sample, Eurostat wishesto keep the relative standard error of the estimator of the mean value in a year on Nuts-II level below 8%.The precision still has to be better for statistical figures on the national level. The relative standard error ofthe estimator of the difference of two successive quarterly figures on national level may not be more than3% (1.5% for countries with a population larger than 20 million).
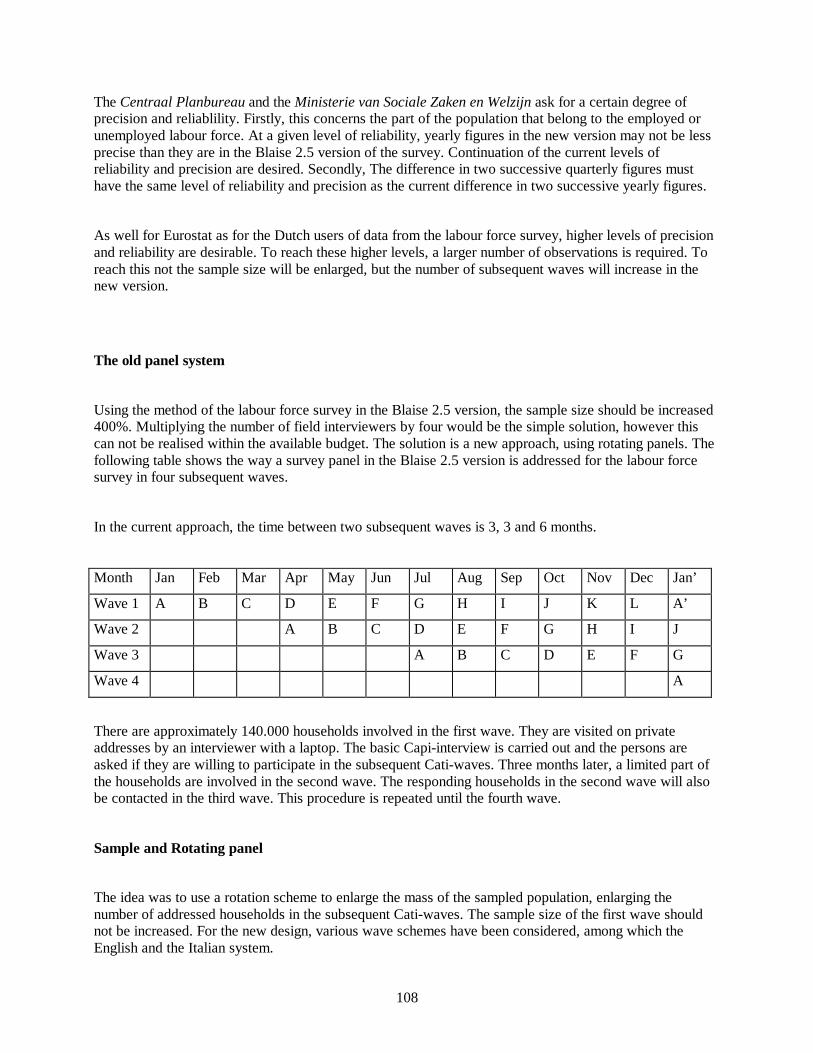
108
The Centraal Planbureau and the Ministerie van Sociale Zaken en Welzijn ask for a certain degree ofprecision and reliablility. Firstly, this concerns the part of the population that belong to the employed orunemployed labour force. At a given level of reliability, yearly figures in the new version may not be lessprecise than they are in the Blaise 2.5 version of the survey. Continuation of the current levels ofreliability and precision are desired. Secondly, The difference in two successive quarterly figures musthave the same level of reliability and precision as the current difference in two successive yearly figures.
As well for Eurostat as for the Dutch users of data from the labour force survey, higher levels of precisionand reliability are desirable. To reach these higher levels, a larger number of observations is required. Toreach this not the sample size will be enlarged, but the number of subsequent waves will increase in thenew version.
The old panel system
Using the method of the labour force survey in the Blaise 2.5 version, the sample size should be increased400%. Multiplying the number of field interviewers by four would be the simple solution, however thiscan not be realised within the available budget. The solution is a new approach, using rotating panels. Thefollowing table shows the way a survey panel in the Blaise 2.5 version is addressed for the labour forcesurvey in four subsequent waves.
In the current approach, the time between two subsequent waves is 3, 3 and 6 months.
Month Jan Feb Mar Apr May Jun Jul Aug Sep Oct Nov Dec Jan’
Wave 1 A B C D E F G H I J K L A’
Wave 2 A B C D E F G H I J
Wave 3 A B C D E F G
Wave 4 A
There are approximately 140.000 households involved in the first wave. They are visited on privateaddresses by an interviewer with a laptop. The basic Capi-interview is carried out and the persons areasked if they are willing to participate in the subsequent Cati-waves. Three months later, a limited part ofthe households are involved in the second wave. The responding households in the second wave will alsobe contacted in the third wave. This procedure is repeated until the fourth wave.
Sample and Rotating panel
The idea was to use a rotation scheme to enlarge the mass of the sampled population, enlarging thenumber of addressed households in the subsequent Cati-waves. The sample size of the first wave shouldnot be increased. For the new design, various wave schemes have been considered, among which theEnglish and the Italian system.

109
Considered Wave Schemes for the Labour Force Survey.
Country N of Waves
Quarters
K K+1 K+2 K+3 K+4 K+5 K+6
English (GB) 5 ? ? ? ? ?
Italian (I) 4 ? ? - - ? ?
Dutch (NL) 4 ? ? ? - ?
English-plus (GB+) 6 ? ? ? ? ? ?
Italian-plus (I+) 6 ? ? ? - ? ? ?
Dutch-plus (NL+) 5 ? ? ? - ? ?
Most of the wave schemes show one or more periods in which no field work is carried out. At first sight,the English system in which over a period of one year the panel is addressed every quarter of a yearappears to be the simplest and most practical scheme, not only for the analysis, but also for theorganisation of panel management.
Sample and Rotating panel
The revised labour force survey in the Netherlands will use the first scheme: 5 quarterly waves for theentire sample population. Each month the current situation of an approximately constant proportion of theDutch population can be compared with the situation of the same proportion three months before.
In global terms this results in a situation where:
? There is a minimum number of waves that meets reliability demands
? There is a maximum number of cases in first wave
? It is an elegant and user-friendly method
A note about two sources for trend figures
In 1998 and 1999 the second, third and fourth wave will not been carried out. The wave-system enables tofollow the factual situation of persons over some time. Within the labour force survey, also a retrospectivepart (the Retro) is present which asks about previous jobs. In fact these are two methods with the sameobjective: to measure individual changes.

110
Despite the fact that a measurement on a certain moment (during the follow-up waves) would be moreprecise, this retrospective supplies information of the job situation of a longer period. Organisationalproblems made it necessary to skip the Cati-waves for 1998 and 1999.
In the Blaise III design of the labour force survey, the intention was to discard the retro. However, theintended wave schemes have not yet been implemented. Before the wave scheme is implemented, theRetro will stay active in the labour force survey. The current idea is to omit the Retro as soon as the panelsystem has been proven to be successful.
The organisation of the changed Capi interview
The basic interview (the first wave) is a Capi interface during a household visit. For the field interviewersand the organisation of the field work the procedures will not change radically. Yearly, changes and
preparations of the questionnaire are followed by interviewer instructions and training. For the newsurvey, another type of datacom will be used by the interviewer. The interviewers already know this kindof datacom-interface from the POLS-survey.
Like the old labour force survey, each month a sample will be installed on the field-laptops by datacomand the administration of the year-sample will be up-dated. The interviewers receive announcement lettersby mail. They forward them to the addresses printed in these letters. After announcing the interview in thisway, the interviewer visits these addresses. All the organisational aspects for the field interviewers are thesame as in the Blaise 2.5 version.
One household interview takes usually about 28 minutes. Also here there is no change in comparison withthe previous version, which lasted about 25 minutes. If the Retro will be descarded in the future, theamount of time may be decreased to less than 20 minutes. The mean household size is about 2 persons.Within each household up to 8 individuals may be interviewed. In the previous version the maximumnumber of persons to be interviewed was 4. Known that the percentage of households larger than 4persons is quite low, this will not drastically modify the mean interview time. At the end of the interviewthe respondent will be asked to participate in subsequent waves (CATI). If nobody answered the doorbell,or for any other reason a non-response is scored, the interviewer fills out an electronical visit report. Afterreturning home the interviewer mails the data from the laptop to Statistics Netherlands by standarddatacom-procedures.
If the interview period of one month is expired the received data, after adding codes for example foreducations and economic activities, the Division Data Collection transfers data to the Statistical analists.Non-response figures and field reports are prepared. After that the Cati-system for subsequent waves canbe prepared.
111
An important condition
When producing statistics, the most horrible nightmare is an unexpected disturbance in statistical trends.This is what may happen when a new measurement instrument is developed. This formalised the basiccondition for the new version of labour force survey version: The main routing of the questions and thecontents of the literal questions should not be changed unnecessarily. This principle has been used asstarting point in the discussions of all sub-projects in which separate blocks from the old version wereanalysed before designing the new modules.
Modular approach CAPI interview
Different topics of the interview have been developed in separate modules. All modules were developed inBlaise III from scratch. In the first wave the following modules have been implemented:
Household box
Ethnical background
Proxi
Labour field
Position at work
Status of labour-contract (structural / temporarily)
Hours per week
Free days per year (holidays / days of)
Illness
Overtime work
Working-hours
Traffic home-work-home
Private enterprise
Occupation / Profession
Labour conditions
Seeking employment
Retro (Previous jobs)
Education
Retirement / pension
Employment bureau
Membership trade union
Free time / leisure activities
Volunteer jobs
Social position

112
Mobility
Willingness to participate in the next waves
Most of these blocks also appeared in the previous version of the labour force survey. Nevertheless therewere some changes.
Changes in the Capi-Interview:
Compared to the Blaise 2.5 version, the main changes in the Capi interview are the following:
? Module social position has been changed and now is one of the last blocks in the interview.
? Module labour searching has been added
? Module about working-hours has been changed
? The module about unemployment benefits has been omitted. The future possibility of using secondarydata from unemployment registrations made it possible to decide this.
? As already mentioned before: the maximum number of individuals in the household that wereinvolved in the Blaise 2.5 version was 4. Now this maximum number is 8.
Changes in the subsequent waves:
Compared to the old version the quality of feed back from the first wave is enhanced. In the new version,information about more than one job will be passed from wave to wave. In the old version only the nameof the first job was passed from wave to wave. This kind of information transfer has been increased in thenew version.
Another change is that the mean duration of the Cati interview has been reduced to approx. 6 minutes. Thenumber of included modules in the Cati-interview is less than in the old version.
Within the modules of the Cati-interview, alternative routes have been used which are shorter than in theCapi interview. The modules are the same as in the Capi-interview. This route is controlled by importparameters. An overview of the used modules in the Cati version:
Modular approach CAPI interview
Household box
Proxi

113
Labour / fields of activity
Position at work
Labour-contract (structural / temporarily / other)
Hours per week
Private enterprise
Occupation / Profession
Seeking employment
Education
What not has been changed is the drop out handling. If a household does not respond in one of the waves,it will be discarded from the population in the subsequent waves. Hence, temporary drop out in just onewave is impossible.
Blaise III 'Conversion'
The Blaise III conversion was not a real conversion, but merely the development of a new complexquestionnaire. Schemes were developed from scratch. These schemes formed the starting point for thedevelopment of the new Blaise interview. Each module has been developed as an independent unit. Allinformation between modules is passed using import and export modules. Each module could be testedindependently.
Panel management and integration of interview administrations.
At this moment still a crucial bridge lies ahead: completing the system for panel management andinterview administration. In this system, the extensive Pols interview and the labour force survey will bejoined with all other surveys that (structurally) take place in the division of data collection at StatisticsNetherlands. The impact of this part of the project was underestimated in the planning. This may result ina delay for the moment the new version will be in the field.
Measuring the instrument effects

114
While the labour force survey has been developed from scratch, still many parts are identical to theprevious version. Nevertheless the new version is a new measurement instrument. Despite the aim tomeasure the same, the structural responses in the new version may unwillingly deviate from the oldversion. This is why the old and new version will be together in the field for at least half a year. Accordingto the current planning this parallel interviewing will take place from March until December 1999.
Blaise for Windows
At Statistic Netherlands, Windows has been installed on every site. Also the new laptops will run underWindows. MS-DOS-applications appear not to run as they should on the available platforms. This is whyit is a general policy at Statistics Netherlands to make DOS-applications disappear.
The Blaise III version has been developed in Blaise III in the MS-Dos environment. Despite the fact thatsome typical layout differences between MS-DOS and Window layout characteristics ask for someadaptations of the questionnaires, this version runs immediately in Blaise 4W and the Windows versionapperas to be stable enough for production.
It may well be possible that no Blaise III version of the labour force survey will ever be in the field forproduction, and that the switch will be made directly from Blaise 2.5 to Blaise 4W.
115
The 1997 Census of Agriculture Experience at NASS
Roger Schou and Asa Manning, National Agricultural Statistics Service (USA)
Introduction
The Census of Agriculture is conducted every five years for the years ending in two or seven. Soin the decade of the 90's, the Census years would be for 1992 and 1997. Through the1992Census, the Bureau of Census of the Department of Commerce was responsible for every survey.However, as the budget for Commerce was reduced during the mid-90's, funding for the Censusof Agriculture was eliminated. This left the 1997 Census in jeopardy, but opened the door for theUnited States Department of Agriculture and specifically, the National Agricultural StatisticsService (NASS) to step in. Since NASS is responsible for every other federal government surveyrelated to agriculture, the agency has always hoped someday to be able to “complete” its missionand assume responsibility for the Census of Agriculture. NASS approached congress about theCensus being transferred to NASS. This was officially done prior to the 1997 Census ofAgriculture.
Although NASS had a goal in its mission statement to assume responsibility for the Census ofAgriculture in the future, the timing of the transfer presented a daunting task. Not only did thetransfer happen quickly, but the 1997 Census of Agriculture was right around the corner.Planning for taking over the Census began during 1996. At that time, the mailing of the Censusquestionnaires was less than 18 months away. Not only was the timing tight, but the scope of thejob ahead dwarfed any survey NASS had ever done. The Census of Agriculture attempts tocollect data on every farm in the United States. A sample of 50,000 would be large by typicalNASS standards, so attempting to gain a response from slightly less than two million farms in theU.S. was certainly a challenging task.
The Bureau of Census is essentially a centralized agency. Except for a large mailing facility inJeffersonville, Indiana and CATI calling centers in Arizona, Maryland, and Indiana, all the staffassigned to the Agricultural Division, work in Suitland, Maryland, a suburb of Washington, D.C.In the past, almost all the staff assigned to work on the Census was located in either Suitland orJeffersonville. When the responsibility for the Census was transferred to NASS, all staff in thatdivision were given the option to transfer to NASS as well. A majority of the staff did transfer.That staff played a major role in educating the staff in NASS about conducting a Census ofAgriculture survey, and served as the coordinators for the Census effort.
NASS is much more distributed with over half of our staff located in 45 field offices locatedaround the country. As NASS planned for the Census, it wanted to take advantage of the localagricultural expertise of our field offices, but also had to tap the talents and experience of the stafffrom the Bureau, who had been involved in the prior Censuses.

116
Large Samples and Limited Time Frames
Another limiting factor was the tight time frame. The planning for the 1997 Census ofAgriculture had been under way for about three years before NASS got involved. With such ashort time frame available before the start of the Census, NASS was limited in what could bechanged.
The Bureau of Census maintains a large facility in Jeffersonville, Indiana for handling very largevolumes of questionnaires. NASS has nothing to compare to that infrastructure and it wasdecided that NASS would contract the big “paper shuffling” tasks back to the Bureau of Census.This would include questionnaire mailing, receiving and checking in the returned questionnaires,and capturing the data from those questionnaires.
The following random facts will help illustrate just how “much paper” was handled by theJeffersonville facility for the 1997 Census of Agriculture.
First mailing 3.2 million questionnairesSecond mailing 1.3 million questionnairesThird mailing 0.8 million questionnairesReturns 2.7 million questionnaires (86.0 %)
Peak number of Jeffersonville staff 292Peak number of data entry staff 126Avg. questionnaires keyed/week 88,000
Total pieces of printed material 15.2 million
NASS decided to move certain data collection functions to the field offices. All follow-up foroperations that did not respond by mail would be handled there. Some contacts were handled inperson. However, a significant amount of data was collected by Blaise CATI. Whereas CATIwas handled in the Bureau calling centers in 1992, when we looked at our options for 1997, thepotential offered by our field offices in combination with the Blaise software were seen asdefinite strengths.
Once the decision was made to conduct the CATI work for the Census in the field offices, it wasimperative that the local area network hardware be upgraded. NASS purchased two new Dell fileservers for each field office. Additional Pentium workstations were purchased in order to assurethat the low end workstation for CATI was at least a 486-33. In reality, for evening calling mostinterviewers would have Pentium workstations available.
The processes that followed editing, from analysis to publication were largely handled in the fieldoffices, where the local expertise was most valuable. After all, these offices have a knowledge ofthe agriculture in their state that could never be equaled by the staff in HQ. Even here, theBureau’s computer systems in place for analysis and publication were used by NASS.Developing new systems was out of the question, due to time constraints. Essentially, the NASSstaff was trained to work with the centralized Bureau processing systems. The NASS wide area
117
network was used to provide critical communication links between the Bureau computers and thefield offices.
The following table provides some details on the Blaise CATI applications, planned and/ordeveloped, that were part of the NASS effort on the 1997 Census of Agriculture.
Blaise CATI ApplicationsDeveloped by NASS for 1997 Census of Agriculture
Expected time Actual time Specifications Instrument Completed CATIName frame as of 6/98 frame Set Used Interviews
Screener 10/97-12/97 10/97 screener 238,000
Advanced Follow-Up 2/98-5/98 2/98 main census 56,000
Large Farm Follow-Up 3/98-6/98 3/98-6/98 2/98 main census 20,000
Not on Mail List (NML) 3/98-4/98 3/98-4/98 2/98 main census 1,000
Low Response County 4/98-6/98 canceled
Last Call Follow-Up 4/98-5/98 4/98 main census 51,000
Classification Error Survey 4/98-9/98 4/98-9/98 2/98 CES 20,000
Non-Response Survey 4/98-10/98 4/98-7/98 2/98 NRS 20,000
In the column labeled “Expected time frame,” there are no dates listed for the Screener, Advanced Follow-Up, or Last Call Follow-Up. This reflects that these applications were “birthed” as the process took shape.Lead times here were minimal. In some cases, an application would be needed in the field offices within afew weeks of learning that there would be such an application. NASS also was determined to conduct thisCensus in a shorter time frame than had ever been done before, and it was common for the schedule forapplications to be accelerated. Fortunately, by structuring the applications in a modular fashion andenforcing certain standards across all Census CATI applications, we were able to react quickly to thechallenges posed by the fluid nature of the specifications.
The ever accelerating schedule also created an environment where minimal training was possible.In fact, the only opportunity that we had to present our plans to field office staff in person was aone hour session in September 1997. If you glance at the above table, you can clearly see thatspecifications were far from firm at that point and two applications had not even been thought ofyet. All we could provide at that time was a rough overview of how we thought things wouldunfold. We supplemented that training later on with a two-hour teleconference. Again, thattraining was very limited. The only other way we had to pass information to the field offices wasa written document that accompanied each application when it was delivered to the field offices.Yet, despite this limited training that the field offices received, most of them coped very wellwith the Census CATI applications. We give credit to the intuitive nature of the user interfaces ofthe Blaise system itself, the rigid adherence to NASS standards where possible, and thesophisticated utilities which allowed us to build “user friendly” interfaces for interviewers andstatisticians.

118
Using Coding Results to Influence Routing
The challenges presented to the Blaise developers were also technical. Four of the applicationsused the instrument for the main Census questionnaire, which was 11 pages long. The interviewscould take up to an hour. The most challenging aspect of the instrument was that it had to be ableto handle any of almost 300 crops. Trigram coding was used to build a list of the crops grown onthe operation. Since there is a shorter list of possible livestock commodities, we used a moretraditional method to build that list. The interviewer would then review the profile of theoperation and if needed, refine the profile. Once the profile was set, the detailed acreage,production, and sales questions were asked for each crop, and inventory and sales questions foreach livestock commodity.
Our usage of Blaise coding programs had been very limited. Using them during the CATIinterview would clearly be a totally new experience for our interviewers. Our interviewersembraced this new technique more enthusiastically than we had ever anticipated. We expect thatthis approach will find its way into other NASS applications in the future.
Conducting the Agricultural Census in the United States required some clever programming toinsure robustness within the Blaise instrument as well as the system that supported theapplication. From the standpoint of maintenance and support, having one instrument for the mainCensus questionnaire for all states was the only feasible alternative. At first glance, this may notseem to be much of a challenge. But looking more closely, one soon realizes the diverseness ofthe data to be collected across such a large population. As mentioned earlier, one scope of theAgricultural Census was to collect data on all crops grown in the United States. Each state had aspecific list of crops that would typically be grown there, but very few states had the same list.Each state’s list would be a subset of 294 unique crops which were identified prior to the survey.To avoid asking embarrassing questions like pineapple crops in Alaska, and to keep the interviewlength as short as possible, the instrument was designed to first poll the respondent of the cropsthat they had raised. Once this list was prepared, more detailed acreage and production questionsfor each of these identified crops were routed.
The trigram method of lookup was used on an external file that contained 296 records: the 294unique crops, one “unknown” category, and one “done” indicator. In addition to the crop’s name,abbreviation, code, and description, the external file included such data as the item code, cropcategory, whether the acreage was collected in whole numbers or tenths, the conversion tobushels factor, the unit of production, and the point value based on the value of production of thecommodity. Therefore, once the list was built for the crops grown by a respondent, theinstrument had everything it needed for the identified crops. The crop description and the cropabbreviation were defined as the trigram key.
The instrument was designed to hold up to 159 crops in nine categories. Each of these cropcategories was defined as a table, and as the respondent identified the crops they produced, partsof the rows of the corresponding table were being computed from the data in the external file.Also, as a particular crop category was identified, LOCALS were being computed that would beused to determine whether each table would need to be routed, and other LOCALS were beingincremented, keeping track of how many crops in each category had been reported.
119
Upon collecting the list of crops from the respondent, the appropriate tables were routed based onthe LOCAL, and the acreage and production data for those crops were collected. The tables wereprocessed from one up to the number of crops within that category. This helped keep therespondent on track, as data for crops within the same category were collected together, eventhough they may not have been reported by category.
Dynamically Creating Blaise Records with Maniplus and Manipula
Another technical challenge was presented by NASS’s first experience with toll-free telephonenumbers. Every Census questionnaire, including the Screener, gave the respondent a toll-freenumber that they could call with any questions. Staff in the field offices were trained to handlethe inquiries posed by the incoming callers. On the screener application, since the interview wasvery short, it was decided to attempt to complete the interview once we had them on the phone.We had never dealt with “incoming” calls before and it took some effort to work this out.
Each state office conducted their own CATI portion of the Screener, whose main objective was todetermine whether the selected unit was a potential farm, a non-farm, a duplicate, or anundeliverable address. The records with a Screener Outcome of potential farm, would laterreceive an Agricultural Census questionnaire. The Blaise instrument, developed to collect thisdata, used a series of screening questions to determine the outcome. In addition to the CATIsamples, approximately 240,000 screener postcards were mailed, which included the toll-freetelephone number. At the start of the survey, all of the toll-free calls came to our North Carolinafield office. The mailed portion of the survey was treated as a separate application, although thesame Blaise instrument was used to collect the data. The postcards that were returned by therespondent were scanned in at our North Carolina office, if there were no changes to the nameand address.
The survey design had to allow for the cases of the mailed portion to be collected over the phonevia the toll-free number, as well as entering the name and address changes. However, initializingall 240,000 cases into a Blaise data set would have been tremendous overkill, as only the formswith name and address changes and the call-ins would actually need a Blaise record. The casewould also need to be retrieved in a timely fashion, so the respondent would not be lost. UsingManiplus, Manipula, and a Pascal tool, a system was designed that would dynamically build aBlaise record. The following describes the steps of the Maniplus setup.
First, the user was prompted for the identification number of the form to be retrieved or created.Second, the SEARCH method was used on the Blaise data set to see if the form already existed.If the form was not found, then the appropriate state ASCII file was searched using GREP, whichis a Pascal tool that quickly searches the contents of a file for a particular string. The names andaddresses of the 240,000 cases were split up by state, into multiple ASCII files with thecorresponding state’s number as the extension. This enabled the GREP search to find the recordvery quickly. The two-lined result of the GREP search was stored in a file. The first line was thename of the file that was searched, and the second line was the entire line that contained the id.Third, a Manipula setup was called that would update the Blaise data set with a new recordcontaining the id, name, and address information from the GREP-created ASCII file. In order toprocess only the second line of this file, the computations and WRITE statement were enclosed inan IF-ENDIF construct using the RECORDNUMBER method.

120
The remaining steps of the Maniplus setup were the same, whether the Blaise form was newlycreated, or already existed. The GET method was used to retrieve the form from the data set. Adialog box (Figure 1) was then opened displaying the id and name fields and a check box used toobtain the Screener Outcome without invoking the Data Entry Program (DEP) and answering theseries of screening questions. Four buttons were available in this dialog including one to acceptthe outcome entered, one to retrieve the form in the DEP, one to invoke a name and addressupdate dialog (Figure 2), and one to cancel.
Figure 1 Name and address update dialog box
Figure 2 Screener outcome dialog box
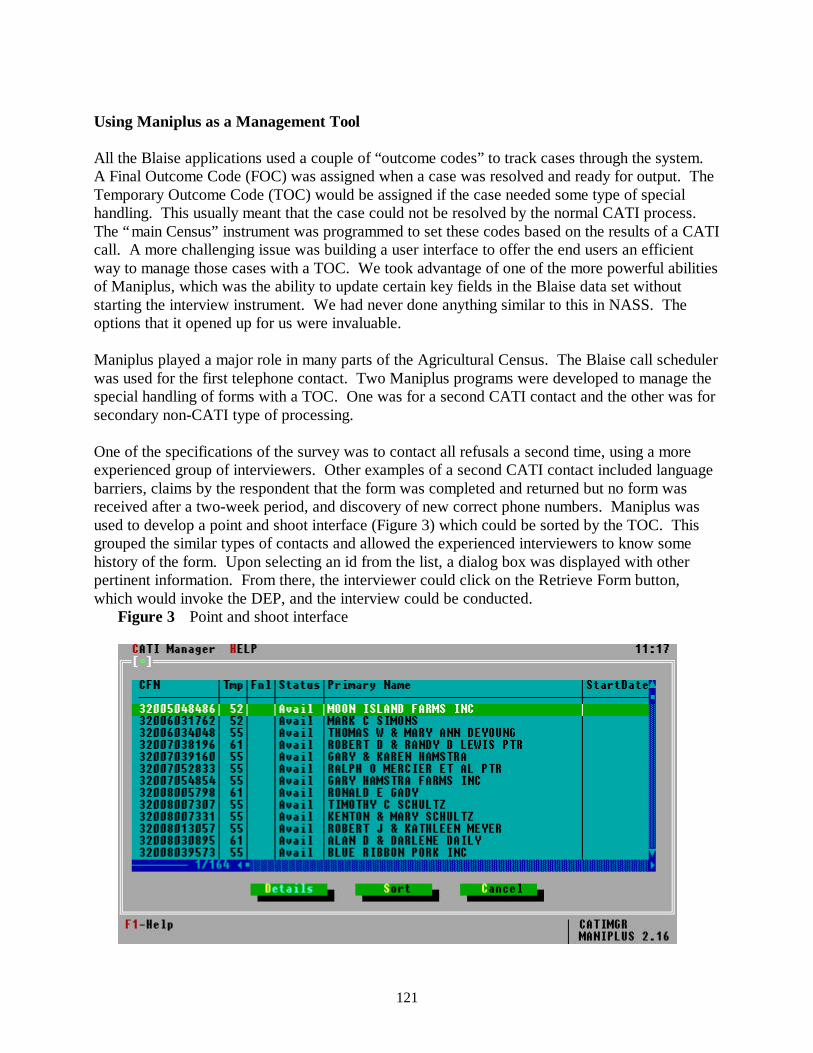
121
Using Maniplus as a Management Tool
All the Blaise applications used a couple of “outcome codes” to track cases through the system.A Final Outcome Code (FOC) was assigned when a case was resolved and ready for output. TheTemporary Outcome Code (TOC) would be assigned if the case needed some type of specialhandling. This usually meant that the case could not be resolved by the normal CATI process.The “main Census” instrument was programmed to set these codes based on the results of a CATIcall. A more challenging issue was building a user interface to offer the end users an efficientway to manage those cases with a TOC. We took advantage of one of the more powerful abilitiesof Maniplus, which was the ability to update certain key fields in the Blaise data set withoutstarting the interview instrument. We had never done anything similar to this in NASS. Theoptions that it opened up for us were invaluable.
Maniplus played a major role in many parts of the Agricultural Census. The Blaise call schedulerwas used for the first telephone contact. Two Maniplus programs were developed to manage thespecial handling of forms with a TOC. One was for a second CATI contact and the other was forsecondary non-CATI type of processing.
One of the specifications of the survey was to contact all refusals a second time, using a moreexperienced group of interviewers. Other examples of a second CATI contact included languagebarriers, claims by the respondent that the form was completed and returned but no form wasreceived after a two-week period, and discovery of new correct phone numbers. Maniplus wasused to develop a point and shoot interface (Figure 3) which could be sorted by the TOC. Thisgrouped the similar types of contacts and allowed the experienced interviewers to know somehistory of the form. Upon selecting an id from the list, a dialog box was displayed with otherpertinent information. From there, the interviewer could click on the Retrieve Form button,which would invoke the DEP, and the interview could be conducted.
Figure 3 Point and shoot interface

122
The other Maniplus program was geared for the statistician’s use. It provided a similar point andshoot interface, but included a different subset of forms. This list could also be sorted by TOC.Examples of forms included in this list were second refusals, disconnected or incorrect phonenumbers, six attempts to contact the respondent had been made, inaccessibles, and reportedduplication. As with the secondary CATI interface, once an id was selected, a dialog box(Figure 4) was displayed with pertinent information. However, this dialog box used CONTROLSthat could be edited. An FOC could be assigned, thus completing the case, without actuallyinvoking the DEP.

123
Figure 4 Dialog box with controls
Using Maniplus when Populating the Sample
On our more typical surveys, the name and address sample file is populated into a Blaise data setin its entirety. The Ag Census name and address files, however, were not as complete comparedto what we are normally accustomed. Many records were missing phone numbers that wouldneed to be looked up before populating them into the data set. Also, some of the applications hadlarge samples of which only subsets would need to be populated at one time. For these reasons, itwas evident that our procedures for populating a data set would need to be changed.
A Maniplus setup was written to handle the populate process. It did not use menus. It simplystarted with a dialog box prompting the user for an answer to the following question: “Are youadding records to an existing data set, or are you initializing from scratch?” If the user chose tostart from scratch, two warning dialogs were invoked if the data set already existed. As a safetynet, a batch file was run from Maniplus to make a backup copy of the existing data set. The userwas then prompted as to whether all records in the provided ASCII input file should be populated,or just the records with a telephone number.
Before adding these forms to the Blaise data set, a procedure was invoked that assigned theappropriate time zone to each of the forms. To determine the time zone, this procedure firstlooked at the state field. Some states required that the county field also be considered todetermine the time zone. In a handful of states, the county field was not sufficient, and so the zipcode field was also examined. Parts of a couple of states do not take advantage of daylight-saving time, so the current date had to also be considered when time zones were assigned.
If the user chose the initialize process (versus the appending process), up to 200 forms wereinitialized into a practice data set. The names and the phone numbers were changed before the

124
data set was written. Interviewers can be trained prior to, as well as, during a survey using thelive instrument with a practice data set. This newly created data set was also zipped for potentialuse, in the case of the 200 practice forms becoming exhausted.
Conclusion
As we look back on the uses of Blaise CATI on the 1997 Census of Agriculture, the one wordthat comes to mind is change. In the summer of 1997, we were planning for five CATIapplications. Now as we look back on the completed effort, we can count seven. Four of theoriginal five did occur and three other applications were born as the data collection effortevolved. The startup dates for some of the applications were also accelerated. Looking back onthe CATI applications for the Census, it is amazing that we were able to consistently meet ourtarget dates. Despite the number of new applications and ever accelerating schedules, theapplications were up and running on time. Maybe even more remarkable is that almost noupdates were made to the applications once they went into use. They worked from day one. Twofactors can be credited here. First, the staff building and supporting the applications wereextremely talented, experienced and dedicated. Many long hours, more than just a few off theclock, went into making this a success. The second factor is the flexibility and power of theBlaise system. We were able to build sound instruments that met almost every technicalchallenge. Utilities such as Maniplus allowed us to build user interfaces that could accomplishmany tasks without even involving the instrument. The combination of a strong software in thehands of a gifted staff spawned success out of chaos.

125
The 1997 U.S. Residential Energy Consumption Survey’s EditingExperience Using BLAISE III
Joelle Davis and Nancy L. Leach, Energy Information Administration (USA)
Introduction
In 1997, the Residential Energy Consumption Survey (RECS)Χone of the major energy consumptionsurveys in the United StatesΧbegan collecting data using Computer Assisted Personal Interviewing(CAPI) techniques rather than the traditional Paper and Pencil Interviewing (PAPI) method. The move toCAPI was motivated by a corporate goal to decrease the time between the collection of data and thepublication of results (in previous RECS, there was typically a two to three year lag), and still maintain thehigh data quality that has historically been associated with the survey. Additionally, a secondary goal wasto choose a CAPI software program that allowed the questionnaire to be programmed by subject-matterprogram staff rather than systems designers.
The RECS is conducted by the Energy Information Administration (EIA), the independent statistical andanalytic agency within the U.S. Department of Energy (DOE). Prior to selecting the CAPI software thatwould be used to program the RECS questionnaire, EIA previewed several CAPI software packages anddetermined that BLAISE best matched EIA=s requirements of a package that would not only affect howthe data were collected, but would also impact the subsequent data processing steps, such as coding theresponses, editing the data, and imputing for missing values.
This paper will focus primarily on the impact of the use of CAPI on three survey processing steps: thecoding of comments, post-interview editing of the data and imputing for missing data.
Background
The RECS is a national statistical survey of households in the United States. The survey, which ismandated by the U.S. congress, is sponsored by the U.S. Department of Energy. RECS was conductedannually from 1978 to 1982 and then in 1984, 1987, 1990, 1993 and 1997. RECS collects detailedinformation about the physical characteristics of the occupied housing unit, the demographiccharacteristics of the household, the types of energy used in the home and detailed information aboutenergy-using equipment and appliances. These data are collected during a voluntary on-site 30-minutepersonal interview.
Prior to the 1997 RECS, data were collected using PAPI. In 1997, data collection was changed to CAPItechniques using BLAISE III version 1.12. The questionnaire was programmed by technical (not systems)program office staff and contained a maximum of 348 questions with 29 range edit checks and 19consistency checks imbedded within the questionnaire. These consistency checks consisted of both hardand soft edits. The 1997 RECS collected data from 5,900 households between April 1997 and August1997, with a response rate of over 80 percent. Over 200 field interviews were trained to use the BLAISEIII CAPI questionnaire.
CAPI Impact on Data Processing Steps
Comparisons can be made between the PAPI and CAPI versions of RECS at several stages during the dataprocessing. These key stages are coding the comments, editing the data, and imputing for missing data.

126
Coding the Comments
Even though BLAISE III was used for the 1997 RECS, some manual coding was necessary in the caseswhere the interviewer had to key in an “Other/Specify” response or when the interviewer recorded notes inthe comment fields. In both cases, the keyed responses had to be reviewed and judgements had to bemade about how to code the responses. “Other/Specify” responses were recorded into CAPI during theinterview. Following the interview, they were printed out along with the questionnaire wording andreviewed by coders who determined the appropriate response and then entered the response into the CAPIdatabase. This CAPI coding process is many times more efficient than the PAPI coding method, in whicheditors were required to sort through stacks of questionnaires in search of comments that might need to becoded, at which point they would continue with basically the same steps as in the CAPI coding.
In the case of interviewer recorded comments in CAPI, the comments were printed out by questionnaireidentification number and compared with the respondents’ answers to relevant questions. Correctionswere made if necessary and entered into the database. Table 1 shows that there were savings during thecoding phase of the survey in terms of both staff level of effort and timeliness. The time needed tocomplete the coding was decreased by over seventy-five percent, so although it is true that the 1997questionnaire was about one-half the size of the 1993 questionnaire, this is still a substantial savings intime.
Table 1. Comparison of Coding Effort, 1993 and 1997 RECS
ITEM 1993 RECS (PAPI) 1997 RECS (CAPI)
Staff Level of Effort ................. Number of Coders.................. Number of Supervisors...........
200 Person Days3 Full-Time1 Full-Time
45 Person Days1 Part-Time1 Part-Time
Elapsed Time from Beginningto End of Coding Task ............ 3.5 Months 18 Days
(5 Days for Other/SpecifyCoding, 13 Days for Interviewer
Comment Coding)Source: Energy Information Administration, 1993 Residential Energy Consumption Survey and 1997Residential Energy Consumption Survey.

127
Post-Interview Editing
Range and consistency checks normally occur in a PAPI questionnaire after the field work is completedand all cases have been coded and entered into a database. In the 1993 RECS collected using PAPI, thisediting task took approximately 6 months to complete. The Edit Plan, which identified and programmedevery possible skip pattern and consistency check, began before the data were available. The plan was250 pages long with about 50 editing programs. The multistep editing procedure consisted of printing alist of cases that failed a particular edit, printing a list of variables that would be helpful in resolving anyinconsistencies, examining the paper questionnaire, determining the necessary corrections to theinconsistencies, recording any corrected information on the questionnaire and on the error listing sheets,and finally, refiling the questionnaires.
In 1997, with the use of CAPI, the post-interview editing was streamlined. Most importantly, many of theedits from the 1993 post-editing plan were incorporated as edits in the BLAISE questionnaire. Also,because the data were immediately available, editors and analysts could begin examining the frequenciesand crosstabulations as the data were being collected. This enabled analysts to identify consistency errorsduring the early stages of data collection and to write and program edit specifications only for identifiederrors. The Editing Plan and programs were updated and modified, as necessary, throughout the datacollection period.
The 1993 Editing Plan of 250 pages and 50 editing programs was reduced to approximately 20 pages and6 editing programs in 1997. These 1997 edit programs produced lists of cases that failed a particular editcheck. The editor examined the data and any interviewer comments that might help resolve the editfailures and determined the necessary corrections, which were then reentered into the CAPI database.
The actual savings in terms of person hours as they relate to the post-interview editing phase of the surveyare difficult to determine, partly because of the differences in the way specific task hours were tracked inthe 1993 and 1997 RECS, and partly because the survey instrument was shorter in 1997 and did notinclude a section that had required extensive editing in 1993.
Nevertheless, the fact that the data were immediately available to the survey contractor in 1997 wasextremely beneficial. The CAPI data could be reviewed much earlier than the PAPI data, which, in turn,allowed identification of potential data problems during the data collection phase, rather than during theediting phase which previously had occurred after the survey was out of the field. Table 2 showsstatistics for the 1993 and 1997 post-interview editing phase of the RECS.

128
Table 2. Comparison of Post-Interview Editing Effort, 1993 and 1997 RECS
ITEM 1993 RECS (PAPI) 1997 RECS (CAPI)
Staff Level of Effort Number of Editors .................................. Number of Editing Managers .................. Number of Computer Programmers........ Research Assistant ................................
3130
0111
Elapsed Time from Beginning to End ofCoding Task ............................................ 5-6 Months 3 Months Interspersed With
Other TasksSource: Energy Information Administration, 1993 Residential Energy Consumption Survey and 1997Residential Energy Consumption Survey.
Imputing for Item Nonresponse
Item imputation is a statistical process used to generate values for missing items. It is designed tominimize the bias of estimates based on the resulting data set. In the RECS, missing data items weregenerally treated by a technique known as hot-deck imputation. In hot-decking, when a certain response ismissing for a given housing unit, another housing unit with similar known characteristics (the donor) israndomly chosen to furnish its reported value for that missing item. The value is then assigned to thebuilding with item nonresponse (the nonrespondent, or receiver). This procedure is often time-consumingand generally occurs after field work is completed and the data have been edited.
In the 1993 PAPI version of RECS, 378 variables were imputed. About 50 variables were missing datafor 10 or fewer cases and about 40 were missing data for 100 or more cases. The vast majority of themissing variables were due to “No Answer” (that is, the interviewer did not record a response or theresponse was inconsistent with other responses), rather than a “Don=t Know” or “Refusal.”
In comparison, the 1997 CAPI version of RECS had only 145 variables imputed. Over half were missingdata for 10 or fewer cases and only 6 variables were missing data for 100 or more cases. Most of themissing data in 1997 was due to a “Don=t Know” or “Refusal” response. Because BLAISE does notallow a necessary field to be left blank, this source of error was eliminated. Table 3 provides imputationstatistics for the 1993 and 1997 RECS.
Table 3. Comparison of Data Imputation Effort, 1993 and 1997 RECS
ITEM 1993 RECS (PAPI) 1997 RECS (CAPI)
Number of Household QuestionnaireItems ................................................... 559 348
Number Of Variables Imputed ........... 378 (68 percent) 145 (42 percent)
Number of Variables Not Imputed ..... 181 (32 percent) 203 (58 percent)Source: Energy Information Administration, 1993 Residential Energy Consumption Survey and 1997Residential Energy Consumption Survey.
Instrument design errors can occur during the use of both PAPI and CAPI. In the 1997 RECS there weresome errors that occurred because of CAPI programming errors. However, whenever this type of erroroccurred, it occurred consistently. In a PAPI instrument, an error or lack of clarity in a questionnaire skip

129
instruction can cause discrepancies as to which follow-up questions are asked; each interviewer mayinterpret the instruction in a different way. In a CAPI instrument, however, programming errors causeconsistent problems to occur in the data. For the 1997 RECS, in some cases the data were retrievable orcorrectable; in other cases decisions were made to ignore certain data items. Because the errors wereconsistent, it was easier to decide what could and should be done with the data when such programmingerrors occurred.
Summary
Both major goals− increased timeliness and high data quality− were met using BLAISE. In 1993, theelapsed time between data collection and EIA’s first look at any data was approximately two months; in1997, analysts were able to view partial data even before the interviewing was complete. The 1997 RECSdata was actually published five months sooner than the 1993 RECS. Much of this increased timelinesswas due to the fact that the RECS data collected in 1997 using the CAPI questionnaire were much cleanerthan were the 1993 data collected using PAPI. The use of CAPI resulted in less nonresponse, and aconsiderable savings of time during the editing and imputation phases of the survey. Item nonresponsedue to interviewer skip pattern errors was greatly reduced. There is little doubt that the built-in data editsnearly eliminated item nonresponse due to interviewer error. The hard and soft edits greatly reduced thenumber of inconsistencies in the data, thereby resulting in a much cleaner data set. When programmingerrors did occur, they occurred consistently throughout the 5,900 cases and allowed for consistentdecisions to be made on how to handle the problem cases.
Based on the success of the 1997 RECS using BLAISE to program the questionnaire, the 1999Commercial Buildings Energy Consumption Survey (CBECS), a more complicated survey with manymore skip patterns, is currently being programmed in BLAISE 4 for Windows as a Computer AssistedTelephone Interview. This instrument is also being programmed in-house by an EIA technical analyst.

130
SSeeccttiioonn EE.. OOrrggaanniissaattiioonn
Using Blaise in a survey organisation where the researchers write theBlaise datamodels
Tony Manners, Office for National Statistics (UK)
CAI, starting with CATI, has been with us well over two decades. Most of the original questions it posedfor survey organisations have been resolvediii. The kinds of organisations and the types of work for whichit is most likely to be successful are well knowniv. While most organisations have a range of CAI modesin their portfolios, to use as appropriate, some broad generalisations can be made. CATI and CASI, withrapid design, programming, implementation and reporting of simple instruments, are well established inthe commercial field, particularly in the USAv. CAPI has so far seemed best suited for organisationswhich typically implement lengthy, complex instruments on social and economic topics for governmentand other parts of the public sector, and do so on a sufficient scale to justify a permanent staff ofinterviewers. Such justification is most likely if their portfolios include a number of regular or continuoussurveys. This paper concerns one of the few remaining questions about CAI on which different surveyorganisations, including those which share many characteristics, retain different and strongly heldopinions: what kinds of staff should author CAI instruments.
Under paper and pencil interviewing (PAPI), questionnaires were usually designed by the researchers whowould eventually analyse the results themselves or who liaised closely with the customers' analysts todesign questions and instruments to meet their analysis needs. Programming the routing of a paperquestionnaire could be conceptually sophisticated, but its physical process was often a simple matter ofusing scissors and paste.
PAPI questionnaires included only very rudimentary interviewer's instructions and edit checks, if any atall, but we should note how these survey elements were dealt with since they were to become integralparts of the CAI instrument. Detailed interviewers' instructions were designed by some combination ofresearchers and fieldwork specialists. Interviewers were asked to study them ahead of the fieldwork andremember them in appropriate circumstances. Edit checks were, of course, carried out after the fieldworkwas finished. They concentrated mainly on routing and ensuring that answers were within valid ranges,since errors of these types were possible at every question in the instrument. Data capture and editing wasoften carried out in third generation languages on mainframe computers. For all these reasons, edit checkstended to be a matter for computing specialists, with great variation between researchers in the degree towhich they were involved. Looking at PAPI as a whole, including the elements which were alreadycomputerised before CAI, like editing and analysis, we can see a range of approaches to the division oflabour between researchers and computing specialists. These approaches varied between organisations atany one time, and also within the same organisation over time. At one extreme, researchers simplyspecified their editing and analysis requirements to computer programmers. At the other extreme,researchers sought to extend their control of the survey process by specifying directly in higher-levellanguages like SPSS or SAS. Over time, as PCs spread in the workplace and PC software becameincreasingly easy to use, researchers have become accustomed to hands-on control in areas of the surveyprocess which they may not have had in former years. For such researchers, CAI appeared a naturalprogression in their work with computers.

131
Computerisation of the questionnaire, and extension of the questionnaire to cover the functions previouslycarried out in post-fieldwork edit programs, posed a strategic issue for organisations (at least implicitly).Was this innovation to be regarded as essentially a development in the field of computing or as essentiallya development in the field of survey design? Which of these two approaches an organisation settled ondetermined much of what followed in terms of the kinds of staff who were given responsibility for CAIpolicy and implementation. For example, on the key matter of choice of CAPI software, government andpublic sector organisations which saw CAPI as a computing matter (perhaps the majority) tended to favourwriting their own bespoke software or to adopt CAPI packages which recognisably involved an approachsimilar to writing bespoke programs (these packages were often based on CATI software developed in anearlier computing generation). Commercial organisations were less concerned about a bespoke capabilitybut their division of labour tended to leave even simple CAI packages as a matter for specialists. Thegovernment and public sector organisations which saw CAI as principally a matter for survey designers(researchers) tended to choose software which had essential functions built in (like the packages designedfor commercial surveys, but with a much greater range of functions and a capacity to deal with complexdata structures). The software had to demand no greater computing skills than their researchers alreadyexercised in using statistical analysis packages like SPSS for manipulating data using logic as well as justrunning tables. To many such organisations, Blaise seemed to have been designed to meet their needs.
Many organisations saw CAI as essentially a computing development. This paper is about one of theorganisations which saw it as essentially a development in survey design.
For such organisations, three main ways of working effectively have been identified:vi
• a team of researchers and programmers makes up an instrument design team for one or more surveys; • researchers are trained as CAI programmers, and their skills kept fresh; • researchers use standard modules and, where that is not possible, template modules to build
questionnaires. This paper describes why and how the author's organisation has used all three of these strategies since itbegan using CAI in production in 1990. It has moved increasingly towards the third strategy as thenumber of CAI surveys it carries out has expanded. The nature of the organisation is important forunderstanding the choice, so some brief details follow.
Social Survey Division and Blaise Social Survey Division of the UK's Office for National Statistics (SSD/ONS) comprises some 190headquarters staff and 1,000 interviewers (including about 200 telephone interviewers who work in acentral CATI unit). The interviewers are recruited on a permanent basis, following successful completionof stringent recruitment and selection procedures, training and a trial period of six months. In contrast tothe norm for commercial agencies in the UK, they are paid for time and expenses rather than by completedinterview, and very few do any work for other agencies. The headquarters staff comprise nearly 80 who are involved in aspects of fieldwork management andtraining (Field); over 50 researchers who combine project management with survey design, analysis andreport-writing or who work in a methodology unit; about 30 computing specialists; and over 20 staff whoprovide sampling, management and secretarial support. At any one time, the work of the division covers 9continuous surveys, including an omnibus survey, and various stages of some 40 ad hoc surveys, and a

132
range of methodological projects. Most, but not all, projects are household surveys, often involvinginterviews with all adults in the household. The two largest surveys together involve about half a millioninterviews with adults each year. Other surveys tend to be longer and more complex, and to involvesmaller samples. Conventional enterprise surveys by mail or electronic means are carried out in a separateBusiness Statistics Group of ONS. The majority of SSD/ONS's work has been acquired throughcompetitive tender. The surveys that SSD/ONS carries out are large-scale, usually complex, nationalstudies for government and other public sector bodies. The uses of the survey results in designing andmonitoring public policy make high quality essential. SSD/ONS clearly meets the criteria which wereidentified in the first paragraph of this paper for an organisation which has the basis for making successfuluse of CAI, and CAPI in particular. Work is carried out in a project management structure, with each project team led by a researcher who isfinally accountable for all aspects of the project. As it is researchers who write Blaise questionnaires inSSD/ONS, it is worth considering their characteristics more closely. Researchers are required to have agood (and, in practice now, often a higher) degree in a social science with substantial statistical content,statistics or mathematics; or to have demonstrated equivalent experience. Most are social scientists. Whilesome have, or acquire, expertise in particular subject matter areas, it is SSD/ONS policy that researchersshould be able to work on the full range of its surveys; in practice, movement between subject areas at thecompletion of each project, and between continuous and ad hoc surveys, is the norm in a researcher'scareer. One result of the project management structure is that the researchers have always had hands-onknowledge and control of critical elements of the design and analysis, such as sampling, questionnaire andprocessing design, and statistical computing involved in the analysis. Under PAPI, there was already atendency to try to eliminate duplication of tasks within the project team, such as specification ofprocessing or analysis requirements to a programmer. This tendency was encouraged by softwaredevelopments and by the need for programmers to take on more challenging tasks, to meet the needs of theorganisation and their own careers. As researchers had always designed paper questionnaires and were also seeking to extend their hands-oncontrol of processing, it is perhaps not surprising that when CAPI became a real possibility in the mid-1980s SSD/ONS saw CAI questionnaire software as a tool for researchers. It quickly adopted Blaisebecause, in addition to its strong functionality and reliability, it was the only CAI software which had afully integrated design. A single specification - in the familiar format of a questionnaire, though nowincorporating edit checks - generated metadata which could be used unchanged from data collection (inany CAI mode) to analysis. That principle - signalled in the use of the general term datamodel for theenhanced questionnaire - was built on strongly in Blaise III and remains central to the appeal of Blaise toits users. While it was important for researchers to take on direct specification of the instrument, it was equallyimportant that they should not spend their time doing work for which they were not properly skilled andwhich it was more efficient for computing specialists to carry out. For example, SSD/ONS assigned thetask of providing a suitable CAI environment of case management and telecommunications to its SurveyComputing Branch. In the early days of CAPI in SSD/ONS, there was a clear division of labour. At that time Blaise andManipula were separate modules. Researchers used Blaise to write questionnaires and press-button Blaiseutilities to output the data. If the survey was relatively simple, the output was read in SPSS and there wasno need for any intervention by computing specialists. Usually, however, the survey would have acomplex structure. In these cases, computing specialists read the output into their standard databasesoftware, Clipper, from where they could manipulate it into a suitable form for SPSS or, if necessary, send

133
it to specialist software for handling hierarchical data. They did not need to know anything about Blaise:it was policy for them to treat Blaise as a "black box". This division of labour was relatively easy to operate when only a few surveys had converted to CAI. Thenumber of researchers who needed to learn to use Blaise was small, and the pioneers were highlymotivated. Moreover, most of the early CAI surveys were continuous surveys carried out by small teamsof researchers who could sustain some collective knowledge of Blaise so that they were not dependent onparticular individuals. However, from 1994 (by when the continuous surveys had adopted CAI)SSD/ONS's policy was that any new survey would use CAI unless there was a very good reason why itshould not (such as that it was a qualitative study involving large amounts of verbatim reporting). By1995, over 95% of SSD/ONS's interviews were carried out in Blaise. Any and every researcher nowneeded to be able to write Blaise instruments or, in the case of senior managers, to understand enough ofthe critical design issues to be able to supervise junior staff who were doing the actual writing. With the integration of Manipula and Blaise in Blaise III, there were efficiencies in the computingspecialists using Manipula rather than Clipper for many purposes. Moreover, data output was moreflexible than in the push-button utility days of Blaise 1 and 2, but it was also more of a file-specificationtask appropriate for computing specialists. Use of Manipula and Cameleon by computing specialistsentailed their learning about Blaise datamodels. Although Blaise was no longer a "black box" forcomputing specialists - and, indeed, they were clearly far more skilled than researchers in purelycomputing aspects of Blaise (e.g. making its functions perform more than they were originally intendedfor; linking in external programs; understanding how Blaise metadata could be accessed for an automaticdocumentation tool written in Clipper) - the basic division of labour was retained. Researchers designedsurvey instruments directly in Blaise. Computing specialists output the data, using Manipula andCameleon, and continued to provide and improve the case management and telecommunicationsenvironment for CAI data collection. A management review confirmed the policy that the researchers working on a survey should write itsBlaise instrument. The review took particular account of the importance for survey quality of hands-oncontrol and knowledge of the questionnaire by researchers. It also stressed the importance of co-operationin the survey team between researchers and computing specialists to ensure that the requirements forefficient output design were built into the datamodel by the researchers from the start. The reviewregarded the mode of working which involved researchers writing specifications for programmers to putinto Blaise as involving duplication of resources and as potentially error-prone. It noted the difficultiesreported by some organisations in recruiting and retaining programmers to carry out such (for them)mundane workvii. Finally, the review recognised that researchers would spend only a small andintermittent part of their careers writing Blaise questionnaires. This meant that there was a particular needfor a cost-effective mechanism to ensure that researchers had the necessary up-to-date skills at the pointthat they were required; and that all Blaise questionnaires were of high quality. The remainder of thispaper describes the mechanism that was set up.
Standards and quality assurance The problem is to provide more than 40 researchers with a sufficient knowledge of Blaise for them to beable to use it as a tool to write high quality survey instruments, without undue cost or time in training andkeeping the skills up to date. They should spend no more time than they do in, say, keeping up to datewith analysis software. There are two main types of requirement for knowledge about Blaise. Juniorresearchers are likely to write all or most of the Blaise instrument code on their projects. Seniorresearchers need to know enough of Blaise and the critical factors in design using Blaise to be able to

134
supervise the juniors. The more senior the researcher the less need there may be to know the details ofBlaise, but at the very least there is a need to know what may affect management decisions and strategy. After nearly a decade of Blaise use in SSD/ONS, many senior researchers have experience in writingBlaise code from their junior days. However, it may some time since they last used Blaise. Other seniorresearchers do not even have this experience to build on. Brief guidance on “Blaise for managers” hasproved sufficient for most senior managers if they have some former or background knowledge and willnot need to write code themselves. New researchers are recruited at all levels, though in largest numbers at the junior level. New recruitsreceive a 3-day course in Blaise, provided by Statistics Netherlands. This is enough to enable them to startto understand the complexities of real survey instruments, but there is a great deal to learn about Blaise asa tool in survey design and not simply as a programming language. Such skills are only learned inpractice, so more courses are not the answer. At the same time, SSD/ONS has to provide secure means ofdelivering high quality Blaise instruments to carry out customers’ surveys. The strategy SSD/ONS has adopted is to embody the collective practical knowledge of the organisation in: • a set of standards for writing Blaise code;• standard code for common elements of questionnaires, such as the household box;• and templates for writing unique questionnaire content into standard instrument structures. Annex A is an extract from the document which explains this strategy and some of its detailedimplementation to SSD/ONS’s researchers. Among its other benefits, the strategy simplifies the training requirement. Instead of learning and re-learning Blaise each time it is needed, the researcher needs to understand only some basic structuralprinciples and conventions which can be summarised in a few pages. All the detail, in its most up-to-dateform, using best practice, is available in the standard code and templates. There are other significant advantages to this approach: • supervision of new and junior researchers is simple and efficient, since it is clear to them and to their
supervisors exactly what they should produce;• researchers can read each other's code with minimal difficulty since it looks like the code they
themselves would write, and uses the same conventions; this is important in an environment whereresearchers move between surveys and where several researchers will work together on the largersurveys;
• the screens which interviewers see have a standard format - they know, for example, where on thescreen to find the current respondent's name (and it is guaranteed that the researcher will not forget toprovide such standard information);
• the approach facilitates rapid development of reliable instruments by allowing researchers to buildthem, to a considerable extent, from standard blocks;
• it facilitates testing and SSD/ONS's quality assurance of its Blaise instruments. The strategy requires a small team to lead, co-ordinate and publicise the setting of standards and theprovision of quality assurance. The team, which is called the CAI Standards and Quality Assurance(SQA) team, comprises two researchers, a fieldwork expert and two computing specialists. Their jobs onthe team are part-time, and the doubling-up of researchers and computing specialists is to ensure cover.The total time allocated to the team, to cover all its members, is well under one person year and is tending

135
to reduce. In the allocated time, the team develops new standard and model code, provides a trouble-shooting service (advice to, but not substantive work on, survey projects) and maintains its own expertise.The computing specialists check all new instruments for conformity to the standards, mainly by usingautomatic tools. The quality of the content, and its testing, remains the responsibility of the seniorresearcher on each survey. Conforming to standards does not add time or cost to a researcher's task: it is the default option, embodiedin the standard and model code that researchers start from. The standards would never be allowed toprevent a researcher from designing an instrument to function as they and their customers choose. Inpractice, the issue does not arise. Blaise needs to be written in some form, and the model code embodies asuitable one. It is easier to use the standard and model code than to invent a form of one’s own. The approach described in this paper has grown up over many years. The SQA team has only formallyexisted for two years, but there has been a CAI co-ordination role from the start. The approach has beenre-examined critically several times over the years, but has always been reaffirmed as the best way to meetSSD/ONS’s goals in survey design.

136
ANNEX A
STANDARDS AND CONVENTIONS FOR WRITING BLAISE III DATAMODELS INSSD/ONS
Standards and Quality Assurance (SQA) team
Blaise III standards (document month: September 1997) A standardised approach to CAI instrument design is one of SSD's strategies for helping designersproduce instruments which meet the needs of their surveys as fast and as accurately as possible. It is thebasis for preprepared modules of Blaise code (e.g. for harmonised questions) which can be slotted into anySSD survey, and for templates of Blaise code which can be adapted to any samples and subject matter.Standard modules and templates will save designers a lot of tedious and error-prone work which isassociated with any programming task and allow them to concentrate on the real research issues. Theywill help interviewers by prompting designers to produce screen layouts with the information they need inthe places where they expect to find it and with standard meanings. Many of the standards in thisdocument are essential to the smooth running of survey instruments in the laptop and CATI computingenvironments. Standardisation is a means for an organisation, and not just individuals, to learn fromexperience and to generalise good practice. … . The SQA team has drawn up the standards. It does not claim that these standards are the only viable wayof doing things, but asks people to accept that the point of standardisation is to have a common waywherever possible and that these particular choices are based on experience of a wide range of surveys andof the problems raised by the differing styles of their designers. The process of instrument design willwork best if the survey team meets with the SQA team before actually writing any code and agrees astrategy for the design, including the way standards will be used, and arranges any help that the SQA teamcan provide. Many surveys have already done this successfully … . This document is for quick reference for designers who have at least a basic knowledge of Blaise. It isabout SSD's standards for Blaise, not about any requirements of the software itself.

137
Questionnaire ("Datamodel"7) structure A survey datamodel will comprise: • one and only one datamodel control file (with a file extension .bla) (see Annex A.1) covering all
requirements at datamodel level except the following paragraphs: RULES TYPE LOCALS AUXFIELDS
In the main, it will be a list of INCLUDE files, to bring in the paragraphs excluded above and theblocks for the survey. These INCLUDE files will have extensions .HAR (harmonised, not to be changedexcept with written agreement of SQA team) or (survey-three-letter-acronym (TLA) for example .GHS). Inaddition to the harmonised blocks, the SQA team will provide model files (extension .MOD) for researchersto use as templates for their own survey blocks (converting the extensions from .MOD to .(survey acronym);in the rest of this note, we refer to the modifiable files as .MOD but a survey will need to change thisextension). • INCLUDE files for the following datamodel level paragraphs: RULES......................RULES.MOD (see example at Annex A.2) TYPE ........................TYPE.HAR and TYPE.MOD LOCALS...................LOCALS.HAR and LOCALS.MOD AUXFIELDS.............AUXFIELDS.HAR and AUXFIELDS.MOD • INCLUDE files for the survey's blocks (ONLY 1 block or 1 block which contains nested blocks per
file):harmonised blocks ..... ...................QSubject.HARmodel/modifiable....... ...................QSubject.MOD
It is very important to note that ONLY 1 block or 1 block which contains nested blocks is allowed per file.This is vital for efficient instrument design. For example, it allows the naming convention of the file andblock having identical names, which facilitates instrument amendment (see below).… .
Blaise III does not allow CHECKS and SIGNALS to be separated off into their own INCLUDE files.This Blaise constraint means that the RULES paragraph at datamodel level is not, as we would like, justan outline of the routing. The CHECKS and SIGNALS should be put in carefully, in as organised anddiscrete a way as possible, so as not to clutter up the view of the routing. The model code RULES.MODmay be used as a template.
Naming/defining conventions
Datamodel control file........................survey acronym + surveyYEAR + version .BLA
7 This Blaise term is intended to indicate that the specification for the questionnaire is much more than that - it is themetadata (data about the data) for the survey, used at all stages from data collection to analysis.

138
(e.g. SEH9601A.BLA, OMN9702B.BLA)
INCLUDE filesexactly same as field name of block in each(e.g. QTCalls is in QTCALLS.MOD; the rules for the datamodelare in RULES.MOD). This means that names of blocks should beno more than 8 characters (the DOS limit) even though Blaiseallows more.
Blocks ..................................start with B (e.g. BPerson).................................. field name of block starts with Q (e.g. QPerson).................................. table blocks start with T (e.g. TPerson).................................. field name of table block includes the T
(e.g. QTPerson)..................................Block field names are always defined in the INCLUDE file they
belong to, NOT in the datamodel FIELDS paragraph.
Locals ..................................with 1 or 2 standard exceptions ( the current list is at ..), names willcomprise the name of the block in which they are defined, with L infrontand a number at the end (e.g. LPerson1, LPerson2 would be theones defined in BPerson; LTPerson1 would be found to be definedin TPerson). Datamodel level locals will be called LDM1, LDM2,etc.(Reason: so-called intuitive names are frequently misleading or notactually intuitive for another reader. What one needs to know iswhere the local is defined. Then the reader can find out what it'sactually doing.)
Derived variables ...............................Computed variables stored on file (i.e. computed into fields) muststart DV
Paragraph commands .........................FIELDS, AUXFIELDS etc - must ALWAYS be accompanied by acommented reference to the block they are in, e.g. RULES {TPerson}
Labels.............................................. Labels can be used to provide precise comments which have areasonable chance of being updated (i.e. it's a project responsibility)since they are part of the survey metadata,e.g. on blocksBlock BPerson “Main person Information Block”
… … ..
Standard files and blocks
… .details of standard configurations to ensure that testing on office PCs mimics accurately theconfigurations on interviewers’ laptops… …
(an example… ..)

139
Permission to recall block (QRecall.HAR)
There is a standard block for asking for permission to recall. Your datamodel control file shouldINCLUDE it as follows:
INCLUDE O:\B3115\SQA\MODULES\QRecall.HAR
This guarantees that you will use the latest version. If you wish to use something else, you should havewritten agreement from the SQA team.

140
Annex A.1 - Datamodel control file example.
{TM020297 *********************************************************** GLC97nn - DATAMODEL CONTROL FILE for GENERAL LIVING CONDITIONS SURVEY* 1997 (the Blaise III Field training questionnaire)
* GLC97nn.BLA - this file - contains INCLUDE files for whole* questionnaire.** It does NOT contain TYPES, LOCALS, AUXFIELDS or RULES - see* include files TYPE.HAR, TYPE.GLC, LOCALS.HAR, AUXFIELD.HAR,* AUXFIELD.GLC and RULES.GLC respectively.** RULES.GLC must be the final include file before ENDMODEL.TM020297 **********************************************************}
DATAMODEL GLC9704
LANGUAGES = ENG "English", HLP "Instructions"
ATTRIBUTES = DontKnow, Refusal
PRIMARY
QID
PARALLEL
QReCall QHAdmin
USES { DM ***********************************************************}
{TM301296************************** check for valid SOC codesTM301296}
SocMeta 'C:\CASEBOOK\COMMON\EXTSOC',
{TM301296************************** classification matrixTM301296}
MatMeta 'C:\CASEBOOK\COMMON\EXTMAT',
{TM301296************************** subject of qualifications - from LFS - see also LIBRARIES para (note* slightly different name there: Subjects (plural)TM301296}
Subject 'C:\CASEBOOK\GLC\SUBJECT',
{TM301296************************** nationality - from LFSTM301296}
Nation 'C:\CASEBOOK\GLC\NATION'
{TM301296************************** END OF USES {DM} PARAGRAPH
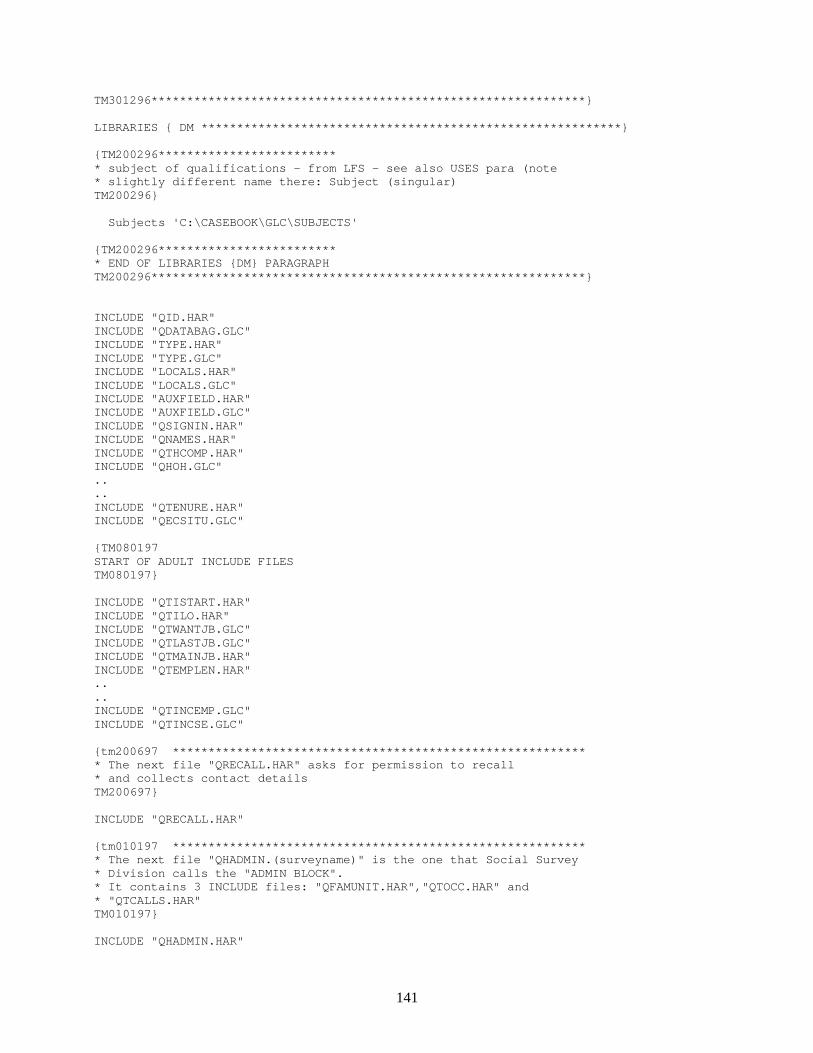
141
TM301296*************************************************************}
LIBRARIES { DM ***********************************************************}
{TM200296************************** subject of qualifications - from LFS - see also USES para (note* slightly different name there: Subject (singular)TM200296}
Subjects 'C:\CASEBOOK\GLC\SUBJECTS'
{TM200296************************** END OF LIBRARIES {DM} PARAGRAPHTM200296*************************************************************}
INCLUDE "QID.HAR"INCLUDE "QDATABAG.GLC"INCLUDE "TYPE.HAR"INCLUDE "TYPE.GLC"INCLUDE "LOCALS.HAR"INCLUDE "LOCALS.GLC"INCLUDE "AUXFIELD.HAR"INCLUDE "AUXFIELD.GLC"INCLUDE "QSIGNIN.HAR"INCLUDE "QNAMES.HAR"INCLUDE "QTHCOMP.HAR"INCLUDE "QHOH.GLC"....INCLUDE "QTENURE.HAR"INCLUDE "QECSITU.GLC"
{TM080197START OF ADULT INCLUDE FILESTM080197}
INCLUDE "QTISTART.HAR"INCLUDE "QTILO.HAR"INCLUDE "QTWANTJB.GLC"INCLUDE "QTLASTJB.GLC"INCLUDE "QTMAINJB.HAR"INCLUDE "QTEMPLEN.HAR"....INCLUDE "QTINCEMP.GLC"INCLUDE "QTINCSE.GLC"
{tm200697 *********************************************************** The next file "QRECALL.HAR" asks for permission to recall* and collects contact detailsTM200697}
INCLUDE "QRECALL.HAR"
{tm010197 *********************************************************** The next file "QHADMIN.(surveyname)" is the one that Social Survey* Division calls the "ADMIN BLOCK".* It contains 3 INCLUDE files: "QFAMUNIT.HAR","QTOCC.HAR" and* "QTCALLS.HAR"TM010197}
INCLUDE "QHADMIN.HAR"

142
{tm160197 *********************************************************** The next file "RULES.(surveyname)" must be present and must be the last* include file.** "RULES.(surveyname)" contains the 2 datamodel level CHECK* paragraphs - (1) harmonised (2) model (i.e. survey-specific).* Note that these CHECK paragraphs cannot be held in INCLUDE files.tm160197}
INCLUDE "RULES.GLC"
ENDMODEL

143
Annex A.2 - Example of a file containing a block.
{TM010197* This file (QNames.HAR) sets up an array in which the names or other* identifiers for household members can be entered in any order, in response* to question "Who lives here?" (asked in QSignIn). Household reference* person, if needed, can be identified later, in a question or by a compute.** ONLY ONE THING CAN BE ALTERED IN THIS FILE - AND ONLY WITH AGREEMENT OF* STANDARDS AND QA TEAM - (THE ARRAY SIZE AT …)tm010197}
BLOCK BNames
LOCALS { BNames }
LNames1, LNames2 : INTEGER
BLOCK BBNames
FIELDS { BBNames }
Name "RECORD THE NAME (OR A UNIQUE IDENTIFIER) FOR HOH, THEN A NAME/IDENTIFIEER FOR EACH MEMBER OF THE HOUSEHOLDúúúúúHELP<F9>@/@/ WHEN ALL HOUSEHOLD MEMBERS HAVE BEEN ENTERED, PRESS PgDn@/"
"PRIMARY SET OF QUESTIONS ON HOUSEHOLD COMPOSITION AND RELATIONSHIPS ASKED ON ALL SURVEYS.@/@/ HOUSEHOLD COMPOSITION@/@/ Stage 1: Establish Residency - only/main residence 6 month rule/ Check Adult Children@/ Stage 2: One or more households - 'Do you all share at least one main meal a day or share living accommodation?'@/ Stage 3: Establish HoH - 'In whose name is the accommodation owned or rented?'@/"
: STRING[12],EMPTY
RULES { BBNames }
Name
ENDBLOCK { BBNames }
FIELDS { BNames }
QBNames : ARRAY [ 1..10 ] OF BBNames DVHsize : 1..10,EMPTY
RULES { BNames }
LNames2 := 0 FOR LNames1 := 1 TO 10 DO QBNames[LNames1] IF QBNames[LNames1] <> EMPTY THEN LNames2 := LNames2 + 1 ENDIF ENDDO DVHsize := LNames2

144
DVHsize.KEEP
ENDBLOCK { BNames }
FIELDS { DM }
QNames : BNames i A recent summary of the state of the art in CAI is to be found in Couper, M. et al (eds) ComputerAssisted Survey Information Collection, 1999, John Wiley & Sons Inc, New York.ii See in this volume: Wings, H. Blaise for the Internet.iii The History and Development of Computer Assisted Survey Information CollectionMethods, Couper, M.P. & Nicholls, W.L. in M.P. Couper et al. (eds) 1998iv Development and Implementation of CASIC in Government Statistical Agencies,Clark, C.Z.F., Martin, J. and Bates, N. in M.P. Couper et al. (eds) 1998v Integrating CASIC into Existing Designs and Organizations: A Survey of the Field,Groves, R.M. & tortora, R.D. in M.P. Couper et al. (eds) 1998vi Producing CAI Instruments for a Program of Surveys, Pierzchala, M. & Manners,T. in M.P. Couper et al. (eds) 1998 vii Computer Aided Interviewing: Has It Ever, and Will It Still Work? Connett, W.E.in Association for Survey Computing, Proceedings of The Second ASC InternationalConference, London,1996