IBP AT MERCK - · PDF fileIBP AT MERCK . 2 Content Who is Merck ? IBP concept Benefits & Key...
23
Didier Dayen Senior Director Global Advanced Planning June 19 th , 2017 Supply Chain Logistics summit - Barcelona IBP AT MERCK
Transcript of IBP AT MERCK - · PDF fileIBP AT MERCK . 2 Content Who is Merck ? IBP concept Benefits & Key...
Didier Dayen Senior Director Global Advanced Planning June 19th, 2017
Supply Chain Logistics summit - Barcelona
IBP AT MERCK

2
Content
Who is Merck ?
IBP concept
Benefits & Key Success Factors
Conclusion

3
Content
Who is Merck ?
IBP concept
Benefits & Key Success Factors
Conclusion

4
WE ARE MERCK – THE ORIGINAL
Who we are - History
Nearly 350 years of experience for patients and customers
Friedrich Jacob Merck purchases the Angel Pharmacy (Engel-Apotheke) in Darmstadt
Emanuel Merck begins production on an industrial scale
In 1887, Merck opened its own office in New York, which gave rise to the subsidiary Merck & Co. three years later. Our U.S. subsidi-ary Merck & Co. is expropriated as a consequence of World War I
1668 1827 1917
Merck – the original holds the global rights to the Merck name and brand. Exceptions are Canada and the United States, where we operate as EMD Serono, MilliporeSigma and EMD Performance Materials.
5
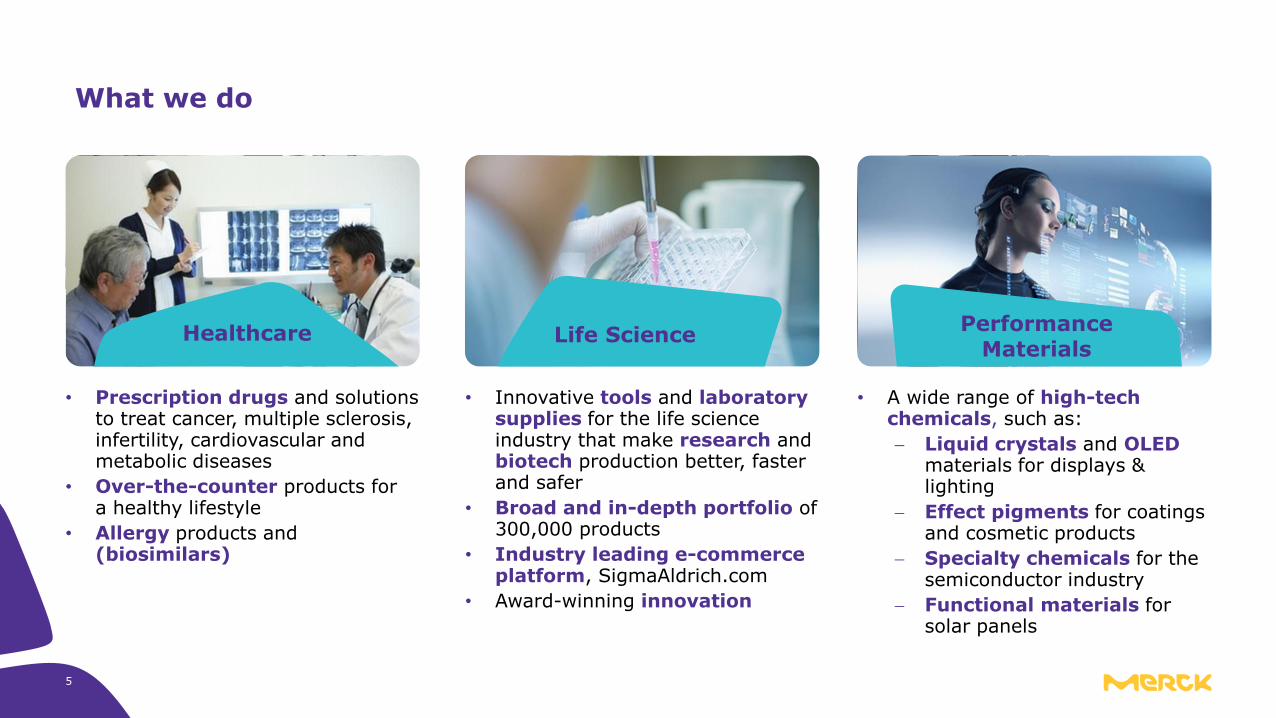
What we do
Life Science Performance
Materials Healthcare
• A wide range of high-tech chemicals, such as:
Liquid crystals and OLED materials for displays & lighting
Effect pigments for coatings and cosmetic products
Specialty chemicals for the semiconductor industry
Functional materials for solar panels
• Innovative tools and laboratory supplies for the life science industry that make research and biotech production better, faster and safer
• Broad and in-depth portfolio of 300,000 products
• Industry leading e-commerce platform, SigmaAldrich.com
• Award-winning innovation
• Prescription drugs and solutions to treat cancer, multiple sclerosis, infertility, cardiovascular and metabolic diseases
• Over-the-counter products for a healthy lifestyle
• Allergy products and (biosimilars)
6
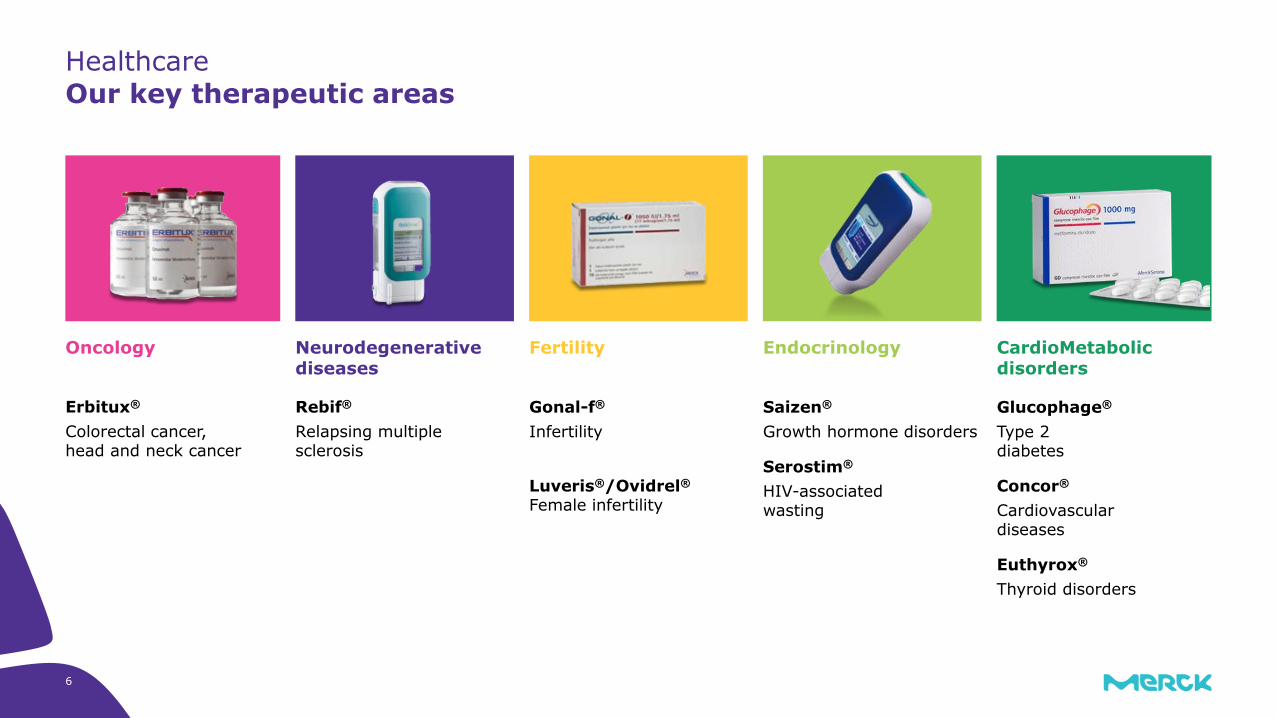
Healthcare
Our key therapeutic areas
Erbitux®
Colorectal cancer, head and neck cancer
Rebif®
Relapsing multiple sclerosis
Gonal-f®
Infertility
Luveris®/Ovidrel®
Female infertility
Saizen®
Growth hormone disorders
Serostim®
HIV-associated wasting
Glucophage®
Type 2 diabetes
Concor®
Cardiovascular diseases
Euthyrox®
Thyroid disorders
Oncology Neurodegenerative diseases
Fertility Endocrinology CardioMetabolic disorders
7
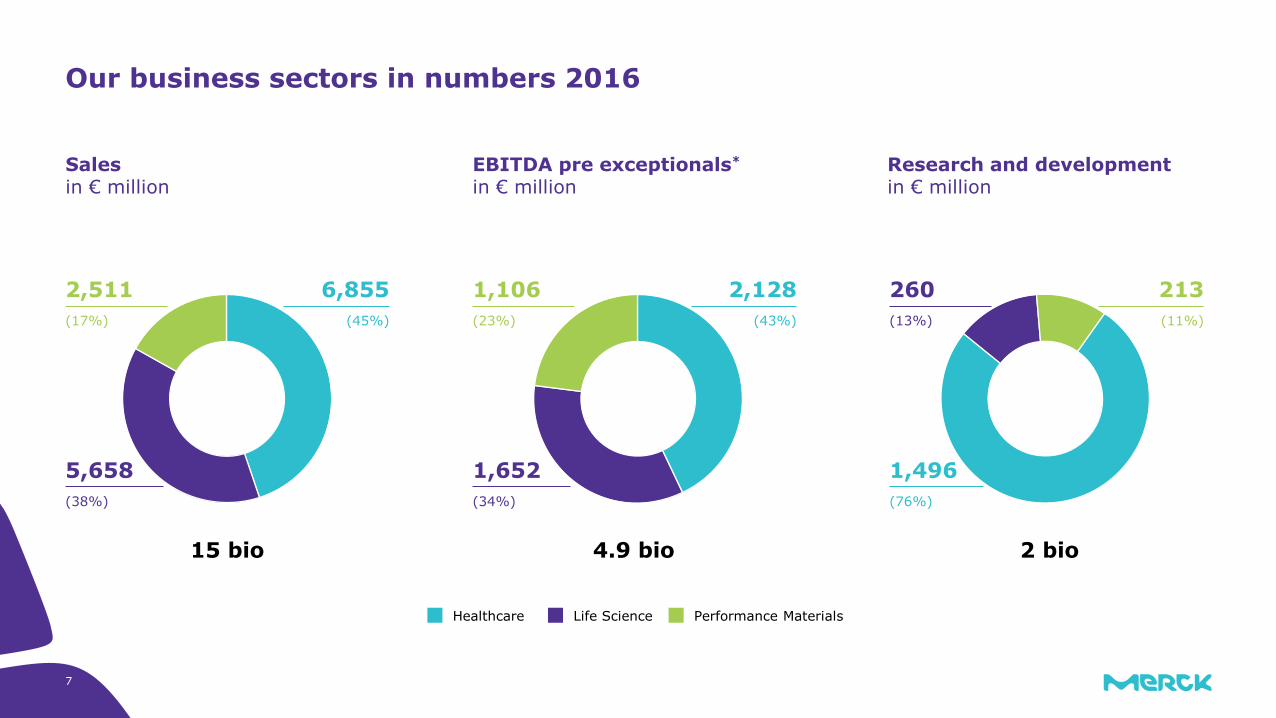
Our business sectors in numbers 2016
Sales in € million
EBITDA pre exceptionals* in € million
Research and development in € million
Healthcare Life Science Performance Materials
2,511
(17%)
6,855
(45%)
5,658
(38%)
1,106
(23%)
2,128
(43%)
1,652
(34%)
260
(13%)
213
(11%)
1,496
(76%)
15 bio 4.9 bio 2 bio

8
We are global
Sales by region 2016 in € million
Employees by region 2016 (as of December 31)
We operate around the world and have a strong presence in growth markets.
129 nationalities are represented at Merck and our employees work at sites in 66 countries around the world.
1,136
(8%)
4,735
(31%)
4,736
(31%)
Europe North America Asia-Pacific (APAC)
3,858
(26%)
4,140
(8.2%)
24,438
(48.5%)
10,754
(21.3%) 10,037
(20.0%)
Latin America
559
(4%)
1,045
(2.0%)
Middle East and Africa (MEA)
50'000 15 bio

MDA Semoy Spittal Mollet Mexico Other
API Subcontractors
Global SNO
From Local Steering To Global Steering
Affiliate 1 Affiliate 2 Affiliate 3 Affiliate 4 Affiliate 5 Affiliate 6
Affiliate 1 Affiliate 2 Affiliate 3 Affiliate 4 Affiliate 5 Affiliate 6
MDA Semoy Spittal Mollet Mexico Other
API Subcontractors
C1
C2 C3 Cn C1
C2 C3 Cn C1
C2 C3 Cn C1
C2 C3 Cn C1
C2 C3 Cn C1
C2 C3 Cn
C1
C2 C3 Cn C1
C2 C3 Cn C1
C2 C3 Cn C1
C2 C3 Cn C1
C2 C3 Cn C1
C2 C3 Cn
9
Global Supply Chain organization
10
Content
Who is Merck ?
IBP concept
Benefits & Key Success Factors
Conclusion
11
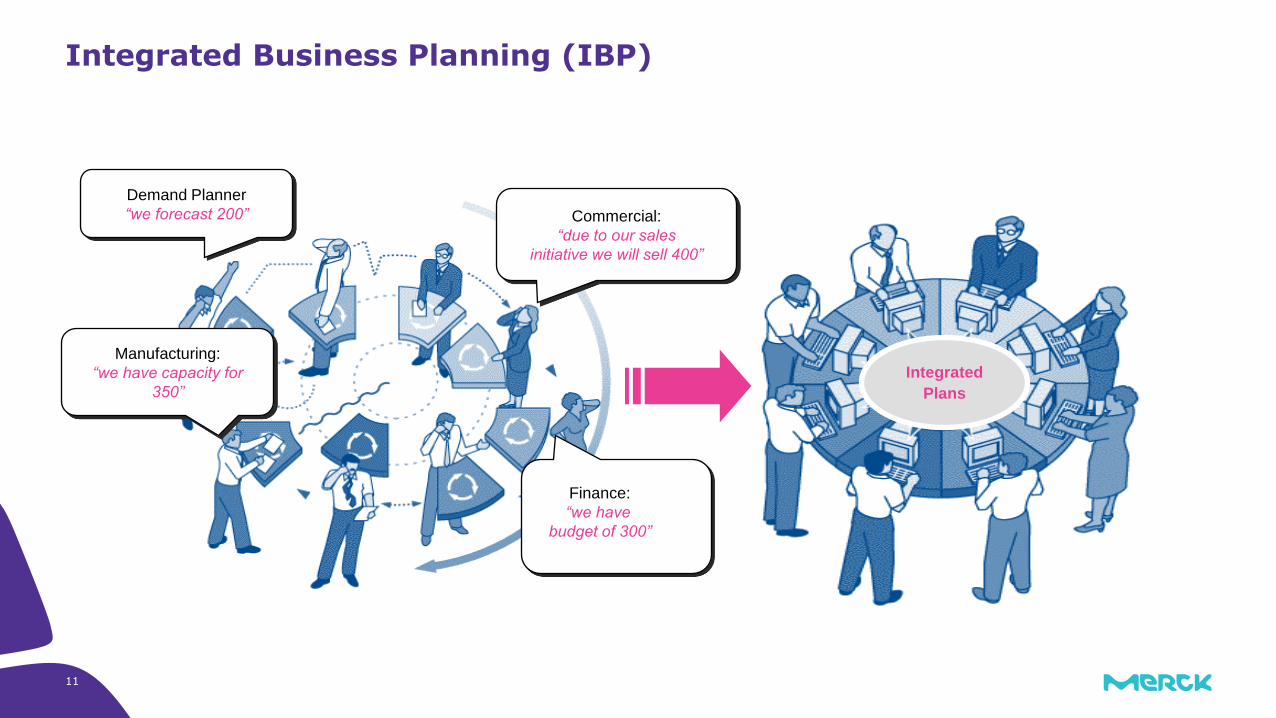
Integrated Business Planning (IBP)
Demand Planner
“we forecast 200” Commercial:
“due to our sales
initiative we will sell 400”
Finance:
“we have
budget of 300”
Integrated
Plans
Manufacturing:
“we have capacity for
350”

One single plan aligned between Commercial, Controlling and Supply Chain
Integrated Business Planning
The IBP main objective is to align different business forecast into one integrated plan providing higher transparency, increased efficiency, better financial forecast (OP, Fn), improved gap identification, better supply chain decision, faster definition of mitigation plan
“The Integrated Business Planning is the evolution of S&OP into a fully integrated management and supply chain collaboration process” – Oliver Wight, White Paper series
12

13
The IBP process is based on a sequence of meetings on local, regional & global levels

14
Constrained Forecast and Best Estimate reflect risks in Unconstrained Forecast
Risks in Unconstrained Forecast
90
70
30
Constrained Forecast
Supply Risk
-10
Unconstrained Forecast
100
80
70
30
Best Estimate Demand Risks &
Opportunities
-20
Unconstrained Forecast
100
Due to e.g. limited capacities, supply chain might not able to completely fulfill the unconstrained forecast
Volumes which potentially cannot be fulfilled are called “Supply Risks” and are deducted from unconstrained forecast
Resulting “Constrained Forecast” is “commitment” from SNO on what they will be able to deliver
70
30
Unconstrained Forecast
Tender Forecast
100
Market Forecast
Forecast by SNO & Commercial based on statistical forecast, historical demand and market outlook
Complemented with demand from specific tender opportunities
Includes demand with medium to high probability (~60-90%)
Does not include demand with very low probability (~30%)
Unconstrained forecast includes volumes which will materialize with medium probability
Volumes which potentially might not materialize are called “Demand Risks & Opportunities” and are deducted from the unconstrained forecast
Resulting “Best Estimate” is “commitment” from Commercial on what they will be able to sell
Starting Point / Baseline: Unconstrained Forecast
Demand Risk Reflection: Best Estimate
Supply Risk Reflection: Constrained Forecast

Consensus Forecast equals minimum of Constrained Forecast and Best Estimate
Breathing space: Our weapon against political forecast
8090
100
Supply Constraint Constrained Forecast
-10
Best Estimate Demand Risks
-20
Unconstrained Forecast
Consensus Forecast
80
Financial Planning
Un/Constrained forecast: “What do we plan for”
Consensus forecast: “What can we commit to”
Breathing space: difference versus the financial commitment (Consensus Fcst) and the forecast used for production (Uncon. or Constrained Fcst)
Gap (<X%) allows development of business beyond current financial commitments
Consensus Forecast
equals minimum of
Constrained Forecast
and Best Estimate
(conservative view)
Maintained in JDA
Maintained in JDA
Calculated in JDA
Maintained in JDA
Calculated in JDA
“Breathing Space”
Calculated in JDA
Financial outlook (monthly) & Financial Forecast (quarterly): F1, F2, F3, OP
Full transparency on forecast and Demand risks / Supply constraints in JDA
Production Planning
15
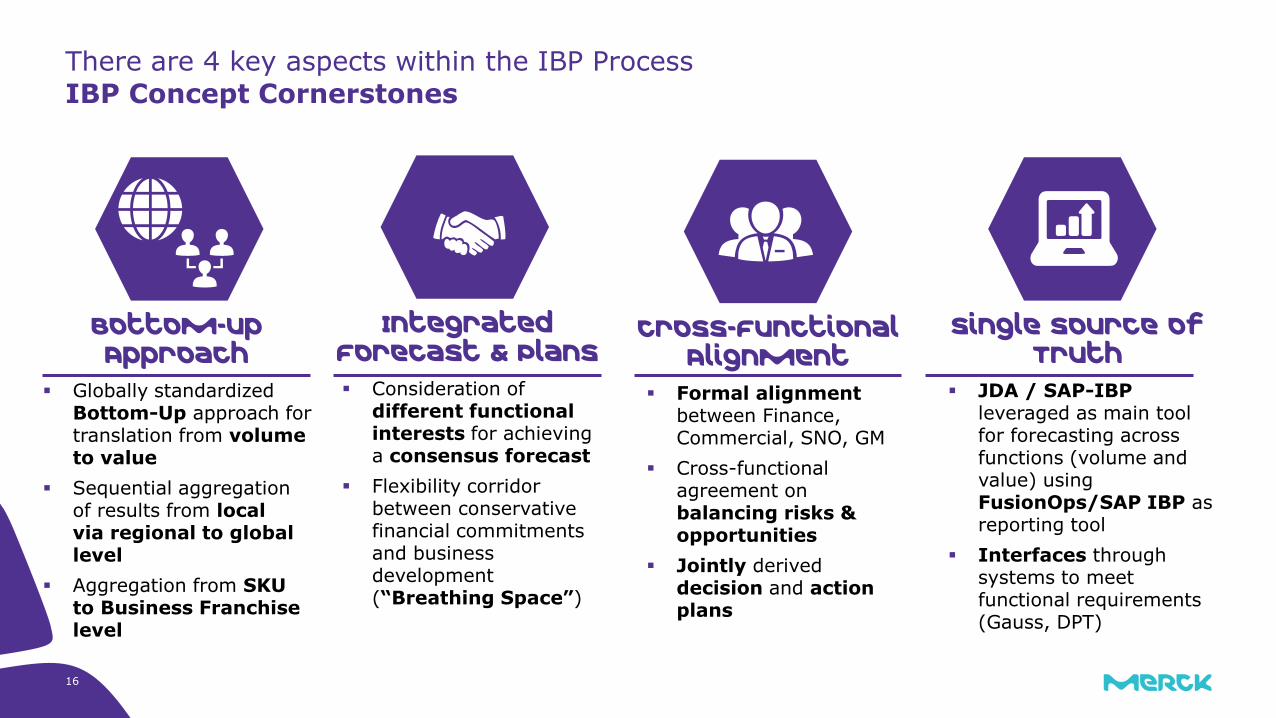
There are 4 key aspects within the IBP Process
IBP Concept Cornerstones
Globally standardized Bottom-Up approach for translation from volume to value
Sequential aggregation of results from local via regional to global level
Aggregation from SKU to Business Franchise level
Formal alignment between Finance, Commercial, SNO, GM
Cross-functional agreement on balancing risks & opportunities
Jointly derived decision and action plans
Consideration of different functional interests for achieving a consensus forecast
Flexibility corridor between conservative financial commitments and business development (“Breathing Space”)
JDA / SAP-IBP leveraged as main tool for forecasting across functions (volume and value) using FusionOps/SAP IBP as reporting tool
Interfaces through systems to meet functional requirements (Gauss, DPT)
Bottom-Up Approach
Cross-Functional Alignment
Integrated Forecast & Plans
Single Source of Truth
16

17
JDA/SAP is leveraged as master tools across functions
Technical Realization of IBP (high-level)
Controlling BW
Actuals in value and quantity
OP 2016
Input
Master tool
JDA leveraged as main tool
Interfaces between JDA and controlling systems
IBP Executive Dashboard available to all functions at local, regional and global levels
Controlling BW Output
F1/F2/F3 Operational Plan 2017
18
Content
Who is Merck ?
IBP concept
Benefits & Key Success Factors
Conclusion
19
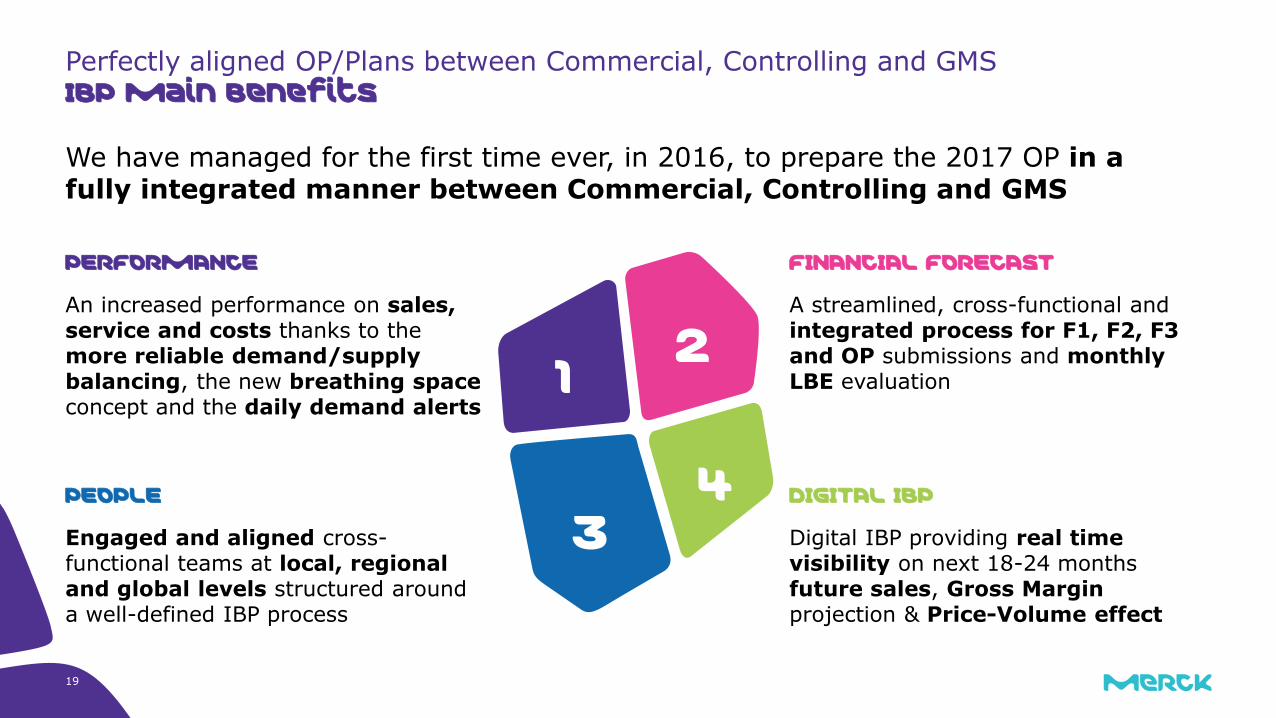
Perfectly aligned OP/Plans between Commercial, Controlling and GMS IBP main Benefits
We have managed for the first time ever, in 2016, to prepare the 2017 OP in a fully integrated manner between Commercial, Controlling and GMS
PEOPLE
Engaged and aligned cross-functional teams at local, regional and global levels structured around a well-defined IBP process
FINANCIAL FORECAST
A streamlined, cross-functional and integrated process for F1, F2, F3 and OP submissions and monthly LBE evaluation
DIGITAL IBP
Digital IBP providing real time visibility on next 18-24 months future sales, Gross Margin projection & Price-Volume effect
1 2
3 4
PERFORMANCE
An increased performance on sales, service and costs thanks to the more reliable demand/supply balancing, the new breathing space concept and the daily demand alerts
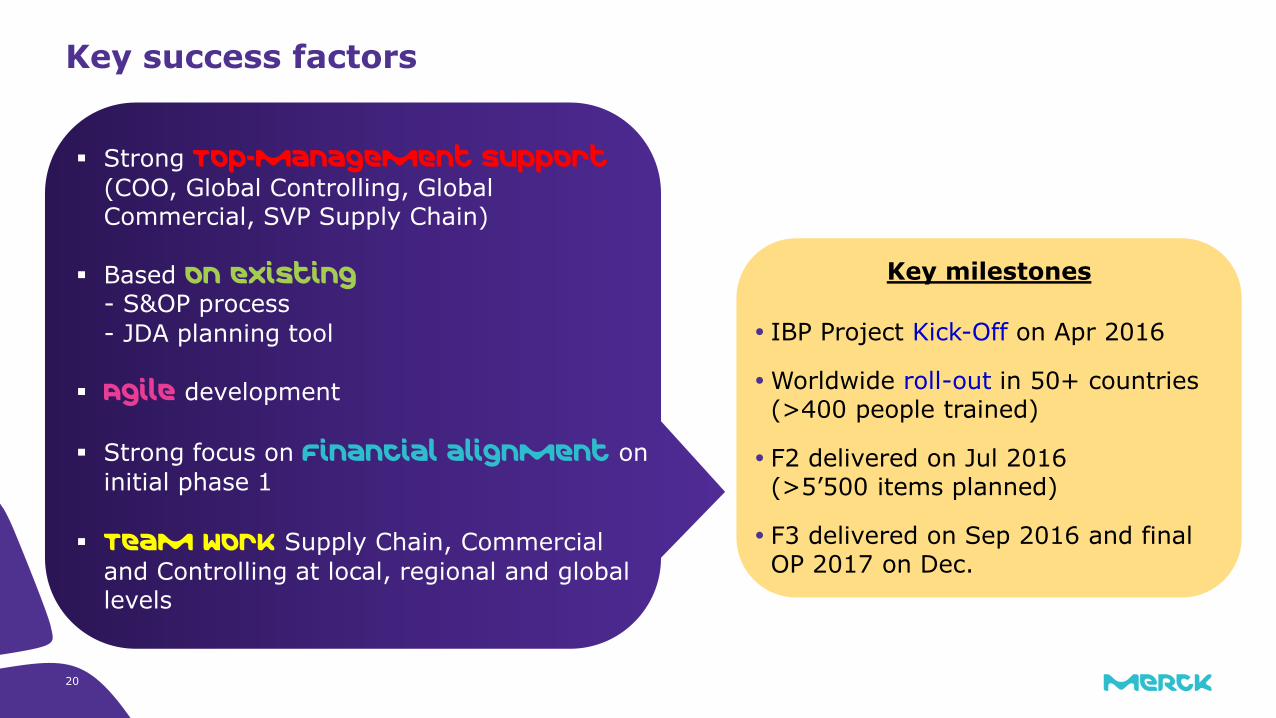
Key success factors
Strong Top-Management support
(COO, Global Controlling, Global Commercial, SVP Supply Chain)
Based on existing - S&OP process - JDA planning tool
Agile development
Strong focus on Financial alignment on
initial phase 1
Team work Supply Chain, Commercial
and Controlling at local, regional and global levels
Key milestones
IBP Project Kick-Off on Apr 2016
Worldwide roll-out in 50+ countries (>400 people trained)
F2 delivered on Jul 2016 (>5’500 items planned)
F3 delivered on Sep 2016 and final OP 2017 on Dec.
20

21
Content
Who is Merck ?
IBP concept
Benefits & Key Success Factors
Conclusion
22
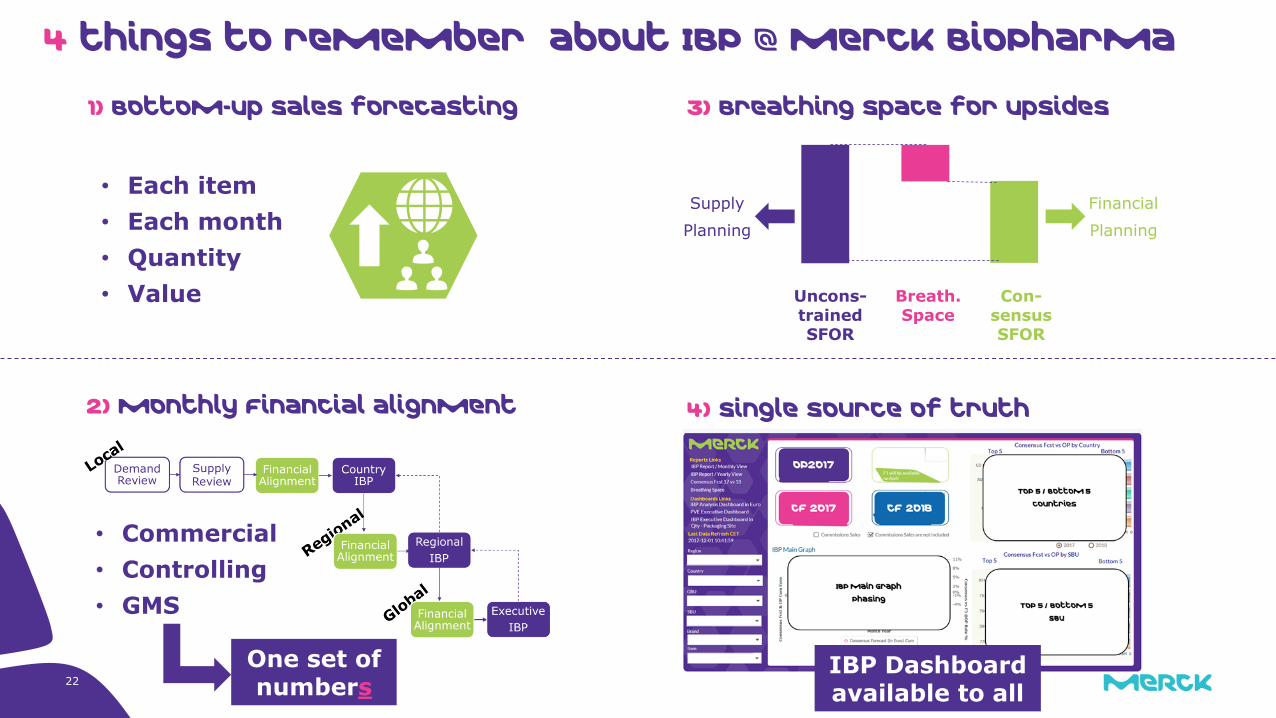
1) Bottom-up sales forecasting
2) Monthly Financial alignment
3) Breathing space for upsides
Supply
Planning
Financial
Planning
4) Single source of truth
• Commercial
• Controlling
• GMS
• Each item
• Each month
• Quantity
• Value Uncons- trained SFOR
Con- sensus SFOR
Breath. Space
4 things to remember about IBP @ Merck BioPharma
IBP Dashboard available to all
One set of numbers

![IBP Southern Luzon3] Southern Luzon.pdf · IBP Southern Luzon Region donates to health offices, BJMPs & frontliners IBP Aurora, Batangas, CalMaNa. Makati, Marinduque, Occidental Mindoro.](https://static.fdocuments.in/doc/165x107/600a54d3b5cfa474cb7da335/ibp-southern-3-southern-luzonpdf-ibp-southern-luzon-region-donates-to-health.jpg)