IBO2010 Practical 4
30
IBO 2010 KOREA PRACTICAL TEST 4 ECOLOGY ____________________________________________________ 1 Student Code: Country Code: The 21 st INTERNATIONAL BIOLOGY OLYMPIAD 11 th – 18 th July, 2010 Changwon, KOREA PRACTICAL TEST 4 ECOLOGY Total Points: 51 Duration: 90 minutes
-
Upload
benjaminvasileniuc -
Category
Documents
-
view
221 -
download
0
Transcript of IBO2010 Practical 4
7/26/2019 IBO2010 Practical 4
http://slidepdf.com/reader/full/ibo2010-practical-4 1/30
IBO 2010 KOREA
PRACTICAL TEST 4
ECOLOGY
________________________________________________________________________________
1
Student Code: ___________Country Code: ___________
The 21st INTERNATIONAL BIOLOGY OLYMPIAD
11th
– 18th
July, 2010
Changwon, KOREA
PRACTICAL TEST 4
ECOLOGY
Total Points: 51
Duration: 90 minutes
7/26/2019 IBO2010 Practical 4
http://slidepdf.com/reader/full/ibo2010-practical-4 2/30
IBO 2010 KOREA
PRACTICAL TEST 4
ECOLOGY
________________________________________________________________________________
2
Dear Participants,
In this test, you have been given the following 4 tasks:
Task I: Characteristics of Coastal Animal Communities (16 points)
Task II: Mark and Recapture Method (8 points)
Task III: Interspecific Interaction (14 points)
Task IV: Prey Choice Model (13 points)
Write down your results and answers in the Answer Sheet. Answers written in the Question
Paper will not be evaluated.
Please make sure that you have received all the materials listed for each task. If any of the listed
items is missing, please raise your hand.
Stop answering and put down your pencil immediately after the end bell rings. The supervisor will
collect the Question Paper and the Answer Sheet.
Good Luck!!
7/26/2019 IBO2010 Practical 4
http://slidepdf.com/reader/full/ibo2010-practical-4 3/30
IBO 2010 KOREA
PRACTICAL TEST 4
ECOLOGY
________________________________________________________________________________
3
TASK I. (16 points) Characteristics of coastal animal communities
Materials Quantity
1. Community model board (40 x 37 cm) 1
2. Transparent quadrat board (37 x 37 cm) 1
3. Electronic calculator 1
Introduction
A population is defined as a group of individuals of a single species inhabiting a specific
area, and a community is a group of populations of different species inhabiting a specific area.
Identification of the characteristics of populations and communities is a basic element in
predicting ecological change due to environmental factors.
Using Calculator
7/26/2019 IBO2010 Practical 4
http://slidepdf.com/reader/full/ibo2010-practical-4 4/30
IBO 2010 KOREA
PRACTICAL TEST 4
ECOLOGY
________________________________________________________________________________
4
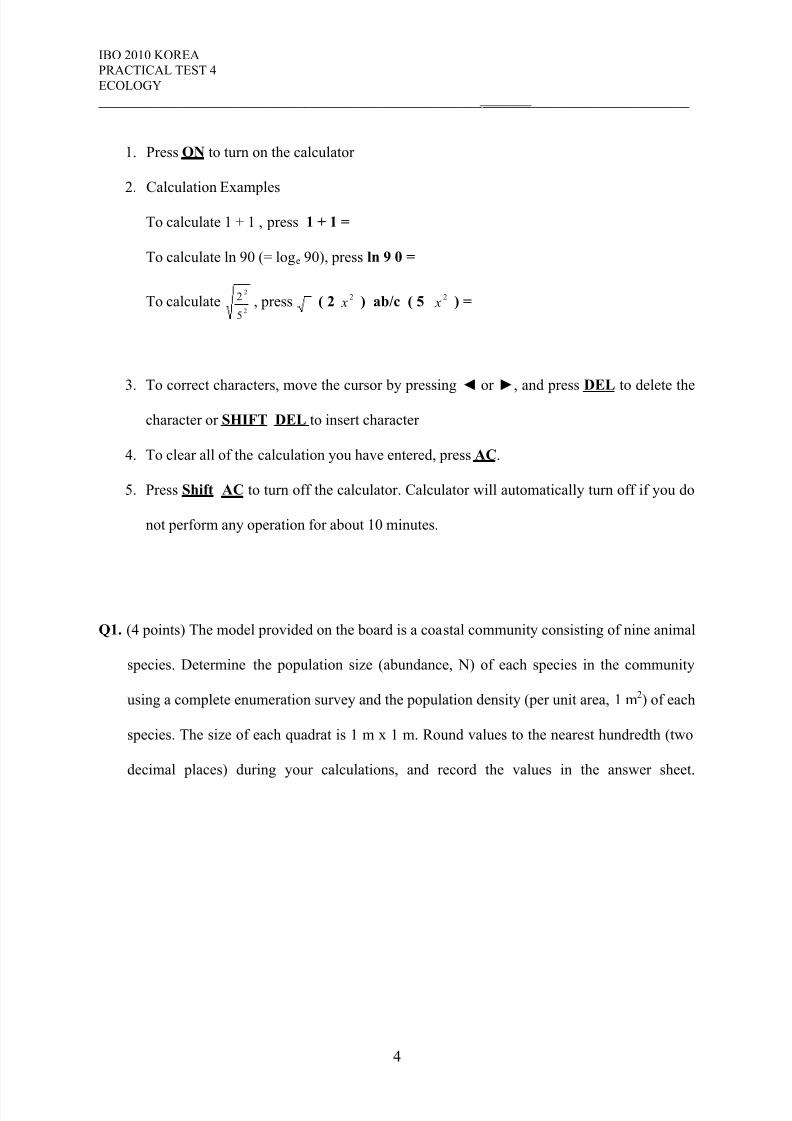
1. Press ON to turn on the calculator
2. Calculation Examples
To calculate 1 + 1 , press 1 + 1 =
To calculate ln 90 (= loge 90), press ln 9 0 =
To calculate2
2
5
2 , press ( 22
x ) ab/c ( 52
x ) =
3.
To correct characters, move the cursor by pressing ◄ or ►, and press DEL to delete the
character or SHIFT DEL to insert character
4. To clear all of the calculation you have entered, press AC.
5. Press Shift AC to turn off the calculator. Calculator will automatically turn off if you do
not perform any operation for about 10 minutes.
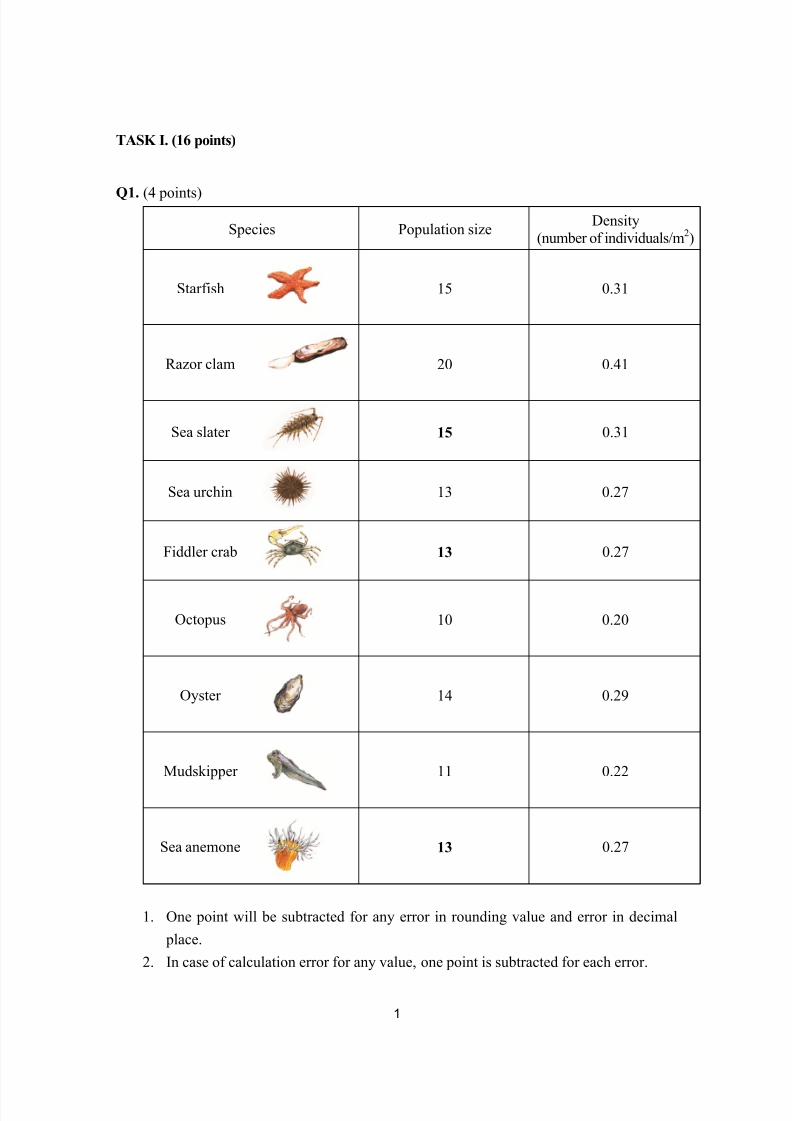
Q1. (4 points) The model provided on the board is a coastal community consisting of nine animal
species. Determine the population size (abundance, N) of each species in the community
using a complete enumeration survey and the population density (per unit area, 1 m2) of each
species. The size of each quadrat is 1 m x 1 m. Round values to the nearest hundredth (two
decimal places) during your calculations, and record the values in the answer sheet.

7/26/2019 IBO2010 Practical 4
http://slidepdf.com/reader/full/ibo2010-practical-4 5/30
IBO 2010 KOREA
PRACTICAL TEST 4
ECOLOGY
________________________________________________________________________________
5
Species Population size
Starfish
Razor clam
Sea slater 15
Sea urchin
Fiddler crab 13
Octopus
Oyster
Mudskipper
Sea anemone 13

7/26/2019 IBO2010 Practical 4
http://slidepdf.com/reader/full/ibo2010-practical-4 6/30
IBO 2010 KOREA
PRACTICAL TEST 4
ECOLOGY
________________________________________________________________________________
6
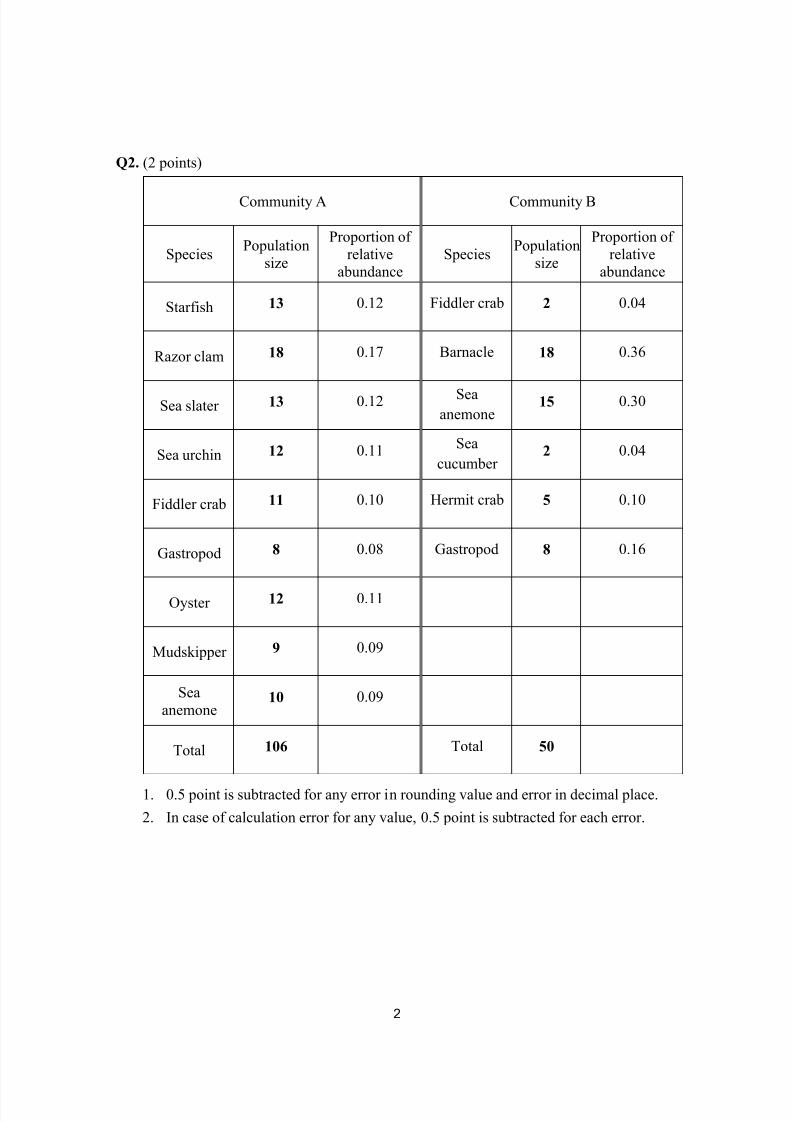
Q2. (2 points) The table below records species’ population sizes in two different coastal
communities. Calculate ‘the proportion of relative abundance’ of each species. Round
values to the nearest hundredth (two decimal places) during your calculations, and record
the values in the answer sheet.
Q3. (4 points) A rank-abundance curve is a chart that displays the species in a community
ordered from most abundant to rare based on relative abundance. Using the relative
abundances you previously calculated (in Q2), make a rank-abundance curve for each
community on the grid-line in the answer sheet. Indicate community A as ‘A’ and
community B as ‘B’ on the curve, and write appropriate titles and scales for the X-axis and
the Y-axis.
Community A Community B
Species Population size Species Population size
Starfish 13 Fiddler crab 2
Razor clam 18 Barnacle 18
Sea slater 13 Sea anemone 15
Sea urchin 12 Sea cucumber 2
Fiddler crab 11 Hermit crab 5
Gastropod 8 Gastropod 8
Oyster 12
Mudskipper 9
Sea anemone 10
Total 106 Total 50

7/26/2019 IBO2010 Practical 4
http://slidepdf.com/reader/full/ibo2010-practical-4 7/30
IBO 2010 KOREA
PRACTICAL TEST 4
ECOLOGY
________________________________________________________________________________
7
Q4. (4 points) Calculate the Shannon-Wiener species diversity index (H ) for each of the two
coastal communities using the following equation. Round values to the nearest hundredth
(two decimal places) during your calculations. Put the values in the box in the answer sheet.
where,
pi = the proportion of the ith species
ln pi = the natural logarithm of pi
n = the number of species in the community
Q5. (1 point) Which statement is/are correct for your rank-abundance curves? Put checkmark(s)
(√) in all appropriate boxes in the answer sheet.
A. Species evenness is higher in community A than in community B.
B. Species evenness is lower in community A than in community B.
C. Species richness is higher in community A than in community B.
D. Species richness is lower in community A than in community B.
Q6. (1 point) Which statement is correct for the species diversity index of the two communities?
Put a checkmark ( ) in the appropriate box in the answer sheet.
A. The area with the higher diversity index (H') should be conserved.
B. The species diversity index (H') indicates the species number inhabiting the coastal area.
C. The species diversity index (H') is inversely proportional to species evenness in an area.
D. The species diversity index (H') depends on both species richness and species evenness.

7/26/2019 IBO2010 Practical 4
http://slidepdf.com/reader/full/ibo2010-practical-4 8/30
IBO 2010 KOREA
PRACTICAL TEST 4
ECOLOGY
________________________________________________________________________________
8
TASK II. (8 points) Mark and recapture method
Materials Quantity
1. Pottery with beads 1
2. Sampling net (100 ml) 1
3. Electronic calculator 1
Introduction
A few individuals are captured, marked and released back into the population. The population is
sampled again and the numbers of marked individuals in this sample counted. Assuming an equal
recapture rate for all individuals and without repetitive counting of the same individual, the
population size can be simply estimated by using a modified Lincoln Index as follows:
N : Estimation of population size
M : Number of individuals marked
S : Number of individuals captured in the second sample
R: Number of marked individuals recaptured
In this task, the pottery represents a pond with a diving beetle population (the beads). One bead
represents one diving beetle. This population contains 40 individuals marked with a red sticker that
had been captured during the first sampling. You will be performing the second sampling of this
population.

7/26/2019 IBO2010 Practical 4
http://slidepdf.com/reader/full/ibo2010-practical-4 9/30
IBO 2010 KOREA
PRACTICAL TEST 4
ECOLOGY
________________________________________________________________________________
9
Q7. (4 points) Using the sampling net, capture a sample of diving beetles from the pond (the second
sampling). Take two full scoops and combine them. (Assume this population does not have birth,
death, emigration, or immigration of individuals between the first and the second sampling events).
Estimate population size to the nearest tenth (one decimal place) and record your result in the
answer sheet.
Q8. (4 points) The mark and recapture method has a degree of uncertainty because it is an estimation
by sampling, not by a total population count. We can measure uncertainty through the calculation
of standard error (SE). Standard error (SE) can be obtained by the function given below.
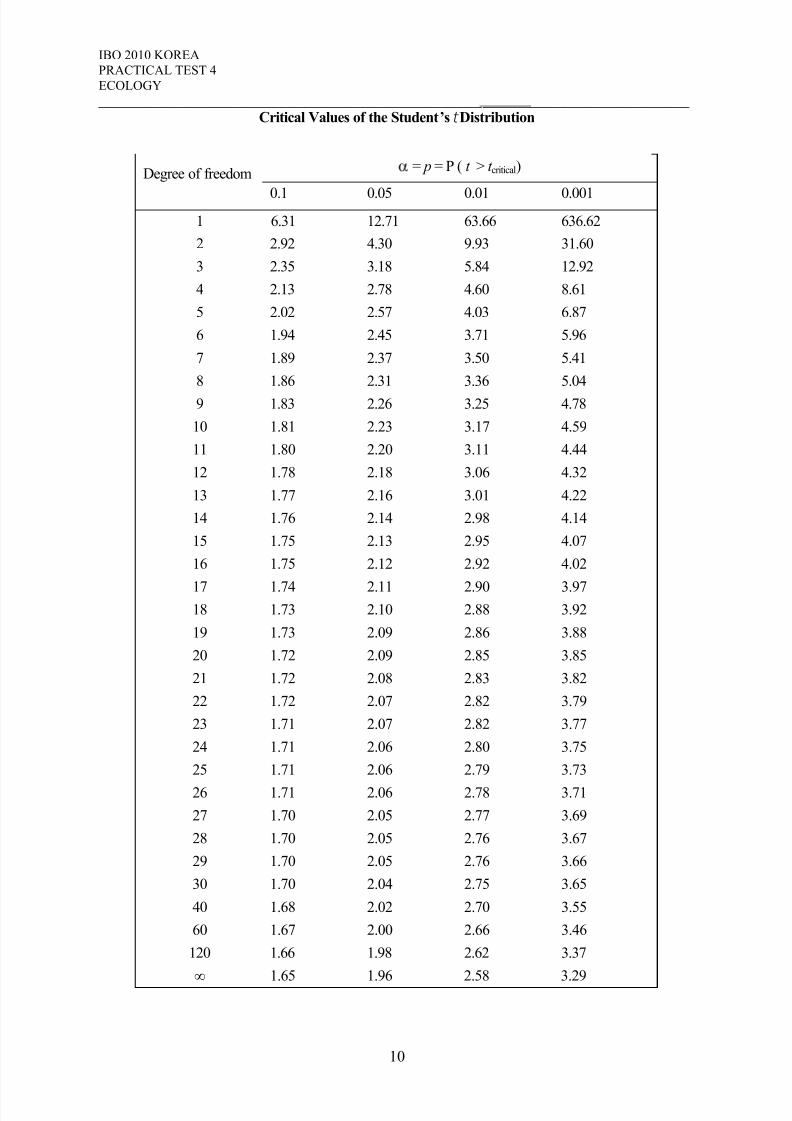
The 95% confidence interval can be obtained by this calculation: N ± t · SE. The 95% confidence
interval means that the size of original population is within the range of the confidence interval with
95% certainty. The t -value is the Student's t - value when the degree of freedom is infinity. (At
infinity, the Student’s t -value is also refer to as Z-value). The critical values of the Student's t
distribution are provided.
Find the appropriate t in the table and calculate SE and the 95 % confidence interval for your
estimate of population size. Enter the numbers you obtain in the table in the answer sheet. Round
your value to the nearest hundredth (two decimal places) during your calculations and record
your values in the answer sheet.
7/26/2019 IBO2010 Practical 4
http://slidepdf.com/reader/full/ibo2010-practical-4 10/30
IBO 2010 KOREA
PRACTICAL TEST 4
ECOLOGY
________________________________________________________________________________
10
Critical Values of the Student’s t Distribution
Degree of freedom= p = P ( t > t critical)
0.1 0.05 0.01 0.001
1 6.31 12.71 63.66 636.62
2 2.92 4.30 9.93 31.60
3 2.35 3.18 5.84 12.92
4 2.13 2.78 4.60 8.61
5 2.02 2.57 4.03 6.87
6 1.94 2.45 3.71 5.96
7 1.89 2.37 3.50 5.41
8 1.86 2.31 3.36 5.04
9 1.83 2.26 3.25 4.78
10 1.81 2.23 3.17 4.59
11 1.80 2.20 3.11 4.44
12 1.78 2.18 3.06 4.32
13 1.77 2.16 3.01 4.22
14 1.76 2.14 2.98 4.14
15 1.75 2.13 2.95 4.07
16 1.75 2.12 2.92 4.02
17 1.74 2.11 2.90 3.9718 1.73 2.10 2.88 3.92
19 1.73 2.09 2.86 3.88
20 1.72 2.09 2.85 3.85
21 1.72 2.08 2.83 3.82
22 1.72 2.07 2.82 3.79
23 1.71 2.07 2.82 3.77
24 1.71 2.06 2.80 3.75
25 1.71 2.06 2.79 3.73
26 1.71 2.06 2.78 3.71
27 1.70 2.05 2.77 3.69
28 1.70 2.05 2.76 3.67
29 1.70 2.05 2.76 3.66
30 1.70 2.04 2.75 3.65
40 1.68 2.02 2.70 3.55
60 1.67 2.00 2.66 3.46
120 1.66 1.98 2.62 3.37
∞ 1.65 1.96 2.58 3.29
7/26/2019 IBO2010 Practical 4
http://slidepdf.com/reader/full/ibo2010-practical-4 11/30
IBO 2010 KOREA
PRACTICAL TEST 4
ECOLOGY
________________________________________________________________________________
11
TASK III. (14 points) Interspecific interaction
Materials Quantity
1. Two species model board (30 32 cm) 1
2. Transparent quadrat board (30 30 cm) 1
3. Electronic calculator 1
Introduction
Spiral shellfishes and clams live in the same habitat. In order to know whether there is an
interaction between these two species, we examine the distribution of each species in that habitat.
Q9. (2 points) Using the given quadrat board, observe whether the spiral shellfish and the clam are
absent and/or present in each quadrat. Write the number of quadrats you have observed in the box
in the answer sheet.
Q10. (2 points) The significance of the species’ distributions measured in this habitat can be examined
by using the Chi-square (χ 2) test. The null hypothesis for the χ 2 test in this situation is that the
distribution of each species:
A. is nonrandom.
B. is independent of each other.
C. shows a mutually negative influence.
D. shows a mutually positive influence.
E. is influenced by a third species.
Put a checkmark ( ) in the appropriate box in the answer sheet.

7/26/2019 IBO2010 Practical 4
http://slidepdf.com/reader/full/ibo2010-practical-4 12/30
IBO 2010 KOREA
PRACTICAL TEST 4
ECOLOGY
________________________________________________________________________________
12
Q11. (4 points) To perform the χ 2 test, first determine the expected counts for each observational class.
For example, the expected counts of quadrats where both species are present is calculated by
multiplying the number of quadrats where one species is present with the number of quadrats
where the other species is present divided by the total number of quadrats. Compute the other
expected counts similarly to the nearest tenths (one decimal place) and fill the table in the answer
sheet.
Q12. (2 points) Using the function below, calculate the χ 2 value for this data set. Record your value to
the nearest hundredth (two decimal places) in the answer sheet.
Q13. (1 point) In order to evaluate the Chi-square value (χ 2
), the degree of freedom for the data set must
be determined (df ). What is the degree of freedom for this data set? Record the value in the answer
sheet.
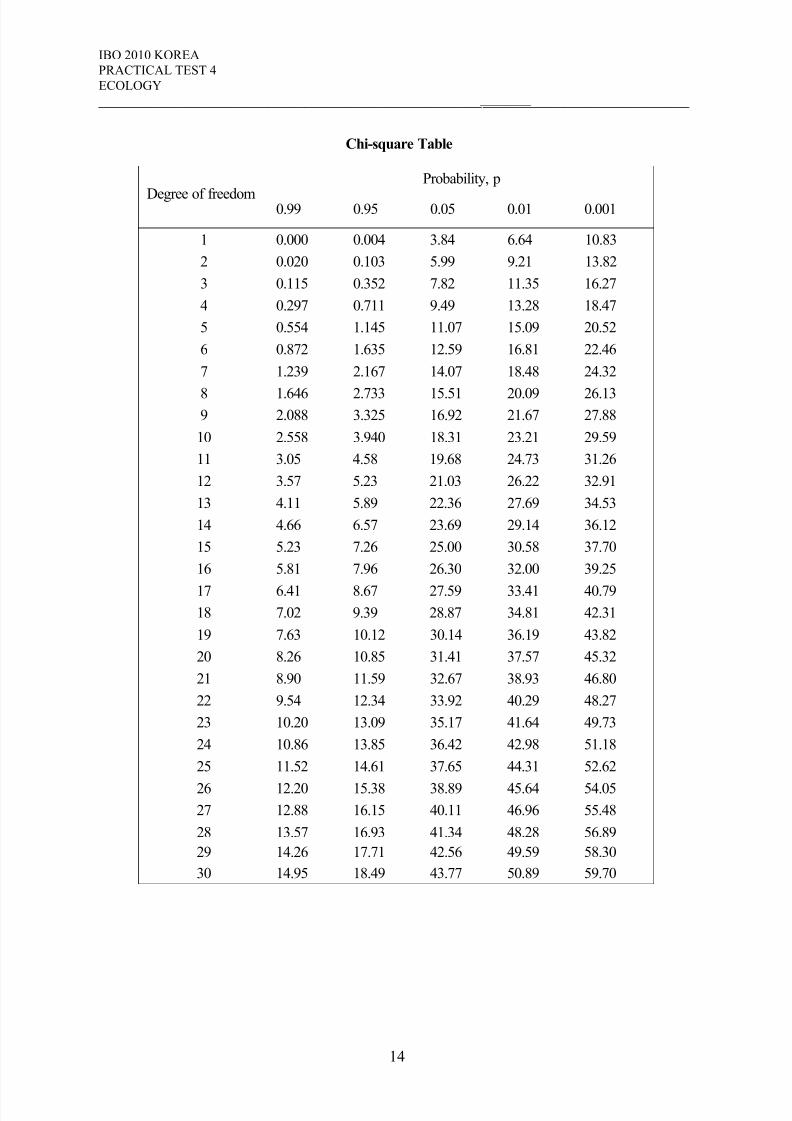
Q14. (2 points) Decide whether to reject or not reject the null hypothesis using the significance level
(probability, p) of 0.05. In the given χ 2 table, locate the degree of freedom in the appropriate
column. Compare your calculated χ 2 test statistic to the tabular χ 2 value to make your decision. Put
a checkmark ( ) in the appropriate box in the answer sheet.
7/26/2019 IBO2010 Practical 4
http://slidepdf.com/reader/full/ibo2010-practical-4 13/30
IBO 2010 KOREA
PRACTICAL TEST 4
ECOLOGY
________________________________________________________________________________
13
Q15. (1 point) Considering the spatial pattern of the distribution, what kind of interactionis likely to be
taking place between the two species? Choose all possible options and put a checkmark ( ) in the
appropriate box in the answer sheet.
A. No interaction
B. Commensalism
C. Competition
D. Parasitism
E. Exclusion
7/26/2019 IBO2010 Practical 4
http://slidepdf.com/reader/full/ibo2010-practical-4 14/30
IBO 2010 KOREA
PRACTICAL TEST 4
ECOLOGY
________________________________________________________________________________
14
Chi-square Table
Degree of freedom
Probability, p
0.99 0.95 0.05 0.01 0.001
1 0.000 0.004 3.84 6.64 10.83
2 0.020 0.103 5.99 9.21 13.82
3 0.115 0.352 7.82 11.35 16.27
4 0.297 0.711 9.49 13.28 18.47
5 0.554 1.145 11.07 15.09 20.52
6 0.872 1.635 12.59 16.81 22.46
7 1.239 2.167 14.07 18.48 24.32
8 1.646 2.733 15.51 20.09 26.139 2.088 3.325 16.92 21.67 27.88
10 2.558 3.940 18.31 23.21 29.59
11 3.05 4.58 19.68 24.73 31.26
12 3.57 5.23 21.03 26.22 32.91
13 4.11 5.89 22.36 27.69 34.53
14 4.66 6.57 23.69 29.14 36.12
15 5.23 7.26 25.00 30.58 37.70
16 5.81 7.96 26.30 32.00 39.25
17 6.41 8.67 27.59 33.41 40.79
18 7.02 9.39 28.87 34.81 42.31
19 7.63 10.12 30.14 36.19 43.82
20 8.26 10.85 31.41 37.57 45.32
21 8.90 11.59 32.67 38.93 46.80
22 9.54 12.34 33.92 40.29 48.27
23 10.20 13.09 35.17 41.64 49.73
24 10.86 13.85 36.42 42.98 51.18
25 11.52 14.61 37.65 44.31 52.62
26 12.20 15.38 38.89 45.64 54.05
27 12.88 16.15 40.11 46.96 55.48
28 13.57 16.93 41.34 48.28 56.89
29 14.26 17.71 42.56 49.59 58.30
30 14.95 18.49 43.77 50.89 59.70
7/26/2019 IBO2010 Practical 4
http://slidepdf.com/reader/full/ibo2010-practical-4 15/30
IBO 2010 KOREA
PRACTICAL TEST 4
ECOLOGY
________________________________________________________________________________
15
TASK IV. (13 points) Prey choice model
Materials
Quantity
1. Prey model board (22 24 cm) 2
2. Electronic calculator 1
Introduction
A foraging animal encounters various types of prey items. Each type of prey can be characterized
by its energy content (E), the time required to search for that prey (searching time, Ts), and the time
required to capture and consume it (handling time, Th). Therefore, we can measure prey profitability
by the function E/(Ts+Th). In this situation, according to optimality theory, natural selection would
favor behaviors that maximize an animal’s net energy intake per amount of foraging time.
The behavioral options for a forager are whether to accept or to reject an item of a given prey type
when it is encountered. Assume that there are two kinds of prey item, Type 1 and Type 2. Let the
profitability be higher for Type 1 — that is, E1/(Ts1+Th1) > E2/(Ts2+Th2). Thus, Type 1 items should
always be accepted. Prey profitability is density-dependant. That is, profitability of a prey species
changes if the prey species becomes less abundant.
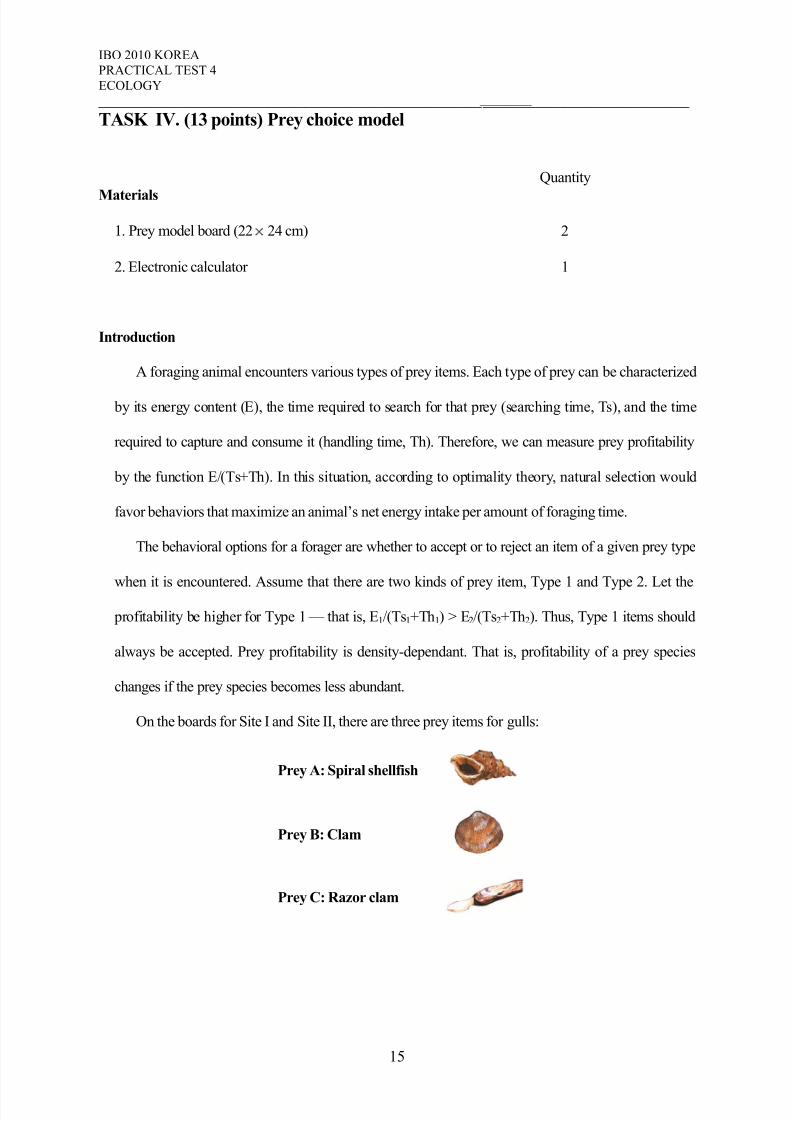
On the boards for Site I and Site II, there are three prey items for gulls:
Prey A: Spiral shellfish
Prey B: Clam
Prey C: Razor clam

7/26/2019 IBO2010 Practical 4
http://slidepdf.com/reader/full/ibo2010-practical-4 16/30
IBO 2010 KOREA
PRACTICAL TEST 4
ECOLOGY
________________________________________________________________________________
16
Q16. (2 points) For Site I, record the density of each of the prey species A, B, C (number of individuals
per m2, assuming that each quadrat is 1m x 1m). Calculate searching time (Ts) for each of the prey
species, where the species-specific searching time at density = 1 has been provided. Ts=
(1/density)·a (sec). The value ‘a’ is a species-specific constant. Calculate the values to nearest
hundredth (two decimal places).
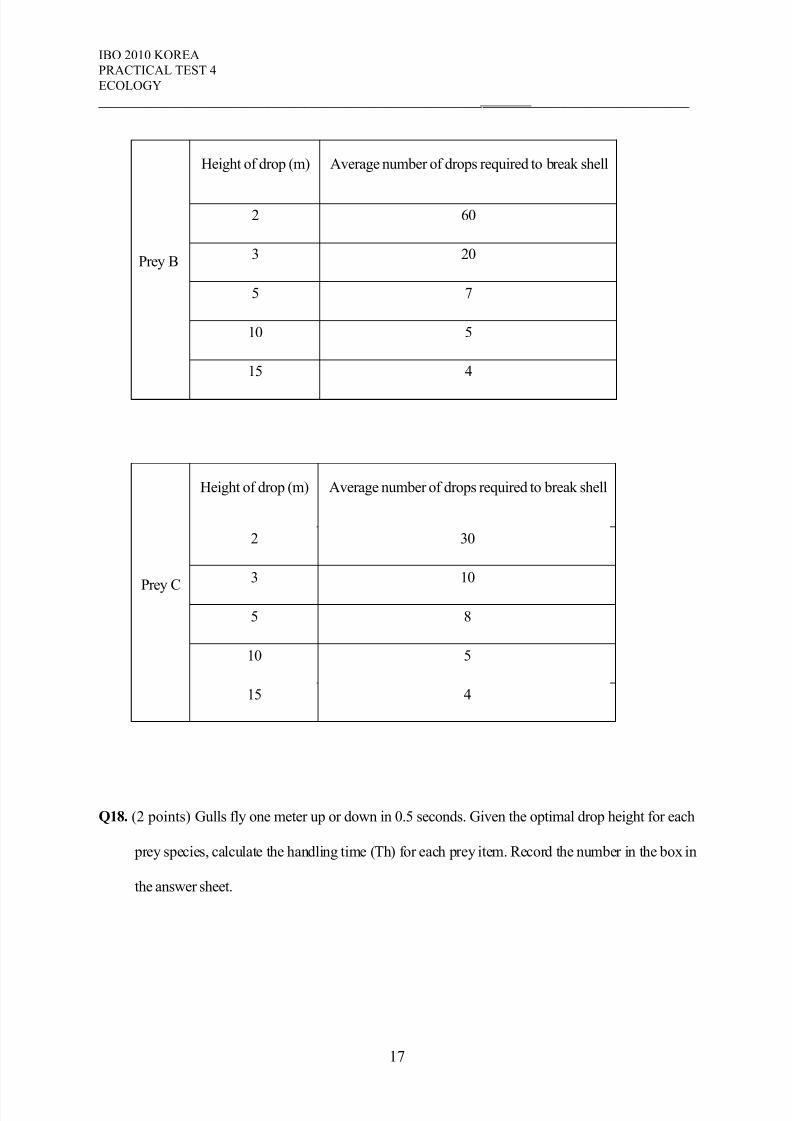
Q17. (2 points) After capturing a prey item, gulls fly high and drop the item to break its shell. The
forager repeats the behavior if the shell does not break. The table below indicates the drop height
and the average number of drops required at that height to break the prey’s shell. For each prey
type, indicate with a checkmark ( ), in the answer sheet, the optimal drop height that gulls should
choose, if they are optimal foragers.
Prey species
Ts (sec)
when the prey density is 1
Prey A 10
Prey B 15
Prey C 5
Prey A
Height of drop (m) Average number of drops required to break shell
2 60
3 40
5 20
10 8
15 7
7/26/2019 IBO2010 Practical 4
http://slidepdf.com/reader/full/ibo2010-practical-4 17/30
IBO 2010 KOREA
PRACTICAL TEST 4
ECOLOGY
________________________________________________________________________________
17
Q18. (2 points) Gulls fly one meter up or down in 0.5 seconds. Given the optimal drop height for each
prey species, calculate the handling time (Th) for each prey item. Record the number in the box in
the answer sheet.
Prey B
Height of drop (m) Average number of drops required to break shell
2 60
3 20
5 7
10 5
15 4
Prey C
Height of drop (m) Average number of drops required to break shell
2 30
3 10
5 8
10 5
15 4

7/26/2019 IBO2010 Practical 4
http://slidepdf.com/reader/full/ibo2010-practical-4 18/30
IBO 2010 KOREA
PRACTICAL TEST 4
ECOLOGY
________________________________________________________________________________
18
Q19. (3 points) The table below lists the average energy gain from eating an individual of each prey
species (kilojoules (KJ) per prey). Calculate the profitability of each prey species at Site I to the
nearest hundredth (two decimal places), and record the number in the box in the answer sheet.
Q20. (2 points) Of the following choices, what would be the optimal decision for the gulls at site I? Put
a checkmark ( ) in the most appropriate box in the answer sheet.
A. Eat all of prey A.
B. Eat all of prey B.
C. Eat all of prey C.
D. Eat prey A at first and then switch to prey B.
E. Eat prey B at first and then switch to prey C.
Prey species Energy (KJ per prey)
Prey A 7
Prey B 25
Prey C 5

7/26/2019 IBO2010 Practical 4
http://slidepdf.com/reader/full/ibo2010-practical-4 19/30
IBO 2010 KOREA
PRACTICAL TEST 4
ECOLOGY
________________________________________________________________________________
19
Q21. (2 points) A gull finds an item of prey C in Site II. The gull can, however, decide not to take
this item and fly to Site I where it can search for prey B. Given that Site I requires 50
seconds of flying time from Site II, what should the gull do in order to maximize the
profitability of the next prey item, if it is an optimal forager? Distribution of the prey items in
Site II has been provided to you. Put a checkmark ( ) in the most appropriate box in the answer
sheet.
A. The gull will eat the prey C in Site II.
B. The gull will move to Site I to search for prey B.
C. The gull will search for prey B in Site II.
D. The gull will move to site I to search for prey C.
E. The gull will search for prey A in Site II.

7/26/2019 IBO2010 Practical 4
http://slidepdf.com/reader/full/ibo2010-practical-4 20/30
0
PRACTICAL TEST 4Answer Key
ECOLOGY
Total Points: 51
Duration: 90 minutes
7/26/2019 IBO2010 Practical 4
http://slidepdf.com/reader/full/ibo2010-practical-4 21/30
1
TASK I. (16 points)
Q1. (4 points)
Species Population sizeDensity
(number of individuals/m2)
Starfish 15 0.31
Razor clam 20 0.41
Sea slater 15 0.31
Sea urchin 13 0.27
Fiddler crab 13 0.27
Octopus 10 0.20
Oyster 14 0.29
Mudskipper 11 0.22
Sea anemone 13 0.27
1. One point will be subtracted for any error in rounding value and error in decimal
place.
2. In case of calculation error for any value, one point is subtracted for each error.
7/26/2019 IBO2010 Practical 4
http://slidepdf.com/reader/full/ibo2010-practical-4 22/30
2
Q2. (2 points)
Community A Community B
SpeciesPopulation
size
Proportion of
relative
abundance
SpeciesPopulation
size
Proportion of
relative
abundance
Starfish 13 0.12 Fiddler crab 2 0.04
Razor clam 18 0.17 Barnacle 18 0.36
Sea slater 13 0.12 Seaanemone
15 0.30
Sea urchin 12 0.11Sea
cucumber2 0.04
Fiddler crab 11 0.10 Hermit crab 5 0.10
Gastropod 8 0.08 Gastropod 8 0.16
Oyster 12 0.11
Mudskipper 9 0.09
Sea
anemone10 0.09
Total 106 Total 50
1.
0.5 point is subtracted for any error in rounding value and error in decimal place.
2. In case of calculation error for any value, 0.5 point is subtracted for each error.

7/26/2019 IBO2010 Practical 4
http://slidepdf.com/reader/full/ibo2010-practical-4 23/30
3
Q3. (4 points)
1. Full points will be given for marks on the appropriate curve, and appropriate titles
and scales for the X-axis and the Y-axis.
2. For incorrect marks or no marks and scales, 2 points are subtracted.
7/26/2019 IBO2010 Practical 4
http://slidepdf.com/reader/full/ibo2010-practical-4 24/30
4
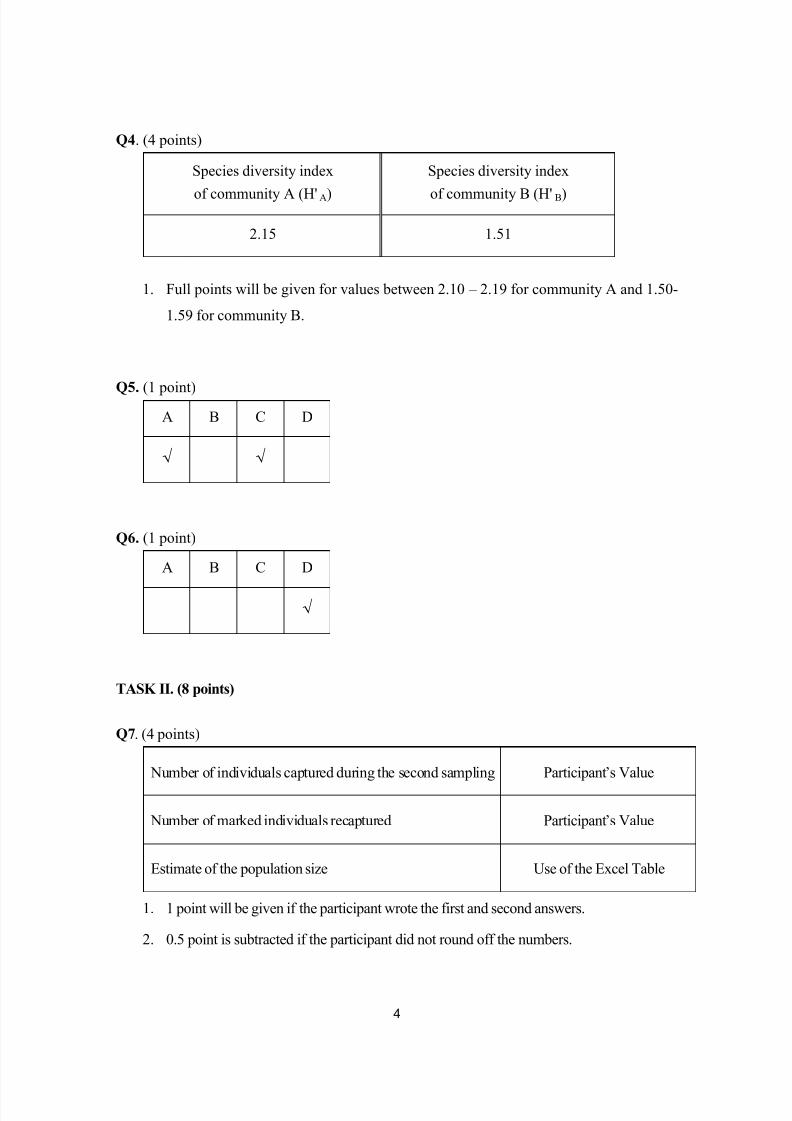
Q4. (4 points)
Species diversity index
of community A (H' A)
Species diversity index
of community B (H' B)
2.15 1.51
1.
Full points will be given for values between 2.10 – 2.19 for community A and 1.50-
1.59 for community B.
Q5. (1 point)
A B C D
√ √
Q6. (1 point)
A B C D
√
TASK II. (8 points)
Q7. (4 points)
Number of individuals captured during the second sampling Participant’s Value
Number of marked individuals recaptured Participant’s Value
Estimate of the population size Use of the Excel Table
1.
1 point will be given if the participant wrote the first and second answers.
2. 0.5 point is subtracted if the participant did not round off the numbers.
7/26/2019 IBO2010 Practical 4
http://slidepdf.com/reader/full/ibo2010-practical-4 25/30
5
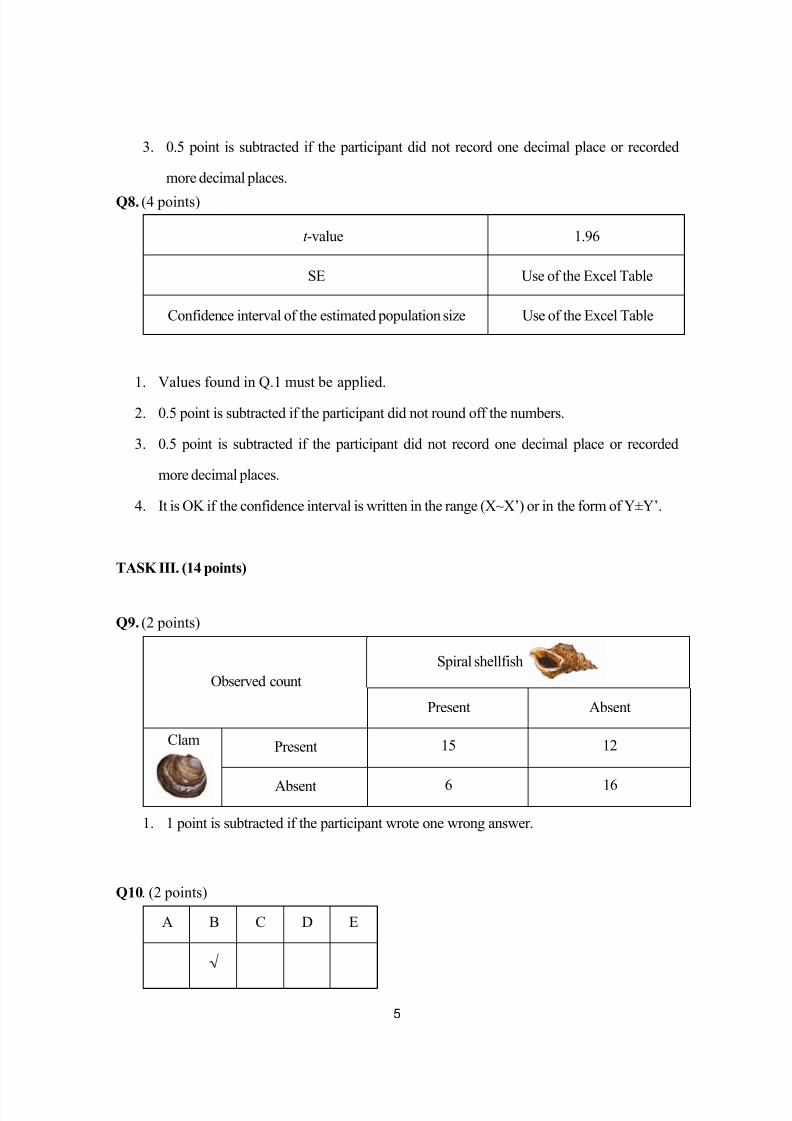
3. 0.5 point is subtracted if the participant did not record one decimal place or recorded
more decimal places.
Q8. (4 points)
1.
Values found in Q.1 must be applied.
2. 0.5 point is subtracted if the participant did not round off the numbers.
3. 0.5 point is subtracted if the participant did not record one decimal place or recorded
more decimal places.
4. It is OK if the confidence interval is written in the range (X~X’) or in the form of Y±Y’.
TASK III. (14 points)
Q9. (2 points)
Observed count
Spiral shellfish
Present Absent
Clam Present 15 12
Absent 6 16
1. 1 point is subtracted if the participant wrote one wrong answer.
Q10. (2 points)
A B C D E
√
t -value 1.96
SE Use of the Excel Table
Confidence interval of the estimated population size Use of the Excel Table

7/26/2019 IBO2010 Practical 4
http://slidepdf.com/reader/full/ibo2010-practical-4 26/30
6
1. Plural choice is null.
7/26/2019 IBO2010 Practical 4
http://slidepdf.com/reader/full/ibo2010-practical-4 27/30
7
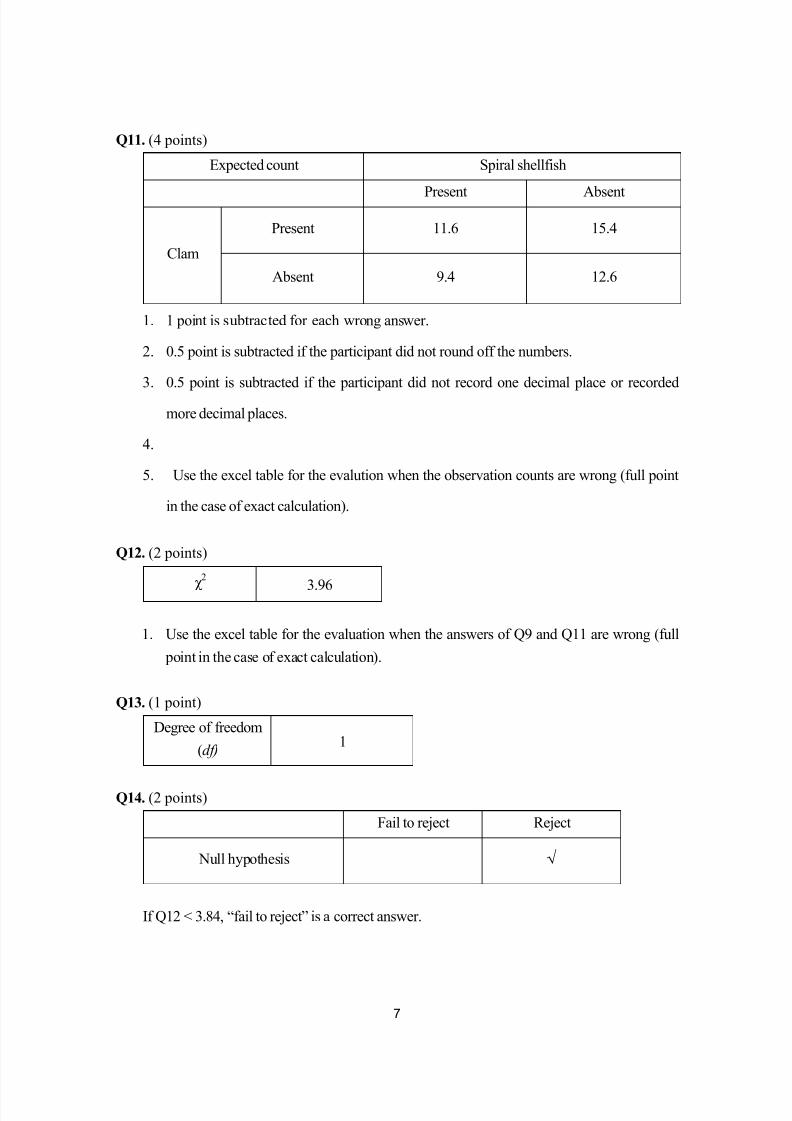
Q11. (4 points)
Expected count Spiral shellfish
Present Absent
Clam
Present 11.6 15.4
Absent 9.4 12.6
1.
1 point is subtracted for each wrong answer.
2. 0.5 point is subtracted if the participant did not round off the numbers.
3.
0.5 point is subtracted if the participant did not record one decimal place or recorded
more decimal places.
4.
5. Use the excel table for the evalution when the observation counts are wrong (full point
in the case of exact calculation).
Q12. (2 points)
χ
2
3.96
1. Use the excel table for the evaluation when the answers of Q9 and Q11 are wrong (full
point in the case of exact calculation).
Q13. (1 point)
Degree of freedom
(df) 1
Q14. (2 points)
Fail to reject Reject
Null hypothesis √
If Q12 < 3.84, “fail to reject” is a correct answer.

7/26/2019 IBO2010 Practical 4
http://slidepdf.com/reader/full/ibo2010-practical-4 28/30
8
Q15. (1 point)
1. 1 point is obtained if the participant chose only B or D.
2. If answer of Q14 is “fail to reject”, correct answer is “A”
TASK IV. (13 points)
Q16. (2 points)
Prey speciesDensity
(number of individuals/m2)
Ts (sec)
when the prey density is 1
Ts (sec)
at the Site I
Prey A 1.00 10 10
Prey B 0.75 15 20
Prey C 0.50 5 10
1.
0.5 point is subtracted if the participant did not round off the numbers.
2. 0.5 point is subtracted if the participant did not record one decimal place or recorded
more decimal places.
3. 1 point is subtracted if the participant wrote one wrong answer.
Q17. (2 points)
A B C D E
√
√
Prey A
Height of drop
(m)
Average number of drops
required to break shellOptimal height for handling
2 60
3 40
5 20
10 8 √
7/26/2019 IBO2010 Practical 4
http://slidepdf.com/reader/full/ibo2010-practical-4 29/30
9
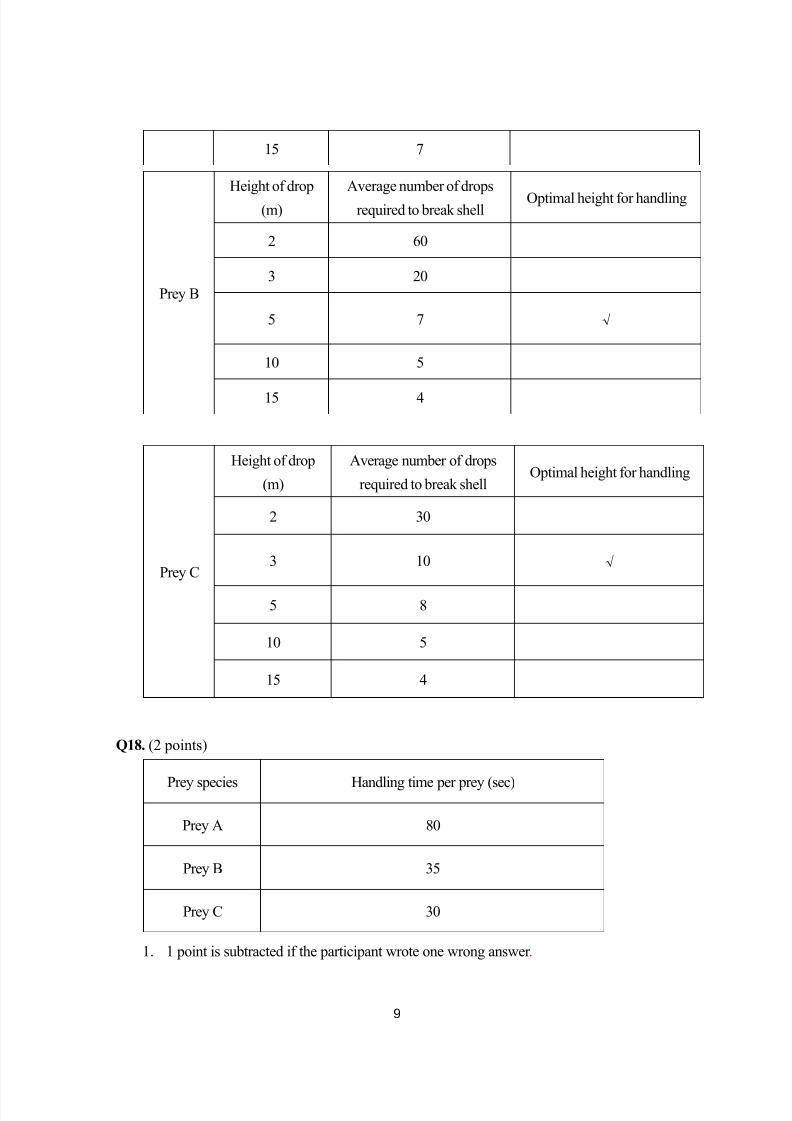
Prey C
Height of drop
(m)
Average number of drops
required to break shellOptimal height for handling
2 30
3 10 √
5 8
10 5
15 4
Q18. (2 points)
Prey species Handling time per prey (sec)
Prey A 80
Prey B 35
Prey C 30
1. 1 point is subtracted if the participant wrote one wrong answer .
15 7
Prey B
Height of drop
(m)
Average number of drops
required to break shellOptimal height for handling
2 60
3 20
5 7 √
10 5
15 4

7/26/2019 IBO2010 Practical 4
http://slidepdf.com/reader/full/ibo2010-practical-4 30/30
10
Q19. (3 points)
Prey speciesEnergy
(KJ per prey)Prey profitability
Prey A 7 0.08
Prey B 25 0.45
Prey C 5 0.13
1. 1 point is subtracted if the participant wrote one wrong answer.
2. 0.5 point is subtracted if the participant did not round off the numbers.
3.
0.5 point is subtracted if the participant did not record one decimal place or recorded
more decimal places.
4.
Use the excel table for the evaluation using answers of Q16 and Q18 (full point in the
case of exact calculation).
Q20. (2 points)
Q21. (2 points)
Plural choice is null.
A B C D E
√
A B C D E
√