IBM’s unique capabilities for the telecommunications industry
12
Highlights Report IBM Global Business Services Telecommunications Industry IBM Institute for Business Value The influence of social New views from the 2014 IBM Global Telecommunications Consumer Survey
Transcript of IBM’s unique capabilities for the telecommunications industry

Highlights ReportIBM Global Business Services Telecommunications Industry
IBM Institute for Business Value
The influence of socialNew views from the 2014 IBM Global Telecommunications Consumer Survey

IBM’s unique capabilities for the telecommunications industryIBM has more than 22,000 subject matter experts working in the Telecommunications industry, delivering solutions to more than 200 major communications service providers across the globe. IBM’s telecommunications capabilities are backed by an extensive global network of telecom solution labs, research areas and innovation centers to support its offerings in the area of analytics, cloud, mobility, network optimization, digital transformation and global integration. IBM continues to invest significantly in key acquisitions to add expertise and capabilities that enable its clients in thetelecommunications space.

IBM Global Business Services 1
The IBM Institute for Business Value conducted a survey of close to 22,000 consumers in 35 countries in both mature and emerging markets: Australia, Belgium, Brazil, Canada, China, Denmark, Egypt, Finland, France, Germany, Greece, India, Indonesia, Ireland, Italy, Japan, Kenya, Malaysia, Mexico, the Netherlands, New Zealand, Nigeria, Norway, Philippines, Poland, Russia, Saudi Arabia, South Africa, Spain, Sweden, Thailand, Turkey, the United Arab Emirates, the United Kingdom and the United States. The survey covered a wide variety of topics, including consumers’ expected spending priorities for the next two years, daily use of various communication services, adoption of communication products, information sources for products and services, attitudes toward communications service providers (CSPs), customer experience/loyalty issues and attitudes about privacy.
Study results reveal that the rapid spread of social conversation channels from giants such as Facebook and Google not only are offering alternative communication options, but also providing con-sumers with a way to seize control of CSPs’ reputations – and even some business decisions. These channels have put even more power into the hands of consumers who not only make empowered choices, but also influence others and strongly shape brand perceptions.
In this summary report, we provide a glimpse of the plethora of information consumers revealed about their communications-related experiences, attitudes and behavior patterns.
More than half of consumers use social media as a source of information to evaluate CSPs and their products/services.
The key findings from our most recent global telecommunications consumer survey can be summed up in two words: Social disruption. The study clearly validates the population of social networking, instant messaging, microblogs, Internet video and other over-the-top (OTT) communication applications. In addition, it underscores the challenges new conversation channels create for communication service providers (CSPs). However, it also reveals important information about consumers’ spending priorities, how they make provider-related decisions, their loyalty triggers and more. CSPs can use this information to drive brand passion and develop new strategies for top-notch customer service – including more self-service options. In addition, CSPs can take advantage of consumers’ willingness to collaborate on product and service improvements – and use the rising popularity of social media to do so.
Less than half of consumers contact their CSP when they have a negative experience.
A higher percentage, 40 percent, of consumers always/often tell family, friends and peers about negative provider experiences.
However, consumers also share good news about CSPs: More than half always/often tell family, friends and peers about positive experiences.
56%
38%
40%
53%

2 The influence of social
instance, 47 percent of the respondents plan to decrease spending on mobile communications in the next two to three years; in Spain, Italy and Ireland, these figures are between 23 and 31 percent. Only 7 to 14 percent of the consumers in these countries expect to increase spending on mobile communications services.
• In the mature countries, the negative trend is also evident in the other communications categories – fixed telephony and fixed broadband – reflecting that consumer confidence in many countries lags behind economic recovery.
Where additional spend is expected – in particular in the emerging countries – CSPs should develop strategies to capture it. On the other hand, in countries where consumers expect to decrease spending on telecommunication services, CSPs should determine the best strategies to limit revenue or profit loss as much as possible.
Pockets of growth in emerging marketsThe survey reveals that consumer confidence at a global level is slowly growing. However, an anticipated rise in consumer spending in the next two to three years is driven primarily by the emerging markets, mainly due to growing population, rising incomes and urbanization. This is true in particular for spending on mobile communications services:
• In emerging markets, 36 percent of consumers surveyed expect to increase spending on mobile phone usage, while only 13 percent expect to decrease spending, for a net increase of 23 percent as depicted in Figure 1. The highest expected increases in spending can be found in India, China, Kenya and Nigeria.
• In contrast, in the mature markets, there are still more people who expect to decrease spending on mobile communications (16 percent) than there are those who expect to increase spending (14 percent). In Greece, for
Figure 1: Consumer spending changes 2014-2016.
Source: 2014 IBM Global Telecommunications Consumer Survey. Note: Question - Compared to previous years, are you likely to spend less, the same or more on the following products/services in the next 2-3 years?
28%
26%
23%
22%
17%
17%
10%
9%
4%
1%
-2%
-6%
-11%
Food and drinks
Utilities
Mobile phone usage
Mobile broadband
Transportation
Fixed broadband
Clothing
Pay television
Holidays
Fixed telephony
Electric appliance
Going out
Sports
-16%
-17%
Mature marketsNet decrease/increase
-5% average
Emerging marketsNet decrease/increase
+10 average
Utilities
Food and drinks
Transportation
Mobile broadband
Fixed broadband
Mobile phone usage
Holidays
Pay television
Clothing
Electronic appliances
Going out
Sports
Fixed telephony
11%
2%
0%
-1%
-2%
-2%
-2%
-8%
-9%
-12%
-14%
-16%
-17%

IBM Global Business Services 3
• In emerging markets, for consumers with Internet access, social networking is second only to e-mail as the most often used communication channel, with 74 percent using it on a daily basis to communicate. And for the under 25 age group in emerging markets, it’s the most popular communication channel (79 percent). In particular, use of social networking to communicate is high in the ASEAN countries surveyed (Thailand, Philippines, Indonesia and Malaysia).
• In mature markets, just over half of consumers surveyed (51 percent) are using social networking once a day or more to communicate with others. However, it’s the number three communication channel (68 percent) in the under 25 age group – and even number one in Norway and Sweden.
• Instant messaging, which includes services such WhatsApp and WeChat, is the third most popular communication channel in emerging markets for the under 25 age group. It’s the number one communication channel for all consumers in China and Spain, with 84 and 78 percent, respectively, using it daily to chat or send messages. In China, 70 percent are also using microblogs, such as Sina Weibo, at least once a day to communicate.
• In the following countries, the top three communication services used most frequently are OTT channels: Brazil, Mexico, Turkey, Greece, the Netherlands and Spain.
OTT competitors are becoming increasingly successful in offering cheaper alternatives to traditional communication services. We suggest CSPs evaluate a range of responses, ranging from partnering with OTT providers to developing their own OTT-type of communication services.
Figure 2: Daily use of communication services.
OTT usage continues to growThe rapid rise of social networking, instant messaging, microblogs, Internet video, e-mail and other over-the-top (OTT) communication applications has driven new facets of communication. These applications have become ubiquitous, and many consumers have switched to or increased use of these OTT services as cheaper alternatives to traditional ones. This trend is clearly visible in both mature and emerging markets (see Figure 2):
Source: 2014 IBM Global Telecommunications Consumer Survey. Note: Question - How often do you use the following communications services?
Social networking
Mobile messaging
Instant messaging/chat
Mobile voice calls
Internet videostreaming/download
Fixed voice calls
Micro-blogging
VOIP (Voice overInternet Protocol)
Video calling
82%
80%
74%
51%
66%
58%
65%
33%
61%
55%
50%
35%
37%
33%
36%
17%
28%
15%
25%
11%Emerging markets Mature markets

4 The influence of social
Voice calls and text are waningThe popularity of OTT communications apps like WhatsApp, WeChat, Facetime and Skype are siphoning conventional messaging and voice calls away from CSPs (see Figure 3):
• More than a third (34 percent) of the consumers surveyed have reduced or will reduce their usage of direct SMS text messaging by increasingly using alternative channels. The decrease in SMS usage is even higher in countries suffering economic setbacks. In Greece, for example, 57 percent have reduced or will reduce usage of SMS text messaging, and in Spain this figure is 59 percent. In countries like the United States, France and Canada, one-out-of-five consumers has reduced or will reduce conventional messaging.
• Globally, almost one third (31 percent) have or will cut traditional voice calling. Spain “leads” this trend, with 44 percent of consumers having already reduced or planning to reduce traditional voice calling by increasing use of alternative channels.
In fact, several CSPs have already reported serious revenue and/or profit declines as a result of this shift. For instance, China Mobile reported a profit decline, as well as a 6.5 percent decline in the numbers of messages (SMS) sent in first quarter 2014 as compared to fourth quarter 2013, due to OTT challenges.1 In fact, global spend on traditional operator messaging services, including SMS and multimedia messaging service (MMS), declined for the first time in 2013.2
CSPs should develop plans to contain ARPU erosion, which might include bundling basic communication services with value-added services and leveraging customer insights for cross and up sells.
The mobile is the device For people with Internet access, fixed broadband (including home WiFi) remains the primary access, but mobile broadband is catching up fast:
• Globally, 73 percent of consumers with Internet access use fixed broadband daily to access the Internet.
Source: 2014 IBM Global Telecommunications Consumer Survey. Note: Question - To what extent have you reduced – or will you reduce – SMS usage and traditional voice calling by increasingly using alternative channels?
Figure 3: Change in usage of traditional communication by increasing use of over-the-top (OTT) communication.
14%15%
20%
52%
Significantlyreduce(d)
Moderatelyreduce(d)
No change
Increase(d)
11%12%
20%
57%
Significantlyreduce(d)
Moderatelyreduce(d)
No change
Increase(d)
Short message service(SMS) usage Traditional voice calling
34% have reduced or will reduceSMS usage 31% have reduced or will reduce
traditional voice calling

IBM Global Business Services 5
• In emerging markets, 60 percent of people with Internet access use mobile broadband (GPRS, 3G, 4G, etc.) once a day or more. For those with Internet access in Indonesia, Nigeria and Kenya – as well as for the under 25 age group in China and India – mobile broadband is the primary medium.
The mobile phone has become perhaps the most valuable device for accessing the Internet; globally, 80 percent of survey respondents value the device as such. Two-thirds use a mobile device daily to access the Internet (via mobile broadband, home WiFi, public WiFi, etc.) and even higher percentages do so in many emerging countries, such as in China (83 percent), Indonesia (77 percent) and Thailand (77 percent).
Globally, 84 percent access the Internet to search for informa-tion at least once a day. And consumers are using the Internet more and more for a multitude of reasons. For example, respondents estimate they access social media (including video sites such as YouTube and YouKu) 45 percent more than they did three years ago. Consumers also estimate they are using mobile apps 32 percent more and retail services, such as eBay and Amazon, 15 percent more than they did three years ago. In China, the estimated increase in accessing retail sites, such as Alibaba, is 45 percent.
CSPs should capitalize on this increasing demand for higher bandwidth consumption and help drive revenues by finding the best strategies to monetize mobile applications and mobile commerce.
Consumers prefer to help themselves – and collaborate with CSPsCustomer self service is growing in popularity. In fact, we discovered that consumers today expect to help themselves before contacting their provider directly (see Figure 4). Consumers prefer self service over speaking with a customer
service agent for a wide variety of tasks, ranging from deter-mining the best plan based on their usage pattern (56 percent) and starting or stopping subscription services (63 percent) to paying bills and recharging accounts (77 percent) and retriev-ing contact history (78 percent). Not only can self service improve customer satisfaction, it also can prove beneficial for the provider through lower support costs and resources that can be reallocated to high-value customers.
Figure 4: Self services versus support customer service agent.
Source: 2014 IBM Global Telecommunications Consumer Survey.Note: Question - Please indicate your preference for either self service or human interference (live agent).
Contact history
Status checks
Pay bills and recharge accounts
Track usage and get detailed bills
Set alerts and limits
Know outstanding bills/amounts
Information on buy products
Know current plan/change it
Change administrative information
Information on communicationsproducts/services
Dealer/retail store location inquiries
Get offers customized for you
Registration
Start/stop subscription services
Best plan based on your usage pattern
Raise service issues and track them
78% 22%
77% 23%
76% 24%
77% 23%
75% 25%
75% 25%
71% 29%
74% 26%
70% 30%
68% 32%
65% 35%
68% 32%
64% 36%
63% 37%
56% 44%
56% 44%
Self service Human interaction (live agent)
6 The influence of social
On the other hand, consumers are willing to engage with providers for other reasons: 84 percent surveyed said they are willing to provide feedback or engage to help CSPs make improvements.
• This willingness is higher for consumers in emerging markets; in fact, the willingness among Chinese and Kenyan consumers is nearly universal (98 percent).
• The least willing respondents are consumers from the Netherlands (57 percent) and New Zealand (58 percent).
• Topics on which customers are willing to provide feedback or input include improvement of existing products or services (60 percent) and improving customer care (56 percent).
However, when consumers were asked to what extent their CSP enables them to provide feedback or input to develop or improve new products or services, the answers were disap-pointing. Only 11 percent of respondents strongly agree that their provider enables feedback or input, and 27 percent moderately agree. Since social media is increasingly used for customer engagement, we asked whether respondents agree that their provider efficiently uses social media to engage with them. Only 10 percent strongly agree, while 25 percent moderately agree.
CSPs should decide on the best investments for self-service options, including self service from the mobile, as well as determine the most natural way to engage with customers and initiate collaboration.
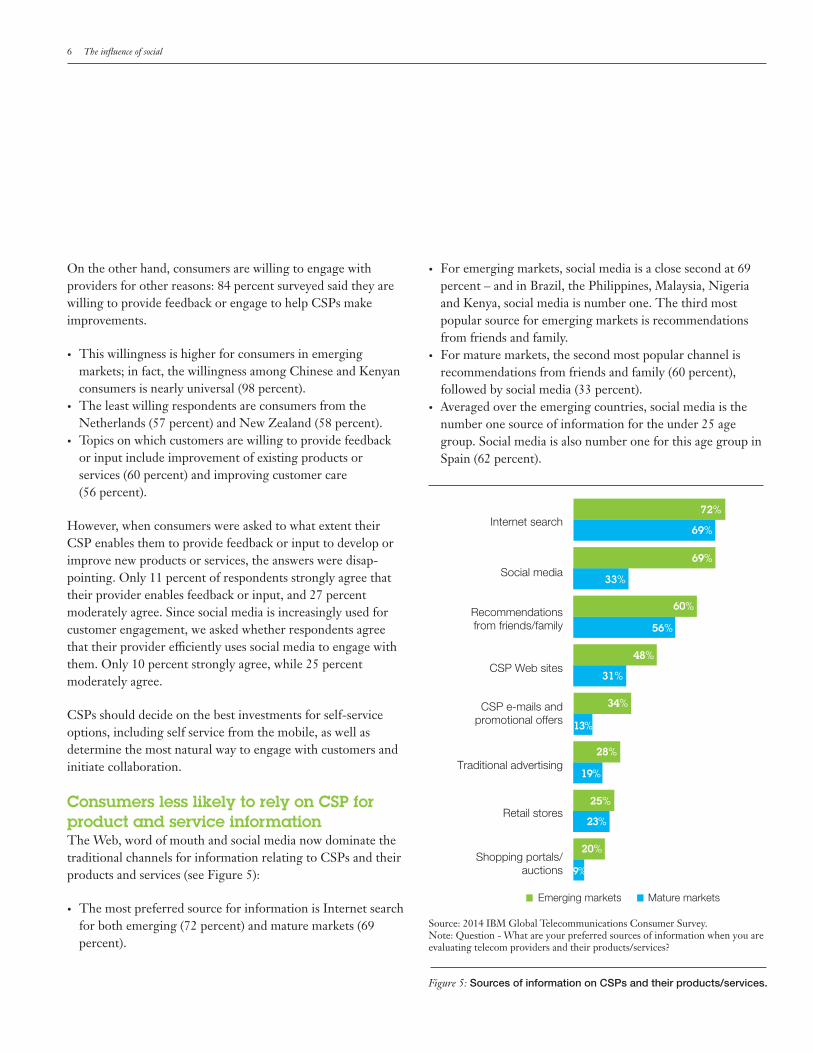
Consumers less likely to rely on CSP for product and service information The Web, word of mouth and social media now dominate the traditional channels for information relating to CSPs and their products and services (see Figure 5):
• The most preferred source for information is Internet search for both emerging (72 percent) and mature markets (69 percent).
• For emerging markets, social media is a close second at 69 percent – and in Brazil, the Philippines, Malaysia, Nigeria and Kenya, social media is number one. The third most popular source for emerging markets is recommendations from friends and family.
• For mature markets, the second most popular channel is recommendations from friends and family (60 percent), followed by social media (33 percent).
• Averaged over the emerging countries, social media is the number one source of information for the under 25 age group. Social media is also number one for this age group in Spain (62 percent).
Figure 5: Sources of information on CSPs and their products/services.
Source: 2014 IBM Global Telecommunications Consumer Survey. Note: Question - What are your preferred sources of information when you are evaluating telecom providers and their products/services?
Internet search
Social media
Recommendationsfrom friends/family
CSP Web sites
CSP e-mails andpromotional offers
Traditional advertising
Retail stores
Shopping portals/auctions
69%
69%
33%
60%
56%
48%
31%
34%
13%
28%
Emerging markets Mature markets
72%
19%
25%
23%
20%
9%
IBM Global Business Services 7
The implications of these results are profound. Globally, consumers are less interested in CSP Web sites (41 percent), e-mails and promotional offers (26 percent), traditional advertising (25 percent), retail stores (24 percent) and shop-ping portals (16 percent). Rather, they prefer to proactively exchange information about CSPs with friends and family or gather it via Internet search or social media sites.
CSPs should better exploit social networking as part of their marketing strategy and align or integrate digital and physical channels to better interact with their customers.
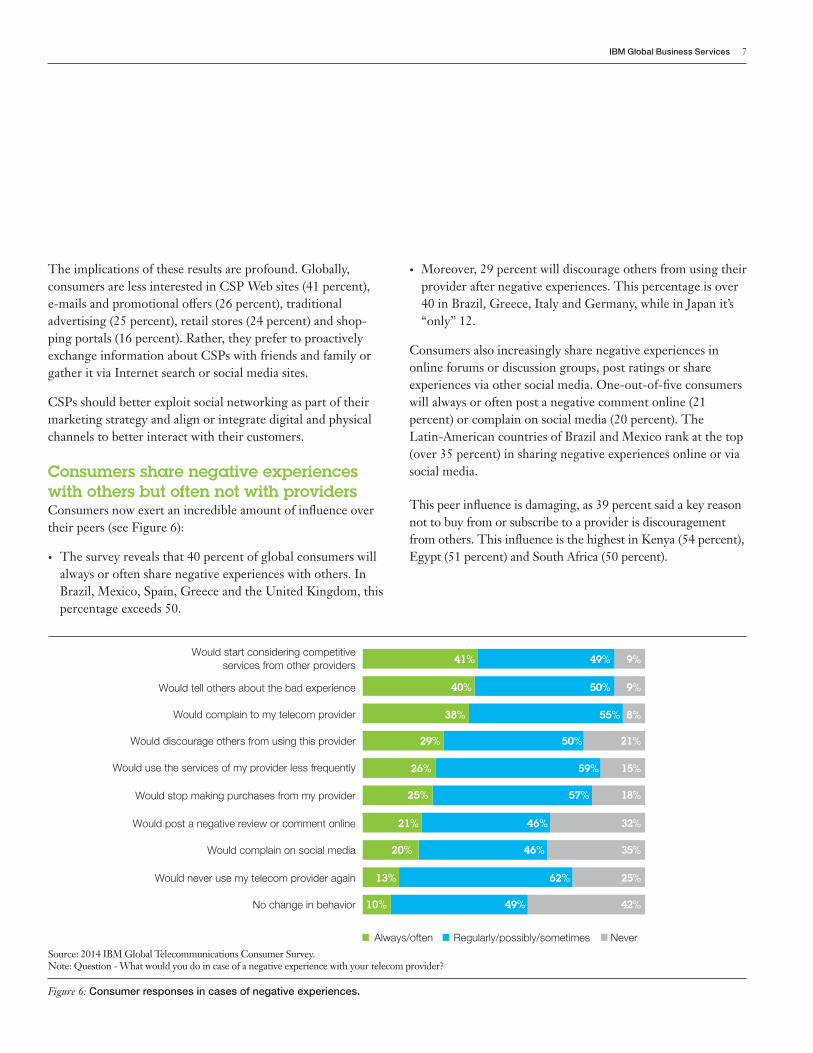
Consumers share negative experiences with others but often not with providersConsumers now exert an incredible amount of influence over their peers (see Figure 6):
• The survey reveals that 40 percent of global consumers will always or often share negative experiences with others. In Brazil, Mexico, Spain, Greece and the United Kingdom, this percentage exceeds 50.
Figure 6: Consumer responses in cases of negative experiences.
• Moreover, 29 percent will discourage others from using their provider after negative experiences. This percentage is over 40 in Brazil, Greece, Italy and Germany, while in Japan it’s “only” 12.
Consumers also increasingly share negative experiences in online forums or discussion groups, post ratings or share experiences via other social media. One-out-of-five consumers will always or often post a negative comment online (21 percent) or complain on social media (20 percent). The Latin-American countries of Brazil and Mexico rank at the top (over 35 percent) in sharing negative experiences online or via social media.
This peer influence is damaging, as 39 percent said a key reason not to buy from or subscribe to a provider is discouragement from others. This influence is the highest in Kenya (54 percent), Egypt (51 percent) and South Africa (50 percent).
Source: 2014 IBM Global Telecommunications Consumer Survey. Note: Question - What would you do in case of a negative experience with your telecom provider?
Would start considering competitiveservices from other providers
Would tell others about the bad experience
Would complain to my telecom provider
Would discourage others from using this provider
Would use the services of my provider less frequently
Would stop making purchases from my provider
Would post a negative review or comment online
Would complain on social media
Would never use my telecom provider again
No change in behavior
41% 49% 9%
40% 50% 9%
38% 55% 8%
29% 50% 21%
26% 59% 15%
25% 57% 18%
21% 46% 32%
20% 46% 35%
13% 62% 25%
10% 49% 42%
Always/often Regularly/possibly/sometimes Never

8 The influence of social
CSPs need to recognize that consumers are conducting conversations in which they may not be included. In fact, 38 percent of consumers do not even contact their provider when they have negative experiences.
• The top two reasons for not contacting providers are having to wait too long to speak to a call center agent (49 percent) and feeling that it’s too much of a hassle to get through to customer service (45 percent).
• The number three reason is a belief that contacting the provider will not make any difference; in Denmark (44 percent), Russia (42 percent) and the Netherlands (40 percent), that is actually the number one reason.
CSPs should become more proactive in understanding service issues, make it easier for consumers to interact with call centers and troll social networks to understand sources of dissatisfaction.
Word of mouth can build strong brandsPositive experiences and word of mouth can help a CSP increase brand strength:
• More than half of consumers (53 percent) would always or often tell others about a positive experience or even recommend their provider to others (52 percent). The percentage of consumers recommending their provider to others exceeds 60 percent in Nigeria, Kenya, South Africa, Mexico, Turkey and Greece.
• Twenty-nine percent would post a positive comment or spread the good news via social media.
Positive word-of-mouth communication can have a strong positive impact on a CSP’s reputation and, consequently, its business performance. Almost half (46 percent) of respondents say word-of-mouth reputation is key when considering a provider for products and services. In Indonesia, Egypt, India and Saudi Arabia, it’s the initial point of contact or interaction – i.e., the first impression – that matters.
CSPs should work on offering experiences that encourage consumers to recommend them to others. CSPs can also use word-of-mouth and social media to their advantage by finding key influencers and targeting them with appropriate messag-ing, with a goal of becoming a topic of positive conversation for social groups of consumers.
How to create positive experiences and build loyaltyMore than half (51 percent) of consumers said that positive experiences would increase their loyalty to their providers. This represents a key opportunity for CSPs, as current customer loyalty in telecommunications is very low. Globally, only 16 percent of customers are advocates for their CSP. Advocates are loyal customers who promote the company, tend to subscribe to more services and resist competitive offers. Almost half of customers (47 percent) are antagonists, which are clients who harbor negative opinions about their provider and possibly talk negative about them.
The crucial question is: What do customers perceive as a positive experience?
• As could be guessed, providing high quality and compelling products and services is the most important aspect in creating unique experiences. More than three-quarters (77 percent) of respondents identified as advocates for their providers revealed this is highest on their list of reasons for remaining loyal.
• The number two reason for remaining loyal (identified by 57 percent) is receiving quick, effective responses to questions and issues, followed by getting issues resolved in a fair way (50 percent).
• Only 44 percent of advocates indicated low prices as key to loyalty.
Survey respondents said their providers must perform better – in particular on personal and emotive aspects – to earn their loyalty. The emotive aspects – e.g., being treated in what one perceives as a fair way – and personalization aspects – e.g., getting exclusive offers as a reward for loyalty – seem to make the difference between advocates and antagonists, not low prices (see Figure 7).

IBM Global Business Services 9
Source: 2014 IBM Global Telecommunications Consumer Survey. Note: Question - What are the most important aspects for you to stay loyal to your telecom provider?
CSPs should assess the rational and emotive attributes most relevant for customer advocacy, select those gaps that are the best candidates for narrowing – which can differ by country – and take measures to move customers upward in the advocacy scale.
Moderate trust with personal informationDelivering compelling experiences and services requires a fair exchange of personal data. We asked consumers to rate their trust in CSPs to manage private/personal data in comparison to other organizations with which they regularly deal, such as banks, insurance providers, healthcare organizations, Internet information providers (e.g., Google), social-networking sites and government/ local authorities. Though the results are very country specific, globally the CSPs rank rather high (number three) on the list of most/moderately trusted organizations.
The majority of respondents are not unwilling to provide personal information to a provider they trust dependent on the benefits they get in return, though they have serious concerns providing medical and financial data. The key stimuli for getting consumers to provide personal information include offering higher-value products or services for a lower price (for 53 percent of respondents) and the potential for improved service (for 50 percent). Nevertheless, consumers like to be in control of how their personal information is used. And 72 percent prefer to be asked for permission before personal information is shared with third parties. Consumers want honesty and transparency.
CSPs should address concerns customers may have about the personal information they gather and how that information is used. In addition, they should determine the best ways to communicate their data usage policies with customers.
Figure 7: Aspects to stay loyal for advocates and antagonists.
Offering high-quality/compelling product/services
Providing timely, effective responses to questions/issues
Resolving issues fairly
Enabling customization of products/services
Providing personalized and consistent service
Presenting exclusive offers (loyalty programs)
Proactively trying to improve user experience
Providing transparency and openess
Seeking opinion to develop products/services
Not having to repeat personal information
Low prices, even at the costs of quality/service
77%57%50%32%31%41%19%33%15%17%44%
57%43%38%24%23%34%13%27%11%15%46%
Advocates AntagonistsGap

© Copyright IBM Corporation 2014
IBM Corporation Route 100 Somers, NY 10589
Produced in the United States of America May 2014
IBM, the IBM logo and ibm.com are trademarks of International Business Machines Corp., registered in many jurisdictions worldwide. Other product and service names might be trademarks of IBM or other companies. A current list of IBM trademarks is available on the Web at “Copyright and trademark information” at www.ibm.com/legal/copytrade.shtml.
This document is current as of the initial date of publication and may be changed by IBM at any time. Not all offerings are available in every country in which IBM operates.
THE INFORMATION IN THIS DOCUMENT IS PROVIDED “AS IS” WITHOUT ANY WARRANTY, EXPRESS OR IMPLIED, INCLUDING WITHOUT ANY WARRANTIES OF MERCHANT-ABILITY, FITNESS FOR A PARTICULAR PURPOSE AND ANY WARRANTY OR CONDITION OF NON-INFRINGEMENT. IBM products are warranted according to the terms and conditions of the agreements under which they are provided.
This report is intended for general guidance only. It is not intended to be a substitute for detailed research or the exercise of professional judgment. IBM shall not be responsible for any loss whatsoever sustained by any organization or person who relies on this publication.
The data used in this report may be derived from third-party sources and IBM does not independently verify, validate or audit such data. The results from the use of such data are provided on an “as is” basis and IBM makes no representations or warranties, express or implied.
1 “China Mobile Q1 2014 result: revenue up 7.8%, profit dip 9.4% due to OTT challenges.” Telecom Lead. April 22, 2014. http://www.telecomlead.com/telecom-services/china-mobile-q1-2014-result-revenue-7-8-profit-dip-9-4-due-ott-challenges-89061/
2 Sahota, Dawinderpal. “Global SMS revenue declines for first time.” January 14, 2014. Telecoms.com. http://www.telecoms.com/212062/global-sms-revenue-declines-for-first-time/
Please Recycle
GBE03604-USEN-00
ConclusionOur survey results show that the rapid rise of social media titans – such as Facebook and Google – allows consumers not only to use alternative communication channels, but also seize control of the decisions and reputations of CSPs. Unfortunately, customers’ relationships with their CSPs have become increas-ingly distant, in particular as CSPs have struggled to determine how to effectively use social media to get closer to their customer. This is driving CSPs to develop strategies to improve customer engagement and their ability to deal with increased competition in a virtually saturated mobile market.
One clear message from this consumer survey is that despite investments in customer experience and customer relationship management initiatives, the industry has not achieved its customer-related goals. We suggest today’s CSPs exploit the influence of social and use it to their advantage to help improve customer satisfaction and loyalty.
Though they prefer self service to resolve most issues, consum-ers are willing to engage with CSPs to help them make product and service improvements – and CSPs must take advantage of this willingness. By embracing a variety of communication methods – in particular social networking – CSPs can better connect with customers, allowing them to collaborate on improvements to products and service. This in turn can drive increased customer loyalty, perhaps making advocates more likely to share their positive experiences and maybe even reversing the negative feelings of antagonists.
To learn more about how to evolve today’s social disruption into a positive strategy for future success, CSPs should learn more about their customers: The 2014 IBM Global Telecommunications Consumer Survey resulted in 35 country views with country-specific profiles and CSP benchmarking for the individual countries. For more information about the global results or the country-specific survey results, please contact Rob van den Dam at [email protected].