IB Graphing. Usually give graphical data display because: See relationship btw variables...
18
IB Graphing
-
Upload
camilla-obrien -
Category
Documents
-
view
216 -
download
0
Transcript of IB Graphing. Usually give graphical data display because: See relationship btw variables...

IB Graphing

Usually give graphical data display because:
• See relationship btw variables (increasing, decreasing or none).
• See outliers from data.• Determine function.• Finding physical
constants from slope and intercepts.

Error Bars
• When measurement expressed with absolute uncertainty - graph with error bars. Bars show absolute uncertainty in individual measures.
• Error bar is sketched as vertical and horizontal lines beginning at data point ending in horizontal line or cap.
• Bar length is scaled to the graph axis.
• Line or curve must touch some portion of bar.

time (s)±0.01*Error bars too small to show at this scale
dis
tanc
e (m
) ±0
.5Error bars

Some error bars are different lengths why?
Different instruments
Calculated deviation from mean for each.
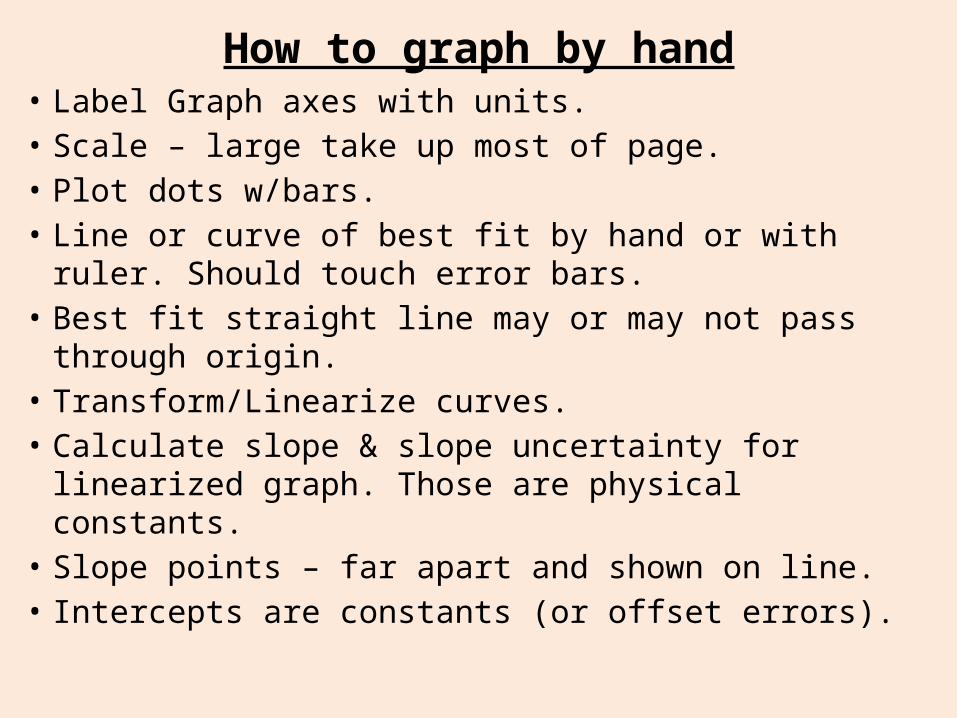
How to graph by hand• Label Graph axes with units.• Scale – large take up most of page.• Plot dots w/bars.• Line or curve of best fit by hand or with ruler. Should
touch error bars.• Best fit straight line may or may not pass through
origin.• Transform/Linearize curves.• Calculate slope & slope uncertainty for linearized
graph. Those are physical constants.• Slope points – far apart and shown on line.• Intercepts are constants (or offset errors).
Hooke’s Law Example
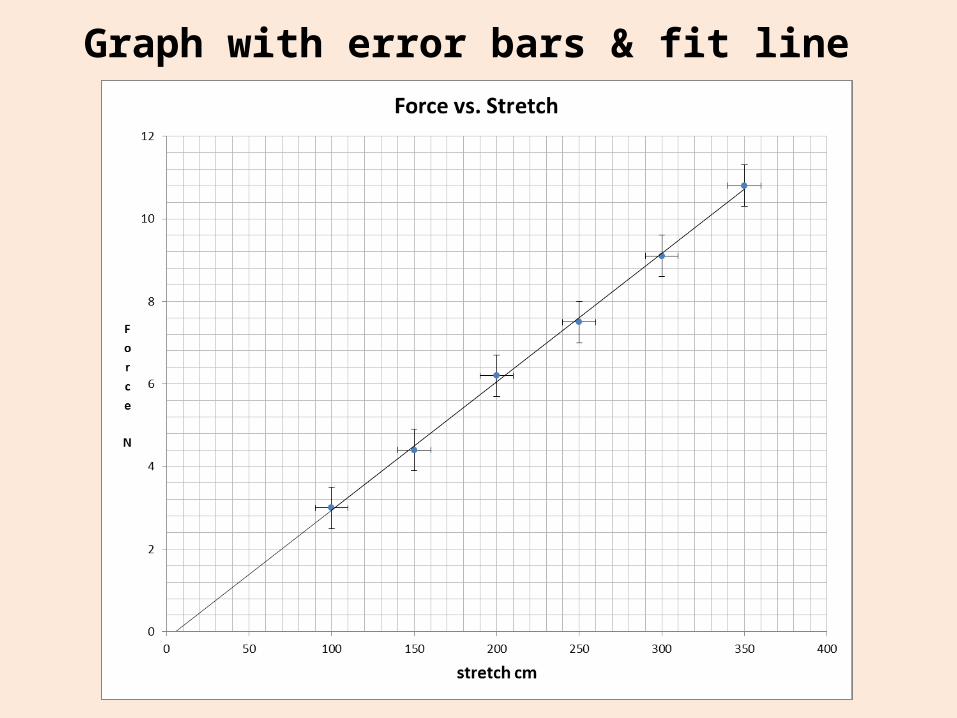
Graph with error bars & fit line

Types of Graphs
• We generally use line graphs.

Graph Analysis
• Linear Proportion y = mx + b• Test: y/x = k any 2 points
2.4 3.2 4 4.8 5.6 6.4 7.2 8 8.8 9.60
20
40
60
80
100
120
140
160
180
200
220
240
260
280
300
Stretch
Forc
e N
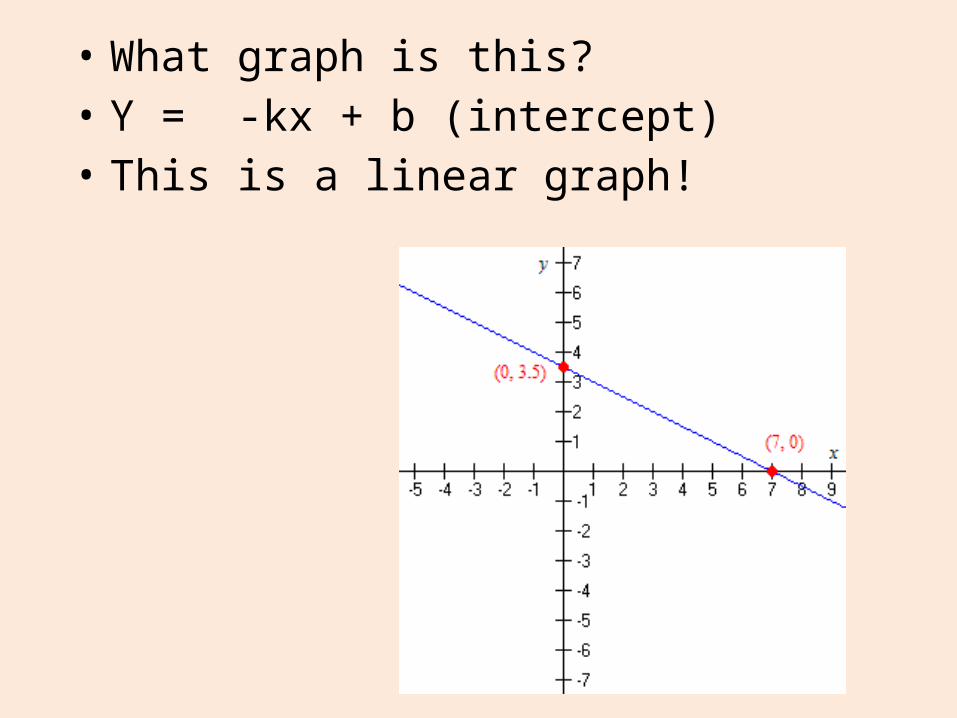
• What graph is this?• Y = -kx + b (intercept)• This is a linear graph!
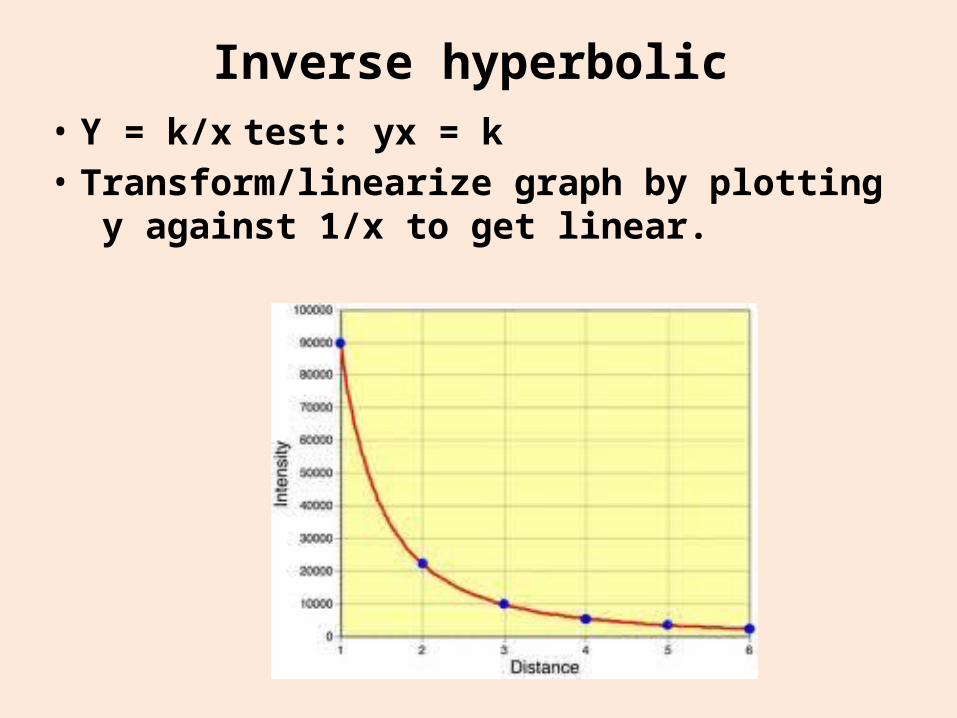
Inverse hyperbolic
• Y = k/x test: yx = k• Transform/linearize graph by plotting y
against 1/x to get linear.

Parabolic
• Y = kx2. y/x2 = k• Or transform graph y against x2 make it linear• What will the slope be?

What graph is this?
• Square root function.• Y = k • How would we linearize it?• Graph instead of x.

Hooke’s Law dataMake graph with error bars
Force ± 5 N 100 150 200 250 300
Stretch ± 0.2 cm 3.0 4.4 6.2 7.5 9.1

• Craters DBQ

• Bozeman – Beginners to Graphing 10 min.• http://www.youtube.com/watch?v=9BkbYeTC6Mo&list=PLllV
waZQkS2omBpLjQm_BAQKsQ7lq86ku&index=4
• Bozeman Graphing by hand instructions 6 min.• http://www.youtube.com/watch?v=GUYRMdcEs00&list=PLllV
waZQkS2omBpLjQm_BAQKsQ7lq86ku
• Bozeman Graphing Excel Spreadsheet 5 min.• http://www.youtube.com/watch?v=yvYvHU83_6Y&list=PLllVw
aZQkS2omBpLjQm_BAQKsQ7lq86ku
Film Clips

Craters DBQStrobe Ball Drop
• Do Kerr pg 21 ex 1.2.