IATTC Annual Report 2001 · Oceanografía y meteorología ... Informes de mortalidad de delfines...
155
ANNUAL REPORT of the Inter-American Tropical Tuna Commission 2001 INFORME ANUAL de la Comisión Interamericana del Atún Tropical La Jolla, California 2002 ISSN: 0074-1000
Transcript of IATTC Annual Report 2001 · Oceanografía y meteorología ... Informes de mortalidad de delfines...

ANNUAL REPORTof the
Inter-American Tropical Tuna Commission
2001
INFORME ANUALde la
Comisión Interamericana del Atún Tropical
La Jolla, California
2002
ISSN: 0074-1000

The Inter-American Tropical Tuna Commission(IATTC) operates under the authority and directionof a convention originally entered into by CostaRica and the United States. The convention, whichcame into force in 1950, is open to adherence byother governments whose nationals fish for tropicaltunas in the eastern Pacific Ocean. Under this pro-vision Panama adhered in 1953, Ecuador in 1961,Mexico in 1964, Canada in 1968, Japan in 1970,France and Nicaragua in 1973, Vanuatu in 1990,Venezuela in 1991, El Salvador in 1997, andGuatemala in 2000. Canada withdrew from theCommission in 1984.
Additional information about the IATTC and itspublications can be found on the inside back coverof this report.
COSTA RICAGeorge HeigoldHerbert Nanne
ECUADORLuis Torres NavarreteRafael Trujillo Bejarano
EL SALVADORMario González RecinosRoberto InterianoMargarita Salazar de Jurado
FRANCE—FRANCIARenaud CollardPaul MennecierJean-Christophe PailleJulien Turenne
GUATEMALAFélix Ramiro Pérez ZarcoAntonio Salaverría
JAPAN—JAPONYoshiaki ItoDaishiro NagahataYamato Ueda
La Comisión Interamericana del Atún Tropical(CIAT) funciona bajo la autoridad y dirección deuna convención establecida originalmente porCosta Rica y los Estados Unidos. La Convención,vigente desde 1950, está abierta a la afiliación deotros gobiernos cuyos ciudadanos pescan atu-nes enel Océano Pacífico oriental. Bajo esta estipulación,Panamá se afilió en 1953, Ecuador en 1961, Méxicoen 1964, Canadá en 1968, Japón en 1970, Francia yNicaragua en 1973, Vanuatu en 1990, Venezuela en1991, El Salvador en 1997, y Guatemala en 2000.Canadá se retiró de la Co-misión en 1984.
En la otra contraportada de este informe se pre-senta información adicional sobre la CIAT y suspublicaciones.
MEXICOMaría Teresa Bandala MedinaGuillermo Compeán JiménezMichel DreyfusMara Angélica Murillo Correa
NICARAGUAMiguel A. Marenco U.Sergio Martínez Casco
PANAMAArnulfo L. Franco Rodríguez
USA—EE.UU.M. Austin FormanRebecca Lent (alternate)James T. McCarthy
VANUATUJohn RoosenA. N. TillettEdward E. Weissman
VENEZUELACarolina BeltránFrancisco Ortisi, Jr.Jean-François Pulvenis
COMMISSIONERS DURING 2001—COMISIONADOS DURANTE 2001
DirectorRobin Allen
Headquarters and Main Laboratory—Oficina y Laboratorio Principal8604 La Jolla Shores Drive
La Jolla, California 92037-1508, U.S.A.www.iattc.org

ANNUAL REPORTof the
Inter-American Tropical Tuna Commission
2001
INFORME ANUALde la
Comisión Interamericana del Atún Tropical
La Jolla, California
2002

CONTENTS−−INDICE
ENGLISH VERSION−−VERSION EN INGLESPage
INTRODUCTION . . . . . . . . . . . . . . . . . . . . . . . . . . . . . . . . . . . . . . . . . . . . . . . . . . . . . . . . . . . . . . .5MEETINGS . . . . . . . . . . . . . . . . . . . . . . . . . . . . . . . . . . . . . . . . . . . . . . . . . . . . . . . . . . . . . . . . . . . .6
68th meeting of the IATTC . . . . . . . . . . . . . . . . . . . . . . . . . . . . . . . . . . . . . . . . . . . . . . . . . .6Meetings of IATTC working groups . . . . . . . . . . . . . . . . . . . . . . . . . . . . . . . . . . . . . . . . . . . .6Meetings of the Parties to the Agreement on the International Dolphin Conservation
Program (AIDCP) . . . . . . . . . . . . . . . . . . . . . . . . . . . . . . . . . . . . . . . . . . . . . . . . . . . . . .7Meetings of working groups of the AIDCP . . . . . . . . . . . . . . . . . . . . . . . . . . . . . . . . . . . . . .7Meetings of joint projects involving the IATTC's Achotines Laboratory . . . . . . . . . . . . . . .7
ADMINISTRATION . . . . . . . . . . . . . . . . . . . . . . . . . . . . . . . . . . . . . . . . . . . . . . . . . . . . . . . . . . . . .8Budget . . . . . . . . . . . . . . . . . . . . . . . . . . . . . . . . . . . . . . . . . . . . . . . . . . . . . . . . . . . . . . . . . . .8Financial statement . . . . . . . . . . . . . . . . . . . . . . . . . . . . . . . . . . . . . . . . . . . . . . . . . . . . . . . . 8
DATA COLLECTION . . . . . . . . . . . . . . . . . . . . . . . . . . . . . . . . . . . . . . . . . . . . . . . . . . . . . . . . . . . . 8The fishery for tunas and tuna-like fishes in the eastern Pacific Ocean . . . . . . . . . . . . . . .8Size compositions of the surface catches of tunas . . . . . . . . . . . . . . . . . . . . . . . . . . . . . . . .15Observer program . . . . . . . . . . . . . . . . . . . . . . . . . . . . . . . . . . . . . . . . . . . . . . . . . . . . . . . . .17
RESEARCH . . . . . . . . . . . . . . . . . . . . . . . . . . . . . . . . . . . . . . . . . . . . . . . . . . . . . . . . . . . . . . . . . . .18Age and growth of bigeye tuna . . . . . . . . . . . . . . . . . . . . . . . . . . . . . . . . . . . . . . . . . . . . . . .18Reproductive biology of bigeye tuna . . . . . . . . . . . . . . . . . . . . . . . . . . . . . . . . . . . . . . . . . .19Tuna tagging . . . . . . . . . . . . . . . . . . . . . . . . . . . . . . . . . . . . . . . . . . . . . . . . . . . . . . . . . . . . .20Ecological studies . . . . . . . . . . . . . . . . . . . . . . . . . . . . . . . . . . . . . . . . . . . . . . . . . . . . . . . . .21Early life history studies . . . . . . . . . . . . . . . . . . . . . . . . . . . . . . . . . . . . . . . . . . . . . . . . . . . .23Oceanography and meteorology . . . . . . . . . . . . . . . . . . . . . . . . . . . . . . . . . . . . . . . . . . . . . .28Stock assessments of tunas and billfishes . . . . . . . . . . . . . . . . . . . . . . . . . . . . . . . . . . . . . .29Dolphins . . . . . . . . . . . . . . . . . . . . . . . . . . . . . . . . . . . . . . . . . . . . . . . . . . . . . . . . . . . . . . . . .29
GEAR PROGRAM . . . . . . . . . . . . . . . . . . . . . . . . . . . . . . . . . . . . . . . . . . . . . . . . . . . . . . . . . . . . . .31Dolphin safety panel alignments . . . . . . . . . . . . . . . . . . . . . . . . . . . . . . . . . . . . . . . . . . . . .31Dolphin mortality reduction seminars . . . . . . . . . . . . . . . . . . . . . . . . . . . . . . . . . . . . . . . . .31Statements of participation . . . . . . . . . . . . . . . . . . . . . . . . . . . . . . . . . . . . . . . . . . . . . . . . . .32Other services . . . . . . . . . . . . . . . . . . . . . . . . . . . . . . . . . . . . . . . . . . . . . . . . . . . . . . . . . . . .32
MEASURES FOR THE CONSERVATION OF TUNAS . . . . . . . . . . . . . . . . . . . . . . . . . . . . . . . .32Yellowfin tuna . . . . . . . . . . . . . . . . . . . . . . . . . . . . . . . . . . . . . . . . . . . . . . . . . . . . . . . . . . . .32Bigeye tuna . . . . . . . . . . . . . . . . . . . . . . . . . . . . . . . . . . . . . . . . . . . . . . . . . . . . . . . . . . . . . .32
THE INTERNATIONAL DOLPHIN CONSERVATION PROGRAM . . . . . . . . . . . . . . . . . . . . . .32International review panel . . . . . . . . . . . . . . . . . . . . . . . . . . . . . . . . . . . . . . . . . . . . . . . . . .33Dolphin mortality limits . . . . . . . . . . . . . . . . . . . . . . . . . . . . . . . . . . . . . . . . . . . . . . . . . . . .33Training and certification of fishing captains . . . . . . . . . . . . . . . . . . . . . . . . . . . . . . . . . . .33Reports of dolphin mortality by observers at sea . . . . . . . . . . . . . . . . . . . . . . . . . . . . . . . .34System for tracking and verifying tuna . . . . . . . . . . . . . . . . . . . . . . . . . . . . . . . . . . . . . . . .34Dolphin-safe certificates . . . . . . . . . . . . . . . . . . . . . . . . . . . . . . . . . . . . . . . . . . . . . . . . . . . .35
PUBLICATIONS . . . . . . . . . . . . . . . . . . . . . . . . . . . . . . . . . . . . . . . . . . . . . . . . . . . . . . . . . . . . . . .35WEB SITE . . . . . . . . . . . . . . . . . . . . . . . . . . . . . . . . . . . . . . . . . . . . . . . . . . . . . . . . . . . . . . . . . . . .35INTER-AGENCY COOPERATION . . . . . . . . . . . . . . . . . . . . . . . . . . . . . . . . . . . . . . . . . . . . . . . . 35
FIGURES−−FIGURAS . . . . . . . . . . . . . . . . . . . . . . . . . . .39
TABLES−−TABLAS . . . . . . . . . . . . . . . . . . . . . . . . . . . . .71

VERSION EN ESPAÑOL−−SPANISH VERSIONPágina
INTRODUCCION . . . . . . . . . . . . . . . . . . . . . . . . . . . . . . . . . . . . . . . . . . . . . . . . . . . . . . . . . . . . .101REUNIONES . . . . . . . . . . . . . . . . . . . . . . . . . . . . . . . . . . . . . . . . . . . . . . . . . . . . . . . . . . . . . . . . .102
68a reunion de la CIAT . . . . . . . . . . . . . . . . . . . . . . . . . . . . . . . . . . . . . . . . . . . . . . . . . . . .102Reuniones de grupos de trabajo de la CIAT . . . . . . . . . . . . . . . . . . . . . . . . . . . . . . . . . . .102Reuniones de las Partes del Acuerdo sobre el Programa Internacional para la
Conservación de los Delfines (APICD) . . . . . . . . . . . . . . . . . . . . . . . . . . . . . . . . . . . .103Reuniones de grupos de trabajo del APICD . . . . . . . . . . . . . . . . . . . . . . . . . . . . . . . . . . .103Reuniones de proyectos conjuntos relacionados con el Laboratorio de Achotines
de la CIAT . . . . . . . . . . . . . . . . . . . . . . . . . . . . . . . . . . . . . . . . . . . . . . . . . . . . . . . . . .103ADMINISTRACION . . . . . . . . . . . . . . . . . . . . . . . . . . . . . . . . . . . . . . . . . . . . . . . . . . . . . . . . . . .103
Presupuesto . . . . . . . . . . . . . . . . . . . . . . . . . . . . . . . . . . . . . . . . . . . . . . . . . . . . . . . . . . . . .103Informe financiero . . . . . . . . . . . . . . . . . . . . . . . . . . . . . . . . . . . . . . . . . . . . . . . . . . . . . . .104
TOMA DE DATOS . . . . . . . . . . . . . . . . . . . . . . . . . . . . . . . . . . . . . . . . . . . . . . . . . . . . . . . . . . . . .104La pesqueria de atunes y especies afines en le Océano Pacífico oriental . . . . . . . . . . . . .104Composición por tamaño de los atunes en la captura de superficie . . . . . . . . . . . . . . . . .111Programa de observadores . . . . . . . . . . . . . . . . . . . . . . . . . . . . . . . . . . . . . . . . . . . . . . . . .113
INVESTIGACION . . . . . . . . . . . . . . . . . . . . . . . . . . . . . . . . . . . . . . . . . . . . . . . . . . . . . . . . . . . . .114Edad y crecimiento del atún patudo . . . . . . . . . . . . . . . . . . . . . . . . . . . . . . . . . . . . . . . . .114Biología reproductora de atún patudo . . . . . . . . . . . . . . . . . . . . . . . . . . . . . . . . . . . . . . . .115Marcado de atunes . . . . . . . . . . . . . . . . . . . . . . . . . . . . . . . . . . . . . . . . . . . . . . . . . . . . . . .116Estudios ecológicos . . . . . . . . . . . . . . . . . . . . . . . . . . . . . . . . . . . . . . . . . . . . . . . . . . . . . . .117Estudios del ciclo vital temprano . . . . . . . . . . . . . . . . . . . . . . . . . . . . . . . . . . . . . . . . . . . .119Oceanografía y meteorología . . . . . . . . . . . . . . . . . . . . . . . . . . . . . . . . . . . . . . . . . . . . . . .125Evaluaciónes de los stocks de atunes y peces picudos . . . . . . . . . . . . . . . . . . . . . . . . . . . .126Delfines . . . . . . . . . . . . . . . . . . . . . . . . . . . . . . . . . . . . . . . . . . . . . . . . . . . . . . . . . . . . . . . .126
PROGRAMA DE ARTES DE PESCA . . . . . . . . . . . . . . . . . . . . . . . . . . . . . . . . . . . . . . . . . . . . . .128Alineaciones del paño de protección de delfines . . . . . . . . . . . . . . . . . . . . . . . . . . . . . . . .128Seminarios de reducción de mortalidad de delfines . . . . . . . . . . . . . . . . . . . . . . . . . . . . .128Constancias de Participación . . . . . . . . . . . . . . . . . . . . . . . . . . . . . . . . . . . . . . . . . . . . . . .128Otros servicios . . . . . . . . . . . . . . . . . . . . . . . . . . . . . . . . . . . . . . . . . . . . . . . . . . . . . . . . . . .129
MEDIDAS PARA LA CONSERVACION DEL ATUN . . . . . . . . . . . . . . . . . . . . . . . . . . . . . . . . .129Atún aleta amarilla . . . . . . . . . . . . . . . . . . . . . . . . . . . . . . . . . . . . . . . . . . . . . . . . . . . . . . .129Atún patudo . . . . . . . . . . . . . . . . . . . . . . . . . . . . . . . . . . . . . . . . . . . . . . . . . . . . . . . . . . . . .129
EL PROGRAMA INTERNACIONAL PARA LA CONSERVACION DE LOS DELFINES . . . .129Panel Internacional de Revisión . . . . . . . . . . . . . . . . . . . . . . . . . . . . . . . . . . . . . . . . . . . . .130Límites de mortalidad de delfines . . . . . . . . . . . . . . . . . . . . . . . . . . . . . . . . . . . . . . . . . . .130Entrenamiento y certificación de capitanes de pesca . . . . . . . . . . . . . . . . . . . . . . . . . . . .130Informes de mortalidad de delfines pro observadores en el mar . . . . . . . . . . . . . . . . . . .131Sistema de seguimiento y verificación de atún . . . . . . . . . . . . . . . . . . . . . . . . . . . . . . . . .131Certificados Dolphin Safe . . . . . . . . . . . . . . . . . . . . . . . . . . . . . . . . . . . . . . . . . . . . . . . . . .131
PUBLICACIONES . . . . . . . . . . . . . . . . . . . . . . . . . . . . . . . . . . . . . . . . . . . . . . . . . . . . . . . . . . . . .132SITIO DE INTERNET . . . . . . . . . . . . . . . . . . . . . . . . . . . . . . . . . . . . . . . . . . . . . . . . . . . . . . . . .132COLABORACION CON ENTIDADES AFINES . . . . . . . . . . . . . . . . . . . . . . . . . . . . . . . . . . . . .132

APPENDIX 1−−ANEXO 1
STAFF−PERSONAL . . . . . . . . . . . . . . . . . . . . . . . . . . . . . . . . . . . . . . . . . . . . . . . . . . . . . . . . . . .136VISITING SCIENTISTS AND STUDENTS−CIENTIFICOS Y ESTUDIANTES EN
VISITA . . . . . . . . . . . . . . . . . . . . . . . . . . . . . . . . . . . . . . . . . . . . . . . . . . . . . . . . . . . . . . . . .139
APPENDIX 2−−ANEXO 2
FINANCIAL STATEMENT−DECLARACION FINANCIERA . . . . . . . . . . . . . . . . . . . . . . . . . .140
APPENDIX 3−−ANEXO 3
CONTRIBUTIONS BY IATTC STAFF MEMBERS PUBLISHED DURING 2001−CONTRIBUCIONES POR PERSONAL DE CIAT PUBLICADOS DURANTE 2001 . . . . . . . .146
ANNUAL REPORT OF THEINTER-AMERICAN TROPICAL TUNA COMMISSION, 2001
INTRODUCTION
The Inter-American Tropical Tuna Commission (IATTC) operates under the authority anddirection of a convention originally entered into by Costa Rica and the United States. The con-vention, which came into force in 1950, is open to adherence by other governments whosenationals fish for tropical tunas and tuna-like species in the eastern Pacific Ocean (EPO). Underthis provision Panama adhered in 1953, Ecuador in 1961, Mexico in 1964, Canada in 1968, Japanin 1970, France and Nicaragua in 1973, Vanuatu in 1990, Venezuela in 1992, El Salvador in 1997,and Guatemala in 2000. Canada withdrew from the IATTC in 1984.
The IATTC’s responsibilities are met with two programs, the Tuna-Billfish Program andthe Tuna-Dolphin Program.
The principal responsibilities of the Tuna-Billfish Program specified in the IATTC’s con-vention were (1) to study the biology of the tunas and related species of the eastern Pacific Oceanto estimate the effects that fishing and natural factors have on their abundance and (2) to rec-ommend appropriate conservation measures so that the stocks of fish could be maintained atlevels which would afford maximum sustainable catches. It was subsequently given the respon-sibility for collecting information on compliance with Commission resolutions.
The IATTC’s responsibilities were broadened in 1976 to address the problems arising fromthe incidental mortality in purse seines of dolphins that associate with yellowfin tuna in theEPO. The Commission agreed that it “should strive to maintain a high level of tuna productionand also to maintain [dolphin] stocks at or above levels that assure their survival in perpetuity,with every reasonable effort being made to avoid needless or careless killing of [dolphins]”(IATTC, 33rd meeting, minutes: page 9). The principal responsibilities of the IATTC’s Tuna-Dolphin Program are (1) to monitor the abundance of dolphins and their mortality incidental topurse-seine fishing in the EPO, (2) to study the causes of mortality of dolphins during fishingoperations and promote the use of fishing techniques and equipment that minimize these mor-talities, (3) to study the effects of different modes of fishing on the various fish and other ani-mals of the pelagic ecosystem, and (4) to provide a secretariat for the International DolphinConservation Program, described below.
On June 17, 1992, the Agreement for the Conservation of Dolphins (“the 1992 La JollaAgreement”), which created the International Dolphin Conservation Program (IDCP), wasadopted. The main objective of the Agreement was to reduce the mortality of dolphins in thepurse-seine fishery without harming the tuna resources of the region and the fisheries thatdepend on them. On May 21, 1998, the Agreement on the International Dolphin ConservationProgram (AIDCP), which built on and formalized the provisions of the 1992 La Jolla Agreement,was signed, and it came into effect on February 15, 1999. The Parties to this agreement, whichin 2001 consisted of Bolivia, Colombia, Costa Rica, Ecuador, the European Union, Honduras,Mexico, Nicaragua, Panama, Peru, the United States, Vanuatu, and Venezuela, would be “com-mitted to ensure the sustainability of tuna stocks in the eastern Pacific Ocean and to progres-sively reduce the incidental mortalities of dolphins in the tuna fishery of the eastern Pacific Oceanto levels approaching zero; to avoid, reduce and minimize the incidental catch and the discard ofjuvenile tuna and the incidental catch of non-target species, taking into consideration the inter-relationship among species in the ecosystem.”
To carry out these missions, the IATTC conducts a wide variety of investigations at sea,
ANNUAL REPORT 2001 5

in ports where tunas are landed, and in its laboratories. The research is carried out by a perma-nent, internationally-recruited research and support staff (Appendix 1) selected by the Director,who is directly responsible to the Commission.
The scientific program is now in its 51st year. The results of the IATTC staff’s researchare published in the IATTC’s Bulletin and Stock Assessment Report series in English andSpanish, its two official languages, in its Special Report and Data Report series, and in books, out-side scientific journals, and trade journals. Summaries of each year’s activities are reported uponin the IATTC’s Annual Reports, also in the two languages.
MEETINGS
The background documents and the minutes or chairman’s reports of most of the IATTCand AIDCP meetings described below are available on the IATTC’s web site, www.iattc.org.
68TH MEETING OF THE IATTC
The 68th meeting of the IATTC was held in San Salvador, El Salvador, on June 19-21, 2001.The Commission agreed on conservation programs for yellowfin and bigeye for 2001, adopted aschedule of financial contributions for the 2001-2002 fiscal year, agreed to establish a jointworking group with the Parties to the Agreement on the International Dolphin ConservationProgram to address the problem of fishing by vessels of non-Party nations, and agreed to extendthe prohibition of discards of tunas by purse seiners. The following appointments were made:Chairman of the IATTC, Dr. Jerónimo Ramos of Mexico; Chairman of the Permanent WorkingGroup on Fleet Capacity, Lic. Mario González of El Salvador; Chairman of the Working Group onthe IATTC Convention, Ambassador Jean-François Pulvenis of Venezuela; Chairwoman of theWorking Group of Compliance, Lic. Mara Angelica Murillo Correa of Mexico; Chairman of theWorking Group on Bycatch, Ing. Luis Torres Navarrete of Ecuador; Chairman of the WorkingGroup on Finance, Mr. Svein Fougner of the United States.
MEETINGS OF IATTC WORKING GROUPS
The following meetings of IATTC working groups were held during 2001:
Group Meeting Location DatesWorking Group on Finance 3 La Jolla, USA Jan. 31-Feb. 2
4 San Salvador, El Salvador Jun. 18
5 La Jolla, USA Aug. 29-31Working Group on the IATTC Convention 6 San Jose,
Costa Rica Apr. 16-207 La Jolla, USA Sep. 3-7
Scientific Working Group 2 La Jolla, USA Apr. 30-May 4Meeting to Collate Information on Swordfish and to Assess SwordfishStocks in the Eastern Pacific Ocean La Jolla, USA May 7-8Permanent Working Group on Compliance 2 San Salvador, El
Salvador Jun. 16
6 TUNA COMMISSION

MEETINGS OF THE PARTIES TO THE AGREEMENT ON THE INTERNATIONALDOLPHIN CONSERVATION PROGRAM (AIDCP)
Fifth meeting of the Parties to the AIDCP
The fifth meeting of the Parties to the AIDCP was held in San Salvador, El Salvador, onJune 15-20, 2001. The principal subject of discussion was the establishment of a system for cer-tification of dolphin-safe tuna, and the Parties adopted the Resolution to Establish Procedures forAIDCP Dolphin Safe Tuna Certification.
Sixth meeting of the Parties to the AIDCP
The sixth meeting of the Parties to the AIDCP was held in Cartagena, Colombia, onOctober 29, 2001. The topics of discussion included proposed amendments to Annex IV of theAIDCP, per-stock, per-year dolphin mortality caps, establishment of an IATTC-AIDCP JointWorking Group on Fishing by Non-Parties, and new or late requests for Dolphin Mortality Limits.
MEETINGS OF AIDCP WORKING GROUPS
The following meetings of AIDCP working groups were held during 2001:
Group Meeting Location DatesInternational Review Panel 26 La Jolla, USA Jan. 29-30
27 San Salvador, El Salvador Jun. 13-14
28 Cartagena, Colombia Oct. 25-26Permanent Working Group on Tuna Tracking 6 San Jose, Costa Rica Apr. 23-24
7 San Salvador, El Salvador Jun. 11-12
8 Cartagena, Colombia Oct. 27
MEETINGS OF JOINT PROJECTS INVOLVING THE IATTC'S ACHOTINES LABORA-TORY
Joint OFCF-Panama-IATTC Project
The final meeting of the joint OFCF [Overseas Fishery Cooperation Foundation]-Panama-IATTC project, which commenced in 1993, was held at the Achotines Laboratory on January 23and 24, 2001. The accomplishments of the project were reviewed, and plans for continuingresearch on tunas and other local species were discussed.
Joint University of Miami-IATTC Project
Staff members of the IATTC met with representatives of the University of Miami’s Centerfor Sustainable Fisheries and Graduate Aquaculture Program on November 28-29, 2001, inMiami, Florida, USA. On November 29, 2001, a Memorandum of Understanding pertaining to ajoint research program at the Achotines Laboratory was signed.
ANNUAL REPORT 2001 7

ADMINISTRATION
BUDGET
At its 63rd meeting, held in Guayaquil, Ecuador, on June 8-10, 1999, the Commissionunanimously approved the budget for the 2000-2001 fiscal year, submitted by the Director, in theamount of US$4,785,849. However, the final amount received from the member states duringthe 2000-2001 fiscal year was US$4,617,997, a shortfall of US$167,852 relative to the amountthat was recommended and approved for the regular budget. As a consequence, some plannedresearch had to be curtailed. In addition to its regular budget, during the 2000-2001 fiscal yearthe IATTC received US$1,316,640 from vessel owners to pay part of the costs of placingobservers on their vessels, as required by the Agreement on the International DolphinConservation Program, US$892,838 from other contract revenue, and US$95,874 from interestand other sources.
FINANCIAL STATEMENT
The Commission’s financial accounts for the 2000-2001 fiscal year were audited by theaccounting firm of KPMG LLP. Summary tables of its report are shown in Appendix 2 of thisreport.
DATA COLLECTION
The IATTC staff is concerned principally with the eastern Pacific Ocean (EPO; Figure 1),currently defined as the area bounded by the coastline of North, Central, and South America,40°N, 150°W, and 40°S.
During 2001 the IATTC had scientists and technicians in La Jolla and at its field offices inLas Playas and Manta, Ecuador; Ensenada and Mazatlán, Mexico; Panama, Republic of Panama;Mayaguez, Puerto Rico, USA; and Cumaná, Venezuela. IATTC personnel collect landings data,abstract the logbooks of tuna vessels to obtain catch and effort data, measure fish and collectother biological data, and assist with the training, placement, and debriefing of observers aboardvessels participating in the International Dolphin Conservation Program (IDCP). This work iscarried out not only in the above-named ports, but also in other ports in California, Colombia,Costa Rica, Ecuador, Mexico, Panama, Peru, Puerto Rico, and Venezuela, which are visited regu-larly by IATTC employees. During 2001 IATTC personnel abstracted the logbook information for1,146 trips of commercial fishing vessels, sampled the contents of 908 wells of commercial fishingvessels (often obtaining length-frequency data for more than one species from the fish in thewell), and sampled 95 landings of bluefin caught by sport-fishing vessels. Also, the field staffsplaced IATTC observers on 487 fishing trips by vessels participating in the IDCP. In addition,IATTC observers completed 479 trips during the year, and were debriefed by field staff membersat their assigned stations.
THE FISHERY FOR TUNAS AND TUNA-LIKE FISHES IN THE EASTERN PACIFICOCEAN
The surface fleet
The IATTC maintains detailed records of gear, flag, and fish-carrying capacity for most ofthe vessels that fish with surface gear for yellowfin (Thunnus albacares), skipjack (Katsuwonus
8 TUNA COMMISSION

pelamis), bigeye (Thunnus obesus), or Pacific bluefin (T. orientalis) tuna in the eastern PacificOcean (EPO; Figure 1). Historically, detailed records have not been maintained for most longlinevessels, nor for sport-fishing vessels and small craft such as canoes and launches, though recentlythe staff began compiling and maintaining these records, and will continue to do so in the future.The fleet described here includes purse seiners and pole-and-line vessels (hereafter referred to assurface gear) that have fished all or part of the year in the EPO for these four species.
Historically the owner’s or builder’s estimates carrying capacities of individual vessels, intons of fish, were used until landing records indicated that revision of these estimates wasrequired. The vessels were grouped, by carrying capacity, originally in short tons and later inmetric tons, into six size classes.
During the past several years the IATTC staff has used well volume, in cubic meters,instead of weight, in metric tons, to measure the carrying capacitiesof the vessels. Since a wellcan be loaded with different densities of fish, measuring carrying capacity in weight is subjective,as a load of fish packed into a well at a higher density weighs more than a load of fish packed ata lower density. Using volume as a measure of capacity eliminates this problem. The size classesand well volumes are as follows:
Class Well volume (cubic meters)1 <532 53-1063 107-2124 213-3195 320-4256 >425
The IATTC staff began collecting capacity data by volume in 1999, but has not yet obtained thisinformation for all vessels. For vessels for which reliable information on well volume is notavailable, a factor of 1.17051 is used to convert the estimated capacity in metric tons to cubicmeters. This conversion factor is consistent with the density at which the fish were packed intothe wells of the vessels at the time that the size classification was developed. This conversionfactor was also applied to all capacity data for 1961-1998 to facilitate comparisons among years(Table 1).
Until about 1960 fishing for tunas in the EPO was dominated by pole-and-line vesselsoperating in the more coastal regions and in the vicinity of offshore islands. During the late1950s and early 1960s most of the larger pole-and-line vessels were converted to purse seiners,and by 1961 the EPO surface fleet was dominated by these vessels. During the 1961-2001period the number of pole-and-line vessels decreased from 93 to 11, and their total well volumefrom about 11 to 1 thousand cubic meters (m3). During the same period the number of purseseiners increased from 125 to 203, and their total well volume from about 32 thousand to 189thousand m3, an average of about 933 m3 per vessel. An earlier peak in numbers and total wellvolume of purse seiners occurred from the mid-1970s to the early 1980s, when the number ofvessels reached 282 and the total well volume about 196 thousand m3, an average of about 693m3 per vessel.
The construction of new purse seiners, which began during the mid-1960s, resulted in anincrease in the total well volume of the surface fleet from about 49 thousand m3 in 1966 toabout 195 thousand m3 in 1976. During the 1976-1981 period the total well volume increasedslightly. Construction of new vessels continued, but this was mostly offset by losses due to sinkings
ANNUAL REPORT 2001 9

and vessels leaving the fishery. The catch rates in the EPO were low during 1978-1981 due to con-centration of fishing effort on small fish, and the situation was exacerbated by a major El Niñoevent, which began in mid-1982 and persisted until late 1983 and made the fish less vulnerableto capture. The total well volume then declined as vessels were deactivated or left the EPO to fishin other areas, primarily the western Pacific Ocean, and in 1984 it reached its lowest level since1971, about 125 thousand m3. In early 1990 the U.S. tuna-canning industry adopted a policy ofnot purchasing tunas caught during trips during which sets on tunas associated with dolphinswere made. This caused many U.S.-flag vessels to leave the EPO, with a consequent reduction inthe fleet to about 119 thousand m3 in 1992. With increases in participation of vessels of othernations in the fishery, the total well volume has increased steadily since 1992, and in 2001 was191 thousand m3.
The 2000 and preliminary 2001 data for numbers and total well volumes of purse seinersand pole-and-line vessels that fished for tunas in the EPO are shown in Tables 2a and 2b. Thefleet was dominated by vessels operating under the Mexican and Ecuadorian flags during 2001.The Mexican fleet, which has been the largest fleet since 1987, had about 25 percent of the totalwell volume during 2001, while vessels registered in Ecuador, Venezuela, Spain, and Panama com-prised about 25, 17, 6, and 5 percent of the total total well volume, respectively.
Class-6 purse seiners made up about 90 percent of the total well volume of the surface gearoperating in the EPO during 2001.
The monthly average, minimum, and maximum total well volumes at sea (VAS), in thou-sands of cubic meters, of vessels that fished at the surface for tunas in the EPO during 1991-2000, and the 2001 values, are shown in Figure 2. The monthly values are averages of the VASestimated at weekly intervals by the IATTC staff. The fishery was regulated during some orall of the last four months of 1998-2001 (see the section entitled MEASURES FOR THECONSERVATION OF TUNAS and the equivalent sections of previous Annual Reports), sothe VAS values for September-December 2001 are not comparable to the average VAS values forthose months of 1991-2000. Overall, the 2001 VAS values are greater than the 1991-2000 aver-ages, although the percentage of the total well volume at sea, 57 percent, was about the same.During the 1991-2000 period the average VAS value was 77 thousand m3, but during 2001 it was92 thousand m3.
Catches and landings
Tunas
Surface catches
Estimates of the catches and landings of tunas come from several sources, including log-books kept by the fishermen, data recorded by observers aboard the vessels, unloading data pro-vided by canneries and other processors, and export and import records. Estimating the totalcatch for a fishery is difficult, however, due to the lack of information on fish that are caught,but, for various reasons, discarded at sea (dead or dying in the case of tunas). Data on fish dis-carded at sea by Class-6 vessels have been collected by observers since 1993. This informationallows for better estimation of the total amounts of fish caught by the surface fleet. Estimatesof the total amount of catch that is landed (hereafter referred to as retained catch) are basedprincipally on data from unloadings. Annual estimates of the retained and discarded catches ofthe various species of tunas captured by vessels of the EPO surface fleet are shown in Table 3,which also includes catch data for U.S.-flag sport-fishing vessels and other miscellaneous typesof surface gear. In the case of bluefin, the recreational catches have become an increasingly
10 TUNA COMMISSION

important component of the total catch in recent years.The statistics for 2001 are compared to those for 1986-2000. There were no restrictions
on fishing for tunas in the EPO during 1986-1997. However, as mentioned previously, there wererestrictions on fishing during some or all of the last four months of 1998-2001 (see the sectionentitled MEASURES FOR THE CONSERVATION OF TUNAS and the equivalent sectionsof previous Annual Reports). Furthermore, regulations placed on purse-seine vessels directingtheir effort at tunas associated with dolphins have probably affected the way these vesselsoperate, especially since the late 1980s. Also, as mentioned previously, there was a major El Niñoevent during 1982-1983, which made the fish less vulnerable to capture. The fishing effortremained relatively low during 1984-1986. During 1997-1998 another major El Niño eventoccurred in the EPO.
The average annual retained catch of yellowfin in the EPO by surface gear during 1986-2000 was 259 thousand mt (range: 219 to 297 thousand mt). The preliminary estimate of theretained catch of yellowfin in 2001, 395 thousand mt, is the greatest on record, exceeding theaverage for 1986-2000 by 52 percent. The average amount of yellowfin discarded at sea by thesurface fisheries during 1993-2001 was about 2.1 percent (range: 1.7 to 2.6 percent) of the totalsurface catch of yellowfin (retained catch plus discards).
During 1986-2000 the annual retained catch of skipjack from the EPO averaged 115 thou-sand mt (range: 62 to 268 thousand mt). The preliminary estimate of the retained catch of skip-jack in 2001, 144 thousand mt, is less than those of 1999 and 2000, but 26 percent greater thanthe average for 1986-2000. The average amount of skipjack discarded at sea during 1993-2001was about 12.3 percent (range: 8.6 to 18.2 percent) of the total catch of skipjack.
Prior to 1994 the average annual retained catch of bigeye in the EPO by surface gear wasabout 5 thousand mt (range: <1 to 15 thousand mt). After 1993 the annual retained catchesincreased from 29 thousand mt in 1994 to 35 to 52 thousand mt during 1995-1999 to 70 thousandmt in 2000. The preliminary estimate of the retained catch of bigeye in the EPO in 2001 is 44thousand mt. These increasing catches of bigeye followed the development of fish-aggregatingdevices (FADs) placed in the water by fishermen to aggregate tunas. The average amount ofbigeye discarded at sea by the surface fisheries during 1993-2001 was about 7.8 percent (range:2.8 to 11.2 percent) of the total surface catch of bigeye.
While yellowfin, skipjack, and bigeye comprise the most significant portion of the retainedcatches of the surface fleet in the EPO, bluefin, albacore (Thunnus alalunga), black skipjack(Euthynnus lineatus), bonito (Sarda orientalis), and other species contribute to the overall har-vest in this area. The total retained catch of these other species by these fisheries was about 3thousand mt in 2001, which is well below the 1986-2000 annual average retained catch of about8 thousand mt (range: 1.9 to 17.3 thousand mt). The estimated discarded catches of these speciesfor the 1993-2001 period are presented in Table 3. Estimates of the discards of other species, innumbers of individuals, can be found in Tables 11b and 11c.
The retained catches in the EPO during 2000, by flag, and the landings of EPO-caughttunas taken by surface gear in the EPO, by country, are given in Table 4a, and preliminaryestimates of the equivalent data for 2001 are given in Table 4b. The estimated retained catchof all species in the EPO during 2001 was about 586 thousand mt, which was slightly greaterthan that for 2000, 560 thousand mt, and much greater than the average for 1986-2000 of 405thousand mt. Ecuadorian- and Mexican-flag vessels each harvested about 25 percent each, andVenezuelan-flag vessels about 19 percent, of the retained catches of all species made in2001.Other countries with significant catches were Spain (7 percent) and Panama and Vanuatu(4 percent each).
ANNUAL REPORT 2001 11

The landings are fish unloaded from fishing vessels during a calendar year, regardless ofthe year of catch. The country of landing is that in which the fish were unloaded or, in the caseof transshipments, the country that received the transshipped fish. Preliminary landings data(Table 4b) indicate that, of the 591 thousand mt of tunas landed in 2001, 39 percent was landedin Ecuador and 24 percent in Mexico. Other countries with significant landings of tunas caughtin the EPO included Colombia (7 percent) and Costa Rica and Venezuela (5 percent each). It isimportant to note that when final information is available the landings currently assigned to var-ious countries may change due to exports from storage facilities to processors in other nations.
Tunas are caught by surface gear in three types of schools, those in which the fish are asso-ciated with dolphins, those in which the fish are associated with floating objects, such as flotsamor FADs, and those in which the fish are associated only with other fish (unassociated schools).Estimates of the numbers of purse-seine sets of each type in the EPO during the 1987-2001period, and the retained catches of these sets, are listed in Table 5. The estimates for Class-1 to-5 vessels were calculated from logbook data in the IATTC statistical data base, and those forClass-6 vessels were calculated from logbook data and from the observer data bases of the IATTC,the Programa Nacional de Aprovechamiento del Atún y de Protección de Delfines (PNAAPD) ofMexico, the Programa Nacional de Observadores de Venezuela (PNOV), the Programa deObservadores Pesqueros de Ecuador (PROBECUADOR), and the U.S. National Marine FisheriesService. The greatest numbers of sets on schools associated with floating objects and on unasso-ciated schools of tuna were made during the period from the mid-1970s to the early 1980s.Despite opposition to fishing for tunas associated with dolphins and the refusal of U.S. canners toaccept tunas caught during trips during which sets were made on dolphin-associated fish, thenumbers of sets made on fish associated with dolphins decreased only moderately during the mid-1990s, and in 1998 were the greatest since 1990.
There are two types of floating objects, flotsam and FADs. The occurrence of the former isfortuitous, whereas the latter are constructed by fishermen specifically for the purpose ofattracting fish. FADs have been in use for only a few years, but their importance has increasedduring that period while that of flotsam has decreased, as shown by the data on numbers and per-centages of the sets made on floating objects by Class-6 vessels with IATTC observers aboard.
Flotsam FADs UnknownYear TotalNumber % Number % Number %
1992 1,087 61.7 556 31.5 120 6.8 1,7631993 1,138 55.2 825 40.0 100 4.8 2,0631994 773 27.9 1,899 68.6 98 3.5 2,7701995 729 20.7 2,704 76.8 88 2.5 3,5211996 537 13.4 3,447 86.0 23 0.6 4,0071997 832 14.7 4,768 84.4 52 0.9 5,6521998 752 13.7 4,627 84.4 102 1.9 5,4811999 833 18.0 3,758 81.3 29 0.6 4,6202000 488 12.5 3,381 86.3 47 1.2 3,9162001 567 10.0 5,076 89.7 16 0.3 5,659
The average annual distributions of the logged catches of yellowfin, skipjack, and bigeye byset type, by purse seiners in the EPO during the 1986-2000 period (1994-2000 for bigeye), areshown in Figures 3a, 4a, and 5a, and preliminary estimates for 2001 are shown in Figures 3b,
12 TUNA COMMISSION

4b, and 5b. The distributions of the catches of yellowfin and skipjack during 2001 were similarto those of 1986-2000, although some differences are evident.
Bigeye are not often caught by surface gear north of about 7°N. The distribution of thecatch of bigeye during 2001 was similar to those of 1994-2000, although some differences are evi-dent. With the development of the fishery for tunas associated with floating objects, describedabove, the relative importance of the nearshore areas has decreased, while that of the offshoreareas has increased.
The total retained catch per cubic meter of well volume (CPCMWV) for the vessels that fishat the surface for tunas in the EPO provides an index of trends in annual relative gross in-comefor vessels of various size groups. To provide more detail in this index than would be available ifthe IATTC’s historical six classes of vessel capacity classification were used, the vessels areassigned to eight size groups.
Estimates of the CPCMWVs for the 1990-2001 period are presented in Table 6 for the EPOand for all ocean fishing areas from which vessels of the EPO tuna fleet harvested fish, by sizegroup, area, and species. Yellowfin and skipjack contribute the most to the CPCMWVs for thelarger vessels, while other species, which include other tunas, and also other miscellaneous fishes,make up an important part of the CPCMWVs of the smaller vessels in many years. Bigeye becamemore important for the larger vessels after 1993. During the years in which the majority of theEPO tuna fleet exerted most or all of its fishing effort in the EPO, the CPCMWVs for the EPOand all ocean fishing areas were nearly the same. During the 1990-2000 period the CPCMWV inthe EPO for all vessels and all species averaged 2.8 mt , with a range of 2.4 to 3.3 mt; for yellowfinit averaged 1.7 mt, with a range of 1.5 to 2.0 mt, and for skipjack it averaged 0.9 mt, with a rangeof 0.5 to 1.5 mt. The corresponding average for bigeye for the 1994-2000 period was 0.3 mt, witha range of 0.2 to 0.4 mt. The preliminary estimates for 2001 are 3.1, 2.1, 0.8, and 0.2 mt for allspecies, yellowfin, skipjack, and bigeye, respectively.
Longline catches
Data on the retained catches for most of the larger longline vessels operating in the EPO,and for an increasing portion of the smaller ones, are obtained from various sources. These ves-sels, particularly the larger ones, direct their effort primarily at bigeye and yellowfin tuna. Theannual retained catches of yellowfin, bigeye, and bluefin by these fisheries are shown in Tables7a, 7c, and 7d. During 1985-1997 (the last year for which complete data are available) theretained catches of yellowfin remained relatively stable, averaging about 20 thousand mt(range: 13 to 30 thousand mt) per year, or about 7.5 percent of the total retained catches of yel-lowfin. Prior to 1985 the retained longline catches of bigeye averaged about 51 thousand mt(range: 31 to 74 thousand mt). In about 1985 the level of retained catches of bigeye increasesignificantly, and during 1985-1994 they averaged about 81 thousand mt (range: 66 to 102 thou-sand mt). During 1970-1993, prior to the increased use of FADs and resultant greater catchesof bigeye by purse-seine vessels, the longline fisheries, on average, accounted for 93 percent ofthe retained catches of this species from the EPO. During 1995-1997 the annual retainedcatches of bigeye by the longline fisheries ranged from about 40 to 56 thousand mt (average: 46thousand mt), which is well within the pre-1985 historical range, but significantly less than theretained catches during 1985-1994.
Billfishes
Swordfish (Xiphias gladius) are fished in the EPO with longline gear and gillnets, and
ANNUAL REPORT 2001 13

occasionally with recreational gear. Most of those caught with commercial gear are retained.Blue marlin (Makaira nigricans), black marlin (M. indica), striped marlin (Tetrapturus audax),shortbill spearfish (T. angustirostris), and sailfish (Istiophorus platypterus) are fished with long-line and recreational gear, and they are occasionally caught by purse-seine vessels. Most of thelongline-caught marlins, spearfish, and sailfish are retained, and most of those caught with com-mercial surface gear are discarded at sea. Information on the commercial catches and bycatchesof billfishes in the EPO is given in Table 8.
____________________
Under the terms of the convention that established the IATTC, the primary objective of theIATTC staff's research is monitoring the condition of the stocks of tunas and other species takenin the EPO by tuna fisheries. Taking into consideration the extensive movements of the tunas,the mobility of the vessels of the tuna fleets of various nations, and the international nature ofthe tuna trade, statistics on the catch and effort from the EPO must be viewed in the light ofglobal statistics. Statistics of the global catches of tunas and tuna-like fishes during 1991-2000,by oceans, appear in Tables 7a-7c and 9.
Discards and bycatches in the purse-seine fishery for tunas
IATTC observers began to collect information on discards and bycatches during purse-seine fishing operations in late 1992, and this program continued through 2001. In this subsec-tion “retained catches” refers to fish that are retained aboard the fishing vessel, “discards” tocommercially-important tunas (yellowfin, skipjack, bigeye, bluefin, and albacore) that are dis-carded dead at sea, “bycatches” to fish or other animals, other than commercially-important tu-nas, that are discarded dead at sea, and “total catches” to the sums of the first three categories.During 2001 the data collected during previous years were reviewed and revised when appropri-ate. Information on the coverage of sets on tunas associated with dolphins and with floating ob-jects and on unassociated tunas is given in Table 10. Column 3 of this table lists the numbers ofsets in the IATTC data base for which bycatch and discard data were recorded and Column 4 thenumbers of sets in the IATTC Tuna-Dolphin data base, plus equivalent data collected by thePrograma Nacional de Aprovechamiento del Atún y Protección de Delfines (PNAAPD) of Mex-ico,the Programa Nacional de Observadores de Venezuela (PNOV), and the Programa Nacional deObservadores de Ecuador (PROBECUADOR). (The numbers of sets for 1993 and 1998-2001 inColumn 4 of this table match those for Class-6 vessels in Table 5 because there were no observerson smaller vessels during those years. There were observers on some Class-5 vessels during 1994-1997, so the values for those years in Table 10 are greater than the corresponding values in theClass-6 columns of Table 5.) The coverage of vessels with observers is incomplete, but adequatefor most statistical purposes.
The discards and bycatches on trips of vessels with observers aboard were estimated by
DISCARDS = (discard/set) x SETSand
BYCATCHES = (bycatch/set) x SETS,
where DISCARDS and BYCATCHES = discards and bycatches for all trips with observersaboard, discard/set and bycatch/set = discards and bycatches per set for all sets for which IATTCobservers collected discard and bycatch data, and SETS = all sets for trips with observers aboard
14 TUNA COMMISSION
(Table 10, Column 4). These estimates are less than they would be if data for smaller vessels,which fish almost entirely on unassociated schools and floating objects, were included.
Discards and bycatches of tunas
Estimates of the discards of commercially-important tunas and the bycatches of black skip-jack tuna, bullet tuna, and bonito by vessels with observers are shown in Table 11a. Dis-cards arealways wasteful, as they reduce the recruitment of catchable-size fish to the fishery and/or theyield per recruit. Catching small yellowfin and bigeye, even if they are retained, re-duces theyields per recruit of these species.
Bycatches of other species
Estimates of the bycatches of animals other than commercially-important tunas areshown in Tables 11b and 11c. The bycatches of nearly all species except dolphins are greatestin sets on floating objects, intermediate in sets on free-swimming schools, and least in sets ondolphins. Billfishes, dorado (Coryphaena spp.), wahoo (Acanthocybium solandri), rainbow run-ners (Elagatis bipinnulata), yellowtail (Seriola lalandi), and some species of sharks and raysare the objects of commercial and recreational fisheries in the EPO. The sea turtles caught bypurse-seine vessels include olive ridley (Lepidochelys olivacea), green (Chelonia mydas),leatherback (Dermochelys coriacea), hawksbill (Eretmochelys imbricata), and loggerhead(Caretta caretta) turtles, all of which are considered to be endangered or threatened. (Most ofthese are released in viable condition; Table 11c includes only the turtles that were killed or hadsustained injuries that were judged likely to lead to death.) The information available on thebiology of the species of fish listed in Table 11c is insufficient to determine the effects of theircapture by the purse-seine fishery.
SIZE COMPOSITIONS OF THE SURFACE CATCHES OF TUNAS
Length-frequency samples are the basic source of data used for estimating the size and agecompositions of the various species of fish in the landings. This information is necessary to obtainage-structured estimates of the population for various purposes, including age-structured popu-lation modeling. The results of that modeling can be used to estimate recruitment, which can becompared to spawning biomass and oceanographic conditions. Also, the estimates of mortalityobtained from age-structured population modeling can be used, in conjunction with growth esti-mates, for yield-per-recruit modeling. The results of such studies have been described in IATTCBulletins, its Annual Reports for 1954-1998, and its Stock Assessment Reports.
Length-frequency samples of yellowfin, skipjack, bigeye, Pacific bluefin, and occasionallyblack skipjack from purse-seine, pole-and-line, and recreational catches made in the easternPacific Ocean (EPO) are collected by IATTC personnel at ports of landing in Ecuador, Mexico,Panama, the USA (California and Puerto Rico), and Venezuela. The catches of yellowfin and skip-jack were first sampled in 1954, bluefin in 1973, and bigeye in 1975, and sampling has continuedto the present.
The methods for sampling the catches of tunas are described in the IATTC Annual Reportfor 2000. Briefly, the fish in a well of a purse seiner or pole-and-line vessel are selected for sam-pling only if all the fish in the well were caught during the same calendar month, in the same typeof set (floating-object, unassociated school, or dolphin), and in the same sampling area. These dataarethen categorized by fishery (Figure 6). Samples from 1,003 wells were taken during 2001.
Data for fish caught during the 1996-2001 are presented in this report. Two
ANNUAL REPORT 2001 15

length-frequency histograms are presented for each species. For yellowfin, skipjack, and bigeye,the first shows the data by fishery (gear type, set type, and area) for 2001. The second, which issimilar to those of previous years, shows the catch for the current year and the previous fiveyears. For bluefin, the first and second histograms show the 1996-2001 catches by commercialand recreational gear, respectively.
There are ten yellowfin surface fisheries defined for stock assessments: four floating-object,two unassociated school, three dolphin, and one pole-and-line (Figure 6). Of the 1,003 wells sam-pled, 849 contained yellowfin. The estimated size compositions of the fish caught during 2001 areshown in Figure 7a. The majority of the yellowfin catch was taken in unassociated school setsand dolphin sets. The average weights of the fish caught in association with dolphins were morethan twice that of those caught in association with floating objects or in unassociated school sets.The average weights of yellowfin caught in unassociated school sets in the Southern area and byfloating-object sets in the Inshore area in 2001 were greater than those of the previous five years.
The estimated size compositions of the yellowfin caught by all fisheries combined during1996-2001 are shown in Figure 7b. The size ranges of yellowfin are generally consistent over time(40-160 cm), but the size distributions differ among years. The average weight of the yellowfincaught during 2001 was greater than those of the fish caught during previous five years, probablydue mostly to the catches of large yellowfin off Peru during the first half of 2001.
There are eight skipjack fisheries defined for stock assessments: four floating-object, twounassociated school, one dolphin, and one pole-and-line. The last two fisheries include all 13 sam-pling areas. Of the 1,003 wells sampled, 459 contained skipjack. The estimated size compositionsof the fish caught during 2001 are shown in Figure 8a. The majority of the fish was taken infloating-object sets. Less catch was taken by unassociated sets in the Southern area than in 2000.Negligible amounts of skipjack were caught in dolphin sets and by pole-and-line vessels.
The estimated size compositions of the skipjack caught by all fisheries combined during1996-2001 are shown in Figure 8b. The average weight of the fish caught during 2000 was greaterthan those of the fish caught during 2001 or any of the previous four years.
There are seven bigeye surface fisheries defined for stock assessments: four floating-object,one unassociated school, one dolphin, and one pole-and-line. The last three fisheries include all13 sampling areas. Of the 1,003 wells sampled, 204 contained bigeye. The estimated size com-positions of the fish caught during 2001 are shown in Figure 9a. During 2001 significantly lessbigeye was caught in sets on floating objects in the Galapagos area than during 2000. Smallamounts of bigeye were caught in unassociated school sets and dolphin sets. There were norecorded catches of bigeye by pole-and-line-vessels.
The estimated size compositions of the bigeye caught by all fisheries combined during1996-2001 are shown in Figure 9b. The average weight of the fish caught during 2001 was greaterthan during 1996-1999, but much less than during 2000.
Pacific bluefin are caught by surface gear by both commercial and sport-fishing vessels offCalifornia and Baja California, with most of the catch being taken between about 23°N to 35°Nduring May through October. During 2001 bluefin were caught between 25°N and 37°N. Thecatch of bluefin by commercial vessels was less during 2001 than during any of the previous fiveyears, and all of the recorded catch was taken during July and August. Most of the catches bysport-fishing vessels were taken during June through September, but smaller amounts weretaken in March and May. Histograms showing the estimated commercial and sport catches ofbluefin during each year of the 1996-2001 period appear in Figures 10a and 10b, respectively.Distinct modal groups are evident in most of the years for both the commercial and sport catches.
16 TUNA COMMISSION

The numbers of samples of bluefin obtained from the commercial and recreational catchesduring recent years were as follows:
Year Commercial Recreational Year Commercial Recreational1990 14 0 1996 67 51991 4 0 1997 17 91992 1 1 1998 23 221993 4 35 1999 51 121994 2 11 2000 20 581995 6 16 2001 3 95
The greatest number of samples from the commercial fleet was taken in 1996, a year of unusu-ally high catches. The large numbers of samples taken from the commercial fleet during 1999 andfrom the recreational fleet during 2000 and 2001 were due to greater sampling effort, rather thanto greater catches of fish. In recent years a considerable portion of the commercial bluefin catchhas been transported to holding pens, where they are held for fattening and later sale as sashimi-grade fish. These fish are not available for measuring.
Black skipjack are caught incidentally by fishermen who are directing their effort towardyellowfin, skipjack, and bigeye tuna. The demand for this species is low, so most of the catch isdiscarded at sea, but small amounts, mixed with the more desirable species, are sometimesretained. Because only nine samples of black skipjack were taken from the 1,003 wells sampledduring 2001, length-frequency histograms for this species are not presented in this report.
OBSERVER PROGRAM
The IATTC employs observers, who keep counts of the mortalities of the various species ofdolphins during fishing operations, and these data are used by the IATTC staff to make its cur-rent and annual estimates of dolphin mortality due to the fishery. The observers also record dataon herds of dolphins sighted that may be used to make estimates of the relative abundances ofdolphins. Information recorded on the conditions coincident with mortality of dolphins is used tostudy the causes of dolphin mortality, and the knowledge gained from those studies is shared withthe fishermen through the IATTC’s educational activities, such as seminars for captains and crewmembers of purse-seine vessels and analyses of the performances of individual captains. In addi-tion, since late 1992, the observers have recorded data on the fish and other animals released ordiscarded at sea.
Observer coverage
The design for placement of observers during 2001 called for 100-percent coverage offishing trips in the eastern Pacific Ocean (EPO) by all purse seiners with carrying capacitiesgreater than 363 metric tons (mt). Mexico, Venezuela, and Ecuador have their own observer pro-grams. The national programs of Mexico (Programa Nacional de Aprovechamiento del Atún yProtección de Delfines (PNAAPD)) and Venezuela (Programa Nacional de Observadores deVenezuela (PNOV)) each covered about 50 percent of the trips by purse seiners with capacitiesgreater than 363 mt registered in those nations. Ecuador’s Programa Nacional de ObservadoresPesqueros de Ecuador (PROBECUADOR) began the year sampling about 25 percent of the tripsof its vessels, and increased its coverage later in the year toward a goal of 34 percent. TheIATTC Tuna-Dolphin Program sampled the remainder of the trips by the fleets of Ecuador,
ANNUAL REPORT 2001 17

Mexico, and Venezuela, plus all trips by vessels of other fleets, except as noted below. TheIATTC’s international observer program and the national observer programs of Ecuador, Mexico,and Venezuela are part of the On-Board Observer Program of the Agreement on the InternationalDolphin Conservation Program (AIDCP).
During 2001 observers from the On-Board Observer Program departed on 698 fishing trips(Table 12). In addition, 54 vessels whose last trip of 2000 carried over into 2001 had observersaboard, bringing the total to 752 trips observed in 2001. The Program covered vessels operatingunder the jurisdictions of Belize, Bolivia, Colombia, Ecuador, El Salvador, Guatemala, Honduras,Mexico, Nicaragua, Panama, Spain, the United States, Vanuatu, and Venezuela, plus one vessel ofunknown registry. Nineteen of these trips were made by vessels that at the time of departurewere flying the flags of nations that were not Parties to the AIDCP.
During 2001 the On-Board Observer Program sampled 98.2 percent of all trips by purseseiners with capacities greater than 363 mt, and the IATTC program sampled 69.2 percent ofthese. Of the 14 trips not sampled, 10 were made by 5 Bolivian-flag vessels during a period whenthe Parties decided to withhold observers from Bolivian vessels pending clarification regardingBolivia's participation in the IDCP. After Bolivia began its participation in August, one of its ves-sels made a trip without an observer because its management refused to accept the assignedobserver. Observers were not aboard on three other trips, two by a vessel of unknown registryand one by a Vanuatu-flag vessel (which was in the process of changing its flag to that of Bolivia),because the managers of those vessels did not request observers.
Observer training
In November 2001 a training course for observers was held in Manta, Ecuador. It wasattended by 23 trainees, 18 from the IATTC program and 5 from the Ecuadorian nationalobserver program.
At-sea reporting by observers
Article V.2 of the AIDCP calls for the establishment of per-stock per-year dolphin mortalitylimits. To monitor that mortality on a current basis, and also to better monitor the cumulativecatch of the principal tuna species in the EPO, the observers from the IATTC and the nationalobserver programs complete an at-sea reporting form each week and send the information fromtheir vessels to their respective offices by e-mail, fax, or radio.
RESEARCH
AGE AND GROWTH OF BIGEYE TUNA
Little is known about the age and growth of bigeye tuna in the eastern Pacific Ocean(EPO). Accurate information on the age and growth is necessary for understanding the biologyand population dynamics of this species. Size-at-age data permit the formulation of growth esti-mates, and make it feasible to incorporate age-specific characteristics, such as mortality andfecundity, into population dynamics models.
Most recent ageing studies of marine fishes have utilized natural marks in calcified struc-tures as time indicators. The age of the fish can be accurately estimated from these structures,provided the deposition rate of the marks is known. Both sagittal otoliths and caudal vertebraehave been utilized for age determinations for several species of the genus Thunnus. Counts ofmicroincrements on the surfaces of the otoliths of the fish from a tagging and oxytetracycline
18 TUNA COMMISSION

(OTC)-marking experiment initiated off Hawaii in 1995 demonstrated that bigeye in the sizerange of about 38 to 117 cm deposit the increments at daily intervals (IATTC Annual Report for1999: 29). Otoliths have recently been recovered from 13 bigeye, ranging in length from 104 to135 cm, that were tagged and injected with OTC in the equatorial EPO during March-May 2000.The initial results, based on counts of microincrements from the OTC mark to the tip of thepostrostrum, also indicate that the microincrements are deposited on the surfaces of the otolithsat daily intervals.
Counting microincrements on the surfaces of otoliths is extremely time-consuming and dif-ficult (IATTC Bulletin, Vol 18, No. 6), so a technique of sectioning the otoliths is now being inves-tigated, using the complete set of recovered OTC-marked otoliths from Hawaii and the EPO.Frontal sections, along the primordium to the post-rostral axis of the otoliths, appear to providean optimal counting path for bigeye otoliths. This is the longest path, so it provides wider incre-ments than transverse sections, which maximizes the opportunity for resolving daily microincre-ments up to some maximum age. Sectioning, polishing, and acid-etching techniques have beenestablished, and the OTC marks and microincrements are clearly recognizable in all preparationsto date. Validation of this ageing technique will probably be completed in early 2002.
A program to sample otoliths, caudal vertebra, and gonads of bigeye, and lengths andweights of the fish, was initiated in January 2001 at the IATTC field offices in Las Playas andManta, Ecuador. Fish of 12 10-cm length classes between 30 and 150 cm were sampled. Fifteenfemales and fifteen males were to be selected for each length class, making a total of 360 speci-mens. As of the end of December 2001, 299 specimens had been sampled, and it is likely that thefull complement of samples will have been collected by early 2002. The otoliths and vertebraewere to be utilized to provide direct estimates of sex-specific age and growth of bigeye caught bythe fishery in the EPO.
REPRODUCTIVE BIOLOGY OF BIGEYE TUNA
Little is known about the size and age at sexual maturity, spawning distribution, and fecun-dity of bigeye tuna in the eastern Pacific Ocean (EPO). A 2-year program to sample gonads ofbigeye, carried out by IATTC observers aboard purse-seine vessels fishing in the EPO, was initi-ated in January 2000. Personnel of the National Research Institute of Far Seas Fisheries of Japanrequested that gonads of bigeye caught in the EPO by longline vessels be sampled concurrently.The objective of this collaborative project was to obtain a comprehensive understanding of thereproductive biology of bigeye in the EPO, which is necessary for stock assessment.
As of the end of 2001, samples had been taken on 20 purse-seine trips, producing 838females with ovarian tissues suitable for histological processing and examination. Those tissuesamples were processed at the Achotines Laboratory, and microscope slides of them were preparedby a company in San Diego. These slides would be examined to identify the stages of oogenesis,providing an accurate assessment of the reproductive status of each fish. Ovaries were alsoselected to use to estimate the fecundity of the fish.
At the end of 2001 the sampling program had not yet provided a sufficient number of sam-ples, particularly from fish greater than 120 cm in length, for conducting a proper evaluation ofthe reproductive characteristics of bigeye in the equatorial EPO. The sampling program will becontinued for an additional 2 years in order to attempt to obtain the required samples.
ANNUAL REPORT 2001 19

TUNA TAGGING
Tropical tunas
Phase 1 of a proposed multi-year bigeye tuna tagging project was initiated during March-May 2000 on the chartered pole-and-line vessel Her Grace. The numbers of returns, as of the endof December 2001, were as follows:
Species Tag type Released Returned Percent returnedBigeye conventional 101 22 21.8Bigeye archival 96 29 30.2Skipjack conventional 1,238 260 21.0Yellowfin conventional 71 8 11.3
The greatest times at liberty for bigeye and skipjack were 446 and 224 days, respectively. Thegreatest displacements of bigeye and skipjack from their release to recapture positions were 1,499and 2,167 nautical miles, respectively.
All but one of the 29 archival tags applied to bigeye that were recaptured have been recov-ered. The times at liberty, from release to recapture, ranged from 8 to 446 days. Of the 28archival tags that were recovered, 23 were on fish that were at liberty less than 30 days. Variousspatial statistics, based on filtered estimates of the locations derived from the archival tag lightlevel data, have been obtained from these 23 fish. Static and dynamic plots of the movementpaths for each of these fish have been produced, and the total distances traveled, velocities, andutilization distributions have been estimated from those movement paths.
Evaluations of the timed depth records for the bigeye from the archival tag data have madeit possible to discriminate four distinct behavior types: unassociated Type 1 (diel vertical migra-tions), unassociated Type 2 (no diel vertical migrations), associated with floating objects, anddeep-diving. The proportions of time each fish had allocated to each of these behavior typesthroughout its time at liberty, including residence times at fish-aggregating devices, were calculated.
The habitat selection of bigeye has been evaluated by time of day, season, and thermalstructure of their habitat. When bigeye are exhibiting unassociated Type-1 behavior they aremostly at depths of less than 50 m (within the mixed layer) throughout the night, and during theday between 200 and 300 m and 13° and 14°C. The light levels are similar during the night andday, which may explain their diel shifts in depth. This is most likely a result of adaptation in theirbehavior to efficiently track their prey, which consists primarily of vertically-migratingmesopelagic organisms, such as squids and fishes.
Bluefin tuna
Scientists from the Monterey Bay Aquarium tagged 85 bluefin with IATTC dart tags offnorthern Baja California on July 15-24, 2001. Returns from five of these fish were receivedduring 2001, two from fish recaptured off northern Baja California by recreational fishermenduring August and three from fish recaptured north of Point Conception, California, by purseseiners during October.
Tagging of yellowfin tuna with archival tags at the Achotines Laboratory
An experiment was initiated in March 2001 at the Achotines Laboratory to investigatewhether feeding and spawning events of captive yellowfin can be detected by evaluating data on
20 TUNA COMMISSION

the temperatures of the peritoneal cavities of the fish recorded by surgically-implanted electronictags. Six yellowfin (77 to 88 cm, 9.5 to 14.8 kg) had archival tags implanted in their peritonealcavities, and were also marked with color-coded conventional plastic dart tags in order to recordthe feeding and courtship behavior of individuals. At the end of the year these fish were beingheld in Tank 6, which has a capacity of 170,200 L.
ECOLOGICAL STUDIES
An ecosystem approach to fisheries management is important for maintaining sustainablefisheries and healthy ecosystems. Although the objectives of ecosystem-based management aredifficult to define, a general awareness exists that modeling is an important tool for learningabout how ecosystems function and exploring the relative ecological implications of alternativefishing methods. Accordingly, the IATTC staff has developed a multispecies mass-balanceecosystem model for the pelagic eastern tropical Pacific (ETP). In general, models of this typerepresent the life histories of the principal elements of the ecosystem, the biomass flows amongthem, and the species and size compositions of the catches of the various fisheries.
The ecosystem model for the pelagic ETP was developed, using Ecopath with Ecosim(EwE), which has been employed for modeling various types of ecosystems in the Pacific Oceanand elsewhere. In Ecopath, a mass balance is generated from estimates of the abundances of theresources (their biomasses), their productivity or mortality rates, how they interact (diet compo-sitions and rates of food consumption), and how efficiently they are utilized in the ecosystem. InEcopath, the energy input and output of all model components must balance, so
consumption = production + respiration + unassimilated food.
Given the description of the ecosystem in Ecopath, its dynamic, time-series behavior is exam-ined with Ecosim.
The model covers the area circumscribed by 20ºN, 20ºS, 150ºW, and the approximateboundary of the shelf break along the coast of the Americas, approximately 32.8 million km2. Theparameter estimates were averaged over the 1993-1997 period whenever possible. The modelcomponents (IATTC Annual Report for 1999: Table 15a) were chosen to include the principalexploited species (e.g. tunas and marlins), functional groups (e.g. sharks and cephalopods), sensi-tive species (e.g. sea turtles and dolphins), and one species that resides in the system for only partof the year (Pacific bluefin tuna). Taxa that undergo considerable trophic ontogeny, and thosethat are caught by different fishing gears at different sizes, were separated into two ontogeneticgroups. The current version of the model has 36 components.
The retained and discarded catches of the target species (tunas by surface gear and tunasand billfishes by longline gear), and the bycatches of the non-target species, averaged over 1993-1997, were estimated for each model component by fishing gear (purse seine, longline, and poleand line) and purse-seine fishing mode (sets on schools associated with dolphins, schools associ-ated with floating objects, and unassociated schools). The catch data for all of the above wereobtained from IATTC data bases. Small, localized coastal and artisanal fisheries are not includedin the model due to a shortage of data. The biomass of exports (animals that move out of theecosystem) is assumed to equal the biomass of imports.
The model was fitted to historical time series for yellowfin and bigeye tunas. The initialconditions for the fit were set up by simulating a 51-year period with no fishing effort, and thenincorporating an historical series of fishing effort for 1961 to 1998 for each of the fishing gears ormodes. Running the simulation for 51 years without fishing allowed the biomasses of the
ANNUAL REPORT 2001 21

model groups to return to equilibrium at higher levels, possibly approaching unexploited or earlyexploited conditions. Estimates of the fishing effort (days fishing for the three purse-seine modesand for pole-and-line fishing; numbers of hooks for longline fishing) from 1961 to 1998 were stan-dardized to the effort in 1993 (Figure 11). An empirical climate driver, based on sea-surface tem-perature anomalies for 1910 to 1998 (Figure 12), was used to include the effect of climatevariation on the food web in the simulation.
The historical time series consisted of independent annual estimates of biomass andaverage total mortality rates for large and small yellowfin and for large and small bigeye for 1975-1998. These estimates were taken from stock assessments carried out during 2000 (IATTC StockAssess. Rep. 1: 5-86 and 109-210). All the biomass estimates were scaled to those of 1993 andtreated as catches per unit of effort (CPUEs) (Figures 11 and 12). Fitting entailed iterativelyadjusting the vulnerability rate for the predator-prey links to minimize the sum of squared errors(SS). When estimating the vulnerability rates (v’s), similar model components were grouped inseveral ways to explore the hypothesis that animals performing comparable roles in the ecosystemwould be vulnerable to predation in comparable ways. For example, v’s were estimated separatelyfor apex predators (defined here as groups at trophic levels > 5.00), predators (groups at trophiclevels 4.00-4.99), and prey (groups at trophic levels <4.00). None of the alternative vulnerabilityscenarios was better (lower SS and a more parsimonious parameterization) than that in which acommon v was estimated. Fits to the yellowfin and bigeye CPUEs are displayed in Figures 11 and12, respectively. The fits for yellowfin were considerably better than those for bigeye. The fits foryellowfin captured the apparent higher recruitment regime of 1985-1998. The fits for bigeye,however, underestimate the variability of the data.
Food-web diagrams are useful for representing the structure and flows of ecosystems. Thefisheries often act as apex predators in exploited pelagic ecosystems. The average primary flows,accounting for 80 percent of the total trophic flows to each model group to the purse-seine andlongline fisheries in the ETP during 1993-1997, are represented in food-web diagrams in Figure13. Among the various tuna fisheries, the purse-seine fishery on dolphins draws from the sim-plest food web. The average trophic level (TL) (weighted by the total retained and discardedcatches of each component) for the catch of dolphin sets was estimated at 4.78, the greatest for allthe fisheries except the longline fishery. The TL of each fishery (Figure 13) is defined as theweighted average TL of its catch plus 1.00. Purse-seine sets on unassociated fish draw from amore diverse food web than do dolphin sets, and catch smaller tunas (Figure 13). The weightedaverage TL of the catch of that fishery was, therefore, slightly lower, 4.72. Purse-seine sets onfloating objects draw from a more diverse food web than either dolphin sets or sets on unassoci-ated fish (Figure 13). Because the bycatch of floating-object sets (not shown in Figure 13 becauseof its small contribution to the total catch) is greater than that of the other two set types, theaverage TL of the catch (4.77) was slightly greater than that of sets on unassociated fish. Thelongline fishery also utilizes a diverse food web (Figure 13), and catches large fishes. Theweighted average TL of its catch (5.19) was considerably greater than those of the other fisheries.The pole-and-line fishery (not shown in Figure 13) catches mostly small tunas, plus a few sharks.The average TL of its catch was estimated to be 4.72, the same as that for purse-seine sets onunassociated fish. Overall, the weighted average TL of the catch of all fisheries during 1993-1997was estimated by the ecosystem model to be 4.83.
Trophic levels can also be estimated for individual years for the catch of the different fish-eries, or estimated separately for the retained and discarded catches. The trophic status of thefisheries was estimated by applying the TLs estimated with the base ecosystem model (i.e. for
22 TUNA COMMISSION

the catches averaged over 1993-1997), weighted by the catch data by fishery and year for all modelgroups from the IATTC data bases for retained catches of tunas, discarded catches of tunas, andbycatches of other species. The TLs of the summed catches of all purse-seine modes varied some-what from year to year (Figure 14). There was a gradual decreasing trend from 1996 to 1999, fol-lowed by a large increase in 2000. The average TL dropped again slightly in 2001, to nearly thesame level as those of 1994-1996. The TLs of the floating-object sets varied more than did thoseof the other fisheries. This was due to the interannual variability in the sizes of the tunas caughtand the species compositions of the bycatches in sets on floating objects. The trend in TL of thefloating-object sets seemed to influence the trend of the total catches more than did those of theother fisheries (Figure 14).
Since estimates of the TLs of the catches of the different fisheries incorporate signals forall components of the ecosystem that are caught, interannual trends in the TLs may serve asindicators of the effects of the fisheries on the ecosystem, and the staff is exploring this possi-bility. Animals that comprise the bycatches in the ETP often occupy the highest trophic levels.The ETP ecosystem model predicts that fishing on animals that occupy high trophic levelsimposes a greater top-down effect on the ecosystem than fishing on animals at lower TLs.However, it has not been determined whether the variability in the TLs observed in Figure 14are significant.
EARLY LIFE HISTORY STUDIES
For many years fisheries scientists have believed that the abundance of a population of fishis determined principally during its early life history (egg, larval, and/or early-juvenile) stages.Although decades of research have provided considerable information on the populations of adulttunas, relatively little is known about the early life history stages and the factors that affect theirrecruitment to the exploitable stocks. These considerations motivated the IATTC to establish aresearch facility at Achotines Bay in the Republic of Panama for the purpose of studying the earlylife histories of tunas.
Achotines Bay is located on the southern coast of the Azuero Peninsula in the Los Santosprovince of Panama (Figure 15). The continental shelf is quite narrow at this location; the 200-m depth contour occurs only 6 to 10 km (3 to 5 nm) from shore. This provides the scientistsworking at the Achotines Laboratory with ready access to oceanic waters where spawning oftunas occurs during every month of the year. The annual range of sea-surface temperature inthese waters is approximately 21° to 29°C. Seawater pumped from Achotines Bay is suitable formaintaining live tunas in the laboratory. The proximity of the research station to the study areaprovides a low-cost alternative to a large research vessel, and improves sampling flexibility.
The IATTC’s early life history research program involves laboratory and field studiesaimed at gaining insight into the recruitment process and the factors that affect it. Previousresearch on recruitment of fishes suggests that abiotic factors, such as temperature and salinity,and biological factors, such as feeding and predation, can affect recruitment. As the survival ofpre-recruit fishes is probably controlled by a combination of these factors, the research programaddresses the interaction between the biological system and the physical environment (IATTC,Data Report 9).
Joint OFCF-Panama-IATTC project
In December 1993 an agreement was reached by the Overseas Fishery CooperationFoundation (OFCF) of Japan, the government of the Republic of Panama, and the IATTC to
ANNUAL REPORT 2001 23

undertake a joint five-year project, funded mostly by the OFCF, at the Achotines Laboratory. In1998 the joint project was extended for an additional two years, and in 1999 it was agreed that itwould be funded through March 2001. The objectives of the project were to: (1) culture adult yel-lowfin tuna to supply larvae and juveniles for research on its early life history; (2) produce foodorganisms for the larval and juvenile tunas; and (3) culture broodstock snappers (Lutjanidae),corvina-like fishes (Sciaenidae), and food organisms for their larvae and juveniles.
Expansion of and improvements to the infrastructure of the Laboratory were necessary tocarry out the objectives of the project. Six in-ground, concrete tanks were built during the dura-tion of the project. The dimensions and capacities of the tanks are as follows:
Tank Diameter (meters) Depth (meters) Capacity (liters)1 17.0 6.0 1,361,9002 8.5 3.0 170,2003 8.5 1.5 85,1004 8.5 1.5 85,1005 8.5 1.5 85,1006 8.5 3.0 170,200
In addition, a pier and boat ramp were built.
The project ended on March 31, 2001. The research on the early life history of tunas isbeing continued by the IATTC staff, and the Dirección General de Recursos Marinos de Panamáis continuing its rearing work on snappers and corvina-like fishes.
Yellowfin broodstock
Yellowfin in the size range of 2 to 7 kg were collected in nearshore waters adjacent to theAchotines Laboratory to establish a broodstock population in the laboratory. Standard proce-dures of previous years were used to transport, handle, tag, weigh, and measure the newly-cap-tured fish. Each fish was tagged with a microchip implant tag in the dorsal musculature andinjected with oxytetracycline (OTC) to establish a temporal mark in the otoliths and vertebrae.The tags allowed each fish to be identified throughout its life in captivity, and injection with OTCfacilitated studies of the growth of the fish. All fish were immersed in dilute solutions of formalinand sodium nifurstyrenate (NFS), an antimicrobial agent, for several hours to treat any skininfections caused by capture and handling.
Yellowfin were stocked in the large broodstock tank (Tank 1) and in the reserve brood-tock tank (Tank 2) during 1996, and maintained through 2001. The diet of the fish in Tank 1 wasmonitored to ensure that it provided enough energy to fuel high growth rates and spawning, butdid not cause excess fat deposition. The feeding behavior of the fish and estimates of theirbiomass were used as guidelines for determining the daily ration schedules. Information on theproximate composition (protein, moisture, fat, and ash) of the food organisms and the broodstockfish (obtained by a laboratory in Aguadulce, Panama, from samples of each taxon of the foodorganisms and from yellowfin that occasionally died or were sacrificed) were used to adjust thefeeding. The food organisms included squid (Loligo spp. or Illex argentinus), anchovetas(Cetengraulis mysticetus), thread herring (Opisthonema spp.), and bigscale anchovy (Anchoviamacrolepidota), and the diet was supplemented with vitamin and bile powders. On average, theanchovetas contained about 64 percent more calories and the thread herring about 116 percentmore calories than the squid. By adjusting the quantities and proportions of squid and fish in thediet, the amount of food was kept high enough to avoid frenzied feeding activity, while not
24 TUNA COMMISSION

greatly exceeding the requirements for metabolism, growth, reproduction, and waste losses.The fish in Tank 1 were fed at approximately 2.0 to 4.5 percent of their body weight per dayduring 2001.
During the year 11 younger yellowfin were transferred to Tank 1 to restock the spawningpopulation. They were identified by their tag numbers, measured, weighed, and injected withoxytetracycline before being placed into the tank. Their lengths ranged from 63 to 93 cm andtheir weights from 6 to 20 kg. At the time of their introduction into Tank 1 there were fishremaining from the groups of fish stocked in the tank during 1996, 1999, and 2000. At the endof the year there were 19 fish in Tank 1. This group consisted of 1 fish stocked during 1999, 8stocked during 2000, and 10 stocked during 2001. Thirteen mortalities occurred during the year.The mortalities were due to starvation (3 fish) and wall strikes (10 fish). Growth models werefitted to the length and weight data of the fish at the time of placement into the tank and at thetime that they were sacrificed or died. Daily estimates of the lengths and weights were calculatedfrom growth models. The estimated lengths and weights of the fish at the end of the year in Tank1 were as follows: 1 very large fish, length 138 cm, weight 60 kg; 8 medium fish, lengths 116 to123 cm, weights 35 to 43 kg; and 10 smaller fish, lengths 70 to 99 cm, weights 9 to 27 kg. At theend of the year the density of the fish in the broodstock tank was estimated to be 0.36 kg per cubicmeter, which is somewhat less than the original target stocking density of 0.50 kg per cubic meterfor the broodstock population.
The yellowfin in Tanks 2 and 6 were held in reserve to augment the broodstock populationin Tank 1, should that become necessary. Six of them were used in an experiment utilizingarchival tags (see the section entitled TUNA TAGGING). Yellowfin in the size range of 49 to 71cm and 2.3 to 6.8 kg were collected at sea, transported to the Laboratory, and placed into Tanks2 or 6. Each fish was measured, weighed, injected with oxytetracycline, and tagged with amicrochip implant tag. They were fed a diet of squid and herring at approximately 5- to 8-per-cent of their body weight per day. At the end of the year there were 7 newly-captured fish in Tank2 and 14 in Tank 6. These fish were to be used in further archival tag experiments in early 2002.
Yellowfin spawning
During 2001 the yellowfin in Tank 1 spawned daily throughout the entire year. The watertemperatures in the tank ranged from 24.5° to 29.0°C during the year. Spawning occurredbetween 12:25 p.m. and 6:20 p.m. The spawning events were usually preceded by courtshipbehavior (paired swimming, chasing) during the late morning or afternoon.
The numbers of fertilized eggs collected after each spawning event in Tank 1 ranged fromabout 30,000 to 2,800,000. The eggs were collected at the surface by several methods, includingsiphoning, dipnetting, and seining with a fine-mesh egg seine.
The following parameters were recorded for each spawning event: time of spawning, eggdiameter, duration of egg stage, hatching rate, lengths of hatched larvae, and duration of yolk-sacstage. The weights of the eggs, yolk-sac larvae, and first-feeding larvae and the lengths andselected morphometrics of the first-feeding larvae were periodically measured. These data wereentered into a data base for analysis of spawning parameters and the physical or biological fac-tors that may influence spawning (e.g. water temperature, salinity, lunar cycle, average size of thespawning fish, and average daily ration of the spawning fish).
Several trials were conducted to examine the effect of probiotic (typically Gram-positivebacteria) and antibiotic treatments on the hatching rate of yellowfin eggs. For comparison,replicate incubation tanks with no treatment were used as controls, and the other replicatetanks were treated with a solution of oxytetracycline or probiotic bacteria. The results from
ANNUAL REPORT 2000 25

these trials indicated that the hatching rates were similar for the two treatments and for the controls.
Yellowfin diet comparison
An experiment to compare the diets of yellowfin in captivity was initiated in November2000. Two diets, (1) 50-percent thread herring and 50-percent squid, and (2) dry pellet feed, werecompared. Twenty-two yellowfin were randomly assigned to either Tank 2 (12 fish) or Tank 6 (10fish). The fish initially ranged in length from 55 to 83 cm and in weight from 4.5 to 13.4 kg. Thefish in Tank 2 were fed the herring-squid diet at approximately 3.0-percent body weight per day.The fish in Tank 6 were fed dry pellet feed daily until they were satiated (approximately 1.0-per-cent body weight per day). Five fish died during the 5-month experimental period. In March 2001the remaining 17 fish were removed, and weighed and measured. Three fish from each tank weresacrificed for later proximate analysis, and one fish was sacrificed due to poor health. The sur-vival of the fish of the two food treatments after 5 months was similar. Four of the remaining fishwere returned to Tank 2 to continue on a diet of pellet food to see if they would become repro-ductively active. Although the fish in the pellet feed group did not spawn, several of them showedsigns of gonad maturation before they were sacrificed, after several months. Archival tags weresurgically implanted into the remaining six fish, and they were placed into Tank 6 for the exper-iments described in the section entitled TUNA TAGGING.
Laboratory studies of the growth and feeding of yellowfin larvae and juveniles
Two experiments were carried out to estimate the density-dependent growth of late-stageyellowfin larvae between 10 and 19 days after hatching. Previous experiments had been con-ducted to estimate the density-dependent growth of larvae during the first week of feeding (3-7days after hatching), and the results indicated that the larvae grow more rapidly when they aremaintained at lower densities. The results of the experiments with older larvae indicate similardensity effects on growth.
It has been assumed, from the results of a few published studies, that larval and early-juve-nile tunas feed only during daylight hours. In 2000 the diel feeding abilities of the larvae duringthe first week of feeding were examined, and preliminary results indicated that the larvae fed onlyduring daylight hours. An experiment designed to examine the diel feeding abilities of juvenileyellowfin (20 days after hatching) was conducted in June 2001. The stomach contents of thesejuveniles also indicated that feeding occurred only during daylight hours. Preserved samplesfrom both experiments will be analyzed to examine the gastric evacuation rates of yellowfin larvaeand juveniles under simulated natural photoperiod conditions.
Several groups of yellowfin larvae were reared beyond juvenile metamorphosis. Thegreatest time that a fish was reared during the year was 8 weeks after hatching.
In late 2001 studies were conducted to compare the effects of antibiotics and probiotics onrotifer cultures and on the survival of yellowfin larvae. Rotifer cultures are characterized by anabundant and complex bacterial flora. By treating rotifers and larvae with either antibiotics orprobiotics it was anticipated that the occurrence of pathogenic, Gram-negative bacteria would bereduced, enhancing production of rotifers and promoting better survival of reared yellowfinlarvae. The trials were conducted by Mr. Patrick Tracy, a graduate student at the University
26 TUNA COMMISSION

of Miami’s Rosenstiel School of Marine and Atmospheric Science, working in collaboration withIATTC scientists and members of the staff of the Laboratory. Preliminary observations indicatedthat the probiotic treatment may enhance rotifer production, but further trials are needed.
Three experiments were also conducted to examine the effect of probiotic and antibiotictreatments on the survival of yellowfin larvae after the first eight days of feeding. The larvae inthe rearing tanks were treated with either probiotic or antibiotic solutions or were untreated(control). Preliminary results from these experiments indicated that, in most trials, either pro-biotics or antibiotics appeared to slightly improve larval survival. However, the results wereinconclusive, and it was decided that more trials would be conducted during early 2002.
Genetic studies of captive yellowfin
Genetic samples have been taken from broodstock yellowfin and their eggs and larvae todetermine the amount of genetic variation in both adults and their offspring. This study is beingcarried out by scientists of the IATTC, the OFCF of Japan, and the National Research Instituteof Far Seas Fisheries of Japan. Any new broodstock fish that are introduced to the captive popu-lation are sampled for genetic analysis. During 2001 an analysis of genotypic variation was con-ducted on samples that had been taken from broodstock, eggs and larvae from August 1999 toAugust 2000. The analysis identified nine genotypes common to broodstock females and eggs andlarvae, with two types shared by two females. The spawning profiles of these females were deter-mined by observing the occurrence of these genotypes in the offspring. Usually multiple femalesspawned on a given date, and the same genotypes were observed on almost any sampling daythroughout the year. The results indicated that some individual females were capable ofspawning almost daily for extended periods of time as long as they remained in the appropriaterange of water temperatures and had sufficient food. Genetic sampling of the broodstock, eggs,and larvae was to continue in 2002.
Studies of the vision of yellowfin and black skipjack tunas
In June 2001 a study was initiated to examine the spectral sensitivity of vision in yellowfinand black skipjack tunas. The research was carried out by Drs. William McFarland, University ofWashington, and Ellis Loew, Cornell University, working in collaboration with an IATTC scien-tist. The study was designed to identify the types of photoreceptor cells present in several lifestages of yellowfin and in adult black skipjack. The investigation focused on the spectral absorp-tive characteristics of the visual pigments present in each type of photoreceptor cell in the retina.The research technique utilized a microspectrophotometer to determine the absorption of thevisual pigment within single photoreceptor cells.
Specimens representing several life stages of yellowfin, including early larvae, late-larvae,early juvenile, and adult, and several specimens of adult black skipjack, were examined. The dataon spectral sensitivity will be analyzed to determine if the photosensitivity of certain life stagescan be related to stage-specific life histories or behaviors.
Spawning and rearing of corvina and spotted rose snappers
The work on corvina and snappers was carried out by the Dirección General de RecursosMarinos de Panamá.
Polla drum (Umbrina xanti) and spotted rose snappers (Lutjanus guttatus) were collectedduring 1996 to establish broodstock populations in captivity.
During 1999 the last polla drum broodstock fish were released into Achotines Bay.
ANNUAL REPORT 2001 27

During 2001 efforts were continued to replace the polla drum with broodstock of a larger, morecommercially-valuable, species of corvina. One group of juvenile polla drum that had beenhatched in captivity in July 1999 was maintained in a 12,000-L tank during 2001. These fish wereabout 25 cm long and weighed about 170 g, on average, at the end of the year. They would bereared to the adult stage.
The spotted rose snapper broodstock, which began to spawn at the end of May 2000,spawned about two or three times per week throughout 2001. Another group of 40 fish, hatchedin captivity in October 1998, was held in two 12,000-L tanks. On average, these fish were about46 cm long and weighed about 1.4 kg at the end of the year. They were being reared in an attemptto complete the life cycle of this species in captivity and to study the growth patterns and feedingrequirements of the juveniles.
New broodstock of white corvina (Cynoscion albus) and Stolzmann's weakfish (C. stolz-mani), were captured and stocked in a 85,100-L tank during 2000. At the beginning of 2001 therewere 6 fish in the tank, but they died by mid-year due to infections or starvation. Additionalbroodstock of both species were to be collected during 2002. The species that appear to do bestin captivity would be used for spawning and rearing studies.
OCEANOGRAPHY AND METEOROLOGY
Easterly surface winds blow almost constantly over northern South America, which causesupwelling of cool, nutrient-rich subsurface water along the equator east of 160ºW, in the coastalregions off South America, and in offshore areas off Mexico and Central America. El Niño eventsare characterized by weaker-than-normal easterly surface winds, which cause above-normal sea-surface temperatures (SSTs) and sea levels and deeper-than-normal thermoclines over much ofthe eastern tropical Pacific (ETP). In addition, the Southern Oscillation Indices (SOIs) are neg-ative during El Niño episodes. (The SOI is the difference between the anomalies of sea-levelatmospheric pressure at Tahiti, French Polynesia, and Darwin, Australia. It is a measure of thestrength of the easterly surface winds, especially in the tropical Pacific in the SouthernHemisphere.) Anti-El Niño events, which are the opposite of El Niño events, are characterizedby stronger-than-normal easterly surface winds, below-normal SSTs and sea levels, shallower-than-normal thermoclines, and positive SOIs. Periods of above-average, normal, and below-average SSTs along the equator between 150°W and 180° from 1950 to 2001 are shown in Figure16. It was prepared from a table, produced by the Climate Prediction Center of the U.S. NationalWeather Service (NWS), which classifies the SSTs in that area as very warm (3 on the graph) orvery cold (-3 on the graph), warm or cold (2 or -2), slightly warm or slightly cold (1 or -1), andnormal (0). (The classification is subjective, and the NWS is exploring the possibility of creatingan objective procedure.) Conditions were normal, for the most part, from early 1951 to mid-1954,from early 1959 to mid-1963, and early 1976 to early 1982. Since then they have been eitherabove or below normal during most quarters.
Each of the four El Niño events during the 1969-1983 period was followed by better-than-average recruitment of yellowfin in the eastern Pacific Ocean two years later (Japan. Soc.Fish. Ocean., Bull., 53 (1): 77-80), and IATTC staff members are currently studying data formore recent years to see if this relationship has persisted and to see if it applies to skipjackand/or bigeye.
Two new indices, the SOI* and the NOI*, have recently been devised. These are describedin a paper to be published in the journal Progress in Oceanography. The SOI* is the differencebetween the anomalies of sea-level atmospheric pressure at the South Pacific High(30°S-95°W) and Darwin, Australia, and the NOI* is the difference between the anomalies of
28 TUNA COMMISSION

sea-level atmospheric pressure at the North Pacific High (35°N-130°W) and Darwin. TheSOI* and NOI* values are both negative during El Niño events and positive during anti-ElNiño events.
Conditions in the ETP were essentially normal during most of 2001, although the SSTswere above normal off Ecuador, Peru, and northern Chile during March and April (Figure 17a)and below normal from Peru to as far west as 130°W during September-December (Figure 17b).The SSTs in the central Pacific were mostly below normal during the first four months of the year,but mostly above normal during the last seven months of the year (Table 13). According to theClimate Diagnostics Bulletin of the NWS for December 2001, there were indications at that timethat an El Niño episode was developing. “Since June 2001 the SSTs have become anomalouslywarm in the central equatorial Pacific, with anomalies near +1°C at the date line by the end ofDecember.” Also, “a substantial increase in subsurface temperature anomalies was observedin the central and west-central equatorial Pacific during December. … It seems most likelythat warm episode conditions will develop in the tropical Pacific over the next 3-6 months.”
STOCK ASSESSMENTS OF TUNAS AND BILLFISHES
Background Papers describing stock assessments of yellowfin, skipjack, bigeye, and stripedmarlin conducted by the IATTC staff during 2001 were to be presented at the 69th meeting of theIATTC in June 2002, and these were to be published as Stock Assessment Report 3 of the IATTCin late 2002.
DOLPHINS
Yellowfin tuna in the size range of about 10 to 40 kg frequently associate with marine mam-mals, especially spotted dolphins (Stenella attenuata), spinner dolphins (S. longirostris), andcommon dolphins (Delphinus delphis and, to a lesser extent, D. capensis) in the eastern PacificOcean (EPO). The spatial distributions of the various stocks of these four species are shown inFigure 18. (D. capensis probably occurs only within the range of the northern stock of commondolphins.) Purse-seine fishermen have found that their catches of yellowfin in the EPO can bemaximized by searching for herds of dolphins or flocks of seabirds which frequently occur withdolphins and tunas, setting their nets around the dolphins and tunas, retrieving most of the net,“backing down” to enable the dolphins to escape over the corkline of the net, and finallyretrieving the rest of the net and bringing the fish aboard the vessel. The incidental mortality ofdolphins in this operation was high during the early years of the fishery, but after the late 1980sit decreased precipitously, and it has averaged about 2,000 animals per year since the mid-1990s,a level insignificant relative the estimated size of the total population of these species.
Estimates of the mortality of dolphins due to fishing
The preliminary estimate of the incidental mortality of dolphins in the fishery in 2001, basedon data from trips covered by observers from all the components of the On-Board ObserverProgram of the Agreement on the International Dolphin Conservation Program, is 2,129 animals(Table 14), a 30-percent increase over the 1,636 mortalities recorded in 2000. The mortalities andtheir standard errors, by species and stock for 1979-2001, are shown in Tables 15a and 15b. Themortalities of the principal species affected by the fishery declined during the last decade (Figure19) as was the case for the mortalities of all dolphins combined (Figure 20). Estimates of theabundances of the various stocks of dolphins for 1986-1990 and the relative mortalities (mor-tality/abundance) are also shown in Table 14. The stocks with the highest levels of relative
ANNUAL REPORT 2001 29

mortality were northeastern spotted dolphins and eastern spinner dolphins (0.08 percent each).The number of sets on schools of tuna associated with dolphins made by Class-6 vessels
increased by 4 percent, from 9,235 in 2000 to 9,577 in 2001, and the average catch of yellowfinper set on dolphins increased from 17.2 to 24.8 metric tons. The average mortality per set (MPS)increased from 0.17 dolphin in 2000 to 0.22 dolphin in 2001, but the mortality of dolphins perton of yellowfin caught decreased from 0.010 in 2000 to 0.009 in 2001. The trends in the num-bers of sets on dolphin-associated fish, MPS, and total mortalities in recent years are shown inFigure 20. The 2001 data for numbers of sets on dolphins and catches of yellowfin in those setsare also preliminary.
The estimated spatial distribution of the average MPS during 2001 is shown in Figure 21.Typically, patches of relatively high MPS are found throughout the fishing area, but in 2001those areas were concentrated more inshore.
Causes of recent dolphin mortality
Traditionally, the performance of fishermen in reducing dolphin mortality has been mea-sured with variables such as the average MPS, success in releasing all dolphins encircled (setswith zero mortality, number of dolphins left in the net after the backdown maneuver), and reduc-tion of factors that cause high mortality (e.g., major malfunctions, net canopies, net collapses).Data on these variables for 1986-2001 (IATTC data bases only) are shown in Figure 22a and Table16. Determining the variables that contribute to the occurrence of incidental dolphin mortalityin the purse-seine fishery is an important aspect of the efforts to reduce that mortality. Previousstudies have indicated that the mortality of dolphins varied with the catch of tunas, the size ofthe dolphin herd encircled, the time of the set (day sets versus night sets), the duration of the set,the presence of strong currents, gear malfunctions, and the presence of net canopies and collapses(Figure 22b). Efforts to reduce dolphin mortalities intensified following the introduction of indi-vidual-vessel dolphin mortality limits (DMLs) in 1993, and the MPS has continued to decrease rel-ative to pre-1993 levels (Figure 20). Nonetheless, some incidental mortalities still occur. TheIATTC staff is studying dolphin mortality data to determine which variables lead to these mor-talities. This preliminary analysis includes data for 1993-2000.
Because so few dolphin sets have resulted in mortalities in recent years (Table 16), thefocus of this analysis is to determine the variables that increase the probability of at least onedolphin mortality occurring in a given set during typical fishing operations. Therefore, setsduring which extreme conditions occurred, such as an extremely long backdown period or theencirclement of an extremely large herd of dolphins, were not considered in the analysis. Thevariables studied included: (1) environmental conditions (season, strength of currents); (2) areaof fishing operations (areas where fishing has taken place for many years versus newly-exploitedareas); (3) operational problems (gear malfunctions, net collapses, net canopies, coverage of thebackdown channel by the dolphin safety panel); (4) temporal aspects of the fishing operations(starting time of the set and duration of approach, chase, encirclement, net retrieval, and back-down); (5) use of dolphin rescue equipment and personnel during backdown (speedboats, rafts,swimmers, divers); (6) characteristics of the animals encircled (weight of tunas and numbersand species of dolphins); (7) atmospheric conditions, such as fog or rain, that may affect thefishing operations or the observer's ability to count the dolphins that are killed. The existenceof relationships between the probability of at least one dolphin mortality in a given set and thesevariables were explored, using logistic regression techniques. The data for each of the eightyears were analyzed separately.
30 TUNA COMMISSION
The preliminary results suggest that the likelihood of occurrence of at least one dolphinmortality per set increased predictably across years for only five of the variables considered. Asin previous studies, it was found that the likelihood of dolphin mortality increased significantlywith the presence of a net canopy and, to a lesser extent, a net collapse. It also increased with theduration of backdown and the weight of tuna caught, and when either spinner dolphins orcommon dolphins were present in the captured herd. In some years the probability of mortalitydecreased when the dolphin safety panel covered the backdown channel adequately, and some-times it increased in the presence of a strong current. In addition, in some years there was a sig-nificant relationship between the duration of the approach and chase and the occurrence ofmortality. However, the directions of the effects of the duration of the approach and of the chasewere not consistent from year to year, suggesting that they are spurious.
Of the five variables found to consistently increase the likelihood of at least one dolphinmortality per set, the effect of the presence of a net canopy may be the most important. It wasgreater than the effect of a net collapse, of spinner or common dolphins in the net, and of theweight of tuna caught, and often greater than that of the duration of backdown. Also, in gen-eral, extended backdowns contributed more to the likelihood of mortality than did the otherthree variables.
Estimating the relative importances of the various variables on dolphin mortality is com-plicated by the presence of interactions and the non-linear relationship between some of thesevariables. For example, the presence of a net canopy was found to increase non-linearly with theduration of backdown, although both variables contribute significantly to the probability of mor-tality. Extended backdowns tend to cause the floor of the net to rise toward the surface, whichcan result in canopies along the sides of the backdown channel. Thus, extended backdowns maycontribute to an increased probability of dolphin mortality by (1) keeping animals in close contactwith the net for extended periods of time and (2) contributing to the formation of net canopies.On the other hand, the occurence of a net collapse showed little or relation to the duration ofbackdown, probably because the use of speedboats to maintain the shape of the backdown channelis generally effective in preventing net collapse during backdown.
GEAR PROGRAM
DOLPHIN SAFETY PANEL ALIGNMENTS
During 2001 the IATTC staff conducted alignments of dolphin-safety panels (DSPs) andinspections of dolphin rescue gear aboard 24 vessels, 23 registered in Mexico and 1 in Venezuela.A trial set, during which an IATTC technician observes the performance of the net from aninflatable raft during backdown, is made to check the alignment of the DSP. The techniciantransmits his observations, comments, and suggestions to the captain of the vessel, andattempts are made to resolve any problems that may arise. Afterward a report is prepared forthe vessel owner or manager. This report contains a summary of the technician's observationsand, if necessary, suggestions for improving the vessel's dolphin-safety gear and/or procedures.
DOLPHIN MORTALITY REDUCTION SEMINARS
The IATTC has conducted dolphin mortality reduction seminars for tuna fishermen since1980. These seminars are intended not only for captains, who are directly in charge of fishingoperations, but also for other crew members and for administrative personnel responsible forvessel equipment and maintenance. The fishermen and others who attend the seminars are
ANNUAL REPORT 2001 31

presented with certificates of attendance. The IATTC staff conducted four seminars during 2001,two in La Jolla and two in Mazatlan, Mexico, the latter in conjunction with Mexico’s national pro-gram. A total of 65 fishermen attended the four seminars.
STATEMENTS OF PARTICIPATION
Statements of Participation are issued by the IATTC staff on request to vessels that carryobservers from the On-Board Observer Program of the Agreement on the International DolphinConservation Program (AIDCP). There are two types: the first, issued to vessels of Parties to theAIDCP only, certifies that the vessel has been participating in the International DolphinConservation Program, and that all its trips have been covered by observers; the second, issuedto vessels of non-Parties, certifies only that all the vessel's trips have been covered by observers.During 2001 statements of the first type were issued for 124 fishing trips by vessels of Colombia,El Salvador, Guatemala, Honduras, Mexico, Panama, the United States, Vanuatu, and Venezuela, andof the second type for 7 fishing trips by vessels of Belize and Guatemala.
OTHER SERVICES
The IATTC also offers other services to help governments and fleet managers and opera-tors of individual vessels to reduce dolphin mortality. Publications and videotapes on the subjectare available at IATTC field offices.
MEASURES FOR THE CONSERVATION OF TUNAS
YELLOWFIN
A resolution adopted at the 68th meeting of the IATTC, on June 21, 2001, provided for alimit on the catch of yellowfin tuna in the CYRA, by vessels fishing at the surface, of 250,000metric tons (mt), with options for the Director to increase the quota by one to three incrementsof 20,000 mt if, in his opinion, this would not adversely affect the stock. On September 13, 2001,the Director advised the Commissioners that the third and last increment would be implemented,bringing the quota to 310,000 mt, and that he estimated that the catch would reach that amounton about October 25, 2001. On October 11, 2001, he advised the Commissioners that he estimatedthat the quota would be reached on October 27, 2001, and so, beginning on that date, the catchesof yellowfin by purse-seine vessels were limited to 15 percent of their total catches of tunas.Longline, pole-and-line, and sport-fishing vessels were not subject to these restrictions.
BIGEYE
A resolution adopted at the 68th meeting of the IATTC, on June 21, 2001, provided that“the purse-seine fishery which takes bigeye tuna shall be closed if the Director determines … thatthe catch of bigeye tuna less than 60 centimeters has reached the level achieved in 1999, in whichcase he shall advise all Parties that the purse-seine fishery on floating objects shall close twoweeks after such determination. However, in no event shall the fishery be closed beforeNovember 1, 2001.” Prior to the end of the year it appeared that the catch of bigeye less than 60cm long during 2001 would be less than that of 1999, so the resolution was not implemented.
THE INTERNATIONAL DOLPHIN CONSERVATION PROGRAM
The Agreement for the Conservation of Dolphins (“the 1992 La Jolla Agreement”) pro-vided a framework for the international efforts to reduce the mortality of dolphins incidental to
32 TUNA COMMISSION

purse-seine fishing for tunas, and introduced such novel and effective measures as DolphinMortality Limits (DMLs) for individual vessels, and the International Review Panel (IRP) tomonitor the performance and compliance of the fishing fleet. A binding agreement, theAgreement on the International Dolphin Conservation Program (AIDCP), which built on andformalized the provisions of the 1992 La Jolla Agreement, was signed in May 1998 and enteredinto force in February 1999. The Parties to this agreement are committed to “ensure the sus-tainability of tuna stocks in the eastern Pacific Ocean and to progressively reduce the incidentaldolphin mortalities in the tuna fishery of the eastern Pacific Ocean to levels approaching zero;to avoid, reduce and minimize the incidental catch and the discard of juvenile tunas and theincidental catch of non-target species, taking into consideration the interrelationship amongspecies in the ecosystem.”
The IATTC provides the Secretariat for the International Dolphin Conservation Programand its various working groups and panels and coordinates the On-Board Observer Program (thecombined observer programs of the IATTC, Ecuador, Mexico, and Venezuela) and the TunaTracking and Verification System.
INTERNATIONAL REVIEW PANEL
The International Review Panel (IRP) follows a general procedure for reporting the com-pliance by vessels with measures established by the AIDCP for minimizing the mortalities of dol-phins during fishing operations to the governments concerned. The IRP reviews data collectedby the observers of the On-Board Observer Program related to compliance with the AIDCP, andidentifies possible infractions of that Agreement. Lists of these are submitted by the Secretariatto the governments of the countries in which the vessels are registered for investigation and pos-sible action. The governments then report back to the Secretariat on actions taken regardingthese possible infractions.
The IRP held meetings during January, June, and October 2001. The minutes of thesemeetings are available on the IATTC’s web site (www.iattc.org). The IRP also publishes anannual report, presented to the Meeting of the Parties to the AIDCP, which summarizes theactivities, actions, and decisions of the IRP, and lists the possible infractions identified for thevarious national fleets.
DOLPHIN MORTALITY LIMITS
The overall dolphin mortality limit (DML) established for the international fleet in 2001was 5,000 animals, of which 100 were reserved for allocation at the discretion of the Director ofthe IATTC (AIDCP, Annex IV, Section I.6). The unreserved portion of 4,900 animals was allo-cated to 82 vessels that requested and were qualified to receive DMLs. The average individual-vessel DML (ADML) was 59.75 dolphins. Of the 18 vessels that did not utilize their DMLs priorto April 1, 4 forfeited their DMLs, and the other 14 were allowed to keep them for the remainderof the year under the force majeure exemption allowed by the AIDCP. A total of 68 vessels uti-lized their DMLs during the year. Three vessels were allocated second-semester DMLs of 14 ani-mals each, but none of these was utilized. The distribution of the mortality caused in 2001 byvessels with full-year DMLs is shown in Figure 23.
TRAINING AND CERTIFICATION OF FISHING CAPTAINS
Article V of the AIDCP calls for the establishment, within the framework of the IATTC,of a system of technical training and certification of fishing captains. Under the system, the
ANNUAL REPORT 2001 33

IATTC staff is responsible for maintaining a list of all captains qualified to fish for tunas associ-ated with dolphins in the eastern Pacific Ocean. The names of the captains who meet the require-ments are to be supplied to the IRP for approval and circulation to the Parties to the AIDCP.
The requirements for new captains include (1) attending a training seminar organized bythe IATTC staff or by the pertinent national program in coordination with the IATTC staff, (2)participation in a trial set that includes direct observations of the backdown channel, and (3) apractical training component, consisting of a trip during which it is intended to fish for tuna asso-ciated with dolphins aboard a vessel with a DML, accompanied by either a qualified captain or anapproved technical advisor.
Each year the three fishing captains with the best performances in reducing dolphin mor-tality, based on standardized performance measures approved by the Parties, are recognized.During 2001 the three captains with the best performances in 2000 were presented with plaquesand letters of congratulation noting their contributions in reducing dolphin mortality.
REPORTS OF DOLPHIN MORTALITY BY OBSERVERS AT SEA
The AIDCP requires the Parties to establish a system, based on current observerreporting, to ensure effective implementation and compliance with per-stock, per-year dolphinmortality limits. This requirement was complied with by requiring all observers aboard tunapurse seiners with DMLs to report mortalities of dolphins, by stock, at weekly intervals by e-mail, fax, or radio. Late in 2001, as some stock mortality limits (SMLs) were approached, therequired reporting frequency was increased to twice a week. However, for various reasons, theSecretariat received only about half of the required reports. Lacking complete current data,projections of the mortalities based on the data available were made, and these indicated thatrestrictions on the fishery were necessary to ensure that no SMLs would be exceeded.Accordingly, the Secretariat recommended to governments that fishing for tunas associatedwith the central stock of common dolphins be prohibited from December 10 till the end of 2001,and that fishing for tunas associated with northeastern offshore spotted dolphins be prohibitedfrom December 21 till the end of 2001.
In fact, in retrospect, the SMLs for neither central common dolphins (207) nor northeasternspotted dolphins (648) were exceeded by the estimated mortalities (203 and 588, respectively).
SYSTEM FOR TRACKING AND VERIFYING TUNA
Article V.1.f of the AIDCP calls for the establishment of a system for the tracking and ver-ification of tunas caught with and without mortality or serious injury of dolphins. The Partiesdeveloped a tracking and verification system and a standard Tuna Tracking Form (TTF) to becompleted at sea by observers. There are two versions of the TTF, which, except for the head-ings, are identical. Form A documents tunas caught in sets without mortality or serious injuryof dolphins (“dolphin safe”), and Form B documents tunas caught in sets with mortality orserious injury of dolphins (“non-dolphin safe”). Within this framework, each Party establishesits own tracking and verification program, implemented and operated by a designated nationalauthority, which includes periodic audits and spot checks for caught, landed, and processed tunaproducts, mechanisms for communication and cooperation between and among national author-ities, and timely access to relevant data. Each Party is required to provide the Secretariat witha report describing the activities of its tracking and verification program.
TTFs were completed for all but two observed trips by Party vessels that departed during2001 and for which there was catch of tunas. For the two trips for which TTFs were not
34 TUNA COMMISSION

completed, the Secretariat did not issue TTFs to the observers because it could not confirm thatthe vessels were under the jurisdiction of a Party at the times of departure.
DOLPHIN-SAFE CERTIFICATES
At the fifth meeting of the Parties to the AIDCP in June 2001 a resolution establishing pro-cedures for Dolphin-Safe certification was adopted. These certificates are printed by theSecretariat and furnished to the Parties to the AIDCP. The Parties, in turn, issue them for ship-ments of tuna that consist only of fish that had been taken without mortality or serious injury todolphins. Nineteen such certificates were issued during 2001.
PUBLICATIONS
The prompt and complete publication of research results is one of the most important ele-ments of the IATTC’s program of scientific investigations. By this means the member govern-ments, the scientific community, and the public at large are currently informed of the researchfindings of the IATTC staff. The publication of basic data, methods of analysis, and conclusionsafford the opportunity for critical review by other scientists, ensuring the soundness of the con-clusions reached by the IATTC staff and enlisting the interest of other scientists in the IATTC’sresearch. By the end of 2001 IATTC staff members had published 147 Bulletins, 50 AnnualReports, 13 Special Reports, 10 Data Reports, 1 Stock Assessment Report, 9 books, and 523 chap-ters, papers, and articles in books and outside journals. The contributions by staff members pub-lished during 2001 are listed in Appendix 3 of this report.
WEB SITE
The IATTC maintains a web site, www.iattc.org, in English and Spanish, which permitsthe public to obtain current information on its work. The web site includes, among other things,documents relating to the IATTC and the Agreement on the International Dolphin ConservationProgram (AIDCP), a list of the member nations and Commissioners of the IATTC, a list of themembers of the IATTC staff, a list of recent and future meetings of the IATTC, the AIDCP, andtheir working groups, Background Papers, agendas, and minutes or reports of recent meetingsof these, provisional agendas of future meetings, recent resolutions of the IATTC and theAIDCP, statistics for the fisheries for tunas in the eastern Pacific Ocean, up-to-date informationon measures for the conservation of tunas, recent Quarterly Reports of the IATTC, and infor-mation on IATTC publications.
INTER-AGENCY COOPERATION
During 2001 the scientific staff of the IATTC continued to maintain close contact withinternational, governmental, university, and private research organizations and institutions.This contact enabled the staff to keep abreast of the rapid advances and developments takingplace in fisheries and oceanography research throughout the world. Some aspects of these rela-tionships are described below.
The IATTC’s headquarters is located on the campus of Scripps Institution ofOceanography (SIO), University of California, La Jolla, California, USA, one of the major worldcenters for the study of marine science and the headquarters for federal and state agenciesinvolved in fisheries, oceanography, and related sciences. This situation provides the staff withan excellent opportunity to maintain frequent contact with scientists of those organizations. Dr.
ANNUAL REPORT 2001 35

Richard B. Deriso was a member of the faculty of SIO during 2001.Dr. Deriso also served as a member of the faculty of the University of Washington, Seattle,
Washington, USA, Dr. Martín A. Hall as a member of the faculty of the University of BritishColumbia, Vancouver, B.C., Canada, Dr. Michael G. Hinton as a member of the faculty of theUniversity of San Diego, San Diego, California, USA, and Dr. Pablo R. Arenas as a member of thefaculty of the Centro Interdisciplinario de Ciencias Marinas, Instituto Politécnico Nacional, LaPaz, Mexico. Drs. Arenas, Deriso, Hall, Hinton, and Robert J. Olson served on committees thatsupervised the research of graduate students at various universities during 2001.
The cordial and productive relationships that the IATTC has enjoyed with the ComisiónPermanente del Pacífico Sur (CPPS), the Convention for the Conservation of Southern BluefinTuna (CCSBT), the Food and Agriculture Organization (FAO) of the United Nations, the IndianOcean Tuna Commission (IOTC), the International Commission for the Conservation of AtlanticTunas (ICCAT), the Organización Latinoamericana de Desarrollo Pesquero (OLDEPESCA), theSecretariat of the Pacific Community (SPC), and other international organizations have con-tinued for many years. Dr. Robin Allen served as Chairman of the second meeting of FAO andnon-FAO Regional Fisheries Bodies. In addition, Dr. Allen and Mr. Brian S. Hallman partici-pated in conferences for the establishment of the Commission created by the new Conventionon the Conservation and Management of Highly Migratory Fish Stocks in the Western andCentral Pacific Ocean. The IATTC is a member of the Coordinating Working Party on FisheriesStatistics of the FAO, and Dr. Hinton participated in a meeting of that working party in 2001.Dr. Hinton also was a member of several working groups of the Standing Committee on Tunaand Billfish of the SPC and of the Organizing Committee of the Third International BillfishSymposium, which was held in August 2001. Drs. Mark N. Maunder and George M. Watterswere participants, with scientists from the National Research Institute of Far Seas Fisheries ofJapan and the SPC, in a cooperative project to assess the condition of the stock(s) of bigeye tunain the Pacific Ocean. This program receives its funding from the Pelagic Fisheries ResearchProgram, University of Hawaii. Dr. Watters also participated in an ICCAT-sponsored workshopon the design and development of a statistical model that the ICCAT plans to use for the futurestock assessments of Atlantic bigeye tuna.
Also during 2001 the IATTC staff maintained close working relationships with fisheryagencies of its member countries, and with similar institutions in non-member countries in var-ious parts of the world. Dr. Richard B. Deriso was a member of the Scientific and StatisticalCommittee of the Western Pacific Fishery Management Council of the United States. Dr. MarkN. Maunder worked with Dr. Chi-Lu Sun of the National Taiwan University on application of A-SCALA, the method used to assess tuna stocks in the eastern Pacific Ocean, to bigeye tuna in thewestern and central Pacific Ocean. Dr. Michael G. Hinton and Dr. Pierre M. Kleiber of the U.S.National Marine Fisheries Service (NMFS) carried out a Pacific-wide analysis of the status ofblue marlin. Dr. Hinton is a member of the United States Argo Advisory Panel, for which heserves as the representative for applications to fisheries oceanography research. Drs. Robert J.Olson and George M. Watters collaborated with colleagues from the National Research Instituteof Far Seas Fisheries (NRIFSF) of Japan to use the data from five bluefin tagged with archivaltags to parameterize a bioenergetics model for that species. Drs. Olson and Watters were mem-bers of the Working Group on Models of Alternative Management Policies for MarineEcosystems, sponsored by the National Center for Ecological Analysis and Synthesis (NCEAS),which is funded by the U.S. National Science Foundation and the state of California. The grantprovided by NCEAS is funding a series of workshops to use ecosystem models to identify robustapproaches for incorporating ecological considerations into fisheries management objectives for
36 TUNA COMMISSION

five large marine ecosystems in the Pacific Ocean, including the tropical eastern Pacific. Dr.Olson and Dr. Felipe Galván-Magaña of the Centro Interdisciplinario de Ciencias Marinas ofMexico continued their joint study of the trophic interactions of yellowfin tuna, dolphins, andassociated predators in the eastern Pacific Ocean described on pages 27-28 of the IATTC AnnualReport for 1995. Mr. Kurt M. Schaefer and Mr. Naozumi Miyabe of the NRIFSF were involved incollaborative research on the reproductive biology of bigeye tuna in the eastern Pacific Ocean.During 1999-2001 personnel of the Monterey Bay Aquarium, who were catching bluefin tuna offBaja California for various scientific studies, placed IATTC dart tags on the fish that were toosmall for their purposes and released them. The tags attached to the fish that were recapturedwere returned to the IATTC staff, and the information on these was entered into the IATTC’s tag-ging data base.
Since 1977 the IATTC staff has been training observers for placement aboard tuna vesselsto collect data on abundance, mortality, and other aspects of the biology of dolphins. Theseobservers have also collected stomach contents and samples of gonads and other tissues of tunas,recorded data on the incidental catches of species other than tunas and dolphins, recorded infor-mation on floating objects and the fauna and flora associated with them, etc. In addition, during2001 they collected dolphin tissue samples for stress studies conducted by the U.S. NationalMarine Fisheries Service. Government organizations, educational institutions, and industry rep-resentatives from the various countries involved have cooperated fully in the training and place-ment of these observers. Mexico started its own observer program in 1991, and Ecuador andVenezuela started their own observer programs in 2000. During 2001 Mr. Ernesto AltamiranoNieto assisted in the training of the Ecuadorian observers, and Mr. Nickolas W. Vogel worked withstaff members of the Ecuadorian program on the incorporation of data entry and editing pro-grams and the establishment of data bases similar to those used by the IATTC staff. This makesefficient exchange of data between programs possible.
Over the years, IATTC scientists have often rendered assistance with research on fisheries fortunas and other species to scientists of various countries while on duty travel to those countries, andoccasionally have traveled to various locations for the specific purpose of teaching or assisting withresearch programs. Also, scientists and students from many countries have spent several weeks ormonths at the IATTC’s headquarters in La Jolla and at its Achotines Laboratory learning newresearch methods and conducting research utilizing IATTC facilities and data. In addition, since1963 Japanese scientists have made extended visits to the IATTC headquarters is La Jolla, wherethey have collaborated with IATTC staff members in analyses of data for the Japanese longlinefishery for tunas and billfishes in the eastern Pacific Ocean. The visitors whose stays amounted to10 days or more are listed in Appendix 1.
Late in 1993 an agreement was reached by the Overseas Fishery Cooperation Foundation(OFCF) of Japan, the government of the Republic of Panama, and the IATTC to undertake ajoint five-year project, funded mostly by the OFCF, at the Achotines Laboratory. The project,which entered its initial stage in 1994, encompasses research on the feasibility of culturingadult yellowfin tuna, corvina-like fishes, and snappers to supply larvae for research, and theproduction of food organisms for their larvae and juveniles. This project is described in the sec-tion entitled EARLY LIFE HISTORY STUDIES. After two extensions, the funding from theOFCF was ended on March 31, 2001.
Over the years, IATTC employees have collected tissue samples and hard parts of tunas andbillfishes for use in genetic studies conducted by scientists of other organizations. During 2001 sam-ples of tissues of swordfish were collected for the Department of Marine Biology, Texas A. and M.University, Galveston, Texas, USA.
IATTC staff members are also active in professional societies. During 2001 Dr. Martín A.
ANNUAL REPORT 2001 37

Hall was a member of the Board of Directors of the National Fisheries Conservation Center, Dr.Michael G. Hinton was Director of the Southern California District of the American Institute ofFishery Research Biologists, and Dr. Daniel Margulies served as the Western RegionalRepresentative of the Early Life History Section of the American Fisheries Society.
38 TUNA COMMISSION

FIGURE 1. The eastern Pacific Ocean (EPO), as defined by the Agreement on the InternationalDolphin Conservation Program (area inside the heavy line), and the Commission's YellowfinRegulatory Area (CYRA).FIGURA 1. El Océano Pacífico oriental (OPO), definido por el Acuerdo sobre el Programa In-ternacional para la Conservacíon de los Delfines (área encerrada con línea gruesa), y el AreaRegla-mentaria de la Comisión para el Aleta Amarilla (ARCAA).
ANNUAL REPORT 2001 39

FIG
UR
E 2
.Av
erag
e, m
inim
um, a
nd m
axim
um v
alue
s fo
r m
onth
ly c
apac
ity o
f pur
se s
eine
rs a
nd p
ole-
and-
line
vess
els
at s
ea in
the
EPO
dur
ing
1991
-20
00, a
nd th
e 20
01 v
alue
s.FI
GU
RA
2.
Valo
res
men
sual
es m
edio
s, m
ínim
os, y
máx
imos
de
la c
apac
idad
de
barc
os c
erqu
eros
y c
añer
os e
n el
mar
en
el O
PO d
uran
te 1
991-
2000
, ylo
s val
ores
de
2001
.
40 TUNA COMMISSION

FIGURE 3a. Average annual distribution of the logged retained catches of yellowfin, in metrictons, in the eastern Pacific Ocean during 1986-2000. The average catches and effort were calcu-lated only for the 1-degree areas for which three or more years of data were available.FIGURA 3a. Distribución anual media de las capturas retenidas registradas de aleta amarilla,en toneladas métricas, en el Océano Pacífico oriental durante 1986-2000. Se calcularon prome-dios de captura y esfuerzo solamente para las áreas de 1° para las cuales se disponía de tres añoso más de datos.
ANNUAL REPORT 2001 41

FIGURE 3b. Distribution of the logged retained catches of yellowfin, in metric tons, in theeastern Pacific Ocean during 2001.FIGURA 3b. Distribución de las capturas retenidas registradas de aleta amarilla, en toneladasmétricas, en el Océano Pacífico oriental durante 2001.
42 TUNA COMMISSION

FIGURE 4a. Average annual distribution of the logged retained catches of skipjack, in metrictons, in the eastern Pacific Ocean during 1986-2000. The average catches and effort were calcu-lated only for the 1-degree areas for which three or more years of data were available.FIGURA 4a. Distribución anual media de las capturas retenidas registradas de barrilete, entoneladas métricas, en el Océano Pacífico oriental durante 1986-2000. Se calcularon promediosde captura y esfuerzo solamente para las áreas de 1° para las cuales se disponía de tres años o másde datos.
ANNUAL REPORT 2001 43

FIGURE 4b. Distribution of the logged retained catches of skipjack, in metric tons, in theeastern Pacific Ocean during 2001.FIGURA 4b. Distribución de las capturas retenidas registradas de barrilete, en toneladasmétricas, en el Océano Pacífico oriental durante 2001.
44 TUNA COMMISSION

FIGURE 5a. Average annual distribution of the logged retained catches of bigeye, in metric tons, in theeastern Pacific Ocean during 1994-2000. The average catches and effort were calculated only for the 1-degreeareas for which two or more years of data were available.FIGURA 5a. Distribución anual promedia de las capturas retenidas registradas de patudo, entoneladas métricas, en el Océano Pacífico oriental durante 1994-2000. Se calcularon promediosde captura ye esfuerzo solamente para las áreas de 1° para las cuales se disponía de dos años omás de datos.
ANNUAL REPORT 2001 45

FIGURE 5b. Distribution of the logged retained catches of bigeye, in metric tons, in the easternPacific Ocean during 2001.FIGURA 5b. Distribución de las capturas retenidas registradas de patudo, en toneladasmétricas, en el Océano Pacífico oriental durante 2001.
46 TUNA COMMISSION

FIGURE 6. Areas used for sampling lengths of surface-caught tunas in the eastern PacificOcean (EPO).FIGURA 6. Zonas usadas para el muestreo de tallas de atunes capturados con artes de super-ficie en el Océano Pacífico oriental (OPO).
ANNUAL REPORT 2001 47
Pole-and-line vessels All species
Barcos cañeros Todas especies
Equatorial Ecuatorial

FIGURE 7a. Estimated size compositions of the yellowfin caught in each fishery of the EPOduring 2001. The average weights of the fish in the samples are given at the tops of the panels.FIGURA 7a. Composición por tallas estimada para el aleta amarilla capturado en cada pes-quería del OPO en 2001. En cada recuadro se detalla el peso promedio de los peces en las mues-tras.
48 TUNA COMMISSION
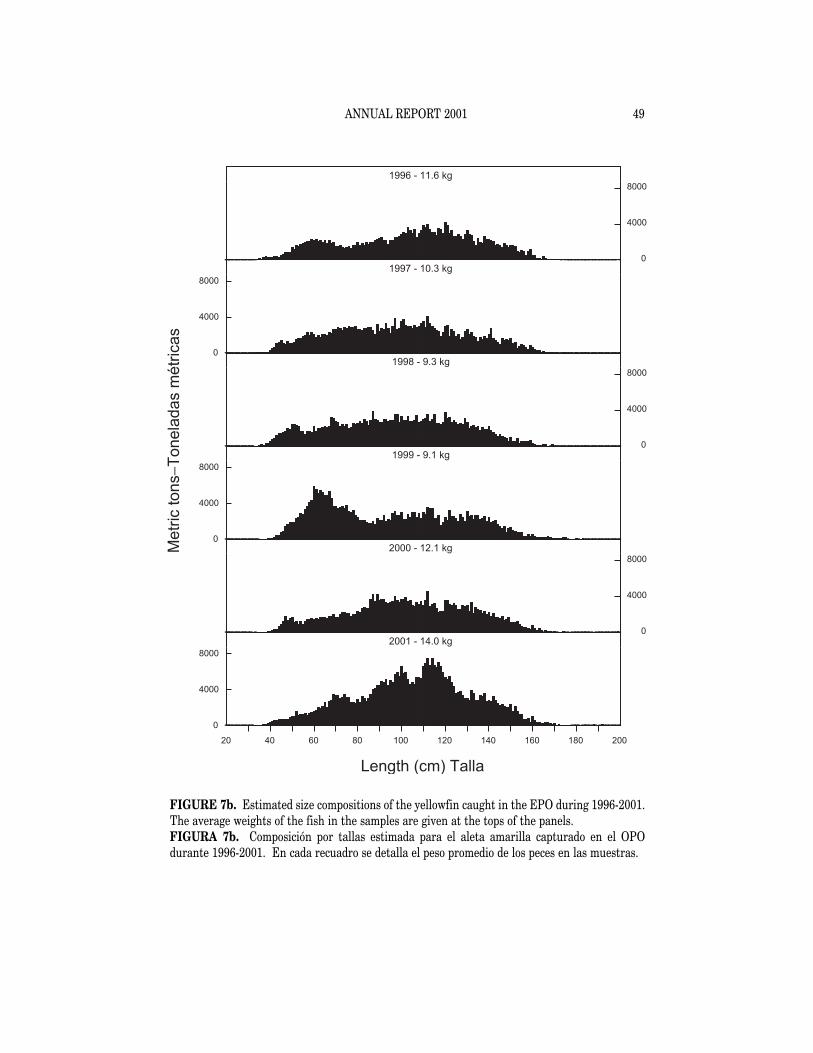
FIGURE 7b. Estimated size compositions of the yellowfin caught in the EPO during 1996-2001.The average weights of the fish in the samples are given at the tops of the panels.FIGURA 7b. Composición por tallas estimada para el aleta amarilla capturado en el OPOdurante 1996-2001. En cada recuadro se detalla el peso promedio de los peces en las muestras.
ANNUAL REPORT 2001 49

FIGURE 8a. Estimated size compositions of the skipjack caught in each fishery of the EPOduring 2001. The average weights of the fish in the samples are given at the tops of the panels.FIGURA 8a. Composición por tallas estimada para el barrilete capturado en cada pesquería delOPO en 2001. En cada recuadro se detalla el peso promedio de los peces en las muestras.
50 TUNA COMMISSION

FIGURE 8b. Estimated size compositions of the skipjack caught in the EPO during 1996-2001.The average weights of the fish in the samples are given at the tops of the panels.FIGURA 8b. Composición por tallas estimada para el barrilete capturado en el OPO durante1996-2001. En cada recuadro se detalla el peso promedio de los peces en las muestras.
ANNUAL REPORT 2001 51

FIGURE 9a. Estimated size compositions of the bigeye caught in each fishery of the EPO during2001. The average weights of the fish in the samples are given at the tops of the panels.FIGURA 9a. Composición por tallas estimada para el patudo capturado en cada pesquería delOPO en 2001. En cada recuadro se detalla el peso promedio de los peces en las muestras.
52 TUNA COMMISSION

FIGURE 9b. Estimated size compositions of the bigeye caught in the EPO during 1996-2001.The average weights of the fish in the samples are given at the tops of the panels.FIGURA 9b. Composición por tallas estimada para el patudo capturado en el OPO durante 1996-2001. En cada recuadro se detalla el peso promedio de los peces en las muestras.
ANNUAL REPORT 2001 53

FIGURE 10a. Estimated catches of Pacific bluefin by purse-seine gear in the EPO during 1996-2001. The values at the tops of the panels are the average weights.FIGURA 10a. Captura estimada de aleta azul del Pacífico por buques cerqueros en el OPOdurante 1996-2001. El valor en cada recuadro representa el peso promedio.
54 TUNA COMMISSION

FIGURE 10b. Estimated catches of Pacific bluefin by recreational gear in the EPO during 1996-2001. The values at the tops of the panels are the average weights.FIGURA 10b. Captura estimada de aleta azul del Pacífico por artes deportivas en el OPOdurante 1996-2001. El valor en cada recuadro representa el peso promedio.
ANNUAL REPORT 2001 55

FIGURE 11. Simulation results (top panel) of fitting the ETP ecosystem model to historicalCPUE time series for yellowfin tuna in the eastern Pacific Ocean. The effort time series used inthe simulation (days fishing for three purse-seine fishing modes and for pole-and-line vessels;numbers of hooks for longline gear) are standardized to the effort in 1993 for each gear (bottomfive panels). In the simulation, there was no fishing effort, only climate forcing, between 1910and 1961. The climate driver is shown in Figure 12. Note the y-axes of the panels are drawn atdifferent scales.FIGURA. 11. Resultados de la simulación (recuadro superior) al ajustar del modelo del ecosis-tema del POT a series de tiempo de CPUE histórica de atún aleta amarilla en el Océano Pacíficooriental. Las series de tiempo de esfuerzo usadas en la simulación (días de pesca para tres modal-idades de pesca de cerco y buques cañeros; número de anzuelos para palangres) fueronestandarizadas al esfuerzo en 1993 para cada arte (cinco recuadros inferiores). En la simulaciónno hubo esfuerzo de pesca, solamente efectos climáticos, entre 1910 y 1961. En la Figura 12 seilustra el simulador de clima. Nótese que los ejes y de los paneles están dibujados a distintasescalas.
56 TUNA COMMISSION
1910 1920 1930 1940 1950 1960 1970 1980 1990 2000
2
6
1
2
1
2
1
2
0.5
1.0
Dolphin sets−Lances sobre delfines
Floating-object sets−Lances sobre objetos flotantes
Unassociated sets−Lances sobre peces no asociados
Pole and line−Caña
Longline−Palangre
Da
ys f
ish
ing
Día
s d
e p
esca
0
1
2
Large yellowfin
Aleta amarilla grande
Small yellowfin
Aleta amarilla pequeño
Large yellowfin
Aleta amarilla grande
Re
lative
bio
ma
ss
Bio
ma
sa
re
lativa
Ho
oks
An
zu
elo
s
Year−Año
3
4
CPUE
Small yellowfin
Aleta amarilla pequeñoCPUE

FIGURE 12. Simulation results (top panel) of fitting the ETP7 ecosystem model to historicalCPUE time series for bigeye tuna in the eastern Pacific Ocean. The bottom panel displays theSST anomalies for the NIÑO3 region during 1910 to 1998, which was used as a climate driver forthe simulation. The effort time series used in the simulation are shown in Figure 11.FIGURA 12. Resultados de la simulación (recuadro superior) al ajustar del modelo del ecosis-tema ETP7 a series de tiempo de CPUE histórica de atún patudo en el Océano Pacífico oriental.El recuadro inferior ilustra las anomalías de las TSM en la región NIÑO3 durante 1910-1998,usado como simulador de clima para la simulación. En la Figura 11 se ilustran las series detiempo de esfuerzo usadas en la simulación.
ANNUAL REPORT 2001 57
Rela
tive b
iom
ass
Bio
masa r
ela
tiva
1910 1920 1930 1940 1950 1960 1970 1980 1990 2000
Degre
es
−C−G
rados
0
1
2
-3
-2
-1
0
1
2
3
Year−Año
Large bigeye
Patudo grande
Small bigeye
Patudo pequeño
Large bigeye
Patudo grandeCPUE
Small bigeye
Patudo pequeñoCPUE

FIGURE 13. Food-web diagrams representing the primary flows (accounting for 80 percent ofthe total trophic flows) to the principal groups caught by the purse-seine and longline fisheries inthe ETP averaged over 1993-1997 and their principal prey. The trophic level (TL) of each fisheryis defined as the average TL of its catch plus 1.00.FIGURA 13. Diagramas de la red trófica representando los flujos primarios (que incluyen el 80%del total de los flujos tróficos) a los grupos principales capturados por las pesquerías cerquera ypalangrera en el POT averaged over 1993-1997 y sus presas principales. Se define el nivel trófico(NT) de cada pesquería como el NT medio ponderado de su captura más 1,00.
58 TUNA COMMISSION
Dolphin Delfín
Large yellowfin Aleta amarilla grande
Auxis
Misc. epipel. fishes Peces epipel. misc.
6.5
6.0
5.5
5.0
4.5
4.0
3.5
3.0
Tro
ph
ic le
ve
l−N
ive
l tr
ófico
6.5
6.0
5.5
5.0
4.5
4.0
3.5
3.0
Unassociated No asociado
Cephalopods Cefalópodos
Skipjack Barrilete
Large yellowfin Aleta amarilla grande Small yellowfin
Aleta amarilla pequeño
Misc. mesopel. fishes Peces mesopel. misc. Misc. epipel. fishes
Peces epipel. misc.
Auxis

FIGURE 13 (continued) FIGURA 13 (continuación)
6.5
6.0
5.5
5.0
4.5
4.0
3.5
3.0
Tro
ph
ic le
ve
l−N
ive
l tr
ófico
6.5
6.0
5.5
5.0
4.5
4.0
3.5
3.0
Longliners Palangreros
Large marlins Marlines grande Large bigeye
Patudo grande
Small yellowfin Aleta amarilla pequeño
Auxis
Large yellowfin Aleta amarilla grandeSkipjack
BarrileteCephalopods Cefalópodos
Misc. epipel. fishes Peces epipel. misc.
Floating object Objeto flotante
Large bigeye Patudo grande
Cephalopods Cefalópodos
Skipjack Barrilete
Small bigeye Patudo pequeño
Small yellowfin Aleta amarilla pequeño
Auxis
Misc. mesopel. fishes Peces mesopel. misc. Misc. epipel. fishes
Peces epipel. misc.
ANNUAL REPORT 2001 59

FIGURE 14. Yearly trophic-level estimates of the catches of the purse-seine fisheries in theeastern Pacific Ocean.FIGURA 14. Estimaciones anuales del nivel trófico de las capturas de las pesquerías cerquerasen el Océano Pacífico oriental.
60 TUNA COMMISSION

FIGURE 15. Location of Achotines Bay, Panama. The Achotines Laboratory is located on theeast side of the bay. FIGURA 15. Situación de la Bahía de Achotines, Panamá. El laboratorio está situado al bordeeste de la bahía.
ANNUAL REPORT 2001 61

FIG
UR
E 1
6. S
ea-s
urfa
ce te
mpe
ratu
re (S
ST) a
nom
alie
s (de
part
ures
from
long
-term
nor
mal
s) a
long
the
equa
tor f
rom
150
°W to
180
°. T
he v
ertic
al sc
ale
is e
xpla
ined
in th
e te
xt.
FIG
UR
A 1
6.An
omal
ías
(des
viac
ione
s de
los
nive
les
norm
ales
a la
rgo
plaz
o) d
e la
tem
pera
tura
sup
erfic
ial d
el m
ar (T
SM) a
lo la
rgo
de la
líne
a ec
uato
-ri
al e
ntre
150
°O y
180
°. E
n el
text
o se
exp
lica
la e
scal
a ve
rtic
al.
62 TUNA COMMISSION

FIG
UR
E 1
7a.
Sea-
surf
ace t
empe
ratu
re (S
ST) a
nom
alie
s (de
part
ures
from
long
-term
nor
mal
s) fo
r Apr
il 20
01, b
ased
on
data
from
fish
ing
boat
s and
oth
erty
pes o
f com
mer
cial
ves
sels
.FI
GU
RA
17a
.An
omal
ías
(var
iaci
ones
de
los
nive
les
norm
ales
a la
rgo
plaz
o) d
e la
tem
pera
tura
sup
erfic
ial d
el m
ar (T
SM) e
n ab
ril d
e 20
01, b
asad
as e
nda
tos t
omad
os p
or b
arco
s pes
quer
os y
otr
os b
uque
s com
erci
ales
.
ANNUAL REPORT 2001 63

FIG
UR
E 1
7b.
Sea-
surf
ace
tem
pera
ture
(SST
) ano
mal
ies
(dep
artu
res
from
long
-term
nor
mal
s) fo
r Se
ptem
ber
2001
, bas
ed o
n da
ta fr
om fi
shin
g bo
ats
and
othe
r ty
pes o
f com
mer
cial
ves
sels
.FI
GU
RA
17b
.An
omal
ías (
vari
acio
nes d
e los
niv
eles
nor
mal
es a
larg
o pl
azo)
de l
a te
mpe
ratu
ra su
perf
icia
l del
mar
(TSM
) en
sept
iem
bre d
e 200
1, b
asad
asen
dat
os to
mad
os p
or b
arco
s pes
quer
os y
otr
os b
uque
s com
erci
ales
.
64 TUNA COMMISSION

FIGURE 18. Average distributions of the stocks of spotted, spinner, and common dolphins inthe eastern Pacific Ocean (EPO).FIGURA 18. Distribuciones medias de los stocks de delfines manchado, tornillo, y común en elOcéano Pacífico oriental (OPO).
ANNUAL REPORT 2001 65

FIGURE 19. Estimated numbers of mortalities for the stocks of spotted and spinner dolphins inthe EPO. Each vertical line represents one positive and one negative standard error.FIGURA 19. Número estimado de mortalidades para los stocks de delfines manchado y tornilloen el OPO. Cada línea vertical representa un error estándar positivo y un error estándar nega-tivo.
66 TUNA COMMISSION

FIGURE 20. Estimated numbers of mortalities for all dolphins in the EPO. Each vertical linerepresents one positive and one negative standard error.FIGURA 20. Número estimado de mortalidades para todos delfines en el OPO. Cada línea ver-tical representa un error estándar positivo y un error estándar negativo.
ANNUAL REPORT 2001 67

FIG
UR
E 2
1.Sp
atia
l dis
trib
utio
ns o
f the
ave
rage
mor
talit
ies p
er se
t for
all
dolp
hins
com
bine
d du
ring
200
1.
68 TUNA COMMISSION

FIGURE 22a. Trends in indicators of performance in releasing dolphins alive.FIGURA 22a. Tendencias en los indicadores de desempeño en la liberación de delfines vivos.
FIGURE 22b. Trends in the net malfunctions that can cause dolphin mortalities.FIGURA 22b. Tendencias en averías de la red que pueden causar mortalidad de delfines.
ANNUAL REPORT 2001 69

FIG
UR
E 2
3.D
istr
ibut
ion
of d
olph
in m
orta
lity
caus
ed b
y ve
ssel
s with
full-
year
DM
Ls d
urin
g 20
01.
FIG
UR
A 2
3.D
istr
ibuc
ión
de la
mor
talid
ad d
e de
lfine
s cau
sada
por
buq
ues c
on L
MD
de
año
com
plet
o du
rant
e 20
01.
70 TUNA COMMISSION

TABLE 1. Numbers and well volumes, in cubic meters, of purse seiners and pole-and-line vessels of the eastern PacificOcean (EPO) tuna fleet. Information for 1950-1960 (in short tons) is given in Table 4 of the IATTC Annual Report for1988. The data for 2001 are preliminary.TABLA 1. Número y volumen de bodega, en metros cúbicos, de los buques cerqueros y cañeros de la flota atunera delOcéano Pacífico oriental (OPO). En la Tabla 4 del Informe Anual de la CIAT de 1988 se presentan los datos de 1950-1960(en toneladas cortas). Los datos de 2001 son preliminares.
Year Purse seiners Pole-and-line vessels TotalNumber Well volume Number Well volume Number Well volume
Año Cerqueros Barcos cañeros TotalNúmero Volumen de Número Volumen de Número Volumen de
bodega bodega bodega1961 125 31,896 93 11,171 218 43,0681962 146 36,477 88 7,132 234 43,6091963 159 42,782 108 6,350 267 49,1321964 137 42,877 88 5,016 225 47,8931965 163 45,332 109 6,144 272 51,4761966 133 42,494 113 6,612 246 49,1061967 130 42,899 108 6,234 238 49,1331968 143 53,858 89 6,104 232 59,9621969 153 60,641 69 5,268 222 65,9091970 162 71,689 49 4,569 211 76,2581971 191 94,423 102 5,916 293 100,3381972 210 119,418 108 7,123 318 126,5401973 219 140,150 106 7,279 325 147,4291974 234 156,203 111 8,246 345 164,4501975 253 174,016 102 7,862 355 181,8791976 254 187,512 99 7,508 353 195,0201977 253 189,967 79 5,766 332 195,7331978 271 192,259 68 5,352 339 197,6101979 282 195,494 45 4,223 327 199,7171980 270 196,476 46 4,072 316 200,5481981 251 196,484 39 3,249 290 199,7331982 223 178,234 36 2,877 259 181,1111983 215 149,404 52 3,681 267 153,0851984 175 121,650 40 3,245 215 124,8951985 178 137,814 25 2,574 203 140,3871986 166 131,806 17 2,060 183 133,8671987 177 152,351 29 2,376 206 154,7271988 189 156,636 36 3,274 225 159,9101989 178 141,956 30 3,135 208 145,0911990 172 143,946 23 2,044 195 145,9901991 155 124,501 19 1,629 174 126,1311992 160 117,017 19 1,612 179 118,6291993 152 118,730 15 1,543 167 120,2721994 167 122,214 20 1,725 187 123,9391995 175 124,096 20 1,784 195 125,8801996 183 132,731 17 1,639 200 134,3701997 194 146,533 23 2,105 217 148,6371998 203 161,560 22 2,217 225 163,7771999 208 180,009 14 1,642 222 181,6512000 205 180,808 11 1,229 216 182,0372001 204 189,730 11 1,291 215 191,021
ANNUAL REPORT 2001 71

TABLE 2a. Estimates of the numbers and well volumes, in cubic meters, of the purse seiners and pole-and-line vesselsof the EPO tuna fleet in 2000, by flag, gear, and size class. Each vessel is included in the totals for each flag under whichit fished during the year, but is included only once in “Grand total.” Therefore the grand totals may not equal the sumsof the individual flag entries. PS = purse seiner; PL = pole-and-line vessel.TABLA 2a. Estimaciones del número y volumen de bodega, en metros cúbicos, de los buques cerqueros y cañeros de laflota atunera en el OPO en 2000, por bandera, arte de pesca, y clase de arqueo. Se incluye cada buque en los totales decada bandera bajo la cual pescó durante el año, pero solamente una vez en el “Total general”; por consiguiente, los totalesgenerales no equivalen necesariamente a las sumas de las banderas individuales. PS = cerquero; PL = cañero.
Flag Gear Size class−−Clase de arqueo Well volumeVolumen de
Bandera Arte 1 2 3 4 5 6 Total bodegaNumber−−Número
Belize−Belice PS - - - 1 1 2 4 2,249Bolivia PS - - - - - 3 3 3,956Colombia PS - - 2 - 2 5 9 7,127Ecuador PS - 7 13 13 6 36 75 45,888
PL 1 - - - - - 1 32España−Spain PS - - - - - 5 5 11,438Guatemala PS - - - - - 4 4 7,640Honduras PS - - - - - 1 1 628México PS - - 7 3 4 40 54 48,358
PL 1 4 5 - - - 10 1,197Nicaragua PS - - - - - 1 1 1,229Panamá PS - - 2 2 - 5 9 8,413USA−EE.UU. PS - 3 2 - 2 6 13 9,229Venezuela PS - - - - - 22 22 28,025Vanuatu PS - - - - - 11 11 13,668
Grand total PS - 10 26 19 15 135 205Total general PL 2 4 5 - - - 11
PS+PL 2 14 31 19 15 135 216Well volume−−Volumen de bodega
Grand total PS - 984 4,677 5,470 7,166 162,511 180,808Total general PL 85 383 761 - - - 1,229
PS+PL 85 1,367 5,438 5,470 7,166 162,511 182,037
72 TUNA COMMISSION

TABLE 2b. Preliminary estimates of the numbers and well volumes, in cubic meters, of the purse seiners and pole-and-line vessels of the EPO tuna fleet in 2001, by flag, gear, and size class. Each vessel is included in the totals for each flagunder which it fished during the year, but is included only once in “Grand total.” Therefore the grand totals may notequal the sums of the individual flag entries. PS = purse seiner; PL = pole-and-line vessel.TABLA 2b. Estimaciones preliminares del número y volumen de bodega, en metros cúbicos, de buques cerqueros ycañeros de la flota atunera en el OPO en 2001, por bandera, arte de pesca, y clase de arqueo. Se incluye cada buque enlos totales de cada bandera bajo la cual pescó durante el año, pero solamente una vez en el “Total general”; por consigu-iente, los totales generales no equivalen necesariamente a las sumas de las banderas individuales. PS = cerquero; PL =cañero.
Flag Gear Size class−−Clase de arqueo Well volumeVolumen de
Bandera Arte 1 2 3 4 5 6 Total bodegaNumber−−Número
Belize−Belice PS - - - - - 2 2 1,850Bolivia PS - - - - - 5 5 5,830Colombia PS - - 2 1 2 5 10 7,397Ecuador PS - 5 12 11 7 38 73 48,334
PL 1 - - - - - 1 32El Salvador PS - - - - - 2 2 4,469España−Spain PS - - - - - 5 5 12,137Guatemala PS - - - - - 4 4 7,640Honduras PS - - - - - 3 3 2,254México PS - - 4 4 9 37 54 47,145
PL 1 3 6 - - - 10 1,259Nicaragua PS - - - - - 1 1 1,229Panamá PS - - 2 2 - 6 10 9,517USA−EE.UU. PS - - 1 - 2 5 8 7,362Venezuela PS - - - - - 25 25 31,687Vanuatu PS - - - - - 6 6 7,803Unknown PS - - - 1 - 2 3 1,512
Grand total PS - 5 21 18 20 140 204Total general PL 2 3 6 - - - 11
PS+PL 2 8 27 18 20 140 215Well volume−−Volumen de bodega
Grand total PS - 453 3,801 5,231 9,166 171,079 189,730Total general PL 85 293 913 - - - 1,291
PS+PL 85 746 4,714 5,231 9,166 171,079 191,021
ANNUAL REPORT 2001 73

74 TUNA COMMISSION
TAB
LE 3
.Es
timat
ed r
etai
ned
and
disc
arde
d ca
tche
s by
sur
face
gea
r, in
met
ric
tons
, of t
he E
PO t
una
fleet
. “O
ther
s” in
clud
es s
hark
s, ot
her
tuna
s, an
d m
isce
llane
ous
fishe
s; CY
RA =
Com
mis
sion
's Ye
llow
fin R
egul
ator
y Ar
ea; O
utsi
de =
are
a be
twee
n th
e CY
RA a
nd 1
50°W
. Th
e 20
00 a
nd 2
001
data
are
pre
limin
ary.
Add
ition
al in
form
atio
n co
ncer
ning
this
tabl
e is
giv
en in
the
text
.TA
BLA
3.
Estim
acio
nes
de c
aptu
ras
rete
nida
s y
desc
arta
das,
en t
onel
adas
mét
rica
s, po
r ar
tes
de s
uper
ficie
de
la fl
ota
atun
era
del O
PO.
“Otr
os”
incl
uye
tibur
ones
, otr
os a
tune
s, y
pece
sdi
vers
os; A
RCAA
= A
rea
de R
egul
ació
n de
la C
omis
ión
para
el A
leta
Am
arill
a; E
xter
ior
= z
ona
entr
e el
ARC
AA y
150
°O.
Los
dato
s de
200
0 y
2001
son
pre
limin
ares
. En
el te
xto
se p
rese
nta
info
rmac
ión
adic
iona
l sob
re e
sta
tabl
a. Yello
wfi
nSk
ipja
ckB
igey
eB
luef
inYe
ar
Ret
aine
dD
isca
rded
Tota
lR
etai
ned
Dis
card
edTo
tal
Ret
aine
dD
isca
rded
Tota
lR
etai
ned
Dis
card
ed
Tota
lC
YRA
Out
side
Tota
lA
leta
am
arill
aB
arri
lete
Patu
do
Ale
ta a
zul
Año
R
eten
ido
Des
cart
ado
Tota
lR
eten
ido
Des
cart
ado
Tota
lR
eten
ido
Des
cart
ado
Tota
lR
eten
ido
Des
cart
ado
Tota
lA
RC
AA
Ext
erio
rTo
tal
1970
12
7,79
327
,833
155,
626
155,
626
56,0
2056
,020
1,33
21,
332
3,96
6
3,96
619
7110
2,19
420
,645
122,
839
122,
839
104,
721
104,
721
2,56
62,
566
8,36
08,
360
1972
136,
515
40,6
1217
7,12
717
7,12
733
,409
33,4
092,
238
2,23
813
,347
13,3
4719
7316
0,34
144
,912
205,
253
205,
253
43,9
5443
,954
1,97
91,
979
10,7
4410
,744
1974
173,
180
37,1
8421
0,36
421
0,36
478
,803
78,8
0389
089
05,
617
5,61
719
7515
8,84
343
,299
202,
142
202,
142
123,
868
123,
868
3,72
33,
723
9,58
39,
583
1976
190,
216
46,1
1123
6,32
723
6,32
712
6,16
112
6,16
110
,186
10,1
8610
,645
10,6
4519
7718
2,67
616
,140
198,
816
198,
816
86,3
3786
,337
7,05
57,
055
5,47
35,
473
1978
165,
985
14,5
4918
0,53
418
0,53
416
9,81
016
9,81
011
,714
11,7
145,
397
5,39
719
7917
5,90
613
,768
189,
674
189,
674
132,
024
132,
024
7,53
27,
532
6,11
76,
117
1980
131,
998
27,4
2715
9,42
515
9,42
513
0,67
113
0,67
115
,421
15,4
212,
939
2,93
919
8115
7,73
324
,080
181,
813
181,
813
119,
606
119,
606
10,0
9110
,091
1,08
91,
089
1982
106,
868
18,2
1612
5,08
412
5,08
498
,757
98,7
574,
102
4,10
23,
150
3,15
019
8382
,026
12,2
3094
,256
94,2
5658
,142
58,1
423,
260
3,26
085
385
319
8412
8,55
916
,502
145,
061
145,
061
60,5
5160
,551
5,93
65,
936
881
881
1985
192,
543
24,4
4921
6,99
221
6,99
249
,460
49,4
604,
532
4,53
24,
055
4,05
519
8622
8,12
540
,149
268,
274
268,
274
63,5
5263
,552
1,93
91,
939
5,08
55,
085
1987
248,
153
24,0
9427
2,24
727
2,24
762
,345
62,3
4577
677
61,
005
1,00
519
8826
7,26
320
,811
288,
074
288,
074
85,3
2685
,326
1,05
31,
053
1,42
41,
424
1989
242,
342
47,0
3328
9,37
528
9,37
592
,374
92,3
741,
470
1,47
01,
170
1,17
019
9022
6,46
546
,864
273,
329
273,
329
72,5
7572
,575
4,71
24,
712
1,54
21,
542
1991
219,
525
19,5
9623
9,12
123
9,12
163
,260
63,2
603,
740
3,74
046
146
119
9222
1,30
918
,540
239,
849
239,
849
83,9
6483
,964
5,49
75,
497
1,99
91,
999
1993
213,
258
18,8
1323
2,07
15,
040
237,
111
87,3
5710
,589
97,9
468,
069
585
8,65
487
90
879
1994
197,
064
22,1
9721
9,26
14,
614
223,
875
74,5
3410
,314
84,8
4829
,375
2,30
531
,680
1,06
20
1,06
219
9519
6,22
027
,556
223,
776
5,34
522
9,12
113
8,23
916
,621
154,
860
37,3
283,
262
40,5
9087
40
874
1996
218,
114
32,0
5625
0,17
06,
660
256,
830
112,
205
24,9
7013
7,17
551
,353
5,78
657
,139
8,25
90
8,25
919
9721
4,27
743
,554
257,
831
5,63
126
3,46
216
1,80
931
,867
193,
676
51,6
195,
627
57,2
462,
807
32,
810
1998
236,
503
29,2
1626
5,71
94,
718
270,
437
145,
000
22,8
5616
7,85
635
,155
2,85
338
,008
2,22
30
2,22
319
9926
4,73
932
,176
296,
915
6,62
830
3,54
326
8,02
126
,813
294,
834
41,1
635,
166
46,3
293,
091
543,
145
2000
221,
222
51,1
8927
2,41
16,
815
279,
226
211,
129
26,3
6423
7,49
370
,154
5,62
475
,778
4,12
80
4,21
820
0134
4,59
751
,443
396,
040
7,92
240
3,96
214
4,84
013
,517
158,
357
42,8
471,
262
44,1
091,
309
41,
313

TAB
LE 3
.(c
ontin
ued)
TAB
LA 3
.(c
ontin
uaci
ón)
Alb
acor
eB
onit
oB
lack
ski
pjac
kO
ther
s A
ll sp
ecie
s co
mbi
ned
Year
Ret
aine
d
Dis
card
edTo
tal
Ret
aine
dD
isca
rded
Tota
lR
etai
ned
Dis
card
edTo
tal
Ret
aine
dD
isca
rded
To
tal
Ret
aine
d D
isca
rded
To
tal
Alb
acor
a B
onit
oB
arri
lete
neg
roO
tros
To
das
las
espe
cies
Año
R
eten
ido
Des
cart
ado
Tota
lR
eten
ido
Des
cart
ado
Tota
l R
eten
ido
Des
cart
ado
Tota
lR
eten
ido
Des
cart
ado
Tota
l R
eten
ido
Des
cart
ado
Tota
l
1970
4,47
64,
476
4,73
84,
738
00
2727
226,
185
226,
185
1971
2,49
02,
490
9,60
09,
600
66
6161
250,
643
250,
643
1972
4,83
24,
832
8,87
28,
872
601
601
367
367
240,
793
240,
793
1973
2,31
62,
316
7,86
47,
864
1,67
41,
674
355
355
274,
139
274,
139
1974
4,78
34,
783
4,43
64,
436
3,74
23,
742
985
985
309,
620
309,
620
1975
3,33
23,
332
16,8
3816
,838
511
511
277
277
360,
274
360,
274
1976
3,73
33,
733
4,37
04,
370
1,52
61,
526
1,32
71,
327
394,
275
394,
275
1977
1,96
31,
963
11,2
7511
,275
1,45
81,
458
1,95
01,
950
314,
327
314,
327
1978
1,74
51,
745
4,83
74,
837
2,16
22,
162
806
806
377,
005
377,
005
1979
327
327
1,80
51,
805
1,36
61,
366
1,24
91,
249
340,
094
340,
094
1980
601
601
6,11
06,
110
3,68
03,
680
953
953
319,
800
319,
800
1981
739
739
5,91
85,
918
1,91
11,
911
1,01
01,
010
322,
177
322,
177
1982
553
553
2,12
12,
121
1,33
81,
338
783
783
235,
888
235,
888
1983
456
456
3,82
93,
829
1,23
61,
236
1,70
91,
709
163,
741
163,
741
1984
5,35
15,
351
3,51
43,
514
666
666
987
987
222,
947
222,
947
1985
919
919
3,60
43,
604
296
296
536
536
280,
394
280,
394
1986
133
133
490
490
595
595
1,14
01,
140
341,
208
341,
208
1987
417
417
3,32
63,
326
557
557
1,61
21,
612
342,
285
342,
285
1988
288
288
9,55
09,
550
1,26
71,
267
1,29
71,
297
388,
279
388,
279
1989
11
12,0
9512
,095
783
783
1,07
21,
072
398,
340
398,
340
1990
184
184
13,8
5613
,856
792
792
944
944
367,
934
367,
934
1991
834
834
1,28
81,
288
446
446
649
649
309,
799
309,
799
1992
255
255
978
978
104
104
762
762
333,
408
333,
408
1993
10
159
912
611
104
3,95
04,
054
314
1,98
12,
295
329,
394
22,1
5735
1,55
119
9485
085
8,69
214
58,
837
188
805
993
419
522
941
333,
616
18,7
0535
2,32
119
9546
52
467
8,00
955
8,06
418
71,
415
1,60
217
266
884
040
9,05
027
,368
436,
418
1996
830
8365
51
656
704
2,41
73,
121
219
1,05
21,
271
423,
648
40,8
8646
4,53
419
9760
060
1,10
45
1,10
910
12,
582
2,68
314
83,
407
3,55
547
5,47
949
,122
524,
601
1998
124
012
41,
337
51,
342
527
1,85
72,
384
168
1,23
31,
401
450,
253
33,5
2248
3,77
519
9927
60
276
1,59
70
1,59
717
83,
412
3,59
024
03,
096
3,33
661
1,48
145
,170
656,
651
2000
149
014
961
50
615
293
1,88
52,
178
364
1,49
61,
860
559,
243
42,1
8460
1,42
720
0120
020
180
181,
798
1,26
13,
059
436
766
1,20
258
7,30
824
,732
612,
040
ANNUAL REPORT 2001 75

76 TUNA COMMISSION
TAB
LE 4
a.Es
timat
es o
f the
ret
aine
d ca
tche
s an
d la
ndin
gs, i
n m
etri
c to
ns, o
f tun
as c
augh
t by
surf
ace
gear
in th
e EP
O in
200
0, b
y sp
ecie
s an
d ve
ssel
flag
(upp
er p
anel
) and
loca
tion
whe
repr
oces
sed
(low
er p
anel
). Y
FT =
yel
low
fin; S
KJ
= s
kipj
ack;
BET
= b
igey
e; P
BF =
Pac
ific
blue
fin; B
EP =
bon
ito; A
LB =
alb
acor
e; B
KJ
= b
lack
ski
pjac
k; M
isc.
= o
ther
spe
cies
, inc
ludi
ngsh
arks
, oth
er tu
nas,
and
mis
cella
neou
s fis
hes.
TAB
LA 4
a.Es
timac
ione
s de
las
capt
uras
ret
enid
as y
des
carg
as d
e at
ún c
aptu
rado
con
art
es d
e su
perf
icie
en
el O
PO e
n 20
00, p
or e
spec
ie y
ban
dera
del
buq
ue (p
anel
sup
erio
r) y
loca
lidad
dond
e fu
e pr
oces
ado
(pan
el in
feri
or),
en to
nela
das
mét
rica
s. Y
FT =
ale
ta a
mar
illa;
SK
J =
bar
rile
te; B
ET =
pat
udo;
PBF
= a
leta
azu
l del
Pac
ífico
; BEP
= b
onito
; ALB
= a
lbac
ora;
BK
J =
barr
ilete
neg
ro; M
isc.
= o
tras
esp
ecie
s, in
cluy
endo
tibu
rone
s, ot
ros t
únid
os, y
pec
es d
iver
sos.
Flag
YFT
Perc
ent
of t
otal
SKJ
BE
TP
BF
ALB
BE
PB
SJM
isc.
Tota
lB
ande
raC
YRA
−− AR
CA
AO
utsi
de−− E
xter
ior
Porc
enta
je d
el t
otal
Ret
aine
d ca
tche
s−−C
aptu
ras
rete
nida
sCo
lom
bia
12,1
123,
443
6,16
01,
025
00
00
022
,740
4.1
Ecua
dor
33,6
144,
578
110,
415
27,8
680
00
268
9817
6,84
131
.6Es
paña
−Spa
in
3,14
42,
876
16,3
6817
,482
00
00
039
,870
7.1
Méx
ico
78,3
2523
,565
16,3
9082
3,09
142
892
222
112
2,19
621
.9Pa
nam
á5,
735
466
12,4
773,
926
00
010
2922
,643
4.0
U.S.
A.−E
E.U
U.3,
460
1,07
710
,668
2,06
71,
037
187
571
1618
,570
3.3
Vene
zuel
a59
,475
10,3
315,
118
206
00
012
075
,142
13.4
Vanu
atu
11,4
762,
722
11,0
376,
074
00
00
031
,309
5.6
Oth
er−O
tros
113
,881
2,13
122
,496
11,4
240
00
00
49,9
328.
9To
tal
221,
222
51,1
8921
1,12
970
,154
4,12
861
514
929
336
455
9,24
3La
ndin
gs−− D
esca
rgas
Colo
mbi
a38
,102
9,71
217
,947
5,92
10
00
100
71,6
9213
.2Co
sta
Rica
14,5
3325
83,
936
805
00
00
019
,532
3.6
Ecua
dor
44,0
206,
866
131,
719
33,9
490
00
268
148
216,
970
39.8
Espa
ña−S
pain
5,
383
2,34
39,
401
12,6
080
05
00
29,7
405.
5M
éxic
o73
,605
22,9
7514
,936
944
3,15
642
786
622
111
6,35
621
.3U.
S.A.
−EE.
UU.
2,78
91,
178
6,95
11,
881
580
057
20
13,4
382.
5Ve
nezu
ela
25,5
003,
204
3,56
552
00
06
032
,327
5.9
Oth
er−O
tros
212
,488
2,20
718
,860
10,9
9439
018
60
00
45,1
258.
3To
tal
216,
420
48,7
4320
7,31
567
,154
4,12
661
314
829
236
954
5,18
0
1 In
clud
es B
eliz
e, B
oliv
ia, G
uate
mal
a, H
ondu
ras,
and
Nic
arag
ua.
This
cat
egor
y is
use
d to
avo
id r
evea
ling
the
oper
atio
ns o
f ind
ivid
ual v
esse
ls o
r co
mpa
nies
.1
Incl
uye
Belic
e, B
oliv
ia, G
uate
mal
a, H
ondu
ras,
y N
icar
agua
. Se
usa
est
a ca
tego
ría
para
no
reve
lar
info
rmac
ión
sobr
e la
s act
ivid
ades
de
buqu
es o
em
pres
as in
divi
dual
es..
2In
clud
es G
hana
, Ita
ly, L
ibya
, Per
u, T
urke
y, an
d un
iden
tifie
d. T
his c
ateg
ory
is u
sed
to a
void
rev
ealin
g th
e op
erat
ions
of i
ndiv
idua
l ves
sels
or
com
pani
es.
2In
cluy
e G
hana
, Ita
lia, L
ibia
, Per
ú, T
urqu
ía, y
no
iden
tific
ados
. Se
usa
est
a ca
tego
ría
para
no
reve
lar
info
rmac
ión
sobr
e la
s act
ivid
ades
de
buqu
es o
em
pres
as in
divi
dual
es.

TAB
LE 4
b. P
relim
inar
y es
timat
es o
f the
reta
ined
catc
hes a
nd la
ndin
gs, i
n m
etri
c ton
s, of
tuna
s cau
ght b
y su
rfac
e ge
ar in
the
EPO
in 2
001,
by
spec
ies a
nd v
esse
l fla
g (u
pper
pan
el) a
nd lo
ca-
tion
whe
re p
roce
ssed
(low
er p
anel
). Y
FT =
yel
low
fin; S
KJ
= s
kipj
ack;
BET
= b
igey
e; P
BF =
Pac
ific
blue
fin; B
EP =
bon
ito; A
LB =
alb
acor
e; B
KJ
= b
lack
ski
pjac
k; M
isc.
= o
ther
spe
cies
,in
clud
ing
shar
ks, o
ther
tuna
s, an
d m
isce
llane
ous f
ishe
sTA
BLA
4b.
Estim
acio
nes p
relim
inar
es d
e la
s cap
tura
s ret
enid
as y
des
carg
as d
e at
ún ca
ptur
ado
con
arte
s de
supe
rfic
ie e
n el
OPO
en
2001
, por
esp
ecie
y b
ande
ra d
el b
uque
(pan
el su
peri
or) y
loca
lidad
don
de fu
e pr
oces
ado
(pan
el in
feri
or),
en to
nela
das
mét
rica
s. Y
FT =
ale
ta a
mar
illa;
SK
J =
bar
rile
te; B
ET =
pat
udo;
PBT
= a
leta
azu
l del
Pac
ífico
; BEP
= b
onito
; ALB
= a
lbac
ora;
BKJ
= b
arri
lete
neg
ro; M
isc.
= o
tras
esp
ecie
s, in
cluy
endo
tibu
rone
s, ot
ros t
únid
os, y
pec
es d
iver
sos
Flag
YFT
Perc
ent
of t
otal
SKJ
BE
TP
BF
ALB
BE
PB
SJM
isc.
Tota
lB
ande
raC
YRA
−− AR
CA
AO
utsi
de−− E
xter
ior
Porc
enta
je d
el t
otal
Ret
aine
d ca
tche
s−−C
aptu
ras
rete
nida
sCo
lom
bia
23,0
101,
861
2,52
315
00
00
7912
27,6
354.
7Ec
uado
r50
,412
4,29
670
,353
19,8
790
00
1,64
642
114
7,00
725
.0Es
paña
−Spa
in6,
853
4,11
421
,564
6,72
40
00
00
39,2
556.
7M
éxic
o11
1,05
223
,231
8,07
191
863
1818
00
143,
344
24.4
Pana
má
11,6
6412
776,
601
1,71
50
00
03
21,2
603.
6U.
S.A.
−EE.
UU.
4,06
61,
377
4,20
22,
226
446
02
730
12,3
922.
1Ve
nezu
ela
100,
187
9,45
12,
214
30
00
00
111,
855
19.0
Vanu
atu
9,73
51,
029
7,93
73,
785
00
00
022
,486
3.8
Oth
er−O
tros
127
,618
4,80
721
,375
8,27
40
00
00
62,0
7410
.6To
tal
344,
597
51,4
4314
4,84
042
,847
1,30
918
201,
798
436
587,
308
Land
ings
−− Des
carg
asCo
lom
bia
35,3
683,
517
6,64
72,
017
00
00
047
,549
8.1
Cost
a Ri
ca25
,691
541
2,03
154
80
00
00
28,8
114.
9Ec
uado
r89
,714
9,83
594
,680
31,0
030
00
1,72
543
622
7,39
338
.6Es
paña
−Spa
in8,
295
3,76
39,
665
3,41
10
017
00
25,1
514.
3M
éxic
o10
5,59
122
,816
7,75
790
853
170
00
137,
124
23.3
Perú
1,38
434
51,
370
00
00
00
3,09
90.
5U.
S.A.
−EE.
UU
351
364
1,28
246
445
60
272
02,
991
0.5
Vene
zuel
a30
,245
2,13
971
40
00
00
033
,098
5.6
Oth
er−O
tros
249
,905
8,31
420
,597
5,73
00
00
00
84,5
4614
.3To
tal
346,
544
51,6
3414
4,74
343
,263
1,30
917
191,
797
436
589,
762
1 In
clud
es B
eliz
e, B
oliv
ia, C
olom
bia,
El S
alva
dor,
Gua
tem
ala,
Hon
dura
s, N
icar
agua
, and
uni
dent
ified
. Th
is c
ateg
ory
is u
sed
to a
void
rev
ealin
g th
e op
erat
ions
of i
ndiv
id-u
al v
esse
ls o
r co
mpa
nies
.1
Incl
uye
Belic
e, B
oliv
ia, C
olom
bia,
El S
alva
dor,
Gua
tem
ala,
Hon
dura
s, N
icar
agua
, y n
o id
entif
icad
os.
Se u
sa e
sta
cate
gorí
a pa
ra n
o re
vela
r in
form
ació
n so
bre
las a
ctiv
idad
es d
e bu
ques
o e
mpr
esas
indi
vidu
ales
.2
Incl
udes
Gua
tem
ala,
Pan
ama,
Tha
iland
, and
uni
dent
ified
. Th
is c
ateg
ory
is u
sed
to a
void
rev
ealin
g th
e op
erat
ions
of i
ndiv
idua
l ves
sels
or
com
pani
es.
2In
clud
es G
uate
mal
a, P
anam
á, T
aila
ndia
, y n
o id
entif
icad
os.
Se
usa
esta
cat
egor
ía p
ara
no r
evel
ar in
form
ació
n so
bre
las a
ctiv
idad
es d
e bu
ques
o e
mpr
esas
indi
vidu
ales
.
ANNUAL REPORT 2001 77

78 TUNA COMMISSION
TABLE 5. Estimated numbers of sets by set type and vessel size class, and estimated retained catches, in metric tons,for yellowfin, skipjack, and bigeye tuna in the EPO, by purse-seine vessels. The data for 2001 are preliminary.TABLA 5. Números estimados de lances, por tipo de lance y clase de arqueo de los buques, y capturas retenidas esti-madas, en toneladas métricas, de atunes aleta amarilla, barrilete, y patudo en el OPO. Los datos de 2001 son preliminares.
Sets on fish associated with dolphinsYear Number of sets Retained catch
Classes 1-5 Class 6 Total Yellowfin Skipjack BigeyeLances sobre peces asociados con delfines
Año Número de lances Captura retenidaClases 1-5 Clase 6 Total Aleta amarilla Barrilete Patudo
1987 33 13,286 13,319 190,431 332 201988 41 11,160 11,201 157,174 4,898 01989 29 12,827 12,856 194,845 1,447 01990 29 10,997 11,026 179,254 867 01991 0 9,661 9,661 159,259 786 381992 26 10,398 10,424 169,348 869 01993 34 6,953 6,987 110,046 714 971994 3 7,804 7,807 125,380 516 01995 0 7,185 7,185 131,934 1,032 01996 2 7,472 7,474 137,256 729 01997 35 8,977 9,012 156,163 6,004 351998 0 10,645 10,645 151,677 2,879 661999 0 8,648 8,648 143,144 1,077 02000 1 9,235 9,236 155,127 484 02001 0 9,577 9,577 235,492 1,352 12
Sets on fish associated with floating objectsYear Number of sets Retained catch
Classes 1-5 Class 6 Total Yellowfin Skipjack BigeyeLances sobre peces asociados con objetos flotantes
Año Número de lances Captura retenidaClases 1-5 Clase 6 Total Aleta amarilla Barrilete Patudo
1987 1,314 1,813 3,127 27,189 32,160 5621988 813 2,281 3,094 23,933 35,950 5691989 960 2,339 3,299 28,362 41,452 1,2151990 718 2,558 3,276 34,248 34,980 3,3591991 802 2,165 2,967 23,758 37,655 1,9501992 873 1,763 2,636 13,058 45,556 1,1541993 498 2,063 2,561 15,964 48,144 4,5471994 619 2,770 3,389 17,360 47,991 27,4721995 669 3,521 4,190 20,569 81,253 32,7651996 1,197 4,007 5,204 31,839 74,260 48,2531997 1,662 5,653 7,315 27,623 123,002 50,2261998 1,198 5,481 6,679 31,271 115,370 31,3321999 623 4,620 5,243 39,165 181,817 36,0722000 516 3,916 4,432 42,396 121,049 67,2812001 698 5,659 6,357 64,628 121,711 42,352

TABLE 5. (continued)TABLA 5. (continuación)
Sets on fish in unassociated schoolsYear Number of sets Retained catch
Classes 1-5 Class 6 Total Yellowfin Skipjack BigeyeLances sobre peces en cardúmenes no asociados
Año Número de lances Captura retenidaClases 1-5 Clase 6 Total Aleta amarilla Barrilete Patudo
1987 1,804 3,981 5,785 49,400 26,303 1941988 4,161 7,536 11,697 102,042 39,536 4811989 2,925 5,878 8,803 60,228 46,332 2551990 3,656 5,397 9,053 56,548 35,788 1,3511991 3,577 3,612 7,189 52,772 22,958 1,7261992 4,160 4,079 8,239 53,506 35,333 4,3441993 5,708 6,267 11,975 100,974 34,865 3,4231994 5,407 5,064 10,471 72,764 22,916 1,9031995 6,021 4,782 10,803 69,984 50,715 4,5611996 5,719 5,118 10,837 77,342 34,635 3,1001997 5,294 4,693 9,987 69,657 29,510 1,3541998 5,645 4,631 10,276 77,642 25,108 3,7581999 5,552 6,143 11,695 111,677 81,150 4,5392000 6,023 5,482 11,505 72,761 89,491 2,8542001 4,635 2,973 7,608 90,485 20,795 1,252
Sets on all types of schoolsYear Number of sets Retained catch
Classes 1-5 Class 6 Total Yellowfin Skipjack BigeyeLances sobre todos tipos de cardumen
Año Número de lances Captura retenidaClases 1-5 Clase 6 Total Aleta amarilla Barrilete Patudo
1987 3,151 19,080 22,231 267,020 58,795 7761988 5,015 20,977 25,992 283,148 80,383 1,0501989 3,914 21,044 24,958 283,436 89,231 1,4711990 4,403 18,952 23,355 270,050 71,635 4,7101991 4,379 15,438 19,817 235,789 61,399 3,7131992 5,059 16,240 21,299 235,912 81,758 5,4981993 6,240 15,283 21,523 226,984 83,723 8,0681994 6,029 15,638 21,667 215,505 71,423 29,3751995 6,690 15,488 22,178 222,488 133,000 37,3271996 6,918 16,597 23,515 246,437 109,624 51,3531997 6,991 19,323 26,314 253,443 158,515 51,6151998 6,843 20,757 27,600 260,591 143,357 35,1561999 6,175 19,411 25,586 293,986 264,043 40,6112000 6,540 18,633 25,173 270,284 211,024 70,1352001 5,333 18,209 23,542 390,606 143,857 43,616
ANNUAL REPORT 2001 79

TABLE 6. Catches per cubic meter of carrying capacity for the EPO purse-seine fleet, by species and vessel size group,in the EPO and in all ocean fishing areas. YFT = yellowfin; SKJ = skipjack; BET = bigeye; All = all species reported.TABLA 6. Capturas por metro cúbico de capacidad de acarreo por de la flota cerquera del OPO, por especie y clase dearqueo, en el OPO y en todas las áreas oceánicas de pesca. YFT = aleta amarilla; SKJ = barrilete; BET = patudo; EPO= OPO; All = todas las especies reportadas.
Year Species <401 m3 401-800 m3 801-1100 m3 1101-1300 m3 1301-1500 m3 1501-1800 m3 1801-2100 m3 >2100 m3 TotalAño Especie EPO All EPO All EPO All EPO All EPO All EPO All EPO All EPO All EPO All
1990 YFT 1.9 1.9 1.3 1.3 1.3 1.3 2.2 2.2 2.2 2.2 1.4 1.5 0.8 0.9 0.0 0.0 1.8 1.9SKJ 1.9 1.9 0.7 0.7 0.3 0.3 0.4 0.5 0.2 0.4 0.3 0.5 0.1 0.2 0.0 0.0 0.5 0.5BET 0.0 0.0 0.1 0.1 0.0 0.0 0.0 0.0 0.0 0.0 0.0 0.0 0.0 0.0 0.0 0.0 0.0 0.0All 4.9 4.9 2.4 2.4 1.9 1.9 2.6 2.7 2.4 2.6 1.7 2.0 0.9 1.1 0.0 0.0 2.5 2.6
1991 YFT 2.1 2.1 1.6 1.6 1.4 1.4 2.3 2.3 1.2 1.2 1.3 1.5 1.9 1.9 0.0 0.0 1.9 1.9SKJ 1.4 1.4 0.7 0.8 0.4 0.5 0.4 0.4 0.3 0.3 0.4 0.5 0.0 0.0 0.0 0.0 0.5 0.5BET 0.1 0.1 0.1 0.1 0.0 0.0 0.0 0.0 0.0 0.0 0.0 0.0 0.0 0.0 0.0 0.0 0.0 0.0All 3.8 3.8 2.4 2.5 1.8 1.9 2.6 2.7 1.5 1.5 1.7 2.0 1.9 1.9 0.0 0.0 2.4 2.5
1992 YFT 1.4 1.4 1.5 1.5 1.6 1.6 2.5 2.5 2.0 2.0 1.1 1.2 1.0 1.0 0.0 0.0 2.0 2.0SKJ 1.7 1.7 1.0 1.0 0.6 0.6 0.5 0.5 0.5 0.5 0.8 0.8 0.0 0.0 0.0 0.0 0.7 0.7BET 0.0 0.0 0.1 0.1 0.1 0.1 0.0 0.0 0.0 0.0 0.1 0.1 0.0 0.0 0.0 0.0 0.0 0.0All 3.4 3.4 2.6 2.6 2.2 2.2 3.0 3.1 2.5 2.5 2.1 2.1 1.0 1.0 0.0 0.0 2.7 2.8
1993 YFT 2.4 2.4 1.6 1.6 1.8 1.8 1.9 1.9 2.1 2.1 1.3 1.5 1.4 1.4 0.0 0.0 1.8 1.9SKJ 1.6 1.6 1.0 1.0 0.7 0.7 0.4 0.5 0.7 0.7 0.9 1.1 0.0 0.0 0.0 0.0 0.7 0.7BET 0.0 0.0 0.1 0.1 0.1 0.1 0.1 0.1 0.1 0.1 0.1 0.1 0.0 0.0 0.0 0.0 0.1 0.1All 4.2 4.2 2.7 2.7 2.6 2.6 2.4 2.5 2.8 2.8 2.3 2.7 1.4 1.4 0.0 0.0 2.6 2.7
1994 YFT 2.2 2.2 1.2 1.2 1.4 1.4 2.0 2.1 1.8 1.8 1.6 1.9 0.3 0.3 0.0 0.0 1.7 1.8SKJ 1.0 1.0 0.8 0.8 0.4 0.4 0.4 0.5 0.7 0.7 0.5 0.7 0.5 0.5 0.0 0.0 0.6 0.6BET 0.0 0.0 0.2 0.2 0.2 0.2 0.2 0.2 0.2 0.2 0.4 0.4 0.7 0.7 0.0 0.0 0.2 0.2All 3.7 3.7 2.2 2.2 2.1 2.1 2.6 2.8 2.7 2.7 2.4 3.0 1.6 1.6 0.0 0.0 2.6 2.7
1995 YFT 1.6 1.6 1.2 1.2 1.3 1.4 2.1 2.2 1.6 1.6 1.6 1.6 0.2 0.2 0.0 0.0 1.7 1.7SKJ 2.0 2.0 1.3 1.3 1.1 1.2 0.7 0.7 1.0 1.0 0.5 0.5 1.5 1.5 0.0 0.0 1.0 1.0BET 0.1 0.1 0.2 0.2 0.3 0.3 0.3 0.3 0.3 0.3 0.4 0.4 1.2 1.2 0.0 0.0 0.3 0.3All 4.3 4.3 2.8 2.8 2.8 2.8 3.1 3.1 3.0 3.0 2.5 2.5 2.9 2.9 0.0 0.0 3.1 3.1
1996 YFT 1.9 1.9 1.2 1.2 1.5 1.5 2.2 2.2 1.5 1.5 1.7 1.9 0.9 0.9 0.0 0.0 1.8 1.8SKJ 1.9 1.9 1.0 1.0 0.8 0.8 0.6 0.6 0.7 0.7 0.5 0.7 0.8 0.8 0.0 0.0 0.8 0.8BET 0.2 0.2 0.5 0.5 0.7 0.7 0.3 0.3 0.3 0.3 0.2 0.2 0.7 0.7 0.0 0.0 0.4 0.4All 4.4 4.4 2.9 2.9 3.0 3.1 3.1 3.1 2.5 2.5 2.4 2.8 2.3 2.3 0.0 0.0 3.0 3.1
1997 YFT 1.9 1.9 1.2 1.2 1.2 1.2 2.2 2.2 1.4 1.4 1.1 1.2 0.7 0.7 0.0 0.0 1.6 1.7SKJ 2.3 2.3 1.5 1.6 1.0 1.0 0.7 0.8 1.0 1.0 0.6 0.7 1.1 1.1 0.0 0.0 1.0 1.1BET 0.4 0.4 0.6 0.6 0.6 0.6 0.2 0.2 0.4 0.4 0.1 0.2 0.4 0.4 0.0 0.0 0.3 0.3All 4.8 4.8 3.4 3.4 2.8 2.8 3.1 3.2 2.8 2.8 1.9 2.1 2.2 2.2 0.0 0.0 3.0 3.1
1998 YFT 1.8 1.8 1.1 1.1 1.2 1.2 2.1 2.2 1.3 1.4 1.7 1.8 0.5 0.5 0.4 0.4 1.6 1.6SKJ 1.3 1.3 1.2 1.2 1.0 1.0 0.5 0.6 1.0 1.1 0.7 0.9 1.2 1.2 1.5 1.5 0.9 0.9BET 0.2 0.2 0.3 0.3 0.2 0.2 0.1 0.1 0.3 0.3 0.2 0.2 0.3 0.3 0.5 0.5 0.2 0.2All 3.5 3.5 2.6 2.6 2.4 2.4 2.8 2.8 2.6 2.8 2.6 2.9 2.1 2.1 2.5 2.5 2.7 2.7
1999 YFT 3.2 3.2 1.5 1.5 1.2 1.3 2.0 2.0 1.3 1.3 2.2 2.2 0.5 0.5 0.4 0.4 1.6 1.6SKJ 1.9 1.9 2.1 2.1 1.7 1.8 0.9 1.0 1.9 1.9 1.1 1.1 1.5 1.7 2.2 2.5 1.5 1.5BET 0.2 0.2 0.3 0.3 0.2 0.2 0.1 0.1 0.3 0.3 0.2 0.2 0.4 0.4 0.8 0.9 0.2 0.2All 5.4 5.4 3.9 3.9 3.2 3.3 3.0 3.1 3.5 3.5 3.5 3.5 2.4 2.7 3.5 3.8 3.3 3.4
2000 YFT 1.8 1.8 0.9 0.9 1.0 1.0 2.2 2.3 1.3 1.4 1.5 1.6 0.6 0.8 0.5 0.5 1.5 1.5SKJ 2.5 2.5 1.7 1.7 1.8 1.8 0.5 0.6 1.1 1.2 0.8 0.9 1.5 1.8 1.4 1.6 1.2 1.2BET 0.1 0.1 0.4 0.4 0.5 0.5 0.1 0.1 0.4 0.4 0.2 0.2 1.0 1.2 1.5 1.5 0.4 0.4All 4.5 4.5 2.9 2.9 3.4 3.4 2.9 3.0 2.8 2.9 2.6 2.7 3.2 3.8 3.3 3.6 3.1 3.2
2001 YFT 2.5 2.5 1.3 1.3 1.4 1.4 3.0 3.0 2.1 2.1 2.4 2.4 0.9 0.9 0.6 0.6 2.1 2.1SKJ 1.3 1.3 1.1 1.1 1.1 1.1 0.3 0.3 0.7 0.7 0.4 0.4 1.4 1.4 1.3 1.3 0.8 0.8BET 0.0 0.0 0.3 0.3 0.3 0.3 0.1 0.1 0.3 0.3 0.1 0.1 0.5 0.5 0.5 0.5 0.2 0.2All 3.9 3.9 2.6 2.6 2.8 2.9 3.4 3.4 3.1 3.1 2.9 3.0 2.8 2.8 2.4 2.4 3.1 3.1
80 TUNA COMMISSION

TABLE 7a. Annual retained catches of yellowfin tuna, in thousands of metric tons. In some cases the data were con-verted from numbers of fish to weight in metric tons with average weight data estimated by the IATTC staff. “Others”includes Costa Rica, Ecuador, El Salvador, French Polynesia, Guatemala, Mexico, Nicaragua, and the USA. JPN = Japan;KOR = Republic of Korea; TWN = Taiwan; WCPO = western and central Pacific Ocean.TABLA 7a. Capturas retenidas anuales de atún aleta amarilla, en miles de toneladas métricas. En algunos casos se con-virtieron los datos de números de peces a peso en toneladas métricas usando datos de peso promedio estimados por el per-sonal de la CIAT. “Otros” incluye Costa Rica, Ecuador, EE.UU., El Salvador, Guatemala, México, Nicaragua, y PolinesiaFrancesa. JPN = Japón; KOR = República de Corea; TWN = Taiwan; OPOC = Océano Pacífico occidental y central.
Pacific OceanEastern Atlantic Indian
Year TotalLongline2 WCPO3 Total4 Ocean5 Ocean6
Surface1 TotalJPN TWN KOR Others Total
Océano PacíficoOriental Oceáno Oceáno
Año TotalPalangre2 OPOC3 Total4 Atlántico5 Indico6
Superficie1 TotalJPN TWN KOR Otros Total
1970 155.6 12.3 0.1 0.0 12.4 168.0 90.9 259.0 74.3 41.8 375.11971 122.8 7.4 0.3 0.0 7.6 130.5 81.0 211.5 73.8 41.0 326.21972 177.1 16.0 0.5 0.0 16.6 193.7 105.7 299.4 94.1 42.8 436.21973 205.3 11.4 0.3 0.0 11.8 217.0 127.8 344.8 95.1 35.6 475.51974 210.4 6.9 0.3 0.0 7.2 217.6 133.6 351.1 107.1 37.6 495.91975 202.1 10.3 0.3 0.2 0.0 10.8 212.9 134.1 347.0 124.8 37.4 509.21976 236.3 15.0 0.2 0.4 0.0 15.6 252.0 144.9 396.9 125.0 37.3 559.11977 198.8 11.2 0.1 0.8 0.0 12.2 211.0 166.5 377.5 131.0 58.8 567.31978 180.6 9.2 0.1 0.8 0.0 10.1 190.7 183.2 373.9 134.0 48.3 556.21979 189.7 10.9 0.1 0.4 0.0 11.4 201.1 187.0 388.1 127.5 42.3 557.91980 159.4 11.5 0.1 1.9 0.0 13.6 173.0 200.4 373.4 131.0 38.2 542.61981 181.8 7.1 0.1 0.8 0.0 8.0 189.8 196.0 385.8 155.8 41.4 583.01982 125.1 9.8 0.1 1.1 0.0 10.9 136.0 221.6 357.6 165.0 51.6 574.21983 94.3 9.4 0.0 1.4 0.0 10.9 105.1 257.5 362.6 165.4 61.3 589.31984 145.1 9.1 0.0 1.2 0.0 10.3 155.4 229.2 384.6 113.9 99.7 598.21985 217.0 10.6 0.0 2.5 0.0 13.2 230.2 214.2 444.4 156.5 120.7 721.61986 268.3 17.8 0.1 4.8 0.1 22.7 291.0 208.9 499.9 146.5 137.3 783.81987 272.2 13.5 0.1 4.7 0.3 18.6 290.8 273.0 563.8 144.4 154.8 863.01988 288.4 12.5 0.0 0.3 0.2 13.0 301.4 257.1 558.5 135.2 207.6 901.31989 289.4 15.3 0.2 0.7 0.0 16.3 305.7 288.0 593.6 161.3 177.7 932.61990 273.3 29.3 0.3 1.6 0.0 31.1 304.4 319.0 623.4 192.5 202.3 1,018.21991 239.1 23.7 0.3 0.8 0.2 25.1 264.2 333.8 598.0 166.2 223.3 987.41992 239.8 15.3 0.0 3.7 0.1 19.1 259.0 385.5 644.5 162.3 274.2 1,081.01993 232.1 20.3 0.1 0.0 1.8 22.3 254.4 364.9 619.3 160.1 347.3 1,126.71994 219.3 26.0 0.2 2.3 34.7 63.3 282.5 350.0 632.5 170.5 264.9 1,068.01995 223.8 17.0 0.1 2.0 7.1 26.2 250.0 320.3 570.3 152.0 288.9 1,011.21996 250.2 12.6 0.0 1.8 0.4 14.8 265.0 252.9 517.9 153.4 328.5 999.81997 257.8 16.2 0.1 2.8 0.8 19.9 277.8 404.5 682.2 138.2 285.2 1,105.61998 265.7 11.0 0.1 * 17.8 28.9 294.6 382.3 676.9 148.0 272.1 1,097.01999** 296.9 7.4 0.1 * 10.5 17.9 314.9 349.8 664.7 143.9 316.1 1,124.72000** 272.4 15.0 * * 16.2 31.2 303.9 326.9 630.8 135.2 294.4 1,060.42001** 396.0 13.3 * * 2.9 16.2 412.2 * * * * *1 Source: Table 3−Fuente: Tabla 32 Sources: published and unpublished data from the National Research Institute of Far Seas Fisheries (NRIFSF),
Shimizu, Japan, Institute of Oceanography, National Taiwan University, Taipei, Taiwan, Ministry of Agriculture,People’s Republic of China, and National Fisheries Research and Development Agency, Republic of Korea.
2 Fuentes: datos publicados e inéditos del Instituto Nacional de Investigación de Pesquerías de Ultramar (NRIFSF) en Shimizu (Japón), el Instituto de Oceanografía de la Universidad Nacional de Taiwan en Taipei, Ministerio deAgricultura, República Popular de China, y la Agencia Nacional de Investigación y Desarrollo Pesquero de Corea.
3 Source: Column 10 - Column 8−Fuente: Columna 10 - Columna 84 Source: FAO data set for Fishstat+−Fuente: datos de FAO para Fishstat+5 Source: ICCAT data set for Fishstat+−Fuente: datos de CICAA para Fishstat+6 Source: IOTC data set for Fishstat+− Fuente: datos de CTOI para Fishstat+* not available−no disponible**preliminary−preliminares
ANNUAL REPORT 2001 81

82 TUNA COMMISSION
TABLE 7b. Annual retained catches of skipjack tuna, in thousands of metric tons. WCPO = western and centralPacific Ocean.TABLA 7b. Capturas retenidas anuales de atún barrilete, en miles de toneladas métricas. OPOC = Océano Pacíficooccidental y central.
Year Eastern Pacific1 WCPO2 Total Pacific3 Atlantic4 Indian5 TotalAño Pacífico oriental1 OPOC2 Pacífico total3 Atlántico4 Indico5 Total1970 56.0 258.5 314.5 50.3 47.5 412.21971 104.7 246.6 351.3 78.4 44.9 474.71972 33.4 311.1 344.5 77.4 40.2 462.01973 44.0 402.2 446.2 78.4 43.8 568.41974 78.8 445.9 524.7 117.3 55.8 697.81975 123.9 344.5 468.4 56.0 42.5 566.91976 126.3 432.4 558.7 69.3 42.8 670.81977 86.3 420.0 506.4 110.6 35.3 652.31978 169.9 531.3 701.2 108.1 33.9 843.21979 132.0 469.5 601.6 89.7 40.7 731.91980 130.7 502.8 633.5 111.4 48.9 793.81981 119.6 455.7 575.3 131.1 50.1 756.41982 98.8 469.8 568.6 154.9 53.6 777.11983 58.1 651.0 709.2 135.0 64.5 908.71984 60.6 770.9 831.4 126.8 107.1 1,065.31985 49.5 610.5 659.9 118.7 133.5 912.11986 63.6 751.2 814.8 122.2 148.3 1,085.21987 62.3 687.0 749.4 114.6 162.3 1,026.21988 85.3 851.9 937.2 140.0 197.9 1,275.11989 92.4 772.7 865.0 116.1 246.7 1,227.81990 72.6 867.3 939.9 138.7 227.5 1,306.11991 63.3 1,194.8 1,258.0 213.8 242.5 1,714.31992 84.0 924.8 1,008.8 161.4 268.1 1,438.21993 87.4 921.9 1,009.3 192.4 284.1 1,485.71994 74.5 988.0 1,062.5 175.5 319.7 1,557.81995 138.2 1,046.4 1,184.7 161.6 308.7 1,655.01996 112.2 1,040.6 1,152.8 150.3 283.5 1,586.71997 161.8 1,010.6 1,172.4 144.4 298.0 1,614.81998 145.0 1,281.5 1,426.5 147.7 312.6 1,886.91999 268.0 1,157.7 1,425.7 166.4 404.4 1,996.62000** 211.1 1,211.0 1,422.1 139.3 393.4 1,954.82001** 144.8 * * * * *
1 Source: Table 3−Fuente: Tabla 32 Column 4 - Column 2−Columna 4 - Columna 23 Source: FAO data set for Fishstat+−Fuente: datos de FAO para Fishstat+4 Source: ICCAT data set for Fishstat+−Fuente: datos de ICCAT para Fishstat+5 Source: IOTC data set for Fishstat+−Fuente: datos de IOTC para Fishstat+* not available−no disponible**preliminary−preliminares

TABLE 7c. Annual retained catches of bigeye tuna, in thousands of metric tons. In some cases the data were convertedfrom numbers of fish to weight in metric tons with average weight data estimated by the IATTC staff. “Others” includesCosta Rica, Ecuador, El Salvador, French Polynesia, Guatemala, Mexico, Nicaragua, and the USA. JPN = Japan; KOR =Republic of Korea; TWN = Taiwan; WCPO = western and central Pacific Ocean.TABLA 7c. Capturas retenidas anuales de atún patudo, en miles de toneladas métricas. En algunos casos se convirtieronlos datos de números de peces a peso en toneladas métricas usando datos de peso promedio estimados por el personal de laCIAT. “Otros” incluye Costa Rica, Ecuador, EE.UU., El Salvador, Guatemala, México, Nicaragua, y Polinesia Francesa. JPN= Japón; KOR = República de Corea; TWN = Taiwan; OPOC = Océano Pacífico occidental y central.
Pacific OceanEastern Atlantic Indian
Year TotalLongline2 WCPO3 Total4 Ocean5 Ocean6
Surface1 TotalJPN TWN KOR Others Total
Océano PacíficoOriental Oceáno Oceáno
Año TotalPalangre2 OPOC3 Total4 Atlántico5 Indico6
Superficie1 TotalJPN TWN KOR Otros Total
1970 1.3 32.5 0.4 * 0.0 32.9 34.2 50.0 84.2 42.3 24.9 151.51971 2.6 28.9 0.3 * 0.0 29.2 31.8 34.2 66.0 55.8 20.4 142.21972 2.2 35.1 0.8 * 0.0 35.9 38.2 49.6 87.7 47.2 18.8 153.71973 2.0 49.7 1.3 * 0.0 51.0 53.0 37.4 90.4 57.0 15.8 163.21974 0.9 36.0 0.6 * 0.0 36.6 37.5 50.4 87.9 64.1 26.5 178.51975 3.7 40.7 0.4 0.6 0.0 41.8 45.5 57.6 103.1 61.3 36.2 200.61976 10.2 52.8 0.2 1.2 0.0 54.2 64.5 64.5 129.0 45.3 27.7 202.11977 7.1 70.0 0.2 3.5 0.0 73.7 80.8 64.2 145.0 54.9 34.3 234.11978 11.8 67.2 0.2 3.0 0.0 70.4 82.2 39.4 121.6 52.7 48.7 223.01979 7.5 54.4 0.1 0.8 0.0 55.3 62.9 66.1 129.0 46.0 33.3 208.31980 15.4 62.0 0.6 2.2 0.0 64.7 80.1 52.4 132.5 63.6 34.4 230.51981 10.1 50.0 0.4 3.0 0.0 53.4 63.5 40.8 104.2 67.8 35.0 207.01982 4.1 50.2 0.1 3.0 0.0 53.3 57.4 52.1 109.4 73.5 43.2 226.11983 3.3 57.2 0.1 2.6 0.0 59.9 63.1 48.3 111.4 59.4 49.4 220.21984 5.9 44.6 0.0 1.6 0.0 46.2 52.2 51.7 103.8 71.1 42.7 217.61985 4.5 61.6 0.0 4.5 0.0 66.2 70.7 54.0 124.7 78.2 51.2 254.11986 1.9 92.0 0.1 10.2 0.0 102.2 104.2 46.3 150.5 65.4 50.1 266.11987 0.8 87.9 0.4 11.2 0.0 99.5 100.3 48.7 149.0 56.0 63.5 268.41988 1.1 66.0 0.4 1.2 0.0 67.6 68.7 51.2 119.9 65.8 72.0 257.71989 1.5 67.5 0.5 4.0 0.0 72.0 73.5 52.1 125.6 78.1 59.2 262.81990 4.7 86.1 0.3 4.3 0.0 90.8 95.5 67.2 162.6 84.3 62.5 309.51991 3.7 85.0 0.2 2.5 0.0 87.8 91.5 52.1 143.6 95.9 66.0 305.61992 5.5 74.5 0.1 10.3 0.1 84.9 90.4 68.0 158.4 99.0 58.7 316.21993 8.1 63.2 0.2 0.0 0.2 63.6 71.7 58.2 129.9 112.2 89.1 331.11994 29.4 61.5 0.3 7.3 0.1 69.2 98.5 47.8 146.3 132.2 95.7 374.21995 37.3 49.0 0.1 6.6 0.2 56.0 93.3 46.8 140.1 126.3 109.9 376.31996 51.4 36.7 0.1 5.4 0.2 42.4 93.7 39.2 132.9 121.5 120.9 375.31997 51.6 40.6 0.1 6.8 0.4 47.8 99.5 63.7 163.2 106.8 137.0 407.01998 35.2 35.8 0.1 * 1.1 37.0 72.1 81.1 153.3 109.8 138.9 402.01999 41.2 22.5 0.1 * 0.5 23.1 64.2 92.4 156.6 123.8 143.7 424.12000** 70.2 26.6 * * 0.8 27.3 97.5 92.1 189.6 100.0 126.5 416.12001** 42.8 32.3 * * 3.4 35.7 78.5 * * * * *1 Source: Table 3−Fuente: Tabla 32 Sources: published and unpublished data from the National Research Institute of Far Seas Fisheries (NRIFSF),
Shimizu, Japan, Institute of Oceanography, National Taiwan University, Taipei, Taiwan, Ministry of Agriculture,People’s Republic of China, and National Fisheries Research and Development Agency, Republic of Korea.
2 Fuentes: : datos publicados e inéditos del Instituto Nacional de Investigación de Pesquerías de Ultramar (NRIFSF) en Shimizu (Japón), el Instituto de Oceanografía de la Universidad Nacional de Taiwan en Taipei, Ministerio deAgricultura, República Popular de China, y la Agencia Nacional de Investigación y Desarrollo Pesquero de Corea.
3 Source: Column 10 - Column 8−Fuente: Columna 10 - Columna 84 Source: FAO data set for Fishstat+−Fuente: datos de FAO para Fishstat+5 Source: ICCAT data set for Fishstat+−Fuente: datos de CICAA para Fishstat+6 Source: IOTC data set for Fishstat+− Fuente: datos de CTOI para Fishstat+* not available−no disponible**preliminary−preliminares
ANNUAL REPORT 2001 83

84 TUNA COMMISSION
TABLE 7d. Annual retained catches of Pacific bluefin, in metric tons.TABLA 7d. Capturas retenidas anuales de aleta azul del Pacífico, en toneladas métricas.
Western Pacific nations1 Eastern Pacific nationsYear Surface2 Total
Surface Longline Subtotal Longline3 SubtotalCommercial Recreational
Naciones de Pacífico occidental1 Naciones de Pacífico orientalAño Superficie2 Total
Superficie Palangre Subtotal Palangre3 SubtotalComercial Deportiva
1970 7,505 1,123 8,628 3,966 15 3,981 12,6101971 8,673 757 9,430 8,348 6 8,354 17,7841972 7,951 724 8,675 13,334 12 13,346 22,0201973 8,798 1,158 9,956 10,743 44 10,787 20,7431974 14,763 3,533 18,296 5,617 47 5,664 23,9601975 10,770 1,558 12,328 9,582 27 9,609 21,9371976 9,186 520 9,706 10,645 17 10,662 20,3681977 12,617 712 13,329 5,473 15 5,488 18,8171978 21,285 1,049 22,334 5,398 4 5,402 27,7351979 25,311 1,223 26,534 6,112 9 6,121 32,6551980 18,372 1,170 19,542 2,939 6 2,945 22,4871981 29,576 975 30,551 1,126 6 1,132 31,6831982 24,095 1,056 25,151 3,021 7 3,028 28,1791983 18,046 864 18,910 1,037 21 1,058 19,9681984 10,562 831 11,393 801 31 832 12,2251985 11,985 706 12,691 3,929 55 3,984 16,6751986 14,496 319 14,815 4,920 7 4,927 19,7421987 13,314 711 14,025 942 21 963 14,9881988 7,331 349 7,680 1,250 4 1,254 8,9341989 9,099 645 9,744 1,076 70 1,146 10,8901990 6,294 585 6,879 975 40 1,015 7,8941991 14,084 627 14,711 113 57 170 14,8811992 10,221 1,037 11,258 1,088 93 9 1,190 12,4481993 7,818 1,328 9,146 527 114 45 686 9,8321994 10,964 1,697 12,661 972 24 24 1,020 13,6811995 22,768 1,104 23,872 718 166 27 911 24,7831996 10,119 1,934 12,053 8,381 30 25 8,436 20,4891997 14,757 3,197 17,954 2,575 90 25 2,690 20,6441998 7,357 3,170 10,527 1,908 213 54 2,175 12,7021999 16,863 4,244 21,107 2,463 397 89 2,949 24,0562000* 17,888 3,898 21,786 3,386 218 22 3,626 25,4122001* 995 2,429 3,424 1,006 303 7 1,316 4,7401 Sources: Report of the Second Meeting of the ISC [International Scientific Committee] Pacific Bluefin Tuna Working
Group of the Convention on the Conservation and Management of Highly Migratory Fish Stocks in the Western andCentral Pacific Ocean
1 Fuentes: Informe del Reunión Segundo del Grupo de Trabajo del ISC [Comité Científico Internacional] sobre el AtúnAleta Azul del Pacífico de la Convención sobre la Conservación y Ordenación de Poblaciones de Peces AltamenteMigratorios en el Océano Pacífico Occidental y Central
2 Source: 1970-1980 and 2001, IATTC data bases; 1981-2000, Report of the Second Meeting of the Working Group ofthe ISC
2 Fuentes: 1970-1980 y 2001, bases de datos de CIAT; 1981-2000, Informe del Reunión Segundo del Grupo de Trabajodel ISC
3 Sources: Report of the Second Meeting of the Working Group of the ISC and data bases of the IATTC and U.S. NMFS3 Fuentes: Informe del Reunión Segundo del Grupo de Trabajo del ISC y bases de datos de la CIAT y el NMFS de EE.UU.* preliminary−preliminares
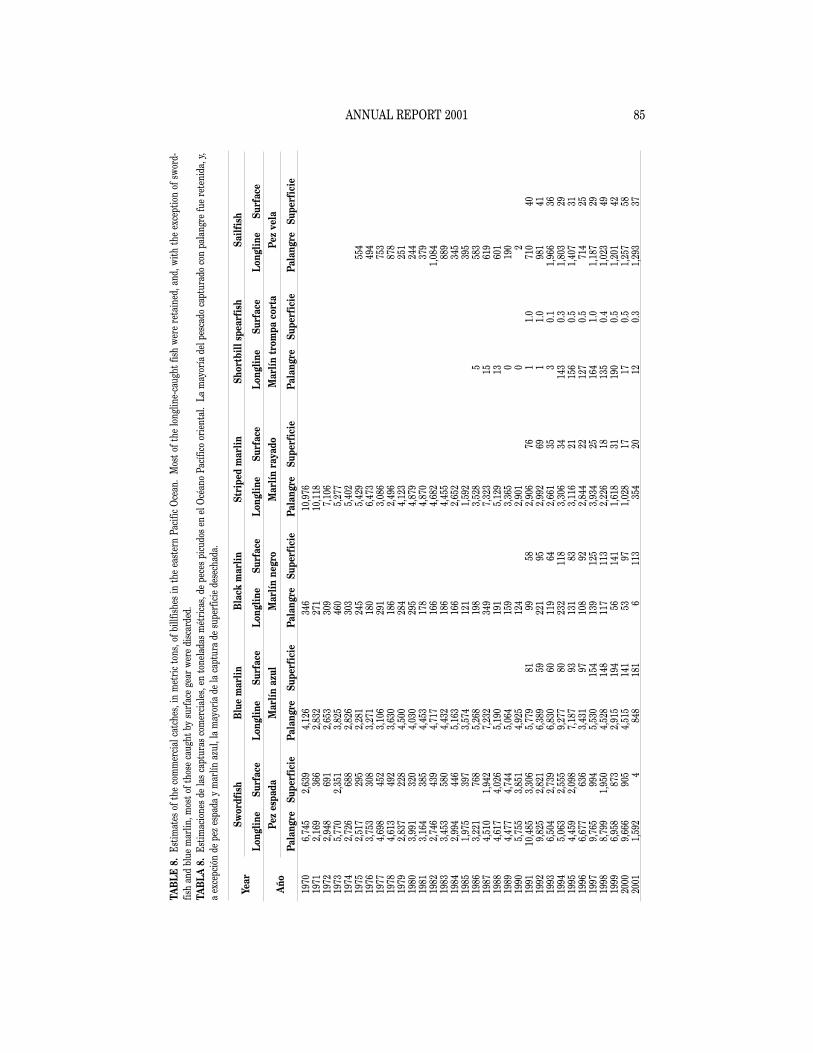
TAB
LE 8
.Es
timat
es o
f the
com
mer
cial
cat
ches
, in
met
ric
tons
, of b
illfis
hes
in th
e ea
ster
n Pa
cific
Oce
an.
Mos
t of t
he lo
nglin
e-ca
ught
fish
wer
e re
tain
ed, a
nd, w
ith th
e ex
cept
ion
of s
wor
d-fis
h an
d bl
ue m
arlin
, mos
t of t
hose
cau
ght b
y su
rfac
e ge
ar w
ere
disc
arde
d.TA
BLA
8.
Estim
acio
nes
de la
s ca
ptur
as c
omer
cial
es, e
n to
nela
das
mét
rica
s, de
pec
es p
icud
os e
n el
Océ
ano
Pací
fico
orie
ntal
. La
may
oría
del
pes
cado
cap
tura
do c
on p
alan
gre
fue
rete
nida
, y,
a ex
cepc
ión
de p
ez e
spad
a y
mar
lín a
zul,
la m
ayor
ía d
e la
cap
tura
de
supe
rfic
ie d
esec
hada
.
Swor
dfis
hB
lue
mar
linB
lack
mar
linSt
ripe
d m
arlin
Shor
tbill
spe
arfi
shSa
ilfis
hYe
arLo
nglin
eSu
rfac
eLo
nglin
eSu
rfac
eLo
nglin
eSu
rfac
eLo
nglin
eSu
rfac
eLo
nglin
eSu
rfac
eLo
nglin
eSu
rfac
ePe
z es
pada
Mar
lín a
zul
Mar
lín n
egro
Mar
lín r
ayad
oM
arlín
tro
mpa
cor
taPe
z ve
laA
ñoPa
lang
reSu
perf
icie
Pala
ngre
Supe
rfic
iePa
lang
reSu
perf
icie
Pala
ngre
Supe
rfic
iePa
lang
reSu
perf
icie
Pala
ngre
Supe
rfic
ie19
706,
745
2,63
94,
126
346
10,9
7619
712,
169
366
2,83
227
110
,118
1972
2,94
869
12,
653
309
7,10
619
735,
770
2,35
13,
825
460
5,27
719
742,
726
688
2,82
630
35,
402
1975
2,51
729
52,
281
245
5,42
955
419
763,
753
308
3,27
118
06,
473
494
1977
4,69
845
23,
106
291
3,08
675
319
784,
613
492
3,63
018
62,
496
878
1979
2,83
722
84,
500
284
4,12
325
119
803,
991
320
4,03
029
54,
879
244
1981
3,16
438
54,
453
178
4,87
037
919
822,
746
439
4,71
716
64,
682
1,08
419
833,
453
580
4,43
218
64,
455
889
1984
2,99
444
65,
163
166
2,65
234
519
851,
975
397
3,57
412
11,
592
395
1986
3,22
176
85,
268
198
3,52
85
583
1987
4,51
01,
942
7,23
234
97,
323
1561
919
884,
617
4,02
65,
190
191
5,12
913
601
1989
4,47
74,
744
5,06
415
93,
365
019
019
905,
755
3,85
14,
925
124
2,90
10
219
9110
,485
3,30
65,
779
8199
582,
906
761
1.0
710
4019
929,
825
2,82
16,
389
5922
195
2,99
269
11.
098
141
1993
6,50
42,
739
6,83
060
119
642,
661
353
0.1
1,96
636
1994
5,06
32,
555
9,27
780
232
118
3,30
634
143
0.3
1,80
329
1995
4,45
92,
098
7,18
793
131
833,
116
2115
60.
51,
407
3119
966,
677
636
3,43
197
108
922,
844
2212
70.
571
425
1997
9,76
599
45,
530
154
139
125
3,93
425
164
1.0
1,18
729
1998
8,79
91,
950
4,52
814
811
711
32,
226
1813
50.
41,
023
4919
996,
958
873
2,91
519
456
141
1,61
831
190
0.5
1,20
142
2000
9,66
690
54,
515
141
5397
1,02
817
170.
51,
257
5820
011,
592
484
818
16
113
354
2012
0.3
1,29
337
ANNUAL REPORT 2001 85

86 TUNA COMMISSION
TABLE 9a. World catches of the principal market species of tunas, in thousands of metric tons (from FAO, ICCAT, andIOTC data set for Fishstat+). Data for 1971-1990 are given in Table 9a of the IATTC Annual Report for 1999.TABLA 9a. Capturas mundiales de las principales especies comerciales de atunes, en miles de toneladas métricas (deFAO, ICCAT, y CTOI datos para Fishstat+). En la Tabla 9a del Informe Anual de la CIAT de 1999 se presentan datos de1971-1990.
1991 1992 1993 1994 1995 1996 1997 1998 1999 2000Pacific Ocean−−Océano Pacífico
Skipjack−Barrilete 1,258 1,009 1,009 1,063 1,185 1,153 1,172 1,427 1,426 1,422Yellowfin−Aleta amarilla 598 645 619 633 570 518 682 677 665 631Bigeye−Patudo 144 158 130 146 140 133 163 153 157 190Albacore−Albacora 95 114 96 114 103 110 134 132 149 120Pacific bluefin−Aleta azul del Pacífico 6 7 7 9 7 15 11 8 16 15Southern bluefin−Aleta azul del sur 2 5 5 4 3 2 2 2 3 2Total 2,102 1,938 1,866 1,968 2,009 1,931 2,165 2,397 2,415 2,379
Atlantic Ocean−−Océano AtlánticoSkipjack−Barrilete 214 161 192 176 162 150 144 148 166 139Yellowfin−Aleta amarilla 166 162 160 171 152 153 138 148 144 135Bigeye−Patudo 96 99 112 132 126 122 107 110 124 100Albacore−Albacora 56 70 72 71 68 60 59 59 67 69Northern bluefin−Aleta azul del norte 29 34 38 49 50 55 50 40 36 36Southern bluefin−Aleta azul del sur 1 1 2 1 2 1 0 1 1 2Total 563 527 577 599 559 542 498 506 538 482
Indian Ocean−−Océano IndicoSkipjack−Barrilete 243 268 284 320 309 284 298 313 404 393Yellowfin−Aleta amarilla 223 274 347 265 289 329 285 272 316 294Bigeye−Patudo 66 59 89 96 110 121 137 139 144 126Albacore−Albacora 29 20 18 23 23 26 29 39 40 41Southern bluefin−Aleta azul del sur 8 7 6 7 9 15 16 16 18 12Total 568 628 745 711 740 774 765 779 922 868
All oceans−−Todos océanosSkipjack−Barrilete 1,714 1,438 1,486 1,558 1,655 1,587 1,615 1,887 1,997 1,955Yellowfin−Aleta amarilla 987 1,081 1,127 1,068 1,011 1,000 1,106 1,097 1,125 1,060Bigeye−Patudo 306 316 331 374 376 375 407 402 424 416Albacore−Albacora 180 204 186 207 194 196 222 230 256 231Pacific bluefin−Aleta azul del Pacífico 6 7 7 9 7 15 11 8 16 15Northern bluefin−Aleta azul de norte 29 34 38 49 50 55 50 40 36 36Southern bluefin−Aleta azul del sur 11 12 13 11 14 18 18 19 21 16Total 3,233 3,093 3,188 3,277 3,309 3,247 3,428 3,683 3,875 3,729

TABLE 9b. World catches of the principal species of billfishes, in thousands of metric tons (from FAO, ICCAT, and IOTCdata set for Fishstat+). Data for 1971-1990 are given in Table 9b of the IATTC Annual Report for 1999.TABLA 9b. Captures mundiales de las especies principales de picudos, en miles de toneladas métricas (de FAO, ICCAT, yCTOI datos para Fishstat+). En la Tabla 9b del Informe Anual de la CIAT de 1999 se presentan datos de 1971-1990.
1991 1992 1993 1994 1995 1996 1997 1998 1999 2000Pacific Ocean−−Océano Pacífico
Swordfish−Pez espada 27 33 29 26 21 20 26 28 27 28Blue marlin−Marlín azul 20 19 18 23 22 19 17 18 18 18Black marlin−Marlín negro 3 4 2 3 1 1 1 2 2 1Striped marlin−Marlín rayado 10 11 11 11 10 8 8 9 7 6Indo-Pacific sailfish−Pez vela del Indopacifico 5 7 5 4 3 3 5 6 5 3 Unidentified billfishes−Picudos no identificados 8 10 10 8 13 13 13 20 21 12Total 73 82 75 74 69 65 70 83 80 68
Atlantic Ocean−−Océano AtlánticoSwordfish−Pez espada 41 44 46 51 51 45 46 40 41 41Blue marlin−Marlín azul 4 3 3 4 4 4 5 4 4 3White marlin−Marlín blanco 2 1 2 2 2 2 1 1 1 1Atlantic sailfish−Pez vela del Atlántico 2 3 4 2 2 3 2 2 2 2Unidentifed billfishes−Picudos no identificados 0 0 0 0 0 0 0 0 0 1Total 49 51 54 60 59 55 54 48 48 48
Indian Ocean−−Océano IndicoSwordfish−Pez espada 7 14 26 21 31 31 30 40 35 38Blue marlin−Marlín azul 8 8 7 10 4 6 8 9 8 7Black marlin−Marlín negro 1 2 3 1 1 1 1 1 2 1Striped marlin−Marlín rayado 3 2 6 4 5 5 4 4 3 3Indo-Pacific sailfish−Pez vela del Indopacifico 5 4 5 8 10 11 11 12 12 13Unidentified billfishes−Picudos no identificados 6 7 9 10 13 17 18 18 17 16Total 30 38 56 54 64 71 72 84 78 79
All oceans−−Todos océanosSwordfish−Pez espada 75 90 101 98 102 97 102 108 102 107Blue marlin−Marlín azul 32 30 28 36 30 29 29 31 30 28Black marlin−Marlín negro 4 6 6 3 2 3 2 4 4 2Striped marlin−Marlín rayado 13 13 17 15 15 13 12 14 11 9White marlin−Marlín blanco 2 1 2 2 2 2 1 1 1 1Indo-Pacific sailfish−Pez vela del Indopacifico 10 11 10 12 12 14 16 18 17 16Atlantic sailfish−Pez vela del Atlántico 2 3 4 2 2 3 2 2 2 2Unidentified billfishes−Picudos no identificados 14 17 19 18 26 30 31 38 39 30Total 151 171 186 188 192 190 196 215 205 195
ANNUAL REPORT 2001 87

88 TUNA COMMISSION
TABLE 9c. World catches of tunas and tuna-like fishes other than the principal market species of tunas and billfishes, inthousands of metric tons (from FAO, ICCAT, and IOTC data set for Fishstat+). “Others” includes wahoo, Acanthocybiumsolandri, blackfin tuna, Thunnus atlanticus, plain bonito, Orcynopsis unicolor, unidentified tunas, and unidentified tuna-like fishes. Data for 1971-1990 are given in Table 9c of the IATTC Annual Report for 1999.TABLA 9c. Capturas mundiales de atunes y especies afines aparte de las principales especies comerciales de atunes ypeces picudos, en miles de toneladas métricas (de datos de FAO, ICCAT, e IOTC para Fishstat+). “Otros” incluye peto(Acanthocybium solandri), atún aleta negra (Thunnus atlanticus), tasarte (Orcynopsis unicolor), y atunes y especies afinesno identificados. En la Tabla 9c del Informe Anual de la CIAT de 1999 se presentan datos de 1971-1990.
1991 1992 1993 1994 1995 1996 1997 1998 1999 2000Pacific Ocean−−Océano Pacífico
Scomberomorus spp. 367 289 291 336 374 417 488 676 724 670Euthynnus spp. 224 234 219 240 228 252 269 288 301 318Auxis spp. 147 188 167 172 145 133 169 154 212 170Thunnus tonggol 104 90 61 49 44 37 32 41 44 50Sarda spp. 27 37 38 38 35 24 19 7 3 1Others−Otros 109 124 106 108 149 149 157 218 173 196Total 979 962 882 942 975 1,011 1,135 1,385 1,457 1,405
Atlantic Ocean−−Océano AtlánticoScomberomorus spp. 41 37 41 38 38 45 46 26 26 22Euthynnus spp. 24 23 13 13 13 16 15 15 14 14Auxis spp. 18 10 8 12 11 18 17 14 14 12Sarda spp. 34 22 31 22 21 25 26 24 26 25Others−Otros 23 31 13 10 12 16 13 9 10 12Total 139 122 105 94 94 120 115 90 91 85
Indian Ocean−−Océano IndicoScomberomorus spp. 110 114 121 122 147 141 146 164 174 186Euthynnus spp. 41 49 49 45 64 58 67 65 68 72Auxis spp. 20 20 21 27 28 34 30 30 34 38Thunnus tonggol 40 33 52 69 72 63 64 62 62 79Sarda spp. 2 0 0 0 1 3 2 1 1 1Others−Otros 38 42 54 44 47 54 60 67 63 64Total 251 259 298 307 358 354 370 389 401 439
All oceans−−Todos océanosScomberomorus spp. 518 441 453 496 558 604 680 866 924 878Euthynnus spp. 289 306 280 298 305 325 351 368 383 403Auxis spp. 186 218 196 211 184 186 216 199 261 221Thunnus tonggol 144 124 113 118 116 100 96 103 106 128Sarda spp. 61 59 69 60 56 49 45 32 29 26Others−Otros 170 197 174 162 208 219 230 295 245 273Total 1,367 1,344 1,285 1,343 1,426 1,482 1,618 1,863 1,948 1,928

TABLE 10. Coverage of the bycatch data base. The sources of the data are described in the text. TABLA 10. Cobertura de la base de datos de capturas incidentales. En el texto se describen las fuentes de los datos.
SetsPercent coverage
Year Set type IATTC bycatch data Four tuna-dolphin((Col. 3/Col. 4) x 100)base data bases
LancesPorcentaje de
Año Tipo de lance Base de datos CIAT Cuatro bases de datos cobertura((Col. 3/Col. 4) x 100)sobre captura incidental atún-delfín
1993 Dolphin−Delfín 2,865 6,953 41.2Floating object−Objeto flotante 955 2,063 46.3Unassociated−No asociado 3,257 6,267 52.0Total 7,077 15,283 46.3
1994 Dolphin−Delfín 5,280 7,804 67.7Floating object−Objeto flotante 2,341 2,770 84.5Unassociated−No asociado 3,270 5,070 64.5Total 10,891 15,644 69.6
1995 Dolphin−Delfín 5,583 7,187 77.7Floating object−Objeto flotante 3,249 3,568 91.1Unassociated−No asociado 3,360 5,124 65.6Total 12,192 15,879 76.8
1996 Dolphin−Delfín 5,842 7,483 78.1Floating object−Objeto flotante 4,062 4,160 97.6Unassociated−No asociado 3,225 5,387 59.9Total 13,129 17,030 77.1
1997 Dolphin−Delfín 6,339 8,995 70.5Floating object−Objeto flotante 5,614 5,828 96.3Unassociated−No asociado 2,881 4,977 57.9Total 14,834 19,800 74.9
1998 Dolphin−Delfín 8,018 10,645 75.3Floating object−Objeto flotante 5,346 5,481 97.5Unassociated−No asociado 3,217 4,631 69.5Total 16,581 20,757 79.9
1999 Dolphin−Delfín 6,536 8,648 75.6Floating object−Objeto flotante 4,513 4,620 97.7Unassociated−No asociado 4,633 6,143 75.4Total 15,682 19,411 80.8
2000 Dolphin−Delfín 6,087 9,235 65.9Floating object−Objeto flotante 3,701 3,916 94.5Unassociated−No asociado 3,926 5,482 71.6Total 13,714 18,633 73.6
2001 Dolphin−Delfín 5,403 9,577 56.4Floating object−Objeto flotante 4,789 5,659 84.6Unassociated−No asociado 1,997 2,973 67.2Total 12,189 18,209 66.9
ANNUAL REPORT 2001 89

90 TUNA COMMISSION
TABLE 11a. Estimated discards and bycatches of tunas and bonito in the EPO on fishing trips with observers aboard,in metric tons. Equivalent data for 1993-1996 are given in Table 39 of the IATTC Annual Report for 1998.TABLA 11a. Descartes y capturas incidentales estimadas de atunes y bonitos en el OPO en viajes de pesca con obser-vador a bordo, en toneladas métricas. En la Tabla 39 del Informe Anual de la CIAT de 1998 se presentan datos equiva-lentes para 1993-1996.
Set typeYear Species
Dolphin Floating object Unassociated TotalTipo de lance
Año EspecieDelfín Objeto flotante No asociado Total
1997 Yellowfin−Aleta amarilla 620 4,594 417 5,631Skipjack−Barrilete 127 30,720 1,020 31,867Bigeye−Patudo 0 5,620 8 5,627Black skipjack−Barrilete negro 84 2,117 381 2,582Bullet−Melva 25 2,756 626 3,407Other tunas−Otros atunes - - 31 31
Bonito - 5 0 5Total 856 45,812 2,455 49,123
1998 Yellowfin−Aleta amarilla 709 3,203 806 4,718Skipjack−Barrilete 34 21,091 1,731 22,856Bigeye−Patudo 0 2,839 14 2,853Black skipjack−Barrilete negro 91 1,593 173 1,857Bullet−Melva 32 1,033 168 1,233Other tunas−Otros atunes - - 0 -Bonito - 2 3 5Total 866 29,760 2,894 33,520
1999 Yellowfin−Aleta amarilla 471 5,363 794 6,628Skipjack−Barrilete 125 23,321 3,367 26,813Bigeye−Patudo 0 5,158 8 5,166Black skipjack−Barrilete negro 2 3,049 361 3,412Bullet−Melva 29 2,594 473 3,096Other tunas−Otros atunes - - 541 541
Bonito - 0 - 0Total 628 39,485 5,058 45,170
2000 Yellowfin−Aleta amarilla 426 5,590 799 6,815Skipjack−Barrilete 16 20,568 5,779 26,364Bigeye−Patudo 0 5,572 52 5,624Black skipjack−Barrilete negro 155 1,675 55 1,885Bullet−Melva 21 1,290 185 1,496Other tunas−Otros atunes - 0 0 -Bonito - 0 - 0Total 618 34,695 6,870 42,183
2001 Yellowfin−Aleta amarilla 2,665 3,921 1,336 7,922Skipjack−Barrilete 364 12,841 312 13,517Bigeye−Patudo 0 1,250 12 1,262Black skipjack−Barrilete negro 17 1,174 70 1,261Bullet−Melva 0 725 41 766Other tunas−Otros atunes - - 41 41
Bonito - - - 0Total 3,046 19,911 1,775 24,732
1 bluefin−aleta azul

TABLE 11b. Estimated bycatches of billfishes in the EPO on fishing trips with observers aboard, in numbers of indi-viduals. Equivalent data for 1993-1996 are given in Table 40 of the IATTC Annual Report for 1998.TABLA 11b. Capturas incidentales estimadas de peces picudos en el OPO en viajes de pesca con observador a bordo, ennúmero de individuos. En la Tabla 40 del Informe Anual de la CIAT de 1998 se presentan datos equivalentes para 1993-1996.
Set typeYear Species
Dolphin Floating object Unassociated TotalTipo de lance
Año EspecieDelfín Objeto flotante No asociado Total
1997 Swordfish−Pez espada 14 16 21 51Blue marlin−Marlín azul 88 926 173 1,188Black marlin−Marlín negro 45 726 74 845Striped marlin−Marlín rayado 73 121 150 344Shortbill spearfish−Marlín trompa corta 7 12 0 19Sailfish−Pez vela 325 112 438 875Unidentified marlin−Marlín no identificado 6 54 8 68Unidentified billfish−Picudo no identificado 2 11 3 16Total 560 1,979 869 3,407
1998 Swordfish−Pez espada 11 3 11 25Blue marlin−Marlín azul 76 1,094 73 1,243Black marlin−Marlín negro 61 698 81 840Striped marlin−Marlín rayado 99 102 55 256Shortbill spearfish−Marlín trompa corta 1 12 1 14Sailfish−Pez vela 1,011 14 461 1,486Unidentified marlin−Marlín no identificado 13 54 9 76Unidentified billfish−Picudo no identificado 336 19 4 359Total 1,608 1,996 695 4,299
1999 Swordfish−Pez espada 21 5 19 44Blue marlin−Marlín azul 82 1,578 144 1,804Black marlin−Marlín negro 73 936 149 1,158Striped marlin−Marlín rayado 67 280 75 422Shortbill spearfish−Marlín trompa corta 4 13 6 23Sailfish−Pez vela 713 89 583 1,385Unidentified marlin−Marlín no identificado 13 114 20 148Unidentified billfish−Picudo no identificado 21 5 4 30Total 994 3,020 1,001 5,014
2000 Swordfish−Pez espada 19 3 22 45Blue marlin−Marlín azul 81 906 207 1,194Black marlin−Marlín negro 87 460 180 727Striped marlin−Marlín rayado 54 89 86 229Shortbill spearfish−Marlín trompa corta 13 10 6 30Sailfish−Pez vela 785 125 903 1,813Unidentified marlin−Marlín no identificado 17 23 9 50Unidentified billfish−Picudo no identificado 1 4 4 9Total 1,059 1,619 1,418 4,096
2001 Swordfish−Pez espada 18 2 18 38Blue marlin−Marlín azul 62 1,126 259 1,447Black marlin−Marlín negro 73 695 30 798Striped marlin−Marlín rayado 39 108 109 256Shortbill spearfish−Marlín trompa corta 2 11 6 19Sailfish−Pez vela 580 130 423 1,134Unidentified marlin−Marlín no identificado 10 90 10 111Unidentified billfish−Picudo no identificado 0 0 0 0Total 785 2,162 855 3,802
ANNUAL REPORT 2001 91

92 TUNA COMMISSION
TABLE 11c. Estimated bycatches of animals other than tunas and billfishes in the EPO on fishing trips with observersaboard, in numbers of individuals. Equivalent data for 1993 and 1994 are given in Table 41 of the IATTC Annual Reportfor 1998.TABLA 11c. Capturas incidentales estimadas de animales aparte de atunes y picudos en el OPO en viajes de pesca conobservador a bordo, en número de individuos. En la Tabla 41 del Informe Anual de la CIAT de 1998 se presentan datosequivalentes para 1993 y 1994.
Set typeYear Species
Dolphin Floating Un- Totalobject associated
Tipo de lanceAño Especie
Delfín Objeto No Totalflotante asociado
1995 Marine mammals−Mamíferos marinos 3,268 0 6 3,274Dorado 392 549,339 31,831 581,562Wahoo−Peto 83 242,542 282 242,907Rainbow runner−Salmón 7 8,634 12 8,653Yellowtail−Jurel 0 21,800 12,489 34,289Other large teleost fish−Otros peces teleósteos grandes 11 2,010 10,581 12,602Trigger fish−Peces ballesta 1,109 768,925 13,066 783,099Other small teleost fish−Otros peces teleósteos pequeños 38,580 1,966,743 41,634 2,046,957Sharks and rays−Tiburones y rayas 8,962 36,829 8,880 54,671Sea turtles−Tortugas marinas 18 100 34 152Unidentified fish−Peces no identificados 2 1,087 918 2,007Other fauna−Otra fauna 0 2 2 4
1996 Marine mammals−Mamíferos marinos 2,547 0 0 2,547Dorado 525 626,233 7,723 634,480Wahoo−peto 23 156,239 330 156,591Rainbow runner−Salmón 1 25,812 7,350 33,163Yellowtail−Jurel 0 17,194 98,344 115,537Other large teleost fish−Otros peces teleósteos grandes 12 7,649 126,653 134,314Trigger fish−Peces ballesta 1,498 374,124 5,465 381,087Other small teleost fish−Otros peces teleósteos pequeños 141,487 460,820 65,838 668,145Sharks and rays−tiburones y rayas 7,266 38,263 6,903 52,432Sea turtles−Tortugas marinas 13 98 24 135Unidentified fish−peces no identificados 4 1,402 17 1,423Other fauna−Otra fauna 9 1 94 104
1997 Marine mammals−Mamíferos marinos 2,981 20 4 3,005Mahi mahi−Dorado 64 470,768 6,178 477,010Wahoo−Peto 3,125 474,399 774 478,298Rainbow runner−Salmón 1 54,969 2,044 57,014Yellowtail−Jurel 9,136 118,636 4,275 132,046Other large teleost fish−Otros peces teleósteos grandes 68 28,467 14,684 43,219Trigger fish−Peces ballesta 321 725,714 752 726,788Other small teleost fish−Otros peces teleósteos pequeños 16,217 1,216,287 65,011 1,297,515Sharks and rays−Tiburones y rayas 3,813 61,828 10,965 76,607Sea turtles−Tortugas marinas 12 90 68 170Unidentified fish−Peces no identificados 0 5,725 1,381 7,106Other fauna−Otros animales 0 0 0 0

TABLE 11c. (continued)TABLA 11c. (continuación)
Set typeYear Species
Dolphin Floating Un- Totalobject associated
Tipo de lanceAño Especie
Delfín Objeto No Totalflotante asociado
1998 Marine mammals−Mamíferos marinos 1,837 0 40 1,877Dorado 225 346,268 4,774 351,267Wahoo−Peto 418 211,143 316 211,877Rainbow runner−Salmón 18 130,935 136 131,089Yellowtail−Jurel 8 116,555 5,038 121,601Other large teleost fish−Otros peces teleósteos grandes 44 75,095 27,796 102,935Trigger fish−Peces ballesta 2,352 2,011,658 5,652 2,019,662Other small teleost fish−Otros peces teleósteos pequeños 16,239 655,865 73,994 746,098Sharks and rays−Tiburones y rayas 7,129 58,615 5,488 71,232Sea turtles−Tortugas marinas 28 103 31 162Unidentified fish−Peces no identificados 87 2,950 50 3,087Other fauna−Otros animales 2 5 0 7
1999 Marine mammals-Mamíferos marinos 1,346 0 3 1,349Dorado 210 658,250 1,803 660,263Wahoo-Peto 35 304,433 268 304,736Rainbow runner-Salmón 3 136,234 202 136,439Yellowtail−Jurel 0 45,149 29,692 74,841Other large teleost fish−Otros peces teleósteos grandes 20 10,983 5,330 16,333Trigger fish−Peces ballesta 292 1,468,734 9,540 1,478,567Other small teleost fish−Otros peces teleósteos pequeños 5,944 549,074 9,654 564,672Sharks and rays−Tiburones y rayas 3,634 46,842 7,301 57,777Sea turtles−Tortugas marinas 17 128 27 172Unidentified fish−Peces no identificados 22 4,842 1,466 6,331Other fauna−Otros animales 5 0 136 141
2000 Marine mammals−Mamíferos marinos 1,607 1 28 1,636Dorado 673 558,170 18,583 577,426Wahoo−Peto 122 179,894 501 180,517Rainbow runner−Salmón 63 78,280 2,197 80,540Yellowtail−Jurel 10 14,527 11,236 25,773Other large teleost fish−Otros peces teleósteos grandes 24 6,019 3,637 9,680Trigger fish−Peces ballesta 32,140 405,913 699 438,752Other small teleost fish−Otros peces teleósteos pequeños 20,558 440,903 26,757 488,218Sharks and rays−Tiburones y rayas 2,085 28,912 8,093 39,091Sea turtles−Tortugas marinas 17 72 41 130Unidentified fish−Peces no identificados 2 551 143 695Other fauna−Otra fauna 0 0 0 0
2001 Marine mammals−Mamíferos marinos 2,075 0 0 2,075Dorado 571 705,019 10,988 716,578Wahoo−Peto 52 456,980 969 458,001Rainbow runner−Salmón 4 81,838 170 82,012Yellowtail−Jurel 45 29,444 54 29,543Other large teleost fish−Otros peces teleósteos grandes 12 19,187 8,743 27,942Trigger fish−Peces ballesta 0 326,506 3,077 329,583Other small teleost fish−Otros peces teleósteos pequeños 580 187,416 25,123 213,119Sharks and rays−Tiburones y rayas 6,075 25,488 3,561 35,123Sea turtles−Tortugas marinas 16 88 33 137Unidentified fish−Peces no identificados 8 429 0 437Other fauna−Otra fauna 0 0 0 0
ANNUAL REPORT 2001 93

94 TUNA COMMISSION
TABLE 12. Sampling coverage of the IATTC and national programs during 2001 of trips by vessels with capacitiesgreater than 363 metric tons.TABLA 12. Cobertura de muestreo del los programas de la CIAT y nacionales en 2001 de viajes de buques con capacidadmás que 363 toneladas métricas.
Number of Trips sampled by program Percent National fleet
trips IATTC National Total sampledNúmero de Viajes muestreados por programa Porcentaje
Flota nacional viajes CIAT Nacional Total muestreado
Belize−Belice 5 5 - 5 100.0Bolivia 25 121 22 14 56.0Colombia 25 25 - 25 100.0Ecuador 236 176 60 236 100.0España−Spain 34 34 - 34 100.0Guatemala 27 27 - 27 100.0Honduras 12 12 - 12 100.0México 169 82 87 169 100.0Nicaragua 5 5 - 5 100.0Panamá 22 22 - 22 100.0El Salvador 10 10 - 10 100.0USA−EE.UU. 18 18 - 18 100.0Venezuela 145 72 73 145 100.0Vanuatu 30 29 - 29 96.7Undocumented 3 1 - 1 33.3Total 7663 5304 222 7223 98.21 Does not include a partially-sampled trip−No incluye un viaje parcialmente muestreado2 Sampled by the Ecuadorian national observer program (PROBECUADOR)−Muestrado por el programa nacional de
observadores de Ecuador (PROBECUADOR)3 Includes 54 trips that began in late 2000 and ended in 2001−Incluye 54 viajes iniciados a fines de 2000 y terminados
en 20014 Includes 1 research trip−Incluye 1 viaje de investigación

TAB
LE 1
3. O
cean
ogra
phic
and
met
eoro
logi
cal d
ata
for
the
Paci
fic O
cean
, 200
1. T
he v
alue
s in
pare
nthe
ses a
re a
nom
alie
s.TA
BLA
13.
Dat
os o
cean
ográ
ficos
y m
eteo
roló
gico
s del
Océ
ano
Pací
fico,
200
1. L
os v
alor
es e
n pa
rént
esis
son
anom
alía
s.
Mon
th−− M
es1
23
45
6SS
T−TS
M, 0
°-10°
S, 8
0°-9
0°W
(°C)
23.8
(-0.
5)25
.8 (0
.1)
27.4
(1.3
)26
.4 (1
.3)
23.8
(-0.
1)21
.9 (-
0.7)
SST−
TSM
, 5°N
-5°S
, 90°
-150
°W (°
C)25
.0 (-
0.5)
26.1
(-0.
2)27
.2 (0
.3)
27.5
(0.3
)26
.9 (0
.1)
26.3
(0.1
)SS
T−TS
M, 5
°N-5
°S, 1
20°-1
70°W
(°C)
25.7
(-0.
7)26
.1 (-
0.5)
26.8
(-0.
3)27
.5 (0
.0)
27.6
(0.0
)27
.7 (0
.2)
SST−
TSM
, 5°N
-5°S
, 150
W°-1
60°E
(°C)
27.5
(-0.
6)27
.3 (-
0.7)
27.6
(-0.
5)28
.2 (-
0.2)
28.6
(0.0
)28
.8 (0
.2)
Ther
moc
line
dept
h−Pr
ofun
dida
d de
la te
rmoc
lina,
0°,
80°W
(m)
3025
2525
2535
Ther
moc
line
dept
h−Pr
ofun
dida
d de
la te
rmoc
lina,
0°,
110°
W (m
)60
5050
2540
50Th
erm
oclin
e de
pth−
Prof
undi
dad
de la
term
oclin
a, 0
°, 15
0°W
(m)
150
140
110
150
140
130
Ther
moc
line
dept
h−Pr
ofun
dida
d de
la te
rmoc
lina,
0°,
180°
W (m
)17
017
016
017
015
016
0Se
a le
vel−
Niv
el d
el m
ar, B
altr
a, E
cuad
or (c
m)
174.
5 (-6
.4)
188.
3 (6
.1)
184.
9 (3
.1)
183.
8 (1
.1)
182.
0 (0
.7)
178.
4 (-1
.0)
Sea
leve
l−N
ivel
del
mar
, La
Libe
rtad
, Ecu
ador
(cm
)22
9.1
(-1.6
)24
0.8
(9.1
)-
224.
6 (-6
.2)
222.
3 (1
0.2)
-Se
a le
vel−
Niv
el d
el m
ar, C
alla
o, P
erú
(cm
)10
2.5
(-9.5
)11
2.2
(-1.0
)10
9.8
(-4.9
)11
1.4
(-3.1
)10
8.2
(-5.1
)11
0.1
(-0.1
)SO
I−IO
S1.
11.
50.
5-0
.1-0
.8-0
.1SO
I*−I
OS*
0.20
2.44
1.31
2.83
2.19
4.40
NO
I*−I
ON
*1.
052.
210.
912.
15-0
.36
1.35
Mon
th−− M
es7
89
1011
12SS
T−TS
M, 0
°-10°
S, 8
0°-9
0°W
(°C)
21.0
(-0.
8)20
.0 (-
0.8)
19.2
(-1.
2)19
.5 (-
1.4)
20.5
(-1.
2)21
.8 (-
1.1)
SST−
TSM
, 5°N
-5°S
, 90°
-150
°W (°
C)25
.4 (-
0.2)
24.7
(-0.
3)24
.3 (-
0.6)
24.5
(-0.
5)24
.4 (-
0.6)
24.6
(-0.
5)SS
T−TS
M, 5
°N-5
°S, 1
20°-1
70°W
(°C)
27.3
(0.2
26.9
(0.2
)25
.6 (-
0.1)
26.6
(0.0
)26
.5 (-
0.1)
26.2
(-0.
3)SS
T−TS
M, 5
°N-5
°S, 1
50W
°-160
°E (°
C)29
.1 (0
.5)
28.9
(0.5
)29
.1 (0
.6)
29.0
(0.6
)29
.0 (0
.6)
28.6
(0.3
) Th
erm
oclin
e de
pth−
Prof
undi
dad
de la
term
oclin
a, 0
°, 80
°W (m
)40
4040
4040
40Th
erm
oclin
e de
pth−
Prof
undi
dad
de la
term
oclin
a, 0
°, 11
0°W
(m)
5060
5060
7070
Ther
moc
line
dept
h−Pr
ofun
dida
d de
la te
rmoc
lina,
0°,
150°
W (m
)13
014
015
014
016
016
0Th
erm
oclin
e de
pth−
Prof
undi
dad
de la
term
oclin
a, 0
°, 18
0°W
(m)
180
150
180
180
170
180
Sea
leve
l−N
ivel
del
mar
, Bal
tra,
Ecu
ador
(cm
)17
5.3
(-5.2
)17
3.8
(-3.9
)17
2.6
(-4.7
)17
4.9
(-2.3
)17
4.5
(-4.4
)17
8.7
(-1.1
)Se
a le
vel−
Niv
el d
el m
ar, L
a Li
bert
ad, E
cuad
or (c
m)
219.
8 (-1
0.5)
215.
0 (-1
2.6)
220.
7 (-7
.2)
232.
1 (2
.6)
229.
8 (0
.2)
-Se
a le
vel−
Niv
el d
el m
ar, C
alla
o, P
erú
(cm
)10
3.7
(-6.4
)10
1.1
(-6.5
)93
.2 (-
12.8
)10
9.8
(4.2
)98
.6 (-
8.3)
103.
4 (-5
.2)
SOI−
IOS
-0.4
-1.0
0.2
-0.4
0.7
-1.2
SOI*
−IO
S*-4
.35
-1.5
63.
14-2
.28
3.16
0.79
NO
I*−I
ON
*0.
610.
01-0
.72
0.73
-2.9
8-0
.80
ANNUAL REPORT 2001 95

96 TUNA COMMISSION
TABLE 14. Preliminary estimates of mortalities of dolphins in 2001, estimates of population abundance pooled for 1986-1990 (from Report of the International Whaling Commission, 43: 477-493), and estimates of relative mortality (withapproximate 95-percent confidence intervals), by stock. All the data for 2001 are preliminary.TABLA 14. Mortalidades incidentales de delfines en 2001, estimaciones de abundancia de poblaciones agrupadas para1986-1990 (del Informe de la Comisión Ballenera Internacional, 43: 477-493), y estimaciones de abundancia relativa (conintervalos de confianza de 95% aproximados), por stock. Todos los datos de 2001 son preliminares.
Incidental Population Relative mortality (%)mortality abundance
StockMortalidad Abundancia de Mortalidad relativa (%)incidental la población
Offshore spotted−Manchado de altamarNortheastern−Nororiental 588 730,900 0.08 (0.061, 0.101)Western/southern−Occidental y sureño 311 1,298,400 0.024 (0.019, 0.033)
Spinner dolphin−TornilloEastern−Oriental 469 631,800 0.08 (0.046, 0.112)Whitebelly−Panza blanca 372 1,019,300 0.04 (0.023, 0.048)
Common dolphin−ComúnNorthern−Norteño 94 476,300 0.02 (0.011, 0.042)Central 203 406,100 0.05 (0.026, 0.098)Southern−Sureño 46 2,210,900 <0.01 (0.001, 0.003)
Other dolphins−Otros delfines1 46 2,802,300 <0.01 (0.001, 0.002)Total 2,129 9,576,000 0.02 (0.019, 0.025)1 “Other dolphins” includes the following species and stocks, whose observed mortalities were as follows: striped dolphins
(Stenella coeruleoalba), 3; bottlenose dolphins (Tursiops truncatus), 1; and unidentified dolphins, 40.1 “Otros delfines” incluye las siguientes especies y stocks, con las mortalidades observadas correspondientes: delfín lis
tado (Stenella coeruleoalba), 3; tonina (Tursiops truncatus), 1; y delfines no identificados, 40.

Table 15a. Annual estimates of dolphin mortality, by species and stock. All the data for 2001 are preliminary. The esti-mates for 1979-1992 are based on a mortality-per-set ratio. The estimates for 1993-1994 are based on the sums of theIATTC species and stock tallies and the PNAAPD total dolphin mortalities, prorated to species and stock. The mortali-ties for 1995-2001 represent the sums of the observed species and stock tallies recorded by the IATTC, PNAAPD, PNOV,and PROBECUADOR programs. The standard errors for 1979-1994 are shown in Table 15b. The sums of the estimatedmortalities for the northeastern and western-southern stocks of offshore spotted dolphins do not necessarily equal thosefor the previous stocks of northern and southern offshore spotted dolphins because the estimates for the two stock groupsare based on different areal strata, and the mortalities per set and the total numbers of sets vary spatially.TABLA 15a. Estimaciones anuales de la mortalidad de delfines, por especie y stock. Todos los datos para 2001 son pre-liminares. Las estimaciones para 1979-1992 se basan en una razón de mortalidad por lance. Las estimaciones para 1993-1994 se basan en las sumas de las mortalidades por especie y stock registradas por la CIAT y las mortalidades totalesregistradas por el PNAAPD, prorrateadas a especies y stocks. Las mortalidades para 1995-2001 son las sumas de las mor-talidades por especie y stock registradas por las programas de la CIAT, PNAAPD, PNOV, y PROBECUADOR. En la Tabla15b se detallan los errores estándar para 1979-1994. Las sumas de las mortalidades estimadas para los stocks nororientaly occidental y sureño del delfín manchado de altamar no equivalen necesariamente a las sumas de aquéllas para losantiguos stocks de delfín manchado de altamar norteño y sureño porque las estimaciones para los dos grupos de stocks sebasan en estratos espaciales diferentes, y las mortalidades por lance y el número total de lances varían espacialmente.
Offshore spotted1 Spinner Common OthersYearNorth- Western- Eastern White- Northern Central Southern Totaleastern southern belly
Manchado de altamar1 Tornillo Común OtrosAñoNor- Occidental Oriental Panza Norteño Central Sureño Total
oriental y sureño blanca1979 4,828 6,254 1,460 1,312 4,161 2,342 94 880 21,3311980 6,468 11,200 1,108 8,132 1,060 963 188 633 29,7521981 8,096 12,512 2,261 6,412 2,629 372 348 367 32,9971982 9,254 9,869 2,606 3,716 989 487 28 1,347 28,2961983 2,430 4,587 745 4,337 845 191 0 353 13,4881984 7,836 10,018 6,033 7,132 0 7,403 6 156 38,5841985 25,975 8,089 8,853 6,979 0 6,839 304 1,777 58,8161986 52,035 20,074 19,526 11,042 13,289 10,884 134 5,185 132,1691987 35,366 19,298 10,358 6,026 8,216 9,659 6,759 3,200 98,8821988 26,625 13,916 18,793 3,545 4,829 7,128 4,219 2,074 81,1291989 28,898 28,530 15,245 8,302 1,066 12,711 576 3,123 98,4511990 22,616 12,578 5,378 6,952 704 4,053 272 1,321 53,8741991 9,005 4,821 5,879 2,974 161 3,182 115 990 27,1271992 4,657 1,874 2,794 2,044 1,773 1,815 64 518 15,5391993 1,139 757 821 412 81 230 0 161 3,6011994 935 1,226 743 619 101 151 0 321 4,0961995 952 859 654 445 9 192 0 163 3,2741996 818 545 450 447 77 51 30 129 2,5471997 721 1,044 391 498 9 114 58 170 3,0051998 298 341 422 249 261 172 33 101 1,8771999 358 253 363 192 85 34 1 62 1,3482000 295 435 275 262 54 223 10 82 1,6362001 588 311 469 372 94 203 46 46 2,1291 The estimates for offshore spotted dolphins include mortalities of coastal spotted dolphins.1 Las estimaciones de delfines manchados de altamar incluyen mortalidades de delfines manchados costeros.
ANNUAL REPORT 2001 97

98 TUNA COMMISSION
TABLE 15b. Standard errors of annual estimates of dolphin species and stock mortality for 1979-1994. There are nostandard errors for 1995-2000 because the coverage was at or nearly at 100 percent during those years (Table 12).Standard errors for 2001 will be calculated after the logbooks for the unobserved trips become available.TABLA 15b. Errores estándar de las estimaciones anuales de la mortalidad de delfines por especie y stock para 1979-1994. No hay errores estándar para 1995-2000 porque la cobertura fue de 100%, o casi, en esos años (Tabla 12). Loserrores estándar para 2001 serán calculados una vez se disponga de las bitácoras de los viajes sin observador.
Offshore spotted Spinner CommonYear OthersNortheastern Western-Southern Eastern Whitebelly Northern Central Southern
Manchado de altamar Tornillo ComúnAño OtrosNororiental Occidental y sureño Oriental Panza blanca Norteño Central Sureño
1979 817 1,229 276 255 1,432 560 115 2041980 962 2,430 187 3,239 438 567 140 2171981 1,508 2,629 616 1,477 645 167 230 761982 1,529 1,146 692 831 495 168 16 5121983 659 928 284 1,043 349 87 - 1711984 1,493 2,614 2,421 3,773 - 5,093 3 721985 3,210 951 1,362 1,882 - 2,776 247 5701986 8,134 2,187 3,404 2,454 5,107 3,062 111 1,7221987 4,272 2,899 1,199 1,589 4,954 2,507 3,323 1,1401988 2,744 1,741 1,749 668 1,020 1,224 1,354 3991989 3,108 2,675 1,674 883 325 4,168 295 4301990 2,575 1,015 949 640 192 1,223 95 4051991 956 454 771 598 57 442 30 1821992 321 288 168 297 329 157 8 951993 89 52 98 33 27 - - 291994 69 55 84 41 35 8 - 20

TAB
LE 1
6. P
erce
ntag
es o
f set
s with
no
dolp
hin
mor
talit
ies,
with
maj
or g
ear m
alfu
nctio
ns, w
ith n
et co
llaps
es, w
ith n
et ca
nopi
es, a
vera
ge ti
mes
of b
ackd
own
(in m
inut
es),
and
aver
age n
umbe
rof
live
dol
phin
s lef
t in
the
net a
t the
end
of b
ackd
own.
TA
BLA
16.
Por
cent
ajes
de
lanc
es s
in m
orta
lidad
de
delfi
nes,
con
aver
ías
may
ores
, con
col
apso
de
la r
ed, c
on a
bulta
mie
nto
de la
red
, dur
ació
n m
edia
del
ret
roce
so (e
n m
inut
os),
y nú
mer
om
edio
de
delfi
nes e
n la
red
des
pués
del
ret
roce
so.
Aver
age
Aver
age
num
ber
Sets
wit
h ze
roSe
ts w
ith
maj
orSe
ts w
ith
net
Sets
wit
h ne
tdu
rati
on o
fof
live
dol
phin
sYe
arm
orta
lity
mal
func
tion
s co
llaps
eca
nopy
back
dow
n le
ft in
net
aft
er(%
)(%
)(%
)(%
)(m
inut
es)
back
dow
n
Lanc
es c
on
Núm
ero
med
io d
e La
nces
sin
Lanc
es c
onLa
nces
con
Dur
ació
n m
edia
abul
tam
ient
ode
lfin
es v
ivos
en
laA
ñom
orta
lidad
aver
ías
may
ores
cola
pso
de la
red
del r
etro
ceso
de la
red
red
desp
ués
(%)
(%)
(%)
(min
utos
)(%
)de
l ret
roce
so
1986
38.1
9.5
29.0
22.2
15.3
6.0
1987
46.1
10.9
32.9
18.9
14.6
4.4
1988
45.1
11.6
31.6
22.7
14.3
5.5
1989
44.9
10.3
29.7
18.3
15.1
5.0
1990
54.2
9.8
30.1
16.7
14.3
2.4
1991
61.9
10.6
25.2
13.2
14.2
1.6
1992
73.4
8.9
22.0
7.3
13.0
1.3
1993
84.3
9.4
12.9
5.7
13.2
0.7
1994
83.4
8.2
10.9
6.5
15.1
0.3
1995
85.0
7.7
10.3
6.0
14.0
0.4
1996
87.6
7.1
7.3
4.9
13.6
0.2
1997
87.7
6.6
6.1
4.6
14.3
0.2
1998
90.3
6.3
4.9
3.7
13.2
0.2
1999
91.0
6.6
5.9
4.6
14.0
0.1
2000
90.8
5.6
4.3
5.0
14.9
0.2
2001
91.6
6.5
3.9
4.6
15.6
0.1
ANNUAL REPORT 2001 99

100 TUNA COMMISION

INFORME ANUAL DE LACOMISION INTERAMERICANA DEL ATUN TROPICAL, 2001
INTRODUCCION
La Comisión Interamericana del Atún Tropical (CIAT) funciona bajo la autoridad y direc-ción de una convención suscrita originalmente por Costa Rica y los Estados Unidos de América.La convención, vigente desde 1950, está abierta a la afiliación de cualquier país cuyos ciudadanospesquen atunes tropicales y especies afines en el Océano Pacífico oriental (OPO). Bajo esta estip-ulación, la República de Panamá se afilió en 1953, Ecuador en 1961, México en 1964, Canadá en1968, Japón en 1970, Francia y Nicaragua en 1973, Vanuatu en 1990, Venezuela en 1992, ElSalvador en 1997, y Guatemala en 2000. Canadá se retiró de la CIAT en 1984.
La CIAT cumple su mandato mediante dos programas, el Programa Atún-Picudo y elPrograma Atún-Delfín.
Las responsabilidades principales del Programa Atún-Picudo detalladas en la Convenciónde la CIAT son (1) estudiar la biología de los atunes y especies afines en el OPO para evaluar losefectos de la pesca y los factores naturales sobre su abundancia, y (2) recomendar las medidas deconservación apropiadas para que los stocks de peces puedan mantenerse a niveles que permitanlas capturas máximas sostenibles. Posteriormente fue asignado la responsabilidad de reunirinformación sobre el cumplimiento de las resoluciones de la Comisión.
En 1976 se ampliaron las responsabilidades de la CIAT para abarcar los problemas oca-sionados por la mortalidad incidental en las redes de cerco de delfines asociados con atunes aletaamarilla en el OPO. La Comisión acordó trabajar para mantener la producción atunera a un altonivel y al mismo tiempo mantener a los stocks de delfines a, o por encima de, niveles que garan-tizaran su supervivencia a perpetuidad, haciendo todos los esfuerzos razonablemente posibles porevitar la muerte innecesaria o por descuido de delfines (Actas de la 33ª reunión de la CIAT; página9). El resultado fue la creación del Programa Atún-Delfín de la CIAT, cuyas responsabilidadesprincipales son (1) dar seguimiento a la abundancia de los delfines y su mortalidad incidental a lapesca con red de cerco en el OPO, (2) estudiar las causas de la mortalidad de delfines en las faenasde pesca y promover el uso de técnicas y aparejos de pesca que reduzcan dicha mortalidad almínimo posible, (3) estudiar los efectos de las distintas modalidades de pesca sobre las pobla-ciones de peces y otros animales del ecosistema pelágico, y (4) proporcionar la secretaría para elPrograma Internacional para la Conservación de los Delfines, descrito a continuación.
El 17 de junio de 1992 se adoptó el Acuerdo para la Conservación de Delfines (“el Acuerdode La Jolla de 1992”), mediante el cual se creó el Programa Internacional para la Conservación deDelfines (PICD). El objetivo principal del Acuerdo fue reducir la mortalidad de delfines en la pes-quería cerquera sin perjudicar los recursos atuneros de la región y las pesquerías que dependende los mismos. El 21 de mayo de 1998 se firmó el Acuerdo sobre el Programa Internacional parala Conservación de los Delfines (APICD), que amplía y formaliza las disposiciones del Acuerdo deLa Jolla, y el 15 de febrero de 1999 entró en vigor. Las Partes de este Acuerdo se comprometierona “asegurar la sostenibilidad de las poblaciones de atún en el Océano Pacífico Oriental y a reducirprogresivamente la mortalidad incidental de delfines en la pesquería de atún del Océano PacíficoOriental a niveles cercanos a cero; a evitar, reducir y minimizar la captura incidental y losdescartes de atunes juveniles y la captura incidental de las especies no objetivo, considerando lainterrelación entre especies en el ecosistema.”
Para llevar a cabo estas misiones, la CIAT realiza una amplia investigación en el mar, en
INFORME ANUAL 2001 101

102 COMISION DEL ATUN
los puertos donde se desembarca el atún, y en sus laboratorios. Estos estudios son llevados a cabopor un equipo internacional permanente de investigadores y técnicos (Anexo 1), seleccionados porel Director, quien responde directamente ante la Comisión.
El programa científico se encuentra en su 51º año. Los resultados de las investigacionesdel personal de la CIAT son publicados en la serie de Boletines e Informes de Evaluación de Stocksde la CIAT en inglés y español, los dos idiomas oficiales, en su serie de Informes Especiales eInformes de Datos, y en libros, revistas científicas externas, y revistas comerciales. En unInforme Anual, asimismo bilingüe, se resumen las actividades realizadas en el año en cuestión.
REUNIONES
Se pueden obtener los documentos, actas o informes de la mayoría de las reuniones de laCIAT y el APICD descritas a continuación en el sitio de internet de la CIAT, www.iattc.org.
68ª REUNION DE LA CIAT
La 68ª reunión de la CIAT fue celebrada en San Salvador (El Salvador) del 19 al 21 de juniode 2001. La Comisión acordó programas de conservación para el aleta amarilla y patudo en 2001,adoptó un esquema de contribuciones financieras para el año fiscal 2001-2002, acordó establecerun grupo de trabajo conjunto con las Partes del APICD para tratar la cuestión de la pesca porbuques de naciones no Partes, y acordó extender la prohibición de los descartes de atunes porbuques cerqueros. Fueron nombrados a la presidencia de la CIAT y sus varios grupos de trabajolos siguientes:
CIAT: Dr. Jerónimo Ramos Saenz (México)Grupo de Trabajo Permanente sobre Capacidad de la Flota: Lic. Mario González Recinos
(El Salvador)Grupo de Trabajo sobre la Convención de la CIAT: Embajador Jean-François Pulvenis(Venezuela)Grupo de Trabajo sobre Cumplimiento: Lic. Mara Murillo Correa (México)Grupo de Trabajo sobre Captura Incidental: Ing. Luis Torres Navarrete (Ecuador)Grupo de Trabajo sobre Financiamiento: Sr. Svein Fougner (Estados Unidos)
REUNIONES DE GRUPOS DE TRABAJO DE LA CIAT
Durante 2001 tuvieron lugar las siguientes reuniones de grupos de trabajo de la CIAT:
Grupo N° Sede FechasGrupo de Trabajo sobre Financiamiento 3 La Jolla (EE.UU.) 31 Ene-2 Feb
4 San Salvador (El Salvador) 18 Jun5 La Jolla (EE.UU.) 29-31 Ago
Grupo de Trabajo sobre la Convención 6 San José de Costa Rica 16-20 Abrde la CIAT 7 La Jolla (EE.UU.) 3-7 SepGrupo de Trabajo Científico 2 La Jolla (EE.UU.) 30 Abr-4 MayoReunión para cotejar información La Jolla (EE.UU.) 7-8 Mayosobre el pez espada y evaluar los stocks de pez espada en el Océano Pacífico oriental Grupo de Trabajo Permanente sobre 2 San Salvador (El Salvador) 16 JunCumplimiento

REUNIONES DE LAS PARTES DEL ACUERDO SOBRE EL PROGRAMA INTERNA-CIONAL PARA LA CONSERVACION DE LOS DELFINES (APICD)
La quinta reunión de las Partes del APICD fue celebrada en San Salvador (El Salvador) del15 al 20 de junio de 2001. El tema principal fue el establecimiento de un sistema para la certifi-cación de atún dolphin safe, y las Partes adoptaron la Resolución para establecer procedimientospara la certificación de atún AIDCP Dolphin-Safe.
La sexta reunión de las Partes del APICD tuvo lugar en Cartagena (Colombia) el 29 deoctubre de 2001. Los temas abarcados incluyeron propuestas de enmienda del Anexo IV delAPICD, límites anuales de mortalidad de delfines por población, el establecimiento de un Grupode Trabajo Conjunto CIAT-APICD sobre la pesca por no Partes, y solicitudes extemporáneas deLímites de Mortalidad de Delfines.
REUNIONES DE GRUPOS DE TRABAJO DEL APICD
Durante 2001 tuvieron lugar las siguientes reuniones de grupos de trabajo del APICD:
Grupo N° Sede FechasPanel Internacional de Revisión 26 La Jolla (EE.UU.) 29-30 Ene
27 San Salvador (El Salvador) 13-14 Jun28 Cartagena (Colombia) 25-26 Oct
Grupo de Trabajo Permanente sobre el 6 San José de Costa Rica 23-24 AbrSeguimiento del Atún 7 San Salvador (El Salvador) 11-12 Jun
8 Cartagena (Colombia) 27 Oct
REUNIONES DE PROYECTOS CONJUNTOS RELACIONADOS CON EL LABORA-TORIO DE ACHOTINES DE LA CIAT
Proyecto conjunto OFCF-Panamá-CIAT
El 23 y 24 de enero se celebró en el Laboratorio de Achotines la reunión final del proyectoconjunto OFCF-Panamá-CIAT, iniciado en 1993. Se analizaron los logros del proyecto, y se dis-cutieron planes para la continuación de la investigación de los atunes y de otras especies locales.
Proyecto conjunto Universidad de Miami-CIAT
Miembros del personal de la CIAT se reunieron con representantes del Centro paraPesquerías Sostenibles y Programa de Acuicultura de la Universidad de Miami el 28 y 29 denoviembre de en Miami, Florida (EE.UU.). El 29 de noviembre se firmó un Memorándum deEntendimiento sobre un programa conjunto de investigación en el Laboratorio de Achotines.
ADMINISTRACION
PRESUPUESTO
En su 63ª reunión, celebrada del 8 al 10 de junio de 1999 en Guayaquil (Ecuador), laComisión aprobó unánimemente el presupuesto de US$ 4.785.849 presentado por el Directorpara el año fiscal 2000-2001. Sin embargo, la cantidad aportada por los estados miembros endicho año fue US$ 4.617.997, o US$ 167.852 menos que la suma recomendada y aprobada parael presupuesto regular. Como consecuencia se tuvo que limitar algunos proyectos programadosAdemás de su presupuesto regular, durante el año fiscal 2000-2001 la CIAT recibió US$ 1.316.640
INFORME ANUAL 2001 103

de armadores de barcos para sufragar parte de los costos de proveer observadores para sus embar-caciones, conforme a las disposiciones del Acuerdo sobre el Programa Internacional para laConservación de los Delfines, US$ 892.838 de otros ingresos por contrato, y US$ 95.874 por con-cepto de intereses y de otras fuentes.
INFORME FINANCIERO
El estado de cuentas de la Comisión para el año fiscal 2000-2001 fue verificado por laempresa de contabilidad KPMG LLP. En el Anexo 2 del presente informe se presentan las tablascompendiadas de su informe.
TOMA DE DATOS
La zona de interés principal para el personal de la CIAT es el Océano Pacífico oriental(OPO; Figura 1), definido como la zona delimitada por el litoral de las Américas, el paralelo de40°N, el meridiano de 150°O, y el paralelo de 40°S.
Durante 2001 la CIAT contó con científicos y técnicos en La Jolla y en sus oficinasregionales en Las Playas y Manta (Ecuador); Mayagüez, Puerto Rico (EE.UU); Ensenada yMazatlán (México); Panamá (República de Panamá); y Cumaná (Venezuela). El personal de laCIAT obtiene datos de las descargas, recopila las bitácoras de los buques atuneros para obtenerdatos de captura y esfuerzo, toma medidas y demás datos biológicos de los peces, y colabora en lacapacitación y embarque de los observadores que acompañan a los buques que participan en elPrograma Internacional para la Conservación de los Delfines (PICD). Este trabajo se lleva a cabono sólo en los puertos arriba nombrados, sino que también en otros puertos de California,Colombia, Costa Rica, Ecuador, México, Panamá, Perú, Puerto Rico, y Venezuela visitados regu-larmente por el personal de la CIAT. Durante 2001 el personal de la CIAT recopiló los datos decuadernos de bitácora de 1.146 viajes de buques pesqueros comerciales, tomó muestras del con-tenido de 908 bodegas de estos buques (obteniendo a menudo datos de frecuencia de talla de másde una especie de pescado en la bodega), y muestreó 95 descargas de aleta azul capturado porbuques de pesca deportiva. Además, el personal de las oficinas regionales tramitó el embarque deobservadores de la CIAT en 487 viajes de pesca por buques participantes en el PICD, y revisó losdatos tomados por los observadores en los 479 viajes completados durante el año.
LA PESQUERIA DE ATUNES Y ESPECIES AFINES EN EL OCEANO PACIFICO ORIENTAL
La flota de superficie
El personal de la CIAT mantiene registros detallados del arte de pesca, pabellón, ycapacidad de acarreo de la mayoría de los buques que pescan atunes aleta amarilla (Thunnusalbacares), barrilete (Katsuwonus pelamis), patudo (Thunnus obesus), o aleta azul (T. orientalis)con artes de superficie en el Océano Pacífico oriental (OPO; Figura 1). No se han mantenido enel pasado registros detallados de la mayoría de los buques palangreros, ni de barcos de pescadeportiva ni embarcaciones pequeñas tales como canoas y lanchas, pero recientemente el personalcomenzó a compilar y mantener estos registros, y continuará esta actividad en el futuro. La flotaaquí descrita incluye buques cerqueros y cañeros (en lo sucesivo “artes de superficie”) que pescaronestas cuatro especies de atunes en el OPO durante el año entero o parte del mismo.
Históricamente, se usaron las estimaciones de capacidad de acarreo de buques individ-uales suministradas por el armador o astillero, en toneladas de pescado, a menos que los reg-istros de descarga indiquen que sea conveniente revisarlas. Se agruparon los buques, de
104 COMISION DEL ATUN

acuerdo a su capacidad de acarreo, originalmente en toneladas cortas y luego en toneladasmétricas, en seis clases de capacidad.
Desde hace varios años el personal de la CIAT usa el volumen de bodegas, en metros cúbicos(m3), en lugar de peso, en toneladas, para medir la capacidad de acarreo de los buques. Ya que ladensidad de carga de pescado en una bodega puede variar, medir la capacidad de acarreo en pesoes subjetivo, ya que un cargamento de pescado metido en una bodega a densidad alta pesa másque uno cargado a densidad menor. El uso de volumen como medida de capacidad elimina esteproblema. Las seis clases de tamaño usadas y los volúmenes correspondientes son:
Clase Volumen de bodega (m3)1 <532 53-1063 107-2124 213-3195 320-4256 >425
El personal de la CIAT comenzó a reunir datos sobre la capacidad en volumen en 1999, perotodavía no ha obtenido esta información para todos los buques. En el caso de buques para loscuales no se dispone de información fidedigna sobre el volumen de bodega, se usa un factor 1,171para convertir la capacidad estimada en toneladas a m3. Este factor es consistente con la densidada la cual se cargaba el pescado en las bodegas de los buques cuando se elaboró la clasificación delos buques. Se aplicó este factor de conversión también a todos los datos de capacidad de 1961-1998 para simplificar comparaciones entre años (Tabla 1).
Hasta aproximadamente 1960 predominaron en la pesca atunera en el OPO los buquescañeros, faenando en zonas costeras y cerca de islas de alta mar. Hacia fines de los años 1950 y aprincipios de los 1960, la mayoría de los buques cañeros grandes fue convertida a arte de cerco, ypara 1961 este arte predominaba en la flota de superficie del OPO. Entre 1961 y 2001 el númerode buques cañeros se redujo de unos 93 a 11, y su volumen total disminuyó de unos 11.000 m3 aunos mil. En el mismo período el número de cerqueros aumentó de 125 a 203, y su volumen totalde bodega de unos 32.000 m3 a 189.000 m3, un promedio de unos 933 m3 por buque. Previamenteocurrió un pico en el número y volumen total de bodega de la flota cerquera entre mediados de losaños 1970 y principios de los 1980, cuando llegó a haber 282 buques, y el volumen total de bodegaalcanzó unos 196.000 m3, con un promedio de unos 693 m3 por buque.
La construcción de nuevos buques cerqueros, comenzada a mediados de los años 1960,resultó en un aumento en el volumen total de bodega de la flota de superficie de unos 49.000 m3
en 1966 a unos 195.000 m3 en 1976. Entre 1976 y 1981 el volumen total de bodega aumentó lig-eramente. Continuó la construcción de buques nuevos, pero fue en gran parte compensada porpérdidas ocasionadas por buques hundidos o que abandonaron la pesquería. Un evento mayor deEl Niño comenzó a mediados de 1982 y persistió hasta fines de 1983. Las tasas de captura en elOPO fueron bajas durante 1978-1981 debido a la concentración del esfuerzo de pesca sobre pecespequeños, y la situación se vio agravada por el Niño, que hizo que los peces fueran menos vul-nerables a la captura. Luego disminuyó el volumen total de bodegas, debido al retiro de buques oa su traslado a otras zonas de pesca, principalmente el Pacífico occidental, y en 1984 alcanzó elnivel más bajo desde 1971, unos 125.000 m3. A principios de 1990 la industria enlatadora deEstados Unidos decidió no comprar más atún capturado en viajes en los cuales se realizaranlances sobre atunes asociados con delfines. Esto llevó a que muchas de las embarcacionesde Estados Unidos abandonasen esta pesquería, y a una disminución consecuente en la
INFORME ANUAL 2001 105

106 COMISION DEL ATUN
flota a 119.000 m3 en 1992. Con la mayor participación de buques de otras naciones en la pesquería, el volumen total de bodega ha aumentado progresivamente desde 1992, y en 2001 fuede unas 191.000 m3.
En las Tablas 2a y 2b se presentan los datos finales de 2000 y preliminares de 2001 delnúmero y volumen total de bodega de los buques cerqueros y cañeros que pescaron atunes en elOPO. En 2000 predominaron buques de bandera mexicana y ecuatoriana. Desde 1987 la flotamás grande ha sido la mexicana, con un 25% del volumen total de bodega en 2001, mientras quebuques de Ecuador, Venezuela, España, y Panamá formaron el 25, 17, 6, y 5% del volumen totalde bodega, respectivamente.
Buques cerqueros de la Clase 6 formaron el 90% del volumen total de bodega de la flota debuques que pescan atunes en la superficie en el OPO durante 2000.
En la Figura 2 se presentan los valores mensuales medios, mínimos, y máximos del vol-umen total de bodega en el mar (VEM), en miles de m3, de los buques que pescaron atunes en lasuperficie en el OPO durante 1991-2000, junto con los valores de 2001. Los valores mensuales sonlos promedios de las estimaciones de la VEM calculadas semanalmente por el personal de la CIAT.La pesca de aleta amarilla fue reglamentada en los últimos meses del año durante 1998-2001(véase la sección titulada MEDIDAS PARA LA CONSERVACION DEL ATUN en este informey los de años previos), por lo que los valores de la VEM para septiembre-diciembre de 2001 no soncomparables con los valores medios del período correspondiente durante 1991-2000. En general,los valores de la VEM en 2001 son más altos que los promedios de 1991-2000, aunque el porcentajede la capacidad de la flota en el mar, 57%, fue muy similar. Durante 1991-2000 el valor medio dela VEM fue 77.000 m3, pero en 2000 fue 92.000 m3.
Capturas y descargas
Atunes
Capturas de superficie
Las estimaciones de captura de atún provienen de varias fuentes, entre ellas los cuadernosde bitácora mantenidos por los pescadores, datos registrados por observadores a bordo de losbuques, datos de descargas proporcionados por empresas enlatadoras y otros procesadores, y reg-istros de importaciones y exportaciones. La estimación de la captura total de una pesquería esdifícil, debido a falta de información sobre pescado capturado que, por varios motivos, es descar-tado en el mar, muerto o moribundo en el caso de los atunes. Desde 1993 los observadores hantomado datos sobre pescado descartado en el mar por buques de la Clase 6. Esta información per-mite una estimación más precisa de las cantidades totales de pescado capturadas por la flota desuperficie. Las estimaciones de la cantidad total de la captura que se descarga (en lo sucesivo“captura retenida”) se basan principalmente en datos de descarga. En la Tabla 3 se presentan esti-maciones anuales de las capturas retenidas y descargadas de las varias especies de atunes cap-turadas por buques de la flota atunera de superficie del OPO. La tabla incluye también datos decaptura de barcos de pesca deportiva de Estados Unidos y otras artes de superficie misceláneas.En el caso del aleta azul, las capturas deportivas han formado un componente cada vez más impor-tante de la captura total en los últimos años.
Se comparan las estadísticas de 2001 con las de 1986-2000. No se restringió la pesca delatún en el OPO durante 1986-1997, pero sí fue restringida en los últimos meses del año durante1998-2001 (véase la sección titulada MEDIDAS PARA LA CONSERVACION DEL ATUN eneste informe y los de años previos). Además, la reglamentación de aquellos cerqueros que dirigensu esfuerzo hacia atunes asociados con delfines afectó probablemente el modo de operación de

esos buques, especialmente desde fines de los años 1980. El evento de El Niño que ocurrió durante1982-1983 redujo la vulnerabilidad de los peces a la captura, y el esfuerzo de pesca permaneció rel-ativamente bajo durante 1984-1986. Durante 1997-1998 ocurrió otro evento importante de ElNiño en el OPO.
La captura retenida anual media de aleta amarilla por artes de superficie durante 1986-2000 fue 259 mil toneladas (rango: 219 a 297 mil); la estimación preliminar de la captura retenidade la especie en 2001, 395 mil toneladas, es la mayor jamás registrada, y un 52% mayor que elpromedio de 1986-2000. Los descartes medios de aleta amarilla en el mar por las pesquerías desuperficie durante 1993-2000 se cifraron en un 2,1% (rango: 1,7 a 2,6%) de la captura total (cap-turas retenidas más descartes) de la especie por estas pesquerías.
Durante 1986-2000 la captura retenida media anual de barrilete en el OPO fue de 115 miltoneladas (rango: 62 a 268 mil). La estimación preliminar de la captura de la especie en 2001, 144mil toneladas, es menor que en 1999 y 2000 pero un 26% superior al promedio de 1986-2000. Losdescartes medios anuales de barrilete en el mar durante 1993-2001 se cifraron en un 12,3%(rango: 8,6 a 18,2%) de la captura total de la especie.
Antes de 1994 la captura retenida media anual de patudo en el OPO por artes de superficiefue alrededor de 5 mil toneladas (rango: <1 a 15 mil). A partir de 1993 las capturas aumentarona 29 mil toneladas en 1994, entre 35 y 52 mil toneladas durante 1995-1999, y 76 mil toneladas en2000; la estimación preliminar para 2001 es de 44 mil toneladas. Estos aumentos resultaron deldesarrollo de dispositivos agregadores de peces colocados en el agua por los pescadores para atraeratunes. Los descartes medios anuales de patudo en el mar por las pesquerías de superficie durante1993-2001 se cifraron en un 7,8% (rango: 2,8 a 11,2%) de la captura total de la especie por estaspesquerías.
El aleta amarilla, barrilete, y patudo forman la mayor parte de las capturas retenidas de losbuques que pescan atunes en la superficie en el OPO, pero el aleta azul, albacora (Thunnusalalunga), barrilete negro (Euthynnus lineatus), bonito (Sarda orientalis), y otras especies con-tribuyen también. La captura retenida total por esta flota de estas otras especies fue de unas 3mil toneladas en 2001, cantidad bien inferior al promedio de 1986-2000 de 8 mil toneladas (rango:1,9 a 17,3 mil). En la Tabla 3 se presentan estimaciones de las capturas de estas especies descar-tadas durante 1993-2001. En las Tablas 11b y 11c se presentan estimaciones de los descartes deotras especies.
En la Tabla 4a se detallan las capturas retenidas, clasificadas por pabellón, y las descargasde atunes capturados con artes de superficie, clasificadas por país, en el OPO en 2000, y en laTabla 4b las estimaciones preliminares correspondientes para 2001. La captura retenida esti-mada de todas las especies en el OPO en 2001 fue unas 586 mil toneladas, cantidad ligeramentesuperior a las 560 mil toneladas estimadas para 2000 y mucho mayor que el promedio de 1986-2000 de 405 mil toneladas. Las flotas de Ecuador y México respondieron cada una del 25%, y lade Venezuela del 19%, de la captura retenida de todas especies en 2001. Otros países con capturasimportantes fueron España (7%), Panamá, y Vanuatu (4% cada uno).
Las descargas representan pescado descargado de buques pesqueros en el año correspondi-ente, sin tener en cuenta el año de captura. El país de descarga es aquél en el cual el pescado fuedescargado o, en el caso de transbordos, el que recibió el pescado transbordado. Datos de descargapreliminares (Tabla 4b) señalan que de las 591 mil toneladas descargadas en 2001, el 39% fuedescargado en Ecuador y el 24% en México. Otros países con descargas importantes de atún cap-turado en el OPO incluyeron Colombia (7%), Costa Rica, y Venezuela (5% cada uno). Es impor-tante notar que cuando se disponga de información final los países a los que se asignanactualmente algunas descargas podrían cambiar debido a la exportación de pescado almacenado
INFORME ANUAL 2001 107

108 COMISION DEL ATUN
a procesadoras en otros países.Los atunes son capturados con redes de cerco en tres tipos de cardúmenes: asociados con
delfines, con objetos flotantes (naturales y plantados), y no asociados con nada excepto otrospeces. En la Tabla 5 se presentan estimaciones del número de lances cerqueros de cada tipo en elOPO durante 1987-2001 y de las capturas retenidas de esos lances. Se calcularon las estimacionespara los buques de las Clases 1 a 5 con datos de bitácora en la base de datos estadística de la CIAT,y aquéllos para los buques de la Clase 6 con datos de bitácora y de las bases de datos de obser-vadores de la CIAT, y los programas nacionales de México (PNAAPD), Venezuela (PNOV),Ecuador (PROBECUADOR), y EE.UU. El número de lances sobre atunes asociados con objetosflotantes y no asociados fue máximo entre mediados de los años 1970 y principios de los 1980. Apesar de la oposición a la pesca de atunes asociados con delfines, y de la decisión de las enlatadorasde EE.UU. de no comprar atún capturado en viajes en los cuales se realizaron lances sobredelfines, el número de lances sobre delfines disminuyó tan sólo moderadamente a mediados de losaños 1990, y en 1998 fue el mayor desde 1990.
Hay dos tipos de objetos flotantes, los que se encuentran en el mar por casualidad y los queson construidos por pescadores con el propósito específico de atraer peces. Se conocen estosúltimos como dispositivos agregadores de peces (DAP), plantados, o FAD (del inglés fish-aggre-gating device). Hace solamente unos pocos años que se usan los plantados, pero su importanciaha aumentado en ese período mientras que la de los objetos “naturales” (que también incluyendesperdicios y otros objetos artificiales) ha disminuido, tal como señalan los datos sobre el númeroy porcentaje de lances realizados sobre objetos flotantes por buques de la Clase 6 con observadoresde la CIAT a bordo:
Naturales Plantados DesconocidoAño Total
Número % Número % Número %1992 1.087 61,7 556 31,5 120 6,8 1.7631993 1.138 55,2 825 40,0 100 4,8 2.0631994 773 27,9 1.899 68,6 98 3,5 2.7701995 729 20,7 2.704 76,8 88 2,5 3.5211996 537 13,4 3.447 86,0 23 0,6 4.0071997 832 14,7 4.768 84,4 52 0,9 5.6521998 752 13,7 4.627 84,4 102 1,9 5.4811999 833 18,0 3.758 81,3 29 0,6 4.6202000 488 12,5 3.381 86,3 47 1,2 3.9162001 567 10,0 5.076 89,7 16 0,3 5.659
En las Figuras 3a, 4a, y 5a se ilustran las distribuciones anuales medias de las capturas dealeta amarilla, barrilete y patudo por buques cerqueros en el OPO registradas durante 1986-2000(1994-2000 en el caso del patudo), y en las Figuras 3b, 4b, y 5b estimaciones preliminares para2001. La distribución de las capturas de aleta amarilla y barrilete en 2001 fue similar a las de1986-2000, aunque son evidentes ciertas diferencias.
No se captura a menudo patudo con arte de superficie al norte de aproximadamente 7°N.La distribución de las capturas de la especie en 2001 fue similar a las de 1994-2000, aunque sonevidentes ciertas diferencias. Con el desarrollo de la pesquería sobre objetos flotantes, arribadescrita, la importancia relativa de las zonas cerca de la costa ha disminuido, mientras que la delas zonas de altura ha aumentado.
La captura por metro cúbico de volumen de bodega (CPMVB) total de los buques quepescan atunes en la superficie en el OPO proporciona un índice de las tendencias en el ingreso

bruto relativo anual de buques de distintas clases de arqueo. Para que este índice proporcionemayor detalle de lo que es posible con las seis clases de arqueo usadas históricamente por la CIAT,se clasifica la flota en ocho clases de arqueo.
En la Tabla 6 se presentan las estimaciones de la CPMVB durante 1990-2001 correspondi-entes al OPO y a todas las zonas oceánicas de pesca en las cuales buques de la flota atunera delOPO capturaron pescado, por clase de arqueo, zona, y especie. La CPMVB de los buques mayoresconsiste principalmente de aleta amarilla y barrilete, mientras que otras especies, entre ellas otrosatunes y peces misceláneos, forman una parte importante de la CPMVB de los buques máspequeños en muchos años. El patudo adquirió mayor importancia para los buques grandes apartir de 1993. En aquellos años cuando la mayoría de la flota del OPO ejercío la mayor parte deo todo su esfuerzo de pesca en el OPO, las CPMVB del OPO y de todas las zonas oceánicas de pescafueron casi iguales. Durante el período de 1990-2000, el promedio de las CPMVB de todos losbuques y todas las especies en el OPO fue 2,8 toneladas (rango: 2,4 a 3,3); para el aleta amarilla,el promedio fue 1,7 toneladas (rango: 1,5 a 2,0), y para el barrilete, 0,9 toneladas (rango: 0,5 a 1,5).El promedio correspondiente para el patudo durante 1994-2000 fue 0,3 toneladas (rango: 0,2 a0,4). Las estimaciones preliminares para 2001 son 3,1, 2,1, 0,8, y 0,2 toneladas para todas lasespecies, aleta amarilla, barrilete, y patudo, respectivamente.
Capturas palangreras
Se obtienen de varias fuentes datos de las capturas retenidas para la mayoría de los buquespalangreros grandes que pescan en el OPO, y para una porción siempre mayor de los pequeños.Estos buques, y particularmente los más grandes, dirigen su esfuerzo principalmente hacia elatún aleta amarilla. En las Tablas 7a, 7c, y 7d se detallan las capturas retenidas anuales de estaspesquerías. Durante 1985-1997 (el último año para el cual se dispone de datos completos) las cap-turas retenidas de aleta amarilla permanecieron relativamente estables, con un promedio de unas20 mil toneladas (rango: 13 a 30 mil) anuales, o un 7,5% de la captura retenida total de la especie.Antes de 1985 la captura palangrera retenida anual media de patudo fue de unas 51 mil toneladas(rango: 31 a 74 mil). Alrededor de 1985 el nivel de captura retenida de patudo aumentó signi-ficativamente, y durante 1985-1994 fue en promedio unas 81 mil toneladas (rango: 66 a 102 mil).Durante 1970-1993, antes del incremento en el uso de plantados y las mayores capturas conse-cuentes de patudo por buques cerqueros, las pesquerías palangreras, en promedio, lograban el93% de la captura retenida de la especie en el OPO. Durante 1995-1997 la captura retenida anualde patudo por las pesquerías palangreras osciló entre unas 40 y 56 mil toneladas (promedio: 46mil), nivel dentro del rango histórico previo a 1985 pero significativamente inferior a las capturasretenidas durante 1985-1994.
Peces picudos
El pez espada (Xiphias gladius) es pescado en el OPO con palangre y red agallera, y de vezen cuando con artes deportivas. La mayor parte de la captura comercial es retenida. Los mar-lines azul (Makaira nigricans), negro (M. indica), y rayado (Tetrapturus audax), y trompa corta(T. angustirostris) y el pez vela (Istiophorus platypterus) son pescados con palangre y artesdeportivas, y son capturados de vez en cuando por buques cerqueros. La mayor parte de la cap-tura palangrera de estas especies es retenida, y la mayor parte de la captura de superficie comer-cial es descartada en el mar. En la Tabla 8 se presenta información sobre las capturas comercialese incidentales de peces picudos en el OPO.
____________________
INFORME ANUAL 2001 109

110 COMISION DEL ATUN
Bajo las disposiciones de la Convención que estableció la CIAT, el objetivo principal delas investigaciones del personal de la Comisión es estudiar la condición de las poblaciones deatunes y otras especies capturadas por la pesca atunera del OPO. Tomando en cuenta losdesplazamientos extensos de los atunes, la movilidad de los buques de las flotas atuneras de losdistintos países, y el carácter internacional del comercio del atún, las estadísticas de captura yesfuerzo del OPO deben ser vistas a la luz de las estadísticas mundiales. En las Tablas 7a-7c y 9se presentan estadísticas de captura de atunes y especies afines durante 1991-2000, por océano.
Descartes y capturas incidentales en la pesquería atunera con red de cerco
A fines de 1992 los observadores de la CIAT comenzaron a reunir información sobre losdescartes y las capturas incidentales en las operaciones de pesca con red de cerco, y el programacontinuó en 2001. En esta sección “capturas retenidas” significa pescado retenido a bordo delbuque pesquero, “descartes” los atunes de importancia comercial (aleta amarilla, barrilete,patudo, aleta azul, y albacora) desechados muertos en el mar, “capturas incidentales” los peces uotros animales, aparte de los atunes de importancia comercial, desechados muertos en el mar, y“capturas totales” la suma de estas tres categorías. Durante 2001 fueron revisados los datosreunidos en los años anteriores y modificados en casos apropiados. En la Tabla 10 se presentainformación sobre la cobertura de los tres tipos de lance (sobre atunes asociados con delfines, conobjetos flotantes, y no asociados). La Columna 3 de esta tabla detalla el número de lances en labase de datos de la CIAT para los cuales se registraron datos de capturas incidentales y descartes,y la Columna 4 el número de lances en la base de datos Atún-Delfín de la CIAT, más datos equiv-alentes recabados por los programas nacionales de observadores de México (PNAAPD), Venezuela(PNOV), y Ecuador (PROBECUADOR). (El número de lances para 1993 y 1998-2001 en laColumna 4 de esta tabla concuerda con los valores correspondientes a buques de la Clase 6 en laTabla 5 porque los buques menores no llevaron observadores en esos años. Algunos buques de laClase 5 llevaron observadores en 1994-1997, por lo que algunos de los valores de esos años en laTabla 10 son mayores que los valores correspondientes en las columnas de Clase 6 en la Tabla 5.)La cobertura de buques con observadores es incompleta, pero suficiente para la mayoría de losfines estadísticos.
Se estimaron los descartes y capturas incidentales en viajes acompañados por observadorescomo sigue:
DESCARTES = (descarte/lance) x LANCESy
CAPTURAS INCIDENTALES = (captura incidental/lance) x LANCES,
donde DESCARTES y CAPTURAS INCIDENTALES = descartes y capturas incidentales en todoslos viajes con observador a bordo, descarte/lance y captura incidental/lance = descartes y capturasincidentales por lance en todos los lances en los que observadores de la CIAT tomaron datos sobredescartes y captura incidental, y LANCES = todos los lances en viajes con observador a bordo(Tabla 10, Columna 4). Estas estimaciones son más bajas de lo que serían si se incluyeran datosde buques más pequeños, que pescan casi exclusivamente sobre atunes no asociados y objetosflotantes.
Descartes y capturas incidentales de atunes
En la Tabla 11a se presentan estimaciones de los descartes de atunes de importancia

comercial y las capturas incidentales de atún barrilete negro, melvas, y bonitos por buques conobservador. Las capturas incidentales malgastan siempre un recurso, en el sentido de quereducen el reclutamiento a la pesquería de peces de tamaño capturable y/o el rendimiento porrecluta. La captura de aletas amarillas y patudos pequeños, aun si son retenidos, reduce elrendimiento por recluta de la especie.
Capturas incidentales de otras especies
En las Tablas 11b y 11c se presentan estimaciones de las capturas incidentales de animalesaparte de los atunes de importancia comercial. Las capturas incidentales de todas las especiesexcepto delfines son máximas en los lances sobre objetos flotantes, intermedias en los lances sobreatunes no asociados, y mínimas en los lances sobre delfines. Los peces picudos, el dorado(Coryphaena spp.), peto (Acanthocybium solandri), salmón (Elagatis bipinnulata), jurel (Seriolalalandi), y ciertas especies de tiburones y mantas son objeto de la pesca comercial y deportiva enel OPO. Las tortugas marinas capturadas por buques cerqueros incluyen tortugas golfina(Lepidochelys olivacea), verde (Chelonia mydans), laúd (Dermochelys coriacea), carey(Eretmochelys imbricata), y caguama (Caretta caretta), todas de las cuales son consideradas enpeligro o amenazadas. (La mayoría de las tortugas que se capturan son liberadas en condiciónviable; la Tabla 11c incluye solamente aquéllas que murieron o que padecieron heridas que prob-ablemente causarían su muerte.) La información disponible sobre la biología de las especies depeces en la Tabla 11c es insuficiente para permitir determinar los efectos de la captura de dichasespecies por la pesquería con red de cerco.
COMPOSICION POR TAMAÑO DE LOS ATUNES EN LA CAPTURA DE SUPERFICIE
Las muestras de frecuencia de talla son la fuente básica de los datos usados para estimar lacomposición por talla y edad de las distintas especies de peces en las descargas. Esta informaciónes necesaria para obtener estimaciones de la composición de las poblaciones por edad, usadas paravarios propósitos, entre ellos el modelado de las poblaciones por edad. Los resultados de dichomodelado pueden ser usados para estimar el reclutamiento, que puede ser comparado con labiomasa reproductora y las condiciones oceanográficas. Además, las estimaciones de mortalidadobtenidas con estos modelos pueden ser usadas, en conjunto con estimaciones del crecimiento,para modelar el rendimiento por recluta. Los resultados de estudios de este tipo han sidodescritos en diversos Boletines de la CIAT, en sus Informes Anuales desde 1954, y en sus Informesde Evaluación de Stocks.
Las muestras de frecuencia de talla de aleta amarilla, barrilete, patudo, aleta azul delPacífico, y ocasionalmente barrilete negro capturados por buques cerqueros, cañeros, y deportivosen el OPO son tomadas por el personal de la CIAT en puertos de descarga en Ecuador, EstadosUnidos (California y Puerto Rico), México, Panamá, y Venezuela. El muestreo de las capturas dealeta amarilla y barrilete fue iniciado en 1954, el de aleta azul en 1973, y el de patudo en 1975, ycontinúan actualmente.
En el Informe Anual de la CIAT de 2000 se describen los métodos de muestreo de las cap-turas de atún. En breve, se selecciona para el muestreo pescado en las bodegas de buques cer-queros y cañeros solamente si todo el pescado en la bodega fue capturado durante un solo mes, enun solo tipo de lance (delfín, objeto flotante, o no asociado), y en la misma zona de muestreo. Seclasifican estos datos por pesquería (Figura 6). Durante 2001 se tomaron muestras de 1.003 bodegas.
En este informe se presentan datos de peces capturados durante 1996-2001. Para cadaespecie se presentan dos histogramas de frecuencia de talla. En el caso del aleta amarilla, bar-
INFORME ANUAL 2001 111

rilete, y patudo, el primero presenta los datos por estrato (arte de pesca, tipo de lance, y zona)para 2001, y el segundo, similar a los de años anteriores, ilustra la captura del año en curso y loscinco años previos. En el caso del aleta azul, se presentan las capturas de 1996-2001, las comer-ciales en el primer histograma y las deportivas en el segundo.
Para la evaluación de los stocks se definen diez pesquerías de superficie de aleta amarilla:cuatro de objeto flotante, dos de atunes no asociados, tres de delfines, y una de caña (Figura 6).De las 1003 bodegas muestreadas, 849 contenían aleta amarilla. En la Figura 7a se ilustran lascomposiciones por talla estimadas del pescado capturado durante 2001. La mayoría de la capturade aleta amarilla provino de lances sobre atunes no asociados y asociados con delfines. El pesomedio de los peces capturados en asociación con delfines fue más del doble del peso de los que secapturaron en los otros dos tipos de lance. El peso medio de los aletas amarillas capturados enlances sobre cardúmenes no asociados en la zona Sur y en lances sobre objetos flotantes en la zonaCostera en 2001 fue mayor que en los cinco años previos.
En la Figura 7b se ilustra la composición por talla estimada del aleta amarilla capturadopor todas las pesquerías combinadas durante 1996-2001. El rango de tallas del pescado fue gen-eralmente consistente (40-160 cm), pero la distribución de las tallas varía entre años. El pesomedio del aleta amarilla capturado durante 2001 fue mayor al promedio correspondiente de loscinco años anteriores, debido probablemente en gran parte a las capturas de aletas amarillasgrandes frente a Perú durante el primer semestre de 2001.
Para la evaluación de los stocks se definen ocho pesquerías de barrilete: cuatro de objetoflotante, dos de atunes no asociados, una de delfines, y una de caña. Las dos últimas abarcantodas las 13 zonas de muestreo. De las 1003 bodegas muestreadas, 459 contenían barrilete. En laFigura 8a se ilustran las composiciones por talla estimadas del pescado capturado durante 2001.La mayoría del pescado provino de lances sobre objetos flotantes. Cantidades insignificantes debarrilete fueron capturadas en asociación con delfines y por buques cañeros.
En la Figura 8b se ilustra la composición por talla estimada del barrilete capturado portodas las pesquerías combinadas durante 1996-2001. El peso medio del pescado capturado durante2000 fue mayor que en 2001 y en cualquiera de los cuatro años anteriores.
Para la evaluación de los stocks se definen siete pesquerías de superficie de patudo:cuatro de objeto flotante, una de atunes no asociados, una de delfines, y una de caña. Las tresúltimas abarcan todas las 13 zonas de muestreo. De las 1003 bodegas muestreadas, 204 con-tenían patudo. En la Figura 9a se ilustran las composiciones por talla estimadas del pescadocapturado durante 2001. Durante 2001 se capturó significativamente menos patudo en lancessobre objetos flotantes en la zona de Galápagos que en 2000. Se capturaron pequeñas canti-dades de patudo en lances sobre atunes no asociados y asociados con delfines. No se registró cap-tura de patudo por barcos cañeros.
En la Figura 9b se ilustra la composición por talla estimada del patudo capturado por todaslas pesquerías combinadas durante 1996-2001. El peso medio del pescado capturado durante 2001fue mayor que durante 1996-1999, pero mucho menor que durante 2000.
El aleta azul del Pacífico es capturado con artes de superficie por buques comerciales ydeportivos frente a California y Baja California, principalmente entre 23°N y 35°N, aproximada-mente, entre mayo y octubre. Durante 2001 fue capturado entre 25°N y 37°N. La captura de aletaazul por buques comerciales fue menor durante 2001 que durante cualquiera de los cinco añosprevios, y se logró toda la captura registrada en julio y agosto. La mayoría de la captura de losbarcos de pesca deportiva fue lograda entre junio y septiembre, pero se capturaron cantidadesmenores en marzo y mayo. En las Figuras 10a y 10b se presentan histogramas de las capturas esti-madas comerciales y deportivas, respectivamente, de aleta azul en cada año del período de 1996-
112 COMISION DEL ATUN

2001. Son evidentes grupos modales claros en la mayoría de los años para ambos tipos de captura. Las cantidades de muestras de aleta azul obtenidas de las capturas comerciales y deportivas en losúltimos años son como sigue:
Comercial Deportiva Comercial Deportiva1990 14 0 1996 67 51991 4 0 1997 17 91992 1 1 1998 23 221993 4 35 1999 51 121994 2 11 2000 20 581995 6 16 2001 3 95
Se consiguió el mayor número de muestras de la flota comercial en 1996, año de capturas extraor-dinariamente elevadas. El gran número de muestras conseguido de la flota comercial durante1999 y de la flota deportiva durante 2000 y 2001 se debió más a un mayor esfuerzo de muestreoque a mayores capturas. En los últimos años una porción considerable de la captura comercial dealeta azul ha sido transportada a corrales marinos, donde se mantienen los peces para engordarlosy luego venderlos para sashimi. No se tiene acceso a los peces para medirlos.
El barrilete negro es capturado incidentalmente por pescadores que dirigen su esfuerzohacia los atunes aleta amarilla, barrilete, y patudo. La demanda de la especie es baja, y la may-oría de la captura es desechada en el mar, pero a veces se retienen pequeñas cantidades, mezcladascon las especies más deseadas. Ya que se tomaron solamente nueve muestras de barrilete negro delas 1003 bodegas muestreadas durante 2001, no se presentan en este informe histogramas de fre-cuencia de talla para esta especie.
PROGRAMA DE OBSERVADORES
Los observadores empleados por la CIAT registran la mortalidad de las distintas especiesde delfines durante las faenas de pesca, y el personal de la CIAT usa estos datos para preparar susestimaciones de la mortalidad de delfines en la pesquería. Los observadores recaban tambiéndatos sobre las manadas de delfines observadas, usados para calcular estimaciones de la abun-dancia relativa de los delfines. Se usa la información anotada sobre las condiciones coincidentescon la mortalidad de delfines para estudios de las causas de dicha mortalidad, y se comparten losconocimientos obtenidos de estos estudios con los pescadores a través de las actividades educa-tivas de la CIAT, tales como seminarios para capitanes y tripulantes de buques cerqueros yanálisis del desempeño de capitanes individuales. Además, desde fines de 1992 los observadoresregistran información sobre los peces y otros animales liberados o descartados en el mar.
Cobertura
El diseño de muestreo del programa de observadores para 2001 contempló unacobertura del 100% de los viajes de pesca realizados en el Océano Pacífico oriental(OPO) por buques cerqueros de más de 363 toneladas de capacidad de acarreo. México,Venezuela, y Ecuador tienen sus propios programas de observadores. El ProgramaNacional de Aprovechamiento del Atún y Protección de Delfines (PNAAPD) de Méxicoy el Programa Nacional de Observadores de Venezuela (PNOV) cubren el 50% de losviajes de los buques de sus flotas nacionales respectivas. El Programa Nacional deObservadores Pesqueros de Ecuador (PROBECUADOR) comenzó el año muestreandoaproximadamente el 25% de los viajes de su flota, y luego incrementó la cobertura
INFORME ANUAL 2001 113

114 COMISION DEL ATUN
hacia la meta del 34%. El Programa Atún-Delfín de la CIAT muestreó el resto de los viajesde las flotas de estos tres países más todos los viajes de los buques de otras flotas, con las excep-ciones detalladas a continuación. El programa internacional de observadores de la CIAT y los tresprogramas nacionales constituyen el Programa de Observadores a Bordo del Acuerdo sobre elPrograma Internacional para la Conservación de los Delfines (APICD).
Observadores del Programa de Observadores a Bordo zarparon en 698 viajes de pesca en2001 (Tabla 12), y con los 54 viajes iniciados en 2000 y terminados en 2001 que llevaron obser-vador, en total el Programa cubrió 752 viajes en 2001. El Programa abarcó buques bajo la juris-dicción de Belice, Bolivia, Colombia, Ecuador, El Salvador, España, Estados Unidos, Guatemala,Honduras, México, Nicaragua, Panamá, Vanuatu, y Venezuela, más un buque de registro descono-cido. 19 de estos viajes fueron de buques que en el momento de zarpar enarbolaban el pabellón depaíses no Partes del APICD.
En 2001 se muestreó el 98,2% de los viajes de buques de más de 363 toneladas de capacidadde acarreo, y el programa de la CIAT muestreó el 69,2% de éstos. De los 14 viajes no muestreados,10 fueron realizados por cinco buques bolivianos durante el período cuando las Partes decidieronno asignar observadores a buques de ese pabellón hasta que se aclarase la situación con respectoa la participación de Bolivia en el PICD. Después de que Bolivia inició su participación en agostode 2001, uno de sus buques realizó un viaje sin observador porque la gerencia del mismo se negóa aceptar el observador asignado. En cada uno de los otros tres viajes no observados, dos de unbuque de registro desconocido y el otro de un buque de Vanuatu (en proceso de cambiar a pabellónde Bolivia), la gerencia del buque no pidió observador.
Capacitación de observadores
En noviembre de 2001 tuvo lugar en Manta (Ecuador) un curso de capacitación de obser-vadores. Asistieron 23 candidatos, 18 del programa de la CIAT y 5 de PROBECUADOR.
Informes de observadores desde el mar
En el Artículo V (2) del APICD se dispone que se establezcan límites anuales de mortalidadde delfines por población. A fin de que el seguimiento de la mortalidad esté al día, y también paralograr un seguimiento mejor de la captura acumulativa de las principales especies de atún en elOPO, los observadores completan cada semana un Informe Desde el Mar y lo transmiten porcorreo electrónico, fax, o radio desde el buque a la oficina del programa respectivo.
INVESTIGACION
EDAD Y CRECIMIENTO DEL ATUN PATUDO
Se sabe poco acerca de la edad y crecimiento del patudo en el OPO. Es necesaria informa-ción precisa sobre ambos para poder entender la biología y dinámica poblacional de la especie.Datos de talla a edad permiten formular estimaciones del crecimiento, y posibilitan la incorpo-ración de características que varían con la edad, tales como la mortalidad y fecundidad, en mod-elos de dinámica de poblaciones.
La mayoría de los estudios recientes de la edad de peces marinos utilizan marcas natu-rales en estructuras calcificadas como indicadores de tiempo. Se puede estimar la edad de lospeces con precisión a partir de estas estructuras si se sabe la tasa de deposición de las marcas.Se han usado otolitos sagitales y vértebras caudales para determinar la edad de varias especiesdel género Thunnus. Los conteos de microincrementos en la superficie de los otolitos de peces

de un experimento de marcado con marcas externas y con oxitetraciclina (OTC) iniciado cerca deHawaii en 1995 demostraron que patudos de entre unos 38 y 117 cm de talla depositan los incre-mentos a diario (Informe Trimestral de la CIAT, abril-junio 1999). Se recuperaron recientementelos otolitos de 13 patudos, de entre 104 y 135 cm de talla, marcados e inyectados con OTC en elOPO ecuatorial entre marzo y mayo de 2000. Los resultados iniciales, basados en conteos demicroincrementos entre la marca de OTC y la punta del postrostro, señalan asimismo que losmicroincrementos son depositados en la superficie de los otolitos a intervalos diarios.
Contar los microincrementos en la superficie de los otolitos es extremadamente difícil yocupa mucho tiempo (Boletín de la CIAT, Vol 18, No. 6), y por lo tanto se está investigando la téc-nica de seccionar los otolitos, usando el conjunto entero de otolitos marcados con OTC recuper-ados de Hawaii y el OPO. Las secciones frontales, a lo largo del primordio al eje postrostral delotolito, parecen brindar una ruta de conteo óptima para los otolitos de patudo. Esta ruta es lamás larga, por lo que los incrementos son más anchos que en las secciones transversales, incre-mentando así al máximo la oportunidad de resolver microincrementos diarios hasta una ciertaedad máxima. Se han establecido técnicas para seccionar, pulir, y grabar con ácido, y las marcasde OTC y los microincrementos son claramente visibles en todos los especímenes preparadoshasta la fecha. Se completará probablemente la validación de esta técnica de determinar la edada principios de 2002.
En enero de 2001 se inició un programa de muestreo de otolitos, vértebras caudales, ygónadas de patudo, y la talla y peso de los pescados, en las oficinas regionales de la CIAT en LasPlayas y Manta (Ecuador). Se muestrean peces en 12 intervalos de talla de 10 cm entre 30 y 150cm. Se seleccionan 15 hembras y 15 machos de cada intervalo, para un total de 360 especímenes.Para el fin de diciembre de 2001 se muestrearon 299 especímenes, y se espera conseguir todas lasmuestras a principios de 2002. Se usarán los otolitos y vértebras para obtener estimacionesdirectas de la edad y crecimiento de patudos de ambos sexos en la pesquería del OPO.
BIOLOGIA REPRODUCTORA DEL ATUN PATUDO
Se sabe poco acerca de la talla y edad de madurez sexual, la distribución del desove, y lafecundidad del atún patudo en el OPO. En enero de 2000 se inició un programa de 2 años demuestreo de gónadas de patudo por observadores de la CIAT a bordo de buques cerqueros pes-cando en el OPO. Investigadores del National Research Institute of Far Seas Fisheries de Japónsolicitaron que se obtuvieran al mismo tiempo muestras de gónadas de patudo capturado porbuques palangreros en el OPO. El objetivo de este proyecto colaborativo fue llegar a unconocimiento completo de la biología reproductora del patudo en el OPO, necesario para la evalu-ación del stock.
Durante 2001 se obtuvieron muestras en 20 viajes de buques cerqueros de 838 hembras contejido ovárico adecuado para examen histológico. Las muestras fueron procesadas en elLaboratorio de Achotines, y una empresa en San Diego las preparó para examen con microscopio.Serían examinadas para identificar las etapas de ovogénesis y así evaluar con precisión la condi-ción reproductora de cada pez. Se seleccionaron también ovarios para usar en la estimación de lafecundidad de los peces.
Al fin del año el programa de muestreo no había producido un número suficiente de mues-tras, particularmente de peces de más de 120 cm de talla, para permitir realizar una evaluacióncompleta de las características reproductoras del patudo en el OPO ecuatorial. Se continuará elprograma dos años más para procurar conseguir las muestras necesarias.
INFORME ANUAL 2001 115

MARCADO DE ATUNES
Atunes tropicales
Entre marzo y mayo de 2000 se llevó a cabo a bordo del Her Grace, un buque cañero fle-tado, la primera fase de un proyecto de marcado de atún patudo de varios años de duración. Hastael 31 de diciembre de 2001 fueron devueltas las marcas siguientes:
Especie Tipo de marca Liberados Devueltos Porcentaje devueltoPatudo convencional 101 22 21,8Patudo archivadora 96 29 30,2Barrilete convencional 1.238 260 21,0Aleta amarilla convencional 71 8 11,3
El mayor período en libertad para el patudo y el barrilete fue de 446 y 224 días, respectivamente,y el mayor desplazamiento del punto de liberación al punto de recaptura fue de 1.499 y 2.167millas náuticas, respectivamente.
Han sido recuperadas todas las 29 marcas archivadoras colocadas en patudos y recap-turadas, menos una. El período en libertad, de liberación a recaptura, varió de 8 a 446 días. Delas 28 marcas archivadoras recuperadas, 23 provinieron de peces que permanecieron en libertadmenos de 30 días. Se han obtenido de estos 23 peces varias estadísticas espaciales, basadas enestimaciones filtradas de las posiciones derivadas de datos de luz registradas por las marcasarchivadoras. Se han producido gráficas estáticas y dinámicas de los desplazamientos de cada unode estos peces, y a partir de estos desplazamientos se estimaron la distancia total recorrida, lavelocidad, y distribuciones de utilización.
Evaluaciones de los registros de profundidad y tiempo de las marcas archivadoras permitendistinguir cuatro tipos distintos de comportamiento: no asociado Tipo 1 (con migraciones verti-cales diurnas), no asociado Tipo 2 (sin migraciones verticales diurnas), asociado con objetosflotantes, y descenso a profundidad. Se calculó la proporción de tiempo que cada pez dedicó a cadauno de estos tipos de comportamiento durante su período en libertad, inclusive períodos de resi-dencia en dispositivos agregadores de peces.
Se evaluó la selección de hábitat del patudo por hora del día, temporada, y estructura tér-mica del hábitat. Cuando el patudo presenta comportamiento no asociado Tipo 1 suele estar amenos de 50 m de profundidad y a temperaturas de más de 20°C (en la capa de mezcla) durantetoda la noche, y de día entre 200 y 300 m y 13° y 14°C. Este comportamiento es probablementeuna adaptación para seguir su presa, que consiste principalmente de calamares y pecesmesopelágicos que migran en dirección vertical. Los niveles de luz son similares a esas profundi-dades de noche y de día.
Aleta azul
Científicos del Acuario de la Bahía de Monterey marcaron 85 aletas azules con marcas dedardo de la CIAT frente al norte de Baja California entre el 15 y 24 de julio de 2001. Fuerondevueltas las marcas de cinco de estos peces durante 2001, dos recapturados en la zona de lib-eración por pescadores deportivos en agosto y los otros tres recapturados al norte de PuntaConcepción (California), por buques cerqueros en octubre.
116 COMISION DEL ATUN

Marcado de atunes aleta amarilla con marcas archivadoras en el Laboratorio deAchotines
En marzo de 2001 se inició un experimento en el Laboratorio de Achotines para investigarsi es posible detectar los eventos de alimentación y desove de aletas amarillas cautivos a partir dedatos de temperatura en la cavidad peritoneal de los peces registrados por marcas electrónicasimplantadas. Se implantaron marcas archivadoras en la cavidad peritoneal de seis aletas amar-illas (de entre 77 y 88 cm y 9,5 y 14,8 kg), marcados también con marcas de dardo plásticas con-vencionales de distintos colores para permitir registrar el comportamiento de alimentación ycortejo de peces individuales. Al fin del año se mantenían estos peces en el Tanque 6, de 170.200L de capacidad.
ESTUDIOS ECOLOGICOS
En la ordenación de pesquerías, un enfoque basado en ecosistemas es importante para man-tener una pesca sostenible y ecosistemas sanos. Aunque los objetivos de una ordenación basadaen ecosistemas son difíciles de definir, se acepta generalmente que los modelos constituyen unaherramienta importante para comprender el funcionamiento de los ecosistemas y explorar lasimplicaciones ecológicas relativas de distintos métodos de pesca. Por lo tanto, el personal de laCIAT ha elaborado un modelo de balance de masas multiespecífico del ecosistema para el Pacíficooriental tropical (POT) pelágico. En general, los modelos de este tipo representan el ciclo vital delos elementos principales del ecosistema, el flujo de la biomasa entre éstos, y las composiciones porespecie y tamaño de las capturas de las varias pesquerías.
Se desarrolló el modelo de ecosistema para el POT pelágico con Ecopath with Ecosim(EwE), usado para modelar varios tipos de ecosistema en el Pacífico y otros lugares. En Ecopath,se genera un balance de masas a partir de estimaciones de la abundancia (biomasa) de losrecursos, sus tasas de productividad o mortalidad, sus interacciones (composición de dietas y ytasas de consumo de alimento), y la eficacia de su utilización en el ecosistema. En Ecopath, el con-sumo y rendimiento energéticos de todos los componentes del modelo necesitan estar en equi-librio, o sea
consumo = producción + respiración + alimento no asimilado.
Una vez descrito el ecosistema con Ecopath, se examina su dinámica con Ecosim. El modelo cubre la zona delineada por 20ºN, 20ºS, 150ºO, y el límite aproximado de la
plataforma continental a lo largo del litoral de las Américas, unos 32.8 millones de km2. En todocaso posible se promediaron las estimaciones de los parámetros sobre el período de 1993-1997. Seseleccionaron componentes del modelo (Informe Anual de la CIAT de 1999: Tabla 15b) paraincluir las principales especies explotadas (atunes y marlines, entre otros), grupos funcionales(tiburones y cefalópodos, por ejemplo), especies sensibles (tortugas y delfines, por ejemplo), y unaespecie que vive en el sistema durante una parte del año solamente (atún aleta azul del Pacífico).Se separaron en dos grupos ontogénicos los grupos taxonómicos de ontogenía trófica considerabley los que son capturados por distintas artes de pesca a distintos tamaños. La versión actual delmodelo contiene 36 componentes.
Se estimaron los promedios de 1993-1997 de las capturas retenidas y descartadas de lasespecies objetivo (atunes por artes de superficie y atunes y peces picudos por palangre), y de lascapturas incidentales de las especies no objetivo, para cada componente del modelo por arte depesca (red de cerco, palangre, y caña) y modalidad de pesca de cerco (sobre atunes asociados condelfines, asociados con objetos flotantes, o no asociados). Todos estos datos de captura
INFORME ANUAL 2001 117

provinieron de las bases de datos de la CIAT. No se incluyen en el modelo pequeñas pesqueríascosteras y artesanales, debido a falta de datos. Se supone que la biomasa de las exportaciones(animales que salen del ecosistema) es igual a la biomasa de las importaciones.
Se ajustó el modelo a series de tiempo históricas para los atunes aleta amarilla y patudo.Se crearon las condiciones iniciales para el ajuste simulando un período de 51 años sin esfuerzode pesca, y entonces incorporando una serie histórica de esfuerzo de pesca de 1961 a 1998 paracada una de las artes o modalidades de pesca. La simulación de 51 años sin pesca permitió a labiomasa de los grupos del modelo volver al punto de equilibrio en un nivel más alto, posiblementecercanos a las condiciones sin explotación o al principio de la misma. Se estandarizaron las esti-maciones del esfuerzo de pesca (días de pesca para las tres modalidades cerqueras y la pesca concaña, y número de anzuelos para la pesca palangrera) de 1961 a 1998 al esfuerzo en 1993 (Figura11). Se usó un simulador empírico del clima, basado en las anomalías de la temperatura superfi-cial del mar de 1910 a 1998 (Figura 12), para incluir el efecto de variación climática sobre la redtrófica en la simulación.
La serie de tiempo histórica consistió de estimaciones anuales independientes de biomasay tasas totales medias de mortalidad para aletas amarillas grandes y pequeños y para patudosgrandes y pequeños durante 1975-1998. Estas estimaciones provinieron de evaluaciones de laspoblaciones realizadas durante 2000 (Informe de Evaluación de Stocks de la CIAT 1: 5-86 y 109-210). Se escalaron las estimaciones de biomasa a las de 1993 y fueron tratadas como capturas porunidad de esfuerzo (CPUE) (Figuras 11 y 12). Para ajustar los datos al modelo se ajustó repeti-damente la tasa de vulnerabilidad de los vínculos depredador-presa para reducir al mínimo lasuma de errores cuadrados (SE). Al estimar las tasas de vulnerabilidad (v), se agruparon compo-nentes del modelo similares de varias maneras a fin de explorar la hipótesis de que los animalesque desempeñan papeles comparables en el ecosistema serían vulnerables a la depredación deformas comparables. Por ejemplo, se estimó v por separado para los depredadores tope (definidosaquí como grupos de nivel trófico > 5,00), depredadores (grupos de nivel trófico 4,00-4,99), ypresas (grupos de nivel trófico <4,00). Ninguno de los escenarios alternativos de vulnerabilidadfue mejor (SE menor y parametrización más parsimoniosa) que aquél en el que se estimó un vcomún. En las Figuras 11 y 12 se ilustran los ajustes a la CPUE de aleta amarilla y patudo,respectivamente. Los de aleta amarilla fueron considerablemente mejores que los de patudo: cap-turaron el régimen de reclutamiento aparentemente mayor de aleta amarilla de 1985-1998, mien-tras que los de patudo subestiman la variabilidad de los datos.
Los diagramas de red trófica son útiles para representar la estructura y flujos de los eco-sistemas. Las pesquerías a menudo actúan como depredadores tope en ecosistemas pelágicosexplotados. Los diagramas de red trófica en la Figura 13 ilustran los flujos primarios medios, queresponden del 80% de los flujos tróficos totales a cada grupo del modelo a las pesquerías cerqueray palangrera en el POT durante 1993-1997. De las distintas pesquerías atuneras, la pesca sobredelfines con red de cerco abarca la red trófica más sencilla. Se estimó el nivel trófico (NT) medio(ponderado por las capturas totales retenidas y descartadas de cada componente) para la capturaen lances sobre delfines en 4,78, el más alto de todas las pesquerías excepto la palangrera. Sedefine el NT de cada pesquería (Figura 13) como el NT medio ponderado de su captura más 1,00.Los lances cerqueros sobre atunes no asociados abarcan una red trófica más diversa que los lancessobre delfines, y capturan atunes más pequeños (Figura 13). El NT medio ponderado de la cap-tura de esa pesquería fue por lo tanto ligeramente menor, 4,72. Los lances sobre objetosflotantes abarcan una red trófica más diversa que los otros dos tipos de lance cerquero(Figura 13); ya que la captura incidental en este tipo de lance (no ilustrada en la Figura13 debido a su mínima contribución a la captura total) es mayor que la de los otros dos
118 COMISION DEL ATUN

tipos de lance, el NT medio de la captura (4,77) fue ligeramente mayor que aquél de los lances sobre atunes no asociados. La pesquería palangrera abarca una red trófica asimismo diversa(Figura 13), y captura peces grandes. El NT medio ponderado de su captura (5,19) fue consider-ablemente mayor que los de las otras pesquerías. La pesquería cañera (no ilustrada en la Figura13) captura principalmente atunes pequeños, más algunos tiburones. Se estimó el NT medio desu captura en 4,72, igual que para los lances cerqueros sobre atunes no asociados. En general, elmodelo de ecosistema estimó el NT medio ponderado de la captura de todas las pesquerías durante1993-1997 en 4,83.
Se puede también estimar el nivel trófico de años individuales para las capturas de las dis-tintas pesquerías, o por separado para las capturas retenidas y descartadas. Se estimó la condi-ción trófica de las pesquerías mediante la aplicación de los NT estimados con el modelo deecosistema base (es decir, para el promedio de las capturas de 1993-1997), ponderado por los datosde captura por pesquería y año para todos los grupos del modelo de las bases de datos de la CIATpara capturas de atunes retenidas, capturas de atunes descartadas, y capturas incidentales deotras especies. Los NT de las capturas totales de todas las modalidades de pesca de cerco variaronbastante entre años (Figura 14). Hubo una tendencia descendente paulatina entre 1996 y 1999,seguida por un incremento grande en 2000. El NT medio disminuyó de nuevo ligeramente en2001, a casi el mismo nivel de los de 1994-1996. Los NT de los lances sobre objetos flotantes vari-aron más que los de las otras pesquerías, debido a la variabilidad interanual en el tamaño de losatunes capturados y la composición por especies de la captura incidental en ese tipo de lance. Latendencia en el NT de los lances sobre objetos flotantes pareció influir sobre la tendencia en lascapturas totales más que las de las otras pesquerías (Figura 14).
Ya que las estimaciones de los NT de las capturas de las distintas pesquerías incorporanseñales para todos los componentes del ecosistema capturados, es posible que las tendencias inter-anuales en los NT sirvan de indicadores de los efectos de las pesquerías sobre el ecosistema, y seestá explorando esta posibilidad. Los animales que forman las capturas incidentales en el POT amenudo ocupan los niveles tróficos más altos. El modelo de ecosistema del POT predice que lapesca sobre animales que ocupan niveles tróficos altos ejerce un mayor efecto de arriba haciaabajo sobre el ecosistema que la pesca de animales en NT más bajos. Sin embargo, no se ha deter-minado si la variabilidad en los NT observados son significativos.
ESTUDIOS DEL CICLO VITAL TEMPRANO
Desde hace ya muchos años los biólogos pesqueros creen que la fuerza de una clase anualse ve determinada principalmente durante las etapas tempranas del ciclo vital (huevo, larva, y/ojuvenil temprano). Décadas de investigación han descubierto una cantidad considerable de infor-mación sobre las poblaciones de atunes adultos, pero se sabe relativamente poco acerca de lasetapas tempranas del ciclo vital y los factores que afectan el reclutamiento de los juveniles a losstocks explotables. Estas consideraciones motivaron a la CIAT a establecer en la Bahía deAchotines, en la República de Panamá, un centro de investigación dedicado al estudio del ciclovital temprano de los atunes.
La Bahía de Achotines está situada en la punta sur de la Península de Azuero en laProvincia de Los Santos, República de Panamá (Figura 22). La plataforma continental es bas-tante estrecha en este lugar: el contorno de 200 metros se encuentra a entre solamente 6 y 10 kmdel litoral. Esto brinda a los científicos del laboratorio acceso fácil a aguas oceánicas donde ocurredesove de atunes en cada mes del año. La temperatura superficial del mar fluctúa entre 21° y29°C. El agua de la Bahía de Achotines es adecuada para mantener atunes vivos en el labo-ratorio. La proximidad del laboratorio a la zona de estudio ofrece una alternativa menos cos-
INFORME ANUAL 2001 119

120 COMISION DEL ATUN
tosa que un buque de investigación, y permite una mayor flexibilidad en el muestreo.El programa de la CIAT de investigación de las etapas tempranas del ciclo vital abarca estu-
dios de laboratorio y de campo ideados para obtener un mayor conocimiento de los procesos dereclutamiento y de los factores que lo afectan. Investigaciones anteriores del reclutamiento de lospeces sugieren que tanto los factores abióticos (temperatura y salinidad, por ejemplo) como losbiológicos (alimentación, depredación, etc.) pueden afectar el reclutamiento. Ya que la super-vivencia antes del reclutamiento es controlada probablemente por una combinación de estos fac-tores, el programa de investigación toma en cuenta la interacción entre el sistema biológico y elambiente físico (Informe de Datos 9 de la CIAT).
Proyecto conjunto OFCF-Panamá-CIAT
En diciembre de 1993, la Overseas Fishery Cooperation Foundation (OFCF) del Japón, elgobierno de la República de Panamá, y la CIAT acordaron emprender un proyecto conjunto decinco años de duración, subvencionado principalmente por la OFCF, en el Laboratorio deAchotines. En 1998 se extendió el proyecto dos años más, y en 1999 se acordó extenderlo hastamarzo de 2001. Los objetivos del proyecto fueron: (1) criar atunes aleta amarilla adultos parasuministrar larvas y juveniles para la investigación de su ciclo vital temprano; (2) producir organ-ismos de alimento para los atunes larvales y juveniles; y (3) criar pargos (Lutjanidae) y corvinasy especies afines (Sciaenidae) reproductores y organismos de alimento para sus larvas y juveniles.
Fue necesario ampliar y mejorar la infraestructura del Laboratorio para poder llevar a cabolos objetivos del proyecto. Se construyeron los seis tanques siguientes, todos de hormigón y hun-didos en la tierra:
Tanque Diámetro (metros) Profundidad (metros) Capacidad (litros)1 17,0 6,0 1.361.9002 8,5 3,0 170.2003 8,5 1,5 85.1004 8,5 1,5 85.1005 8,5 1,5 85.1006 8,5 3,0 170.200
Se construyeron también un muelle y una rampa para botar los barcos al agua.El proyecto terminó el 31 de marzo de 2001. Se prosigue la investigación de la CIAT del
ciclo vital temprano de los atunes, y la Dirección General de Recursos Marinos de Panamá con-tinúa su trabajo con la cría de pargos y corvinas.
Aletas amarillas reproductores
Se capturaron con anzuelo aletas amarillas de entre 2 y 7 kg en aguas costeras adyacentesal Laboratorio de Achotines para establecer la población de reproductores en el mismo. Se usaronlos protocolos estándar de años previos para transportar, trasladar, marcar, pesar, y medir losespecímenes capturados. Cada uno fue marcado con una marca con microprocesador implan-tada en la musculatura dorsal e inyectado con oxitetraciclina (OTC) para establecer una marcatemporal en los otolitos y vértebras. Las marcas permitieron identificar a los peces individ-uales durante todo el cautiverio, y la inyección con OTC facilitó los estudios del crecimiento delos peces. Se sumergió a todos los peces en soluciones diluidas de formol y nifurestirenato desodio (NFS), un agente antimicrobiano, durante varias horas para tratar cualquier infección de

la piel causada por la captura y traslado.Durante 1997-2001 se mantuvieron los aletas amarillas colocados en los tanques de repro-
ductores grande (Tanque 1) y de reserva (Tanque 2) en 1996. Se vigiló la dieta de los reproduc-tores en el Tanque 1 para asegurar que proporcionase suficiente energía para soportar tasaselevadas de crecimiento y desove, pero sin causar una deposición excesiva de grasa. Se usó el com-portamiento de alimentación de los peces y estimaciones de su biomasa como base para deter-minar las raciones diarias. Se usó información de análisis de la cantidad de proteína, humedad,grasa, y ceniza en los organismos alimenticios y en los peces reproductores (obtenidos por un lab-oratorio en Aguadulce (Panamá) de muestras de cada grupo taxonómico de los organismos de ali-mento y de aletas amarillas muertos o sacrificados) para ajustar el alimento. Los organismosalimenticios incluyeron calamares (Loligo spp. o Illex argentinus), anchovetas (Cetengraulis mys-ticetus), machuelos (Opisthonema spp.), y anchoas Anchovia macrolepidota, con suplementos devitaminas y bilis en polvo. En promedio, las anchovetas contuvieron un 64% más de calorías, ylos machuelos un 116% más, que los calamares. Ajustando las cantidades y proporciones decalamar y pescado en la dieta, se mantiene la cantidad de alimento en un nivel suficientementealto para evitar actividad frenética al alimentarse los peces, pero sin rebasar demasiado los req-uisitos para el metabolismo, crecimiento, reproducción, y pérdidas por desperdicios. Durante2001 los peces en el Tanque 1 fueron alimentados a un nivel de alrededor del 2,0 al 4,5% de supeso por día.
Durante el año fueron transferidos al Tanque 1 11 aletas amarillas jóvenes parareabastecer la población reproductora, reducida a cinco peces, todos del grupo inicial en el tanquedesde 1996. Fueron identificados por su número de marca, medidos, pesados, e inyectados conoxitetraciclina antes de ser introducidos en el tanque. Su talla varió de 63 a 93 cm y su peso de 6a 20 kg. En el momento de ser introducidos en el Tanque 1 había peces que quedaban de losgrupos de aletas amarillas introducidos en el tanque durante 1996, 1999, y 2000. Al fin del añohabía 19 peces en el tanque, uno introducido en 1999, 8 en 2000, y 10 en 2001. Durante el añomurieron 13 peces, tres a causa de inanición, y los demás como resultado de golpes con la pareddel tanque. Se ajustaron modelos de crecimiento a los datos de talla y peso de los peces en elmomento de ser introducidos en el tanque y al morir o ser sacrificados, y se calcularon estima-ciones diarias de la talla y peso a partir de los modelos. La talla y peso estimados de los peces enel Tanque 1 al fin del año fueron:
Número Rango de talla (cm) Rango de peso (kg)Peces muy grandes 1 138 60Peces medianos 8 116-123 35-43Peces pequeños 10 70-99 9-27
Se estimó la biomasa en el Tanque 1 al fin de año en 0,36 kg/m3, algo inferior al nivel objetivo orig-inal de 0,50 kg/m3 para la población reproductora.
Se mantuvieron los aletas amarillas en los Tanques 2 y 6 en reserva para incrementar lapoblación de reproductores en el Tanque 1 en caso necesario. Se usaron 6 de los peces en unexperimento con marcas archivadoras (véase bajo MARCADO DE ATUNES). Aletas amarillasde entre 49 y 71 cm y 2,3 y 6,8 kg fueron capturados en el mar, transportados al laboratorio, ycolocados en el Tanque 2 ó 6; cada uno fue medido, pesado, inyectado con oxitetraciclina, y mar-cado con marca de microprocesador implantada. Fueron alimentados con una dieta de calamar yarenque a entre el 5 y 8% del peso del cuerpo por día. Al fin del año había 7 peces nuevamentecapturados en el Tanque 2 y 14 en el Tanque 6. Se usarán estos peces en otros experimentos conmarcas archivadoras a principios de 2002.
INFORME ANUAL 2001 121

122 COMISION DEL ATUN
Desove de atún aleta amarilla
En 2001 los aletas amarillas en el Tanque 1 desovaron diariamente durante el año entero.La temperatura del agua en el tanque varió de 24,5° a 29,0°C durante el año. El desove tuvo lugarentre las 1225 y 1820 horas, y fue generalmente precedido por comportamiento de cortejo (nat-ación en pareja, persecución).
El número de huevos fertilizados recogido tras cada desove osciló entre unos 30.000 y2,800,000. Se usaron varios métodos para recoger los huevos en la superficie, entre ellos sifonesy salabardos y una red de malla fina.
Para cada evento de desove se registraron los parámetros siguientes: hora de desove,diámetro de los huevos, duración de la etapa de huevo, tasa de eclosión, talla de las larvas, yduración de la etapa de saco vitelino. Periódicamente se registró también el peso de los huevos yde larvas en etapa de saco vitelino y primera alimentación y la talla y morfometría seleccionadade larvas en primera alimentación. Se incorporó esta información en una base de datos para unanálisis de los parámetros de desove y los factores físicos o biológicos que podrían afectar el desove(por ejemplo, temperatura del agua, salinidad, ciclo lunar, tamaño medio de los peces que desovan,y la ración media diaria de los mismos).
Se realizaron varias pruebas para examinar el efecto de tratamientos probióticos (típica-mente bacterias Gram-positivas) y antibióticos sobre la tasa de eclosión de los huevos de aletaamarilla. Para fines de comparación, se usaron tanques de incubación replicados sin tratamientocomo controles, y se trataron los demás tanques replicados con una solución de oxitetraciclina obacterias probióticas. Los resultados de estas pruebas indicaron que la tasa de eclosión fue sim-ilar para los dos tratamientos y para los controles.
Comparación de dietas para el aleta amarilla
En noviembre de 2000 se inició un experimento para comparar las dietas de aletas amar-illas en cautiverio. Se compararon dos dietas: (1) 50% arenque y 50% calamar y (2) alimento gran-ular seco. Se asignaron al azar 22 aletas amarillas, de entre 55 y 83 cm y 4,5 y 13,4 kg, al Tanque2 (12 peces) o al Tanque 6 (10 peces). Se alimentó a los peces en el Tanque 2 con la dieta dearenque y calamar a un nivel de aproximadamente 3,0% del peso de cuerpo por día, y a los pecesen el Tanque 6 con el alimento seco hasta saciarlos (aproximadamente 1,0% del peso de cuerpopor día). Durante los 5 meses del experimento murieron cinco peces. En marzo de 2001 se sac-aron los 17 peces restantes de los tanques para pesarlos y medirlos. Se sacrificaron tres peces decada tanque para un análisis químico posterior, y otro fue sacrificado por motivo de mala salud.La supervivencia al cabo de 5 meses de los peces de los dos tratamientos de alimento fue similar.Cuatro de los peces restantes fueron devueltos al Tanque 2 para seguir con la dieta de alimentogranulado y ver si llegarían a ser reproductivamente activos. Aunque los peces de este grupo nodesovaron, algunos de éllos mostraron indicios de maduración de las gónadas antes de ser sacrifi-cados, al cabo de varios meses. Se implantaron marcas archivadoras en los seis peces restantes yfueron colocados en el Tanque 6 para los experimentos descritos bajo MARCADO DE ATUNES.
Estudios de laboratorio del crecimiento y alimentación de aletas amarillas larvales yjuveniles
Durante 2001 se realizaron varios experimentos diseñados para examinar los efectos dedensidad de peces, intensidad de luz, y antibióticos y probióticos sobre la incidencia de ali-mentación, supervivencia, y crecimiento de aletas amarillas larvales y juveniles tempranos.

Se realizaron dos experimentos para estimar el efecto de la densidad sobre el crecimientode larvas en etapa tardía (10 a 19 días después de la eclosión). Previamente se realizaron exper-imentos para estimar este efecto para larvas en la primera etapa de alimentación (3-7 días despuésde la eclosión), y los resultados indicaron que el crecimiento es más rápido con menor densidad.Los resultados de los experimentos con las larvas mayores indican efectos similares.
Se supone, con base en los resultados de unos pocos estudios publicados, que los atunes lar-vales y juveniles tempranos se alimentan solamente de día. En 2000 se examinó la capacidad dealimentación diurna en larvas en la primera semana de alimentación, y los resultados prelim-inares indicaron que las larvas se alimentan solamente de día. En junio de 2001 se llevó a caboun experimento diseñado para examinar esta capacidad en el aleta amarilla juvenil (20 díasdespués de la eclosión). El contenido del estómago de estos juveniles indicó asimismo que se ali-mentaron solamente de día. Se analizarán muestras de ambos experimentos para examinar lastasas de evacuación gástrica de larvas y juveniles de aleta amarilla bajo condiciones de fotoperíodonatural simuladas.
Se criaron varios grupos de aletas amarillas más allá de la metamórfosis juvenil. Laduración máxima del período de cría de un aleta amarilla durante el año fue 8 semanas despuésde la eclosión.
Hacia fines de 2001 se realizaron estudios para comparar los efectos de antibióticos y pro-bióticos sobre cultivos de rotíferos y sobre la supervivencia de larvas de aleta amarilla. Los cul-tivos de rotíferos son caracterizados por una flora bacterial abundante y compleja. Se esperó quemediante el tratamiento de rotíferos y larvas con antibióticos o probióticos disminuiría la ocur-rencia de bacterias patogénicas Gram-negativas, mejorando la producción de rotíferos y pro-moviendo una mayor supervivencia de larvas de aleta amarilla cultivadas. Los experimentosfueron realizados por el Sr. Patrick Tracy, estudiante de posgraduado en el Colegio Rosenstiel deCiencia Marina y Atmosférica de la Universidad de Miami, trabajando en colaboración con cientí-ficos de la CIAT y miembros del personal del laboratorio. Observaciones preliminares indicaronque el tratamiento probiótico podría incrementar la producción de rotíferos, pero son necesariasmás pruebas.
Se realizaron además tres experimentos para examinar el efecto de tratamientos pro-bióticos y antibióticos sobre la supervivencia de larvas de aleta amarilla después de los ochoprimeros días de alimentación. Se trató a las larvas en los tanques de cría con una solución pro-biótica o antibiótica, o no fueron tratados (controles). Los resultados preliminares de estos exper-imentos indicaron que, en la mayoría de las pruebas, los probióticos o antibióticos parecieronmejorar ligeramente la supervivencia de las larvas. Sin embargo, los resultados no fueron con-cluyentes y se decidió realizar más pruebas a principios de 2002.
Estudios de genética de aletas amarillas cautivos
Se han tomado muestras genéticas de los aletas amarillas reproductores y sus huevos ylarvas para determinar el grado de variación genética en los adultos y sus crías. Este estudio esllevado a cabo por científicos de la CIAT, la OFCF de Japón, y el National Research Institute ofFar Seas Fisheries de Japón. Se toma una muestra para análisis genético de todo pez repro-ductor nuevo introducido en la población cautiva. Durante 2001 se realizó un análisis devariación genotípica con muestras tomadas de reproductores, huevos, y larvas entre agosto de1999 y agosto de 2000. El análisis identificó nueve genotipos comunes a las hembras reproduc-toras, y a los huevos y larvas, con dos tipos compartidos por dos hembras. Se determinaron losperfiles de desove de estas hembras mediante la observación de la ocurrencia de estos genotiposen sus crías. Normalmente desovaron varias hembras en un solo día, y se observaron los
INFORME ANUAL 2001 123

124 COMISION DEL ATUN
mismos genotipos en casi todos los días de muestreo durante el año. Los resultados indicaronque algunas hembras eran capaces de desovar casi a diario durante períodos extendidos siempreque la temperatura del agua permaneciese en el rango adecuado y tuviesen suficiente alimento.Continuará en 2002 el muestreo genético de los reproductores, huevos, y larvas.
Estudios de la visión de atunes aleta amarilla y barrilete negro
En junio de 2001 se inició un estudio para examinar la sensibilidad espectral de la visión enlos atunes aleta amarilla y barrilete negro. La investigación fue realizada por los Dres. WilliamMcFarland, de la Universidad de Washington, y Ellis Loew, de la Universidad Cornell, en colabo-ración con un científico de la CIAT. El estudio fue diseñado para identificar los tipos de célulasfotoreceptoras presentes en varias etapas del ciclo vital del aleta amarilla y en los barriletesnegros adultos. La investigación se enfocó en las características de absorción espectral de los pig-mentos visuales presentes en cada tipo de célula fotoreceptora en la retina. Se usó un microe-spectrofotómetro para determinar la absorción del pigmento visual en células fotoreceptorasindividuales.
Se examinaron especímenes representativos de varias etapas del ciclo vital del aleta amar-illa, inclusive larvas tempranas y tardías, juveniles tempranos, y adultos, y varios especímenes debarrilete negro adulto. Se analizarán los datos resultantes para determinar si se puede relacionarla fotosensibilidad de ciertas etapas del ciclo vital con el comportamiento o con otras etapas delciclo vital.
Desove y cría de corvinas y pargos de la mancha
La investigación de las corvinas y pargos es realizada por la Dirección General de RecursosMarinos de Panamá.
Durante 1996 se capturaron corvinas colirrubia (Umbrina xanti) y pargos de la mancha(Lutjanus guttatus) para establecer poblaciones reproductoras en cautiverio.
En 1999 las últimas corvinas colirrubia reproductoras fueron liberadas en la Bahía deAchotines. Durante 2001 se continuaron los esfuerzos por reemplazar estos peces con reproduc-tores de una especie de corvina de tamaño y valor comercial mayores. Se mantuvo en un tanquede 12.000 L un grupo de corvinas colirrubia juveniles eclosionados en cautiverio en julio de 1999.Al fin del año estos peces medían unos 25 cm y pesaban unos 170 g, en promedio. Serán criadoshasta la fase adulta.
Los pargos de la mancha reproductores que comenzaron a desovar a fines de mayo de2002 desovaron dos ó tres veces por semana durante 2001. Se mantuvo en dos tanques de12.000 L un grupo de 40 peces criados en cautiverio en octubre de 1998. Al fin del año estospeces medían en promedio 46 cm de talla y pesaban 1,4 kg. Se criaron estos peces con la inten-ción de completar el ciclo vital de la especie en cautiverio y estudiar los patrones de crecimientoy requerimientos alimenticios de los juveniles.
Durante 2000 se capturaron nuevos reproductores de dos especies, corvina blanca(Cynoscion albus) y corvinatas de Stolzmann (C. stolzmani), y se mantuvieron en un tanque de85.100 L. Al principio de 2001 había 10 peces en el tanque, pero para mediados del año habíanmuerto todos a causa de infecciones o inanición. En 2002 se capturarán reproductores adi-cionales de ambas especies, y se usará la especie que sobreviva mejor en cautiverio para estu-dios de desove y cría.

OCEANOGRAFIA Y METEOROLOGIA
Los vientos de superficie de oriente que soplan casi constantemente sobre el norte deAmérica del Sur causan afloramiento de agua subsuperficial fría y rica en nutrientes a lo largo dela línea ecuatorial al este de 160ºO, en las regiones costeras frente a América del Sur, y en zonasde altura frente a México y Centroamérica. Los eventos de El Niño son caracterizados por vientossuperficiales de oriente más débiles que de costumbre, que llevan a temperaturas superficiales delmar (TSM) y niveles del mar elevados y una termoclina más profunda en gran parte del Pacíficooriental tropical (POT). Además, el Indice de Oscilación del Sur (IOS) es negativo durante estoseventos. (El IOS es la diferencia entre las anomalías en la presión atmosférica a nivel del mar enTahití (Polinesia Francesa) y Darwin (Australia) y es una medida de la fuerza de los vientos super-ficiales de oriente, especialmente en el Pacífico tropical en el hemisferio sur.) Los eventos de LaNiña, lo contrario de los eventos de El Niño, son caracterizados por vientos superficiales de ori-ente más fuertes que de costumbre, TSM y niveles del mar bajos, termoclina menos profunda, eIOS positivos. En la Figura 16 se ilustran los períodos de TSM normales y por encima y por debajode lo normal a lo largo de la línea ecuatorial entre 150°O y 180° durante 1950-2001. Fuepreparada de una tabla, producida por el Centro de Predicción Climática del ServicioMetereológico Nacional de EE.UU., que clasifica a las TSM en esa zona de muy cálidas (3 en lagráfica) a muy frías (-3 en la gráfica), cálidas o frías (2 ó -2), ligeramente cálidas o frías (1 ó -1), ynormales (0). (La clasificación es subjetiva, y se está explorando la posibilidad de crear un pro-cedimiento objetivo.) Las condiciones fueron normales, por lo general, de principios de 1951 amediados de 1954, de principios de 1959 a mediados de 1963, y de principios de 1976 a principiosde 1982. Desde entonces han sido superiores o inferiores a lo normal durante la mayoría de lostrimestres.
Cada uno de los cuatro eventos de El Niño durante el período de 1969-1983 fue seguido porun reclutamiento de atún aleta amarilla superior al promedio en el Pacífico oriental dos añosdespués (Japan. Soc. Fish. Ocean., Bull., 53 (1): 77-80), y el personal de la CIAT está estudiandodatos de años más recientes para ver si esta relación persiste y si vale para el atún barrilete y/o patudo.
Recientemente se elaboraron dos nuevos índices, el IOS* y el ION*, descritos en un trabajoque se publicará en la revista Progress in Oceanography. El IOS* es la diferencia entre las anoma-lías en la presión atmosférica a nivel del mar en 30°S-95°O (South Pacific High) y Darwin(Australia), y el ION* la misma diferencia entre 35°N-130°0 (North Pacific High) y Darwin.Ambos valores son negativos durante eventos de El Niño y positivos durante eventos de La Niña.
Las condiciones en el POT fueron esencialmente normales durante la mayor parte de2001, aunque las TSM estuvieron por encima de lo normal frente a Ecuador, Perú, y el norte deChile durante marzo y abril (Figura 17a) y por debajo del mismo desde Perú hasta 130°Odurante septiembre-diciembre (Figura 17b). Las TSM en el Pacífico central fueron general-mente inferiores a lo normal durante los cuatro primeros meses del año, pero generalmentesuperiores a lo normal durante los siete últimos (Tabla 13). Según el Climate DiagnosticsBulletin del Servicio Meteorológico Nacional de EE.UU. de diciembre de 2001, hubo en esemomento indicaciones de que podría estar desarrollándose un episodio de El Niño. “Desde juniode 2001 [las TSM] se han vuelto anormalmente cálidas en el Pacífico central ecuatorial, conanomalías cerca de +1°C en la línea de cambio de fecha al fin de diciembre.” Además, “seobservó un aumento sustancial en las anomalías de la temperatura subsuperficial en el Pacíficoecuatorial central y occidental-central durante diciembre. … Lo más probable parece ser quese desarrollen condiciones de episodio cálido en el Pacífico tropical en los próximos 3 a 6 meses.”
INFORME ANUAL 2001 125
126 COMISION DEL ATUN
EVALUACION DE LOS STOCKS DE ATUNES Y PECES PICUDOS
En los documentos preparados para la 69ª reunión de la CIAT, prevista para junio de 2002,se describen las evaluaciones de los stocks de aleta amarilla, barrilete, patudo, aleta azul, alba-cora, y pez espada azul realizadas por el personal de la CIAT en 2001. Dichos documentos seránpublicados en el Informe de Evaluación de Stocks 3 de la CIAT a fines de 2002.
DELFINES
En el Océano Pacífico oriental (OPO), los atunes aleta amarilla de entre unos 10 y 40 kg seasocian frecuentemente con mamíferos marinos, especialmente con delfines manchados (Stenellaattenuata), tornillos (Stenella longirostris), y comunes (Delphinus delphis y, posiblemente, D.capensis). En la Figura 18 se ilustran las distribuciones espaciales de los distintos stocks de estasespecies (D. capensis ocurre probablemente solamente dentro de la zona de distribución del stocknorteño del delfín común.) Los pescadores descubrieron que la mejor forma de lograr capturasmáximas de aleta amarilla con red de cerco en el OPO era buscar manadas de delfines o bandadasde aves marinas que se encuentran a menudo con delfines y atunes, calar la red alrededor de losdelfines y los atunes, cobrar la mayoría de la red, realizar una maniobra de retroceso para per-mitir a los delfines escapar sobre los corchos de la red, y finalmente cobrar el resto de la red ycargar el pescado a bordo del buque. La mortalidad incidental de delfines en esta operación fuealta en los primeros años de la pesquería, pero a partir de fines de la década de los 1980 disminuyóprecipitadamente, y desde mediados de la década siguiente se ha cifrado en un promedio annualde unos 2.000 animales, nivel insignificante en relación con el tamaño estimado de la poblacióntotal de estas especies.
Estimaciones de la mortalidad de delfines causada por la pesca
La estimación preliminar de la mortalidad incidental de delfines en la pesquería en 2001,basada en datos de viajes de buques atuneros cubiertos por observadores de todos los compo-nentes del Programa de Observadores a Bordo del Acuerdo sobre el Programa Internacionalpara la Conservación de los Delfines, es de 2.129 animales (Tabla 14), un aumento de 30% conrespecto a la mortalidad de 1.636 animales registrada en 2000. En las Tablas 15a y 15b sedetallan las mortalidades y sus errores estándar, por especie y stock, durante 1979-2001. Lasmortalidades de las principales especies afectadas por la pesquería disminuyeron durante laúltima década (Figura 19), al igual que las mortalidades de todos los delfines combinados(Figura 20). En la Tabla 14 se presentan también estimaciones de las abundancias de las variaspoblaciones de delfines en 1986-1990 y las mortalidades relativas (mortalidad/abundancia). Laspoblaciones con los niveles más altos de mortalidad relativa fueron el manchado nororiental ytornillo oriental (0,08% en cada caso).
El número de lances sobre atunes asociados con delfines por buques de la Clase 6 aumentóun 4%, de 9.235 en 2000 a 9.577 en 2001, y la captura medio de aleta amarilla por lance sobredelfines aumentó de 17,2 a 24,8 toneladas. La mortalidad promedio por lance (MPL) aumentó de0,17 delfines en 2000 a 0,22 delfines en 2001, pero la mortalidad por tonelada de aleta amarillacapturada disminuyó de 0,010 en 2000 a 0,009 en 2001. En la Figura 20 se ilustran las tendenciasen el número de lances sobre delfines, MPL, y mortalidad total en los últimos años. Los datos delnúmero de lances sobre delfines y las capturas de aleta amarilla en los mismos en 2001 sonasimismo preliminares.
En la Figura 21 se ilustra la distribución espacial estimada de la MPL durante 2001.Típicamente hubo zonas de MPL relativamente alta esparcidas por toda la zona de pesca, pero en2001 estuvieron concentradas más cerca de la costa.
Causas de mortalidad reciente de delfines
Tradicionalmente, se ha medido el desempeño de los pescadores con respecto a la reducciónde la mortalidad de delfines con variables tales como la MPL, el éxito en la liberación de losdelfines cercados (lances con mortalidad nula, número de delfines en la red después de la man-iobra de retroceso) y la reducción de factores que causan mortalidad elevada (averías mayores,abultamientos de la red, colapsos de la red, y otros). En la Figura 22a y la Tabla 16 se presentandatos sobre estas variables en 1986-2001 (bases de datos de la CIAT solamente). Determinar lasvariables que contribuyen a la ocurrencia de mortalidad incidental de delfines en la pesca con redde cerco constituye un aspecto importante de los esfuerzos para reducir dicha mortalidad.Estudios previos descubrieron que la mortalidad de delfines varía con la captura de atún, eltamaño de la manada de delfines cercada, la hora del lance (diurno y nocturno), la duración delmismo, la presencia de corrientes fuertes, averías del aparejo de pesca, y la presencia de abul-tamientos y colapsos de la red (Figura 22b). Los esfuerzos para reducir la mortalidad de delfinesse intensificaron después de la introducción de los Límites de Mortalidad por Buque (LMD) en1993, y la MPL siguió disminuyendo con respecto a los niveles anteriores a 1993 (Figura 20). Noobstante, sigue ocurriendo cierto nivel de mortalidad incidental. El personal de la CIAT está estu-diando datos de mortalidad de delfines con miras a determinar cuáles factores la causan. Esteanálisis preliminar abarca datos de 1993-2000.
Ya que en los últimos años tan pocos lances sobre delfines resultan en mortalidad de losmismos (Tabla 16), este análisis se enfoca en determinar las variables que aumentan la probabil-idad de que ocurra al menos una mortalidad en un lance dado durante faenas de pesca típicas. Porlo tanto, no se consideraron en el análisis lances con condiciones extremas, como un retrocesoextraordinariamente prolongado o una manada de delfines extremadamente grande. Las vari-ables consideradas incluyen: (1) condiciones ambientales (temporada del año, fuerza de la corri-ente); (2) zona de pesca (zonas con largo historial de pesca comparadas con zonas recientementeexplotadas); (3) problemas operacionales (averías, colapsos de la red, abultamientos de la red,cobertura del canal de retroceso por el paño de protección de delfines); (4) aspectos temporales delas operaciones de pesca (hora de inicio del lance, y duración del acercamiento, la caza, el encierro,el izado de la red, y el retroceso); (5) uso de equipo de rescate de delfines durante el retroceso (lan-chas, balsa, nadadores, buzos); (6) características de los animales cercados (peso del atún y especiey número de delfines cercados); (7) condiciones atmosféricas, como lluvia o niebla, que podríanafectar las faenas de pesca o la capacidad del observador de contar los delfines muertos. Se explo-raron las relaciones entre la probabilidad de al menos una mortalidad de delfines en un lance dadoy estas variables usando técnicas de regresión logística. Se analizaron los datos de cada uno delos ocho años por separado.
Los resultados preliminares señalan que la probabilidad de que ocurra al menos una mor-talidad de delfines por lance aumentó de forma predecible a través de los años en el caso de sola-mente cinco de las variables consideradas. Al igual que estudios previos, se descubrió que laprobabilidad de mortalidad de delfines aumentó de forma significativa con la presencia de unabultamiento de la red y, en menor grado, un colapso de la misma. Aumentó también con laduración del retroceso y el peso de atún capturado, y si hubo delfines tornillo o comunes pre-sentes en la manada capturada. En algunos años la probabilidad de mortalidad disminuyócuando el paño de protección de delfines cubrió el canal de retroceso adecuadamente, y a vecesaumentó con la presencia de una corriente fuerte. Además, en algunos años, hubo una relaciónsignificativa entre la duración del acercamiento y caza y la ocurrencia de mortalidad. Sinembargo, la dirección de los efectos del acercamiento y de la caza no fue consistente entre años,señalando que podrían ser espurios.
INFORME ANUAL 2001 127

De las cinco variables que consistentemente incrementaron la probabilidad de al menosuna mortalidad de delfines por lance, el efecto de la presencia de un abultamiento de la red es posi-blemente la más importante. Fue mayor que el efecto de un colapso de la red, de delfines tornilloo comunes en la red, y del peso de atún capturado, y a menudo mayor que el de duración de retro-ceso. Además, en general, los retrocesos prolongados contribuyeron más a la probabilidad de mor-talidad que las tres otras variables.
La estimación de la importancia relativa de las varias variables sobre la mortalidad dedelfines es complicada por la presencia de interacciones y la relación no lineal entre algunas deestas variables. Por ejemplo, se descubrió que la presencia de un abultamiento de la red aumentade forma no lineal con la duración del retroceso, aunque ambas variables contribuyen significati-vamente a la probabilidad de mortalidad. Los retrocesos prolongados suelen causar que el fondode la red suba hacia la superficie, la cual puede causar abultamientos de la red en los lados delcanal de retroceso. Los retrocesos prolongados pueden por lo tanto contribuir a una mayor prob-abilidad de mortalidad de delfines porque: (1) mantienen a los animales en contacto estrecho conla red durante períodos extendidos y (2) contribuyen a la formación de abultamientos. Por otrolado, la ocurrencia de un colapso de la red poca o ninguna relación con la duración del retroceso,debido probablemente a que el uso de lanchas para mantener la forma del canal de retroceso gen-eralmente ayuda a prevenir colapsos de la red durante el retroceso.
PROGRAMA DE ARTES DE PESCA
ALINEACIONES DEL PAÑO DE PROTECCION DE DELFINES
Durante 2001 el personal de la CIAT realizó alineaciones del paño de protección de delfinesy revisiones del equipo de protección de delfines en 24 buques, 23 de México y 1 de Venezuela.Para verificar la alineación del paño de protección se realiza un lance de prueba, durante el cualun técnico de la CIAT observa el funcionamiento de la red durante el retroceso desde una balsainflable. El técnico transmite sus observaciones, comentarios, y sugerencias al capitán del buquepor radio, y se procura resolver cualquier problema que surja. Posteriormente, se prepara uninforme para el armador o administrador del buque, en el cual se resumen los comentarios del téc-nico de la CIAT y, en caso necesario, las recomendaciones para mejorar el equipo de protección dedelfines del buque y/o la forma de usarlo.
SEMINARIOS DE REDUCCION DE MORTALIDAD DE DELFINES
La CIAT realiza desde 1980 seminarios para los pescadores sobre la reducción de mortal-idad de delfines. Están ideados no solamente para los capitanes de pesca, directamente encargadosde las faenas de pesca, sino también para otros tripulantes y para el personal administrativoresponsable del equipo y mantenimiento de los buques. Se presentan certificados de asistencia atodos los participantes. El personal de la CIAT dirigió cuatro seminarios durante 2001, dos en LaJolla y dos en Mazatlán (México), los dos últimos en conjunto con el programa nacional mexicano.En total 65 pescadores asistieron a los seminarios.
CONSTANCIAS DE PARTICIPACION
Las Constancias de Participación son proporcionadas a petición por el personal de la CIATa buques que llevan observadores del Programa de Observadores a Bordo del Acuerdo sobre el Programa Internacional para la Conservación de los Delfines (APICD). Hay dos tipos:el primero, emitido a buques de Partes del APICD solamente, certifica que el buque viene par-
128 COMISION DEL ATUN

ticipando en el PICD, y que todos sus viajes fueron acompañados por observadores; el segundo,emitido a buques de no Partes, certifica solamente que todos sus viajes fueron acompañados porobservadores. Durante 2001 se emitieron constancias del primer tipo para 124 viajes de pescarealizados por buques de Colombia, El Salvador, Estados Unidos, Guatemala, Honduras, México,Panamá, Vanuatu, y Venezuela, y del segundo tipo para 7 viajes de pesca de buques de Belice yGuatemala.
OTROS SERVICIOS
La CIAT brinda además otros servicios para ayudar a los gobiernos, gerentes de flota, yoperadores de buques individuales a reducir la mortalidad de delfines. En las oficinas regionalesde la CIAT se pueden obtener publicaciones y cintas de vídeo sobre el tema.
MEDIDAS PARA LA CONSERVACION DEL ATUN
ALETA AMARILLA
Una resolución adoptada en la 68ª reunión de la CIAT en junio de 2001 estableció un límitede 250.000 toneladas métricas sobre la captura de aleta amarilla para buques pescando con artesde superficie, con la opción de incrementar esta cuota a discreción del Director por un máximo detres incrementos de 20.000 toneladas cada una si, en su opinión, éstos no perjudicarían lapoblación. El 13 de septiembre de 2001, el Director informó a los Comisionados que se aplicaríael tercer y último incremento, para una cuota total de 310.000 toneladas, y que estimaba que sealcanzaría ese nivel de captura alrededor del 25 de octubre. El 11 de octubre informó a losComisionados que la fecha en la que se alcanzaría el límite sería el 27 de octubre, por lo que, apartir de esa fecha, las capturas de aleta amarilla por buques cerqueros serían limitadas al 15%de su captura total de atún. Los buques palangreros, cañeros, y de pesca deportiva no fueronsujetos a estas restricciones.
PATUDO
Una resolución adoptada en la 68ª reunión de la CIAT en junio de 2001 dispuso que la “Sevedará la pesquería cerquera que captura atún patudo si el Director determina … que la capturade atún patudo de menos de 60 cm ha alcanzado el nivel logrado en 1999, en cual caso notificaráa las Partes que la pesquería cerquera sobre objetos flotantes deberá ser vedada dos semanasdespués de dicha determinación. Sin embargo, en ningún caso será vedada la pesquería antes del1 de noviembre de 2001.” Antes del fin de año se hizo aparente que la captura de patudo de menosde 60 cm en 2001 sería menor que en 1999, por lo que no se instrumentó la resolución.
EL PROGRAMA INTERNACIONAL PARA LA CONSERVACION DE LOS DELFINES
El Acuerdo de La Jolla de 1992 formó el marco para los esfuerzos internacionales porreducir la mortalidad incidental de delfines en la pesquería atunera con red de cerco, e introdujomedidas novedosas y eficaces como los Límites de Mortalidad de Delfines (LMD) para buques indi-viduales y el Panel Internacional de Revisión para analizar el desempeño y cumplimiento de laflota atunera. En mayo de 1998 se firmó el Acuerdo sobre el Programa Internacional para laConservación de los Delfines (APICD), que amplía y formaliza las disposiciones del Acuerdo de LaJolla, y entró en vigor en febrero de 1999. Las Partes de este acuerdo se comprometieron a “ase-gurar la sostenibilidad de las poblaciones de atún en el Océano Pacífico Oriental y a reducirprogresivamente la mortalidad incidental de delfines en la pesquería de atún del Océano
INFORME ANUAL 2001 129

130 COMISION DEL ATUN
Pacífico Oriental a niveles cercanos a cero; a evitar, reducir y minimizar la captura incidental ylos descartes de atunes juveniles y la captura incidental de las especies no objetivo, considerandola interrelación entre especies en el ecosistema.”
La CIAT proporciona la Secretaría para el PICD y sus varios grupos de trabajo y coordinael Programa de Observadores a Bordo (integrado por los programas de observadores de la CIAT,Ecuador, México, y Venezuela) y el Sistema de Seguimiento y Verificación de Atún.
PANEL INTERNACIONAL DE REVISION
El Panel sigue un procedimiento general para reportar a los gobiernos correspondientessobre el cumplimiento por parte de las embarcaciones de las leyes y reglamentos establecidos paraminimizar la mortalidad de delfines durante las faenas de pesca. Analiza los datos recabados porlos observadores del Programa de Observadores a Bordo pertinentes al cumplimiento del APICD,e identifica posibles infracciones. Estas son reportadas por la Secretaría al gobierno pertinentepara investigación y posible acción. A su vez, los gobiernos informan a la Secretaría acerca de lasacciones que se hayan tomado con respecto a estas posibles infracciones.
El Panel celebró tres reuniones durante 2001, en enero, junio y octubre. Se pueden obtenerlas actas de las mismas en la página de internet de la CIAT (www.iattc.org), así como sus informesanuales, en el que se resumen las actividades, acciones y decisiones del Panel y se detallan las posi-bles infracciones identificadas para las distintas flotas nacionales.
LIMITES DE MORTALIDAD DE DELFINES
El límite de mortalidad de delfines (LMD) general establecido para la flota internacional en2001 fue de 5.000 animales, 100 de los cuales fueron reservados para asignación a discreción delDirector de la CIAT (APICD, Anexo IV (I) 6). La porción no reservada de 4.900 fue asignada a 82buques que solicitaron LMD y estaban calificados para recibirlo. El LMD promedio (LMDP) porbuque fue 59,75. De los 18 buques que no utilizaron su LMD antes del 1º de abril, 4 lo perdieron,pero a los demás se les permitió conservarlo durante el resto del año bajo la exención de fuerzamayor permitida por el APICD. En total 68 buques utilizaron su LMD durante el año. Tresbuques fueron asignados LMD de segundo semestre de 14 animales cada uno, pero ninguno lo uti-lizó. En la Figura 23 se ilustra la distribución de la mortalidad causada en 2001 por buques conLMD de año completo.
ENTRENAMIENTO Y CERTIFICACION DE CAPITANES DE PESCA
En el Artículo V del APICD se contempla el establecimiento, en el marco de la CIAT, de unsistema de entrenamiento técnico y certificación para los capitanes de pesca. Bajo este sistema,el personal de la CIAT es responsable de preparar y mantener una lista de todos los capitanes cal-ificados para pescar sobre delfines en el Pacífico oriental. Los nombres de los capitanes que sat-isfacen los requerimientos serán proporcionados al Panel para aprobación y circulación a lasPartes del APICD.
Los requerimientos para capitanes nuevos incluyen (1) asistencia a un seminario de entre-namiento organizado por el personal científico de la CIAT, o por el programa nacional competenteen coordinación con dicho personal, (2) participación en un lance de prueba que incluya observa-ciones directas del canal de retroceso, y (3) un componente de entrenamiento práctico, el cual con-siste en un viaje durante el cual se tiene la intención de pescar atún asociado con delfinesa bordo de un buque con LMD, acompañado por un capitán calificado o un asesor técnicoaprobado.

Cada año se reconoce a los tres capitanes de pesca con el mejor desempeño con respecto ala reducción de la mortalidad de delfines, basado en mediciones estándar aprobadas por las Partes.Durante 2001 fueron presentadas a los tres capitanes con el mejor desempeño en 2000 placas ycartas de felicitación destacando su contribución a la reducción de la mortalidad de delfines.
INFORMES DE MORTALIDAD DE DELFINES POR OBSERVADORES EN EL MAR
El APICD requiere que las Partes establezcan “un sistema, basado en los informes de losobservadores en tiempo real, para asegurar la aplicación y cumplimiento efectivos de los límitesanuales de mortalidad por población de delfines.” Se cumplió esta disposición requiriendo a todoslos observadores a bordo de buques atuneros con LMD a enviar semanalmente, por correo elec-trónico, fax, o radio, informes sobre la mortalidad de delfines por población. Hacia fines de 2001,cuando la mortalidad de ciertas poblaciones se aproximaba al límite, se incrementó la frecuenciade los informes a dos veces por semana. No obstante, por varios motivos la Secretaría recibió sola-mente un 50% de los informes requeridos. A falta de datos completos en tiempo real, se hicieronproyecciones de la mortalidad basadas en los datos disponibles, y éstas señalaron la necesidad derestricciones sobre la pesca para asegurar que no se rebasara ningún límite. Por lo tanto, laSecretaría recomendó a los gobiernos que se vedase la pesca de atunes asociados con la poblacióncentral del delfín común para el resto de 2001 a partir del 10 de diciembre, y a partir del 21 dediciembre para el delfín manchado de altamar nororiental.
De hecho, resultó que no fue rebasado el límite para el delfín común central (207) ni eldelfín manchado de altamar nororiental (648) por la mortalidad estimada (203 y 588, respectivamente).
SISTEMA DE SEGUIMIENTO Y VERIFICACION DE ATUN
En el Artículo V.1.f del APICD se dispone que se establezca un sistema de seguimiento yverificación de atún capturado con y sin mortalidad o heridas graves de delfines. Las Partes elab-oraron un sistema y un registro de seguimiento de atún (RSA) estándar que los observadores com-pletan en el mar. Hay dos versiones del RSA, idénticas aparte del encabezado; en el Formulario‘A’ se documenta atún capturado en lances sin mortalidad ni heridas graves de delfines (“dolphinsafe”), y en el Formulario ‘B’ atún capturado en lances con mortalidad o heridas graves de delfines(“no dolphin safe”). Dentro de este marco, cada Parte establece su propio sistema de seguimientoy verificación de atún, instrumentado y operado por una autoridad nacional, que incluye audi-torías periódicas y revisiones para productos atuneros capturados, descargados y procesados,mecanismos para comunicación y cooperación entre autoridades nacionales, y acceso oportuno adatos pertinentes. Se requiere que cada Parte remita a la Secretaría un informe describiendo el pro-grama establecido bajo su legislación y reglamento nacionales.
Se completaron RSA para todos los viajes observados de buques de Partes iniciados en 2001en los que se capturó atún, menos dos. En el caso de estos dos viajes, la Secretaría no proporcionólos RSA al observador porque no pudo constatar que los buques en cuestión estaban bajo la juris-dicción de una Parte en el momento de zarpar.
CERTIFICADOS DOLPHIN SAFE
En la quinta reunión de las Partes del APICD en junio de 2001 se adoptó una resoluciónestableciendo procedimientos para la certificación dolphin safe de atún del Pacífico oriental.Estos certificados son producidos por la Secretaría y proporcionados a las Partes del APICD, quea su vez los emiten para cargamentos de atún capturado sin mortalidad ni daños graves a delfines.En 2001 fueron emitidos 19 de estos certificados.
INFORME ANUAL 2001 131

PUBLICACIONES
La publicación pronta y completa de los resultados de la investigación es uno de los ele-mentos más importantes del programa científico de la CIAT. Por este medio los gobiernos miem-bros, la comunidad científica, y el público en general se mantienen informados de los resultadosde las investigaciones realizadas por los científicos de la CIAT. La publicación de datos básicos,métodos de análisis, y las conclusiones resultantes permiten que otros investigadores evalúen ycritiquen los estudios, lo que sirve para verificar la validez de los resultados obtenidos por el per-sonal de la CIAT y despertar el interés de otros investigadores en su labor. Al fin de 2001 el per-sonal de la CIAT había publicado 147 boletines, 50 Informes Anuales, 13 Informes Especiales, 10Informes de Datos, 1 Informe de Evaluación de Stocks, 9 libros, y 523 capítulos, trabajos, yartículos en libros y revistas externas. En el Anexo 3 del presente informe se detallan las con-tribuciones del equipo de investigadores publicadas durante 2001.
SITIO DE INTERNET
La CIAT mantiene un sitio de internet (www.iattc.org), en español e inglés, a través del cualel público tiene acceso a información actual sobre las actividades de la Comisión. El sitio incluye,entre otros, documentos relacionados con la CIAT y el Acuerdo sobre el Programa Internacionalpara la Conservación de los Delfines (APICD), una lista de los países miembros y los Comisionadosde la CIAT, una lista del personal de la CIAT, detalles de reuniones recientes y futuras de la CIATy el APICD y sus grupos de trabajo respectivos, los documentos, agendas, y actas o informes dereuniones recientes de las mismas, las agendas provisionales de reuniones futuras, resolucionesrecientes de la CIAT y el APICD, estadísticas pertinentes de las pesquerías atuneras en el OcéanoPacífico oriental, información actualizada sobre medidas para la conservación del recurso atunero,Informes Trimestrales recientes de la CIAT, e información sobre las publicaciones de la CIAT.
COLABORACION CON ENTIDADES AFINES
Durante 2001 el equipo de investigadores de la CIAT continuó desarrollando vínculos estre-chos con organizaciones e instituciones de investigación internacionales, gubernamentales, uni-versitarias, y privadas. Esta reciprocidad permite a los investigadores mantenerse al corriente delos avances más actuales en la investigación pesquera y oceanográfica a nivel mundial. A contin-uación se describen algunos aspectos de estas relaciones.
Las oficinas principales de la CIAT se encuentran situadas en los terrenos del ScrippsInstitution of Oceanography (SIO) de la Universidad de California en La Jolla, California, uno delos principales centros mundiales de ciencias marinas y sede de varias agencias gubernamentalesfederales y estatales de pesca, oceanografía, y ciencias afines. Esta situación fomenta un contactofrecuente entre los investigadores de la CIAT y los científicos de estas entidades. El Dr. RichardB. Deriso fue catedrático del SIO durante 2001.
El Dr. Deriso fue también miembro de la cátedra en la Universidad de Washington enSeattle, Washington (EE.UU.), el Dr. Martín A. Hall en la Universidad de Columbia Británica enVancouver (Canadá), el Dr. Michael G. Hinton en la Universidad de San Diego, California(EE.UU.), y el Dr. Pablo R. Arenas en el Centro Interdisciplinario de Ciencias Marinas (CICIMAR)del Instituto Politécnico Nacional en La Paz (México). Los Dres. Arenas, Deriso, Hall, Hinton, yRobert J. Olson sirvieron en comités supervisores de las investigaciones de estudiantes de post-graduado en varias universidades durante 2001.
132 COMISION DEL ATUN

Durante muchos años se han mantenido relaciones cordiales y productivas con la Comisiónpara la Conservación del Atún Aleta Azul del Sur (CCSBT), la Comisión Internacional para laConservación del Atún Atlántico, la Comisión Permanente del Pacífico Sur, la Organización de lasNaciones Unidas para la Agricultura y la Alimentación (FAO), la Comisión del Atún del OcéanoIndico (IOTC), la Organización Latinoamericana de Desarrollo Pesquero (OLDEPESCA), elSecretariado de la Comunidad de Pacífico (SPC), y otros organismos internacionales. El Dr. RobinAllen presidió la segunda reunión de Entidades Regionales de Pesca de FAO y otras. Además, elDr. Allen y el Sr. Brian S. Hallman participaron en conferencias para el establecimiento de laComisión creada por la nueva Convención sobre la Conservación y Ordenación de Poblaciones dePeces Altamente Migratorios en el Océano Pacífico Occidental y Central. La CIAT es miembro delGrupo de Trabajo Coordinador sobre Estadísticas de Pesca de FAO, y el Dr. Hinton participó enuna reunión del mismo en 2001. El Dr. Hinton fue también miembro de varios grupos de trabajodel Comité Permanente sobre Atunes y Peces Picudos de la SPC y del Comité Organizador deTercer Simposio Internacional sobre Peces Picudos, celebrado en agosto de 2001. Los Dres. MarkN. Maunder y George M. Watters participaron, con científicos del Instituto Nacional deInvestigación de Pesquerías de Ultramar del Japón y la SPC, en un proyecto cooperativo paraevaluar la condición de las poblaciones de atún patudo en el Océano Pacífico. Este programa esfinanciado por el Programa de Investigación de Pesquerías Pelágicas de la Universidad de Hawaii.El Dr. Watters participó también en una reunión técnica patrocinada por la CICAA sobre el diseñoy desarrollo de un modelo estadístico que la CICAA piensa usar en evaluaciones futuras de laspoblaciones del atún patudo del Atlántico.
Asimismo durante 2001, el personal de la CIAT continuó su estrecha colaboración con lasagencias pesqueras de países miembros de la CIAT y con organismos similares de diversos paísesno miembros. El Dr. Richard B. Deriso fue miembro del Comité Científico y Estadístico delConsejo de Administración de Pesquerías del Pacífico Occidental de Estados Unidos. El Dr. MarkN. Maunder trabajó con el Dr. Chi-Lu Sun de la Universidad Nacional de Taiwan en la aplicaciónde A-SCALA, el método usado para evaluar las poblaciones de atunes en el Pacífico oriental, alatún patudo en el Pacífico occidental y central. El Dr. Michael G. Hinton y el Dr. Pierre M.Kleiber, del Servicio Nacional de Pesquerías Marinas (NMFS) de EE.UU., realizaron un análisisde la condición del marlín azul en el Pacífico entero. El Dr. Hinton es miembro delPanel Asesor Argo de Estados Unidos como representante para aplicaciones a la investigación dela oceanografía pesquera. Los Dres. Robert J. Olson y George M. Watters colaboraron con colegasdel Instituto Nacional de Investigación de Pesquerías de Ultramar (NRIFSF) del Japón para usarlos datos de cinco aletas azules marcados con marcas archivadoras para parametrizar un modelode bioenergética para la especie. Los Dres. Olson and Watters fueron miembros del Grupo deTrabajo sobre Modelos de Políticas Alternativas de Ordenación para Ecosistemas Marinos,patrocinado por el Centro Nacional para Análisis y Síntesis Ecológicos (NCEAS), subvencionadopor la Fundación Nacional de Ciencia de EE.UU. y el Estado de California. La beca otorgada porel NCEAS paga una serie de reuniones técnicas sobre modelos de ecosistemas para identificarenfoques robustos para incorporar consideraciones ecológicas en los objetivos de ordenación paracinco ecosistemas marinos grandes en el Océano Pacífico, inclusive el Pacífico oriental tropical. ElDr. Olson y el Dr. Felipe Galván Magaña, del Centro Interdisciplinario de Ciencias Marinasde México, continuaron su estudio conjunto de las interacciones tróficas de atunes aletaamarilla, delfines, y depredadores asociados en el Océano Pacífico oriental, descrito en lapágina 238 del Informe Anual de la CIAT de 1995. El Sr. Kurt M. Schaefer y el Sr. NaozumiMiyabe, del NRIFSF, realizaron investigaciones conjuntas de la biología reproductora delatún patudo en el OPO. El Dr. Ashley J. Mullen fue Editor Asociado de Natural Resource
INFORME ANUAL 2001 133

Modeling, revista publicada por el Rocky Mountain Mathematics Consortium en asociación conla Resource Modeling Association. El Dr. Michael D. Scott fue Presidente del Pacific ScientificReview Group, responsable de revisar las normas de ordenación y programas de investigaciónde EE.UU. de mamíferos marinos en el Océano Pacífico. El Dr. Scott and Mr. David A. Brattenparticiparon en investigaciones de los efectos del estrés en delfines manchados y tornillos concientíficos del NMFS, la Universidad Duke, la Universidad de Carolina del Norte enWilmington, la Universidad de Washington, la Universidad Nacional Autónoma de México, laMarina de EE.UU., y el Acuario Mystic, más varios científicos no afiliados. Durante 1999-2001investigadores del Monterey Bay Aquarium, que estaban capturando atunes aleta azul frente aBaja California para varios estudios científicos, colocaron marcas de dardo de la CIAT en pecesdemasiado pequeños para sus propósitos y los liberaron. Las marcas en los peces recapturadosfueron devueltas al personal de la CIAT, y la información sobre las mismas fue añadida a la basede datos de marcado de la CIAT.
Desde 1977 los investigadores de la CIAT capacitan observadores para la toma, a bordo debarcos atuneros, de datos sobre la abundancia, mortalidad, y otros aspectos de la biología de losdelfines. Estos observadores recolectan también contenidos estomacales y muestras de gónadas yotros tejidos de atún, reúnen datos sobre las capturas incidentales de especies además de atunesy delfines, registran información sobre objetos flotantes y la flora y fauna con éllos asociadas,etcétera. Además, durante 2001 tomaron muestras de tejido de delfines para estudios de estrésrealizados por el Servicio Nacional de Pesquerías Marinas de EE.UU. Diversas organizacionesgubernamentales e instituciones educativas, así como representantes del sector industrial, hancolaborado activamente en el entrenamiento y embarque de estos observadores. México estableciósu propio programa de observadores en 1991, y Ecuador y Venezuela en 2000. Durante 2001 elSr. Ernesto Altamirano Nieto ayudó con el entrenamiento de los observadores ecuatorianos, y elSr. Nickolas W. Vogel trabajó con miembros del programa ecuatoriano en la incorporación de pro-gramas de computadora para la captura y edición de datos y el establecimiento de bases de datossimilares a las que usa el personal de la CIAT. De esta forma se posibilitará el intercambio eficazde datos entre los programas.
A través de los años, científicos de la CIAT que viajan a otros países por razones profesion-ales con frecuencia ayudan a los científicos de aquellos países con sus investigaciones relacionadasa la pesca del atún, y de vez en cuando viajan con el propósito específico de enseñar o prestarayuda en programas de investigación. Asimismo, científicos y estudiantes de muchos países hanrealizado visitas de distintas duraciones a la oficina principal y el Laboratorio de Achotines de laCIAT, para informarse sobre métodos de investigación o utilizar las instalaciones y datos de laCIAT para sus estudios. Además, desde 1963 científicos japoneses han realizado visitas largas a lasede de la CIAT en La Jolla, donde colaboran con miembros del personal de la CIAT en análisisde datos de la pesquería palangrera japonesa de atunes y peces picudos en el Pacífico oriental. Enel Anexo 1 se detallan aquéllos cuyas visitas duraron más de 10 días.
Hacia fines de 1993, la Overseas Fishery Cooperation Foundation (OFCF) del Japón, el gob-ierno de la República de Panamá, y la CIAT acordaron emprender un proyecto conjunto de cincoaños de duración, subvencionado principalmente por la OFCF, en el Laboratorio de Achotines. Elproyecto, cuya fase inicial comenzó en 1994, abarca la investigación de la viabilidad de criaratunes aleta amarilla adultos, corvinas y especies afines, y pargos para suministrar larvas para lainvestigación, y la producción de organismos de alimento para sus larvas y juveniles. En la sec-ción titulada Estudios del ciclo vital temprano se describe este proyecto. Se extendió el fina-ciamiento por la OFCF dos veces, pero terminó el 31 de marzo de 2001.
A través de los años, técnicos de la CIAT han colectado muestras de tejido y partes duras
134 COMISION DEL ATUN

de atunes y peces picudos para usar en estudios de genética llevados a cabo por científicos de otrasentidades. Durante 2001 fueron tomadas muestras de tejido de peces espada para elDepartamento de Biología Marina de la Texas A & M University en Galveston, Texas (EE.UU.)
Miembros del personal de la CIAT son también activos en sociedades profesionales.Durante 2001 el Dr. Martín A. Hall fue miembro de la Junta Directiva del Centro Nacional deConservación de Pesquerías, el Dr. Michael G. Hinton fue Director del Distrito de California delSur del American Institute of Fishery Research Biologists, y el Dr. Daniel Margulies sirvió deRepresentante Regional del Oeste de la Sección del Ciclo Vital Temprano de la AmericanFisheries Society.
INFORME ANUAL 2001 135
136 TUNA COMMISSION
APPENDIX 1−−ANEXO 1
STAFF−−PERSONAL
HEADQUARTERS−−SEDEDIRECTOR
Robin Allen, Ph.D. (University of British Columbia)
SCIENTIFIC AND TECHNICAL−−CIENTIFICO Y TECNICO
Chief Scientists−−Científicos Dirigentes
Tuna-Billfish Program−−Programa Atún-PicudoRichard B. Deriso, Ph.D. (University of Washington)
Tuna-Dolphin Program−−Programa Atún-DelfínMartín A. Hall, Ph.D. (University of Washington)
Senior−−Principales
Fishery biology−−Biología pesqueraPablo R. Arenas, Ph.D. (University of Washington) William H. Bayliff, Ph.D. (University of Washington)David A. Bratten, B.S. (San Diego State University)Michael G. Hinton, Ph.D. (University of California at San Diego)Witold L. Klawe (emeritus), M.S. (University of Toronto)Cleridy E. Lennert-Cody, Ph.D. (University of California at San Diego)Daniel Margulies, Ph.D. (University of Maryland)Mark N. Maunder, Ph.D. (University of Washington)Ashley J. Mullen, Ph.D. (University of London)Robert J. Olson, Ph.D. (University of Wisconsin)Kurt M. Schaefer, M.S. (San Diego State University)Michael D. Scott, Ph.D. (University of California at Los Angeles)Patrick K. Tomlinson, B.S. (Humboldt State University)George M. Watters, Ph.D. (University of California at San Diego) (to September 14−hasta 14 de septiembre)
Fishery management−−Ordenación de pesqueríasBrian S. Hallman, M.A. (Johns Hopkins University)
Associate−−Asociados
Fishery biology−−Biología pesqueraErnesto Altamirano Nieto, B.S. (Universidad Autónoma de Baja California)Edward H. Everett, B.A. (San Jose State University)Jenny M. Suter, B.S. (University of California at Davis)Jeanne B. Wexler, B.S. (Humboldt State University)

Computer systems and data base management−−Administración de sistemas de cómputo y de bases de datos
Robert B. Kwan, B.A. (University of California at San Diego)Milton F. López, B.S. (University of Rhode Island)Mauricio X. Orozco Z., Lic. (Escuela Superior Politécnica del Litoral) (from June 1−a partir de 1 de junio)Robert E. Sarazen, B.S. (California State University, Long Beach)Nickolas W. Vogel, B.A. (University of California at Santa Barbara)
Assistant−−Auxiliares
Fishery biology−−Biología pesqueraDaniel W. Fuller, B.S. (San Diego State University) Jorge B. Párraga Fernandez, Biól. (Universidad de Guayaquil) Lesly J. Rodríguez, Lic. (Universidad Nacional Autónoma de Nicaragua)Marlon H. Román Verdesoto, Biól. (Universidad de Guayaquil)Enrique Ureña Portales, B.S. (Universidad Autónoma de Baja California)
Fishery management−−Ordenación de pesquerías Joshue Gross, LL.M. (American University) (from March 12−a partir de 12 de marzo)
Technical support−−Apoyo técnicoSharon A. BookerJoanne E. BosterLaura J. BowlingMildred D. De los ReyesNancy L. HaltofSharon L. Hunt, M.S. (Humboldt State University) JoyDeLee C. Marrow, B.A. (University of California at San Diego)Christine A. Montez, A.A. (Platt College of San Diego) Nicholas J. Webb, B.A. (University of York)
ADMINISTRATIVE−−ADMINISTRATIVO
Secretarial−−SecretaríaJacqueline Castañeda (from November 6−a partir de 6 de noviembre)Mónica B. Galván Martha L. Gómez, B.A. (Universidad de los Andes) (to October 31−hasta 31 de octubre)Berta N. Juárez
Accounting−−ContabilidadDaniel R. Lilly, B.S. (Marquette University) (to July 31−hasta 31 de julio)María Teresa Musano B.S. (Fundación Universidad Central)Nora Roa-Wade, B.S. (San Diego State University)
ANNUAL REPORT 2001 137

138 TUNA COMMISSION
FIELD OFFICES−−OFICINAS REGIONALES
LAS PLAYAS, ECUADOR
Fishery biology−−Biología pesqueraWilliam E. Paladines, Biól. (Universidad de Guayaquil) (in charge−encargado) Aldo X. Basantes Cuesta, Biól. (Universidad de Guayaquil) Felix F. Cruz Vargas, Biol. (Universidad de Guayaquil)
MANTA, ECUADOR
Fishery biology−−Biología pesqueraErick D. Largacha Delgado, Biól. (Universidad de Guayaquil) (in charge−encargado)Carlos de la A. Florencia, Biól. (Universidad de Guayaquil)Kruger I. Loor Santana, Biól. (Universidad de Guayaquil)
ENSENADA, MEXICO
Fishery biology−−Biología pesqueraEric E. Pedersen, B.S. (Humboldt State University) (in charge−encargado)José M. Lutt Manríquez, B.S. (Universidad Autónoma de Baja California)Alberto Morales Yañez, B.S. (Universidad Autónoma de Baja California)
MAZATLAN, MEXICO
Fishery biology−−Biología pesqueraHector J. Pérez Bojórquez, B.S. (Universidad Autónoma de Sinaloa) (in charge−encargado)Victor M. Fuentes, B.S. (Universidad Autónoma de Sinaloa)César Maldonado González, B.S. (Universidad Autónoma de Sinaloa)
ACHOTINES, PANAMA
Fishery biology−−Biologia pesqueraVernon P. Scholey, M.S. (University of Washington) (in charge−encargado)Neil A. Bonilla Gaitán, B.S. (Universidad Nacional de Panamá)Luis C. Tejada, B.S. (Universidad Autónoma de Baja California)
Technical support−−Apoyo técnicoRoberto Yau (from March 6−a partir de 6 de marzo)
PANAMA, PANAMA
Fishery biology−−Biologia pesqueraAndris Purmalis, B.S. (University of Michigan) (in charge−encargado)Julio C. Guevara Quintana, Lic. (Universidad Nacional de Panamá)Ricardo A. López Rodríguez, Lic. (Universidad Nacional de Panamá)

MAYAGUEZ, PUERTO RICO, USAJuan A. Gracia, J.D. (Universidad Católica de Puerto Rico)
CUMANA, VENEZUELA
Fishery biology−−Biologia pesqueraArmando E. Carrasco Arévalo, B.S. (University of West Florida) (in charge−encargado)Emilio R. Cedeño Pérez, Lic. (Universidad de Oriente)
VISITING SCIENTISTS AND STUDENTS−−CIENTIFICOS Y ESTUDIANTESVISITANTES
HEADQUARTERS−−SEDEDr. Hiroaki Okamoto, National Research Institute of Far Seas Fisheries (January 1-30−
1-30 de enero)Dr. Yukio Takeuchi, National Research Institute of Far Seas Fisheries (January 1-
August 31−1 de enero hasta 31 de agosto)ACHOTINES LABORATORY−−LABORATORIO DE ACHOTINES
Dr. Ellis Loew, Cornell University (June 11-21−11-21 de junio)Dr. William McFarland, University of Washington (June 11-21−11-21 de junio) Mr. Yukiyasu Niwa, Overseas Fishery Cooperation Foundation, Tokyo, Japan (January 1-
March 15−1 de enero hasta 15 de marzo)Mr. Patrick Tracy, University of Miami (October 22-December 31-22 de octubre hasta31 de diciembre)
ANNUAL REPORT 2001 139

140 TUNA COMMISSION
AP
PE
ND
IX 2
−− AN
EXO
2
FIN
AN
CIA
L ST
ATE
ME
NT−−
DE
CLA
RA
CIO
N F
INA
NC
IER
A
INTE
R-A
ME
RIC
AN
TR
OP
ICA
L TU
NA
CO
MM
ISSI
ON
−− CO
MIS
ION
IN
TER
AM
ER
ICA
NA
DE
L AT
UN
TR
OP
ICA
L
Stat
emen
t of
ass
ets,
liab
iliti
es, a
nd fu
nd b
alan
ces,
Sep
tem
ber
30, 2
001−−
Dec
lara
ción
de
acti
vo, p
asiv
o, y
bal
ance
s de
los
fond
os, 3
0 de
sep
tiem
bre
de 2
001
Ass
ets−−
Act
ivo
Curr
ent a
sset
s−Ac
tivo
circ
ulan
teCa
sh a
nd c
ash
equi
vale
nts−
Efec
tivo
y eq
uiva
lent
es$
2,24
8,52
3Ac
coun
ts r
ecei
vabl
e−Cu
enta
s por
cob
rar
58,6
09Em
ploy
ee a
dvan
ces−
Antic
ipos
a lo
s em
plea
dos
121,
118
Tota
l cur
rent
ass
ets−
Activ
o to
tal c
ircu
lant
e2,
428,
250
Inve
stm
ents
(mar
ket v
alue
of $
114,
433
as o
f Sep
tem
ber
30, 2
001)
−Inv
ersi
ones
(val
or c
omer
cial
$11
4,43
3 al
30
de se
ptie
mbr
e de
200
1)30
,000
Real
pro
pert
y−Pr
opie
dad
raíz
400,
775
$ 2,
859,
025
Liab
iliti
es a
nd fu
nd b
alan
ces−−
Pasi
vo y
bal
ance
s de
los
fond
os
Curr
ent l
iabi
litie
s (ac
crue
d ex
pens
es a
nd o
ther
liab
ilitie
s)−P
asiv
o ci
rcul
ante
(cos
tos a
cum
ulad
os y
otr
os p
asiv
os)
$ 1,
232,
989
Fund
bal
ance
s−Ba
lanc
es d
e lo
s fon
dos
Gen
eral
fund
−Fon
do g
ener
al1,
225,
261
Real
pro
pert
y fu
nd−F
ondo
bie
nes r
aíce
s40
0,77
5
Tota
l fun
d ba
lanc
es−B
alan
ces t
otal
es d
e lo
s fon
dos
1,62
6,03
6$
2,85
9,02
5

INTE
R-A
ME
RIC
AN
TR
OP
ICA
L TU
NA
CO
MM
ISSI
ON
−− CO
MIS
ION
IN
TER
AM
ER
ICA
NA
DE
L AT
UN
TR
OP
ICA
L
Stat
emen
ts o
f rev
enue
s an
d ex
pens
es fo
r th
e fi
scal
yea
r en
ded
Sept
embe
r 30
, 200
1−−D
ecla
raci
ón d
e in
gres
os y
gas
tos
corr
espo
ndie
nte
al a
ño fi
scal
fina
lizad
o el
30
de s
epti
embr
e de
200
1
Reve
nue−
Ingr
esos
Gov
ernm
ent c
ontr
ibut
ions
for
join
t exp
endi
ture
s−Co
ntri
buci
ones
de
los g
obie
rnos
a lo
s gas
tos c
ombi
nado
sU
nite
d St
ates
of A
mer
ica−
Esta
dos U
nido
s de
Amér
ica
2,40
0,00
0M
exic
o−M
éxic
o1,
000,
000
Vene
zuel
a56
0,01
3Ja
pan−
Japó
n34
0,00
0Ec
uado
r17
8,51
5Co
sta
Rica
31,8
32Va
nuat
u30
,000
Fran
ce−F
ranc
ia29
,950
Pana
ma−
Pana
má
25,9
05El
Sal
vado
r13
,561
Gua
tem
ala
8,22
1To
tal g
over
nmen
t con
trib
utio
ns−T
otal
de
cont
ribu
cion
es p
or lo
s gob
iern
os4,
617,
997
Cont
ract
rev
enue
−Ing
reso
s por
con
trat
oTo
nnag
e as
sess
men
ts−A
port
es p
or to
nela
je1,
316,
640
Oth
er m
isce
llane
ous c
ontr
act r
even
ue−O
tros
ingr
esos
mis
celá
neos
por
con
trat
o89
2,83
8To
tal c
ontr
act r
even
ue−I
ngre
sos t
otal
es p
or c
ontr
ato
2,20
9,47
8
Inte
rest
inco
me−
Ingr
esos
por
inte
rese
s 66
,656
O
ther
rev
enue
−Otr
os in
gres
os
29,2
18To
tal r
even
ues−
Ingr
esos
tota
les
6,92
3,34
9
ANNUAL REPORT 2001 141

142 TUNA COMMISSION
INTE
R-A
ME
RIC
AN
TR
OP
ICA
L TU
NA
CO
MM
ISSI
ON
−− CO
MIS
ION
IN
TER
AM
ER
ICA
NA
DE
L AT
UN
TR
OP
ICA
LSt
atem
ents
of r
even
ues
and
expe
nses
for
the
fisc
al y
ear
ende
d Se
ptem
ber
30, 2
001−−
Dec
lara
ción
de
ingr
esos
y g
asto
s co
rres
pond
ient
e al
año
fisc
al fi
naliz
ado
el 3
0 de
sep
tiem
bre
de 2
001
(con
tinu
ed−− c
onti
nuac
ión)
Expe
nditu
res−
Gas
tos
Sala
ries
−Sue
ldos
2,91
5,47
4O
bser
ver
cost
s−G
asto
s par
a lo
s obs
erva
dore
s1,
228,
086
Mat
eria
ls a
nd su
pplie
s−M
ater
iale
s y su
min
istr
os1,
180,
732
Cont
ract
exp
endi
ture
s−G
asto
s par
a lo
s con
trat
os53
1,68
6Em
ploy
ee b
enef
its−B
enef
icio
s lab
oral
es58
6,95
4Tr
avel
−Via
jes
418,
373
Util
ities
−Ser
vici
os p
úblic
os12
4,33
3Pr
intin
g an
d po
stag
e−Im
pren
ta y
fran
queo
97,2
94In
sura
nce−
Segu
ros
32,8
92Le
gal a
nd p
rofe
ssio
nal−
Lega
les y
pro
fesi
onal
es48
,417
Mis
cella
neou
s−M
isce
láne
os4,
936
Tota
l exp
endi
ture
s−G
asto
s tot
ales
7,
169,
177
Exce
ss o
f exp
endi
ture
s ove
r re
venu
e−Ex
ceso
de
gast
os so
bre
ingr
esos
$ (2
45,8
28)

INTE
R-A
ME
RIC
AN
TR
OP
ICA
L TU
NA
CO
MM
ISSI
ON
−− CO
MIS
ION
IN
TER
AM
ER
ICA
NA
DE
L AT
UN
TR
OP
ICA
L
Stat
emen
ts o
f cha
nges
in fu
nd b
alan
ces
for
the
fisc
al y
ear
ende
d Se
ptem
ber
30, 2
001−−
Dec
lara
ción
de
cam
bios
en
el b
alan
ce d
e lo
s fo
ndos
cor
resp
ondi
ente
al
año
fisc
al fi
naliz
ado
el 3
0 de
sep
tiem
bre
de 2
001
Gen
eral
fund
Rea
l pro
pert
y fu
ndFo
ndo
gene
ral
Fond
o pr
opie
dad
raíz
Tota
l
Bala
nce
at S
epte
mbe
r 30
, 199
9Ba
lanc
e al
30
de se
ptie
mbr
e de
199
92,
365,
484
400,
775
2,76
6,25
9
Exce
ss o
f exp
endi
ture
ove
r re
venu
e Ex
ceso
de
gast
os so
bre
ingr
esos
(894
,395
)−
(894
,395
)
Bala
nce
at S
epte
mbe
r 30
, 200
0Ba
lanc
e al
30
de se
ptie
mbr
e de
200
01,
471,
089
400,
775
1,87
1,86
4
Exce
ss o
f exp
endi
ture
ove
r re
venu
eEx
ceso
de
gast
os so
bre
ingr
esos
sobr
e(2
45,8
28)
−(2
45,8
28)
Bala
nce
at S
epte
mbe
r 30
, 200
1Ba
lanc
e al
30
de se
ptie
mbr
e de
200
11,
225,
261
400,
775
1,62
6,03
6
ANNUAL REPORT 2001 143

144 TUNA COMMISSION
INTE
R-A
ME
RIC
AN
TR
OP
ICA
L TU
NA
CO
MM
ISSI
ON
−− CO
MIS
ION
IN
TER
AM
ER
ICA
NA
DE
L AT
UN
TR
OP
ICA
L
Stat
emen
t of
cas
h fl
ows
for
the
fisc
al y
ear
ende
d Se
ptem
ber
30, 2
001−−
Dec
lara
ción
de
fluj
os d
e fo
ndos
cor
resp
ondi
ente
al a
ño fi
scal
fina
lizad
o el
30
de s
epti
embr
e de
200
1
Cash
flow
s fro
m o
pera
ting
activ
ities
−Flu
jos d
e fo
ndos
de
activ
idad
es d
e op
erac
ión:
Exce
ss o
f exp
endi
ture
s ove
r re
venu
e−Ex
ceso
de
gast
os so
bre
ingr
esos
:$
(245
,828
)Ad
just
men
ts to
rec
onci
le e
xces
s of e
xpen
ditu
res o
ver
reve
nue
to n
et c
ash
prov
ided
by
oper
atin
g ac
tiviti
es−
Ajus
tes p
ara
reco
ncili
ar e
xces
o de
gas
tos s
obre
ingr
esos
con
efe
ctiv
o ne
to p
rovi
sto
por
activ
idad
es d
e op
erac
ión:
Incr
ease
in a
ccou
nts r
ecei
vabl
e−Au
men
to e
n cu
enta
s por
cob
rar
(29,
223)
Dec
reas
e in
em
ploy
ee a
dvan
ces−
Redu
cció
n en
ant
icip
os a
los e
mpl
eado
s62
,115
Dec
reas
e in
dep
osits
and
pre
paid
exp
ense
s−Re
ducc
ión
en d
epós
itos y
gas
tos p
agad
os p
or a
dela
ntad
o11
,842
Incr
ease
in a
ccru
ed e
xpen
ses a
nd o
ther
liab
ilitie
s−Au
men
to e
n ga
stos
acu
mul
ados
y o
tro
pasi
vo86
6,33
1N
et c
ash
used
in o
pera
ting
activ
ities
−Efe
ctiv
o ne
to u
sado
en
activ
idad
es o
pera
cion
ales
665,
237
Cash
and
cas
h eq
uiva
lent
s at b
egin
ning
of y
ear−
Efec
tivo
y eq
uiva
lent
es a
l pri
ncip
io d
e añ
o1,
583,
286
Cash
and
cas
h eq
uiva
lent
s at e
nd o
f yea
r−Ef
ectiv
o y
equi
vale
ntes
al f
in d
e añ
o$
2,24
8,52
3

INTE
R-A
ME
RIC
AN
TR
OP
ICA
L TU
NA
CO
MM
ISSI
ON
−− CO
MIS
ION
IN
TER
AM
ER
ICA
NA
DE
L AT
UN
TR
OP
ICA
L
Sche
dule
of e
xpen
ditu
res
by p
roje
ct, S
epte
mbe
r 30
, 200
1−−P
rogr
ama
de g
asto
s po
r pr
oyec
to, 3
0 de
sep
tiem
bre
de 2
001
Adm
inis
trat
ion
Cat
ch a
ndB
iolo
gy o
fO
cean
ogra
phy
Tuna
and
Tuna
-Dol
phin
effo
rttu
nas
and
and
billf
ish
Pro
gram
stat
isti
cs
billf
ishe
s m
eteo
rolo
gy
tagg
ing
Tota
lA
dmin
istr
ació
nE
stad
ísti
cas
Bio
logí
a de
Oce
anog
rafí
aM
arca
doP
rogr
ama
de c
aptu
raat
unes
y
y de
atu
nes
Atún
-y
esfu
erzo
picu
dos
met
eoro
logí
a y
picu
dos
Del
fín
Sala
ries
−Sue
ldos
417,
640
534,
378
970,
461
15,4
6696
,182
881,
347
2,91
5,47
Obs
erve
r co
sts−
Gas
tos p
or o
bser
vado
res
−−
−−
−1,
228,
086
1,22
8,08
6M
ater
ials
and
supp
lies−
Mat
eria
les y
per
trec
hos
67,3
4438
,621
212,
777
593
4,91
185
6,48
61,
180,
732
Cont
ract
exp
endi
ture
s−G
asto
s por
con
trat
o2,
255
152,
809
210,
225
−−
166,
397
531,
686
Empl
oyee
ben
efits
−Be
nefic
ios l
abor
ales
79,3
4510
9,66
819
9,33
94,
566
17,4
5617
6,58
058
6,95
4Tr
avel
−Via
jes
147,
211
46,5
3775
,873
385
2,13
714
6,23
041
8,37
3U
tiliti
es−S
ervi
cios
púb
licos
39,0
2633
,449
9,82
214
5941
,963
124,
333
Prin
ting
and
post
age−
Impr
enta
y fr
anqu
eo49
,027
4,50
428
,723
2983
714
,174
97,2
94In
sura
nce−
Segu
ros
9,74
210
,332
1,72
844
142
10,9
0432
,892
Lega
l and
pro
fess
iona
l−Le
gal y
pro
fesi
onal
35,7
331,
208
150
−−
11,3
2648
,417
Mis
cella
neou
s−M
isce
láne
a46
21,
605
244
−14
62,
479
4,93
6
$847
,785
933,
111
1,70
9,34
221
,097
121,
870
3,53
5,97
27,
169,
177
ANNUAL REPORT 2001 145

146 TUNA COMMISSION
APPENDIX 3−−ANEXO 3
CONTRIBUTIONS BY IATTC STAFF MEMBERS PUBLISHED DURING 2001CONTRIBUCIONES POR EL PERSONAL DE CIAT PUBLICADAS DURANTE 2001
Annual Report−−Informe Anual
1999
Bulletin−−Boletín
Vol. 22, No. 1. Early life history studies of yellowfin tuna, Thunnus albacares−Estudiosdel ciclo vital temprano del atún aleta amarilla, Thunnus albacares
Margulies, Daniel. Preface−Prefacio
Margulies, Daniel, Jeanne B. Wexler, Kevin T. Bentler, Jenny M. Suter, ShukeiMasuma, Nobuhiro Tezuka, Kazuhisa Teruya, Masakazu Oka, MasaeiKanematsu, and Hideki Nikaido. Food selection of yellowfin tuna,Thunnus albacares, larvae reared in the laboratory−Selección de alimentopor larvas de atún aleta amarilla, Thunnus albacares, criadas en el laboratorio
Wexler, Jeanne B., Daniel Margulies, Shukei Masuma, Nobuhiro Tezuka, KazuhisaTeruya, Masakazu Oka, Masaei Kanematsu, and Hideki Nikaido. Agevalidation and growth of yellowfin tuna, Thunnus albacares, larvae rearedin the laboratory−Validación de la edad y crecimiento de larvas del atúnaleta amarilla, Thunnus albacares, criadas in el laboratorio
Vol. 22, No. 2. Maunder, Mark N. Growth of skipjack tuna (Katsuwonus pelamis) in theeastern Pacific Ocean, as estimated from tagging data−Crecimiento deatún barrilete (Katsuwonus pelamis) en el Océano Pacífico oriental, estimadoa partir de datos de marcado
Stock Assessment Report−−Informe de Evaluación de Stocks
No. 1
Special Reports−−Informes Especiales
No. 12. Symposium on world tuna fisheries: commemorating the 50th anniversary ofthe establishment of the Inter-American Tropical Tuna Commission
No. 13. Bayliff, William H. Organization, functions, and achievements of the Inter-American Tropical Tuna Commission−Organización, funciones, y logros de la Comisión Interamericana del Atún Tropical
Books−−Libros
Bayliff, William H. Pacific northern bluefin tuna. In Leet, William S., Christopher M.DeWees, Richard Klingbeil, and Eric J. Larson (editors), California's LivingMarine Resources: a Status Report, Calif. Dept. Fish Game: 325-327.

Crespo, Enrique A., and Martín A. Hall. Interactions between aquatic mammals andhumans in the context of ecosystem management. In Evans, Peter G. H., andJuan Antonio Raga (editors), Marine Mammals: Biology and Conservation,Kluwer Academic/Plenum Publishers, New York: 463-490.
Hall, Martín A., and G. P. Donovan. Environmentalists, fishermen, cetaceans, and fish:is there a balance and can science help to find it? In Evans, Peter G. H., andJuan Antonio Raga (editors), Marine Mammals: Biology and Conservation,Kluwer Academic/Plenum Publishers, New York: 491-521.
Joseph, J. Open ocean fisheries for large pelagic species. In Steele, John H., Steve A.Thorpe, and Karl K. Turekian (editors), Encyclopedia of Ocean Sciences, Vol. 4,Academic Press, San Diego: 2031-2039.
Schaefer, Kurt M. Reproductive biology of tunas. In Block, Barbara A., and E. DonaldStevens (editors), Tuna: Physiology, Ecology, and Evolution, Academic Press, SanDiego: 225-270.
Outside journals−−Revistas externas
Allen, Robin (chairman). Research implications of adopting the precautionary approachto management of tuna fisheries. FAO Fish. Circ., 963: xii, 74 pp.
Allen, Robin. El atún del Océano Pacífico oriental, el PICD, y la nueva certificaciónAIDCP dolphin safe. Industria Conserva, Revista Trimestrial, 9 (35): 60-65.
Chow, S., V. P. Scholey, A. Nakazawa, D. Margulies, J. B. Wexler, R. J. Olson, and K.Hazama. Direct evidence for Mendelian inheritance of the variations in the ribo-somal protein gene introns in yellowfin tuna (Thunnus albacares). Mar. Biotech.,3 (1): 22-26.
Joseph, James. A global view of tuna fisheries. II European Conference on Tuna,Associación Nacional de Fabricantes de Conservas de Pescados y Mariscos and CentroTécnico Nacional de Conservación de Productos de la Pesca [Spain]: 175-194.
Lennert-Cody, Cleridy E., Stephen T. Buckland, and Fernanda F. C. Marques. 2001.Trends in dolphin abundance estimated from fisheries data: a cautionary note.Jour. Cetacean Res. Manag., 3(3): 305-319.
Maunder, Mark N. A general framework for integrating the standardization of catch perunit of effort into stock assessment models. Canad. Jour. Fish. Aquatic Sci., 58(4): 795-803.
Olson, Robert. Yellowfin, bigeye, skipjack, bluefin, and albacore tunas in the easternPacific Ocean. In Alexander, Vera, Alexander S. Bychkov, Patricia Livingston,and Stewart M. McKinnell (editors), Proceedings of the PICES/CoML/IPRCWorkshop on “Impact of Climate Variability on Observation and Prediction ofEcosystem and Biodiversity Changes in the North Pacific.” North Pacific MarineScience Organization (PICES), Sci. Rep., 18: 184-197.
ANNUAL REPORT 2001 147

Pabst, D. A., T. M. Harradine, W. A. McLellan, M.M. Barbieri, E. M. Meagher, and M. D.Scott. Infrared thermograqphy as a tool to assess thermal function of the bot-tlenose dolphin (Tursiops truncatus) dorsal fin [abstract]. Amer. Zool., 41 (6): 1548.
Schaefer, Kurt M. Assessment of skipjack tuna (Katsuwonus pelamis) spawning activityin the eastern Pacific Ocean. U.S. Nat. Mar. Fish. Serv., Fish. Bull., 99 (2): 343-350.
Scholey, Vernon, Daniel Margulies, Robert Olson, Jeanne Wexler, Jenny Suter, andSharon Hunt. Lab culture and reproduction of yellowfin tuna in Panama.Global Aqua. Advocate, 4 (2): 17-18.
Scott, Michael D., Aleta A. Hohn, Andrew J. Westgate, John R. Nichols, Brent R. Whitaker,and Walton B. Campbell. A note on the release and tracking of a rehabilitatedpygmy sperm whale (Kogia breviceps). Jour. Cetacean Res. Manag., 3 (1): 87-94.
148 TUNA COMMISSION

The IATTC’s responsibilities are met withtwo programs, the Tuna-Billfish Program andthe Tuna-Dolphin Program. The principalresponsibilities of the Tuna-Billfish Programare (1) to study the biology of the tunas andrelated species of the eastern Pacific Ocean toestimate the effects that fishing and naturalfactors have on their abundance, (2) to rec-ommend appropriate conservation measuresso that the stocks of fish can be maintained atlevels which will afford maximum sustainablecatches, and (3) to collect information on com-pliance with Commission resolutions. Theprincipal responsibilities of the Tuna-DolphinProgram are (1) to monitor the abundance ofdolphins and their mortality incidental topurse-seine fishing in the eastern PacificOcean, (2) to study the causes of mortality ofdolphins during fishing operations and pro-mote the use of fishing techniques and equip-ment that minimize these mortalities, (3) tostudy the effects of different modes of fishingon the various fish and other animals of thepelagic ecosystem, and (4) to provide a secre-tariat for the International DolphinConservation Program.
An important part of the work of theIATTC is the prompt publication and widedistribution of its research results. TheCommission publishes its results in itsBulletin, Special Report, and Data Reportseries, all of which are issued on an irregularbasis, and its Stock Assessment Reports,which are published annually.
The Commission also publishes AnnualReports and Quarterly Reports, whichinclude policy actions of the Commission,information on the fishery, and reviews of theyear’s or quarter’s work carried out by thestaff. The Annual Reports also contain finan-cial statements and a roster of the IATTCstaff.
Additional information on the IATTC’spublications can be found in its web site.
La CIAT cumple sus obligaciones mediantedos programas, el Programa Atún-Picudo y elPrograma Atún-Delfín. Las responsabilidadesprincipales del primero son (1) estudiar labiología de los atunes y especies afines en elOcéano Pacífico oriental a fin de determinarlos efectos de la pesca y los factores naturalessobre su abundancia, (2) recomendar medidasapropiadas de conservación para permitirmantener los stocks de peces a niveles quebrinden las capturas máximas sostenibles, (3)reunir información sobre el cumplimiento delas resoluciones de la Comisión. Las respons-abilidades principales del segundo son (1) darseguimiento a la abundancia de los delfines yla mortalidad de los mismos incidental a lapesca con red de cerco en el Océano Pacíficooriental, (2) estu-diar las causas de la mortal-idad de delfines durante las operaciones depesca y fomentar el uso de técnicas y aparejode pesca que reduzcan dicha mortalidad almínimo, (3) estudiar los efectos de distintasmorta-lidades de pesca sobre los varios peces yotros animales del ecosistema pelágico, (4)proporcionar la Secretaría para el ProgramaInternacional para la Conservación de losDelfines.
La pronta publicación y amplia distribu-ción de los resultados de investigación formanun aspecto importante de las labores de laComisión, la cual publica los resultados en suserie de Boletines, Informes Especiales, eInformes de Datos, publicados a intervalosirregulares, y sus Informes de Evaluación deStocks, publicados anualmente.
La Comisión publica también InformesAnuales e Informes Trimestrales; éstosincluyen información sobre las labores de laComisión, la pesquería, y las investigacionesrealizadas en el año o trimestre correspondi-ente. Los Informes Anuales incluyen tam-bién un resumen financiero y una lista delpersonal de la CIAT.
En el sitio de internet de la CIAT sepresenta información adicional sobre estaspublicaciones.
Editor−RedactorWilliam H. Bayliff
Inter-American Tropical Tuna CommissionComisión Interamericana del Atún Tropical
8604 La Jolla Shores DriveLa Jolla, California 92037-1508, U.S.A.
www.iattc.org


TU
NA
CO
MM
ISS
ION
, AN
NU
AL
RE
PO
RT, 2
001—
CO
MIS
ION
DE
LA
TU
N, IN
FO
RM
E A
NU
AL
, 2001