IASSC Reference Document V1.4...12 Calculation Formula Notes u Chart (n can vary, Mean Percentage...
29
Confidential Copyright © 2010-2020, International Association for Six Sigma Certification, LLC IASSC Examination Reference Document Version: 1.4.2 Publish Date: March 2020
Transcript of IASSC Reference Document V1.4...12 Calculation Formula Notes u Chart (n can vary, Mean Percentage...

Confidential Copyright © 2010-2020, International Association for Six Sigma Certification, LLC
IASSC
Examination Reference Document
Version: 1.4.2
Publish Date: March 2020

1
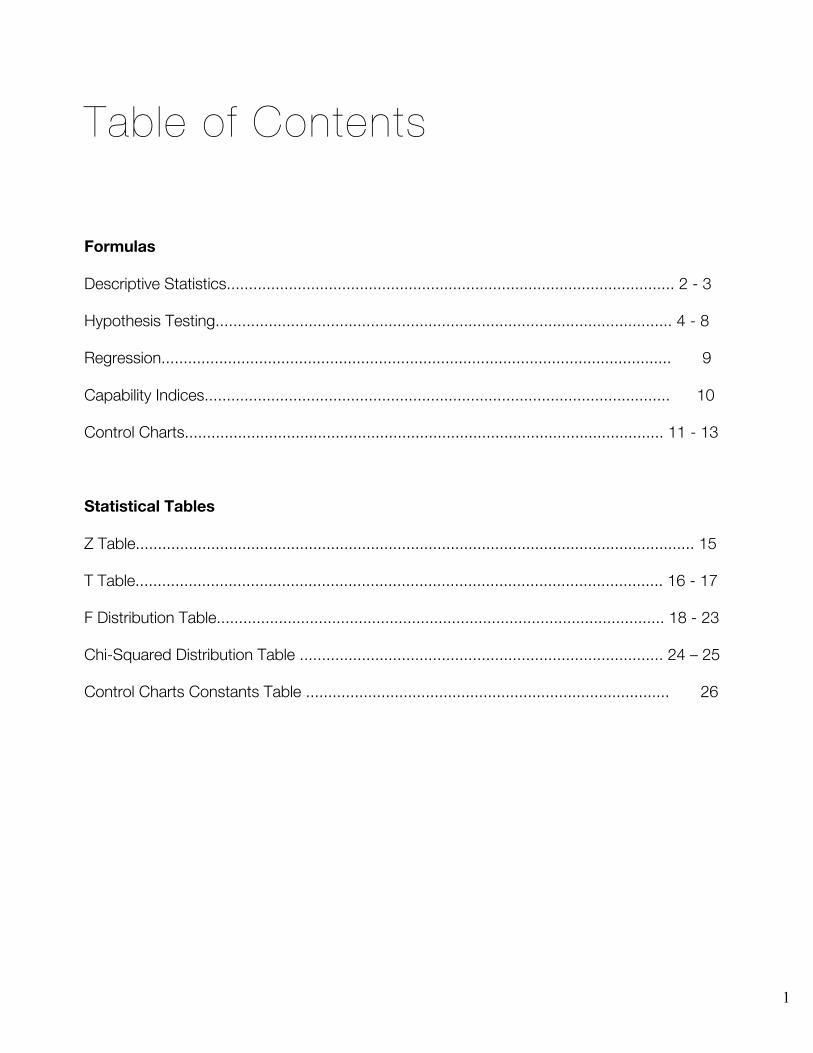
Table of Contents
Formulas
Descriptive Statistics..................................................................................................... 2 - 3
Hypothesis Testing....................................................................................................... 4 - 8
Regression................................................................................................................... 9
Capability Indices......................................................................................................... 10
Control Charts............................................................................................................ 11 - 13
Statistical Tables
Z Table.............................................................................................................................. 15
T Table....................................................................................................................... 16 - 17
F Distribution Table..................................................................................................... 18 - 23
Chi-Squared Distribution Table .................................................................................. 24 – 25
Control Charts Constants Table .................................................................................. 26

2
Descriptive Statistics
Calculation Formula Notes
Population Mean
µ = Population average X = Individual values of population N = Count of individual values
Sample Mean
𝑋" = Sample average X = Individual values of population n = count of individual values in sample
Weighted Mean
𝑋"w=WeightedsampleaverageWj=WeightofvaluejXj=Individualvaluetobeweighted
Sample Mean of grouped
data
fi=NumberofobservationsintheithgroupXi=Midpointoftheithclassn=Countofallobservationsofithclasses
Range Range = Max Value – Min Value µ = Population average X = Individual values in population N = count of values in population
Mean Deviation
𝑋" = Sample average X = Individual values in sample n = count of individual values in sample
Population Variance
µ = Population average X = Individual values in population N = count of values in population

3
Calculation Formula Notes
Population Standard Deviation
µ = Population average X = Individual values in population
N = count of values in population
Sample Variance
𝑋" = Sample average X = Individual values in sample n = count of individual values in sample
Sample Standard Deviation
n = Count of Sample

4
Hypothesis Testing
Calculation Formula Notes
2 Sample T
(Unequal Variance)
𝑆!" = Standard Deviation of the Sample One 𝑆"" = Standard Deviation of the Sample Two n1 = Sample, number one n2 = Sample, number two X1 = Average of Sample One X2 = Average of Sample Two
2 Sample T
(Equal Variance)
Sp= Pooled Variance
2t Test of Means
(pooled s)
α = Level of significance
2Z Test of Means
(Equal Variance)
σ = σ1 = σ2
𝑡 =(𝑋1&&& − 𝑋2&&&))
𝑆𝑝,1𝑛1+ 1𝑛2
𝑆𝑝 =(𝑛1 − 1)𝑆12 + (𝑛2−1)𝑆22
𝑛1 + 𝑛2 − 2
𝑧 =(𝑋1&&& − 𝑋2&&&))
𝜎+ 1𝑛1+ 1𝑛2
5
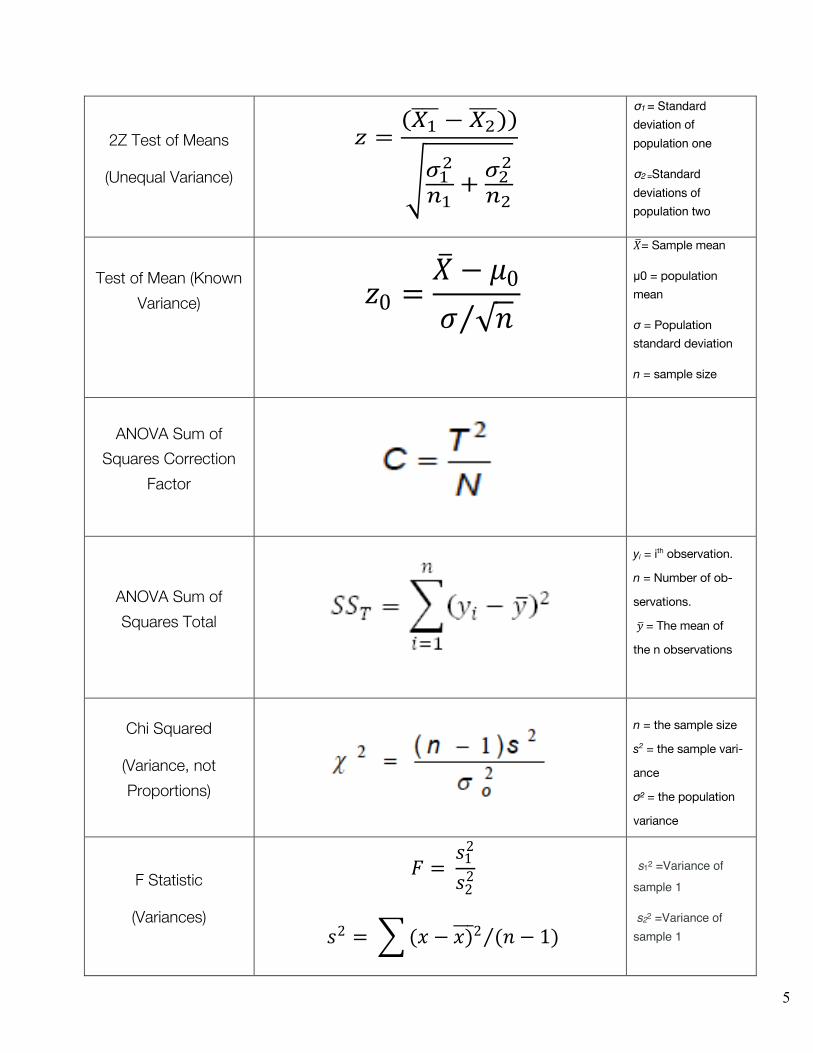
2Z Test of Means
(Unequal Variance)
σ1 = Standard
deviation of population one
σ2 =Standard deviations of population two
Test of Mean (Known Variance)
𝑋"= Sample mean
µ0 = population mean
σ = Population standard deviation
n = sample size
ANOVA Sum of Squares Correction
Factor
ANOVA Sum of Squares Total
yi = ith observation.
n = Number of ob-
servations.
𝑦"= The mean of
the n observations
Chi Squared
(Variance, not Proportions)
n = the sample size
s2 = the sample vari-
ance
σ² = the population
variance
F Statistic
(Variances)
s12 =Variance of sample 1
s22 =Variance of sample 1
𝑧 =(𝑋1&&& − 𝑋2&&&))
*𝜎12
𝑛1+ 𝜎2
2
𝑛2
𝑧0 =𝑋% − 𝜇0𝜎 √𝑛⁄
𝐹 =𝑠12
𝑠22
𝑠2 = '(𝑥 − 𝑥),,,2 (𝑛 − 1)⁄

6
Interval for two Proportions
p1 = Proportion of population one
p2 = Proportion of population one
α = Level of significance
Interval for two popu-lation means (Equal
Variance)
Interval for two popu-lation means (Unequal
Variance)
Interval for paired sample
Interval for two popu-lation means (Equal Variance, n < 30)
𝑆!" = Standard Deviation of the Sample One 𝑆"" = Standard Deviation of the Sample Two n1 = Sample, number one n2 = Sample, number two X1 = Average of Sample One X2 = Average of Sample Two
(𝑋1$$$ − 𝑋2$$$) ± 𝑧𝛼 2⁄ 𝜎-1𝑛1+1𝑛2
(𝑋1$$$ − 𝑋2$$$) ± 𝑧𝛼 2⁄ ,𝜎12
𝑛1+𝜎22
𝑛2
𝐷" ± 𝑡𝛼 2⁄ ,𝑛−1 𝑆𝐷 √𝑛⁄
𝑆𝐷 = 0∑ (𝐷𝑖 − 𝐷")2𝑛𝑖=1𝑛 − 1
𝐷" = 𝑎𝑣𝑒𝑟𝑎𝑔𝑒𝑜𝑓𝑡ℎ𝑒𝑑𝑖𝑓𝑓𝑒𝑟𝑒𝑛𝑐𝑒𝑠𝐷1,𝐷2,……… ,𝐷𝑛
𝑆𝑝 =(𝑛1 − 1)𝑆12 + (𝑛2−1)𝑆22
𝑛1 + 𝑛2 − 2
(𝑋1$$$$$ − 𝑋2$$$) + 𝑡1−𝛼 2⁄ ,𝑛1+𝑛2−2𝑆𝑝1
1𝑛1+ 1
𝑛2

7
Interval for two popu-lation means (Unequal Variance, n < 30)
Paired t Test
𝐷" = averageofthe𝑛differences𝐷!, 𝐷", …… . , 𝐷#
Pooled Variance
Single Sample Test
Of a Given Proportion p0
Single Sample t test
(Compare to Standard)
𝐷" = averageofthe𝑛differences𝐷1, 𝐷2,…… . , 𝐷𝑛
𝑡 =𝐷"
𝑆𝐷 √𝑛⁄
𝑆𝐷 = =∑ (𝐷𝑖 − 𝐷")2𝑛𝑖=1𝑛 − 1
𝑧1−𝛼 2⁄ =𝑝 − 𝑝0
*𝑝0(1 − 𝑝0)𝑛
(𝑋1$$$ − 𝑋2$$$) ± 𝑡1−𝛼 2⁄ ,𝑣.𝑠12
𝑛1+𝑠22
𝑛2
𝑣 =3𝑠1
2
𝑛1+ 𝑠22𝑛242
(𝑠12 𝑛1⁄ )2𝑛1 − 1
+ (𝑠22 𝑛2⁄ )2𝑛2 − 1

8
Sum of Squares
(Equal n)
Sum of Squares
(Unequal n)
Sum of Squares Treatments
T = Total sum of each treatment
C = Correction for the Mean
K= No of treatments
Two Sample Test
of Proportions
Variance

9
Regression
Calculation Formula Notes
Correlation Coefficient
Linear Regression
Multiple Regression
Multiple Standard Error

10
Capability Indices
Calculation Formula Notes
Confidence Interval for Cpk
Cpk Attribute Data
Process Capability
Process Centering
(Short Term 1)
Process Centering
(Short Term 2)
Sigma of Cpk

11
Control Charts
Calculation Formula Notes
c Chart
(Fixed n1)
c Chart
(Fixed n2)
Control Limits for np
np Chart
(Fixed n)
p Chart
(Average Sample Size)
p Chart
(n can vary, Control Limits for
Proportions)
p Chart
(n can vary, Mean Percent Defects)

12
Calculation Formula Notes
u Chart
(n can vary, Mean Percentage Defectives)
u Chart
(Average Sample Size)
u Chart
(n can vary, Control Limits for
Proportions)
X and R Charts
(Grand Mean)
X and R Charts
(Control Limits for the Mean)
Refer Control chart constant table for A2 constant value
X and R Charts
(Control Limits for the Range)
Refer Control chart constant table for D3 and D4 constant values
X and R Charts
(Range Target)

13
Calculation Formula Notes
X and S Charts
(Control Limits for the Mean)
Refer Control chart constant table for A3 constant value
X and S Charts
(Grand Mean)
X and S Charts
(Grand Mean)
X and S Charts
(Control Limits for the Range)
Refer Control Chart Constant Table for B4 constant value
CuSum Equation 𝑆# =1𝜎$:(𝑥% − 𝑇)#
%&!
Sn = plotting position of the nth sample T = target average value σx = process Standard Deviation xi = the ith measurement
EWMA Equation
EWMAt = λYt + (1 - λ) EWMAt-1
for t = 1, 2, …, n
EWMA0 = Mean of historical data; target Yt = the observation at time; t n = number of observations to be moni-tored including EWMA0
0 < λ ≥ 1 is a constant that determines the depth of memory of the EWMA

14
Z Table
Normal Distribution - Left Tail Area
Z 0 0.01 0.02 0.03 0.04 0.05 0.06 0.07 0.08 0.09 -4.9 0.00000 0.00000 0.00000 0.00000 0.00000 0.00000 0.00000 0.00000 0.00000 0.00000 -4.8 0.00000 0.00000 0.00000 0.00000 0.00000 0.00000 0.00000 0.00000 0.00000 0.00000 -4.7 0.00000 0.00000 0.00000 0.00000 0.00000 0.00000 0.00000 0.00000 0.00000 0.00000 -4.6 0.00000 0.00000 0.00000 0.00000 0.00000 0.00000 0.00000 0.00000 0.00000 0.00000 -4.5 0.00000 0.00000 0.00000 0.00000 0.00000 0.00000 0.00000 0.00000 0.00000 0.00000 -4.4 0.00001 0.00001 0.00000 0.00000 0.00000 0.00000 0.00000 0.00000 0.00000 0.00000 -4.3 0.00001 0.00001 0.00001 0.00001 0.00001 0.00001 0.00001 0.00001 0.00001 0.00001 -4.2 0.00001 0.00001 0.00001 0.00001 0.00001 0.00001 0.00001 0.00001 0.00001 0.00001 -4.1 0.00002 0.00002 0.00002 0.00002 0.00002 0.00002 0.00002 0.00002 0.00001 0.00001 -4.0 0.00003 0.00003 0.00003 0.00003 0.00003 0.00003 0.00002 0.00002 0.00002 0.00002 -3.9 0.00005 0.00005 0.00004 0.00004 0.00004 0.00004 0.00004 0.00004 0.00003 0.00003 -3.8 0.00007 0.00007 0.00007 0.00006 0.00006 0.00006 0.00006 0.00005 0.00005 0.00005 -3.7 0.00011 0.00010 0.00010 0.00010 0.00009 0.00009 0.00008 0.00008 0.00008 0.00008 -3.6 0.00016 0.00015 0.00015 0.00014 0.00014 0.00013 0.00013 0.00012 0.00012 0.00011 -3.5 0.00023 0.00022 0.00022 0.00021 0.00020 0.00019 0.00019 0.00018 0.00017 0.00017 -3.4 0.00034 0.00032 0.00031 0.00030 0.00029 0.00028 0.00027 0.00026 0.00025 0.00024 -3.3 0.00048 0.00047 0.00045 0.00043 0.00042 0.00040 0.00039 0.00038 0.00036 0.00035 -3.2 0.00069 0.00066 0.00064 0.00062 0.00060 0.00058 0.00056 0.00054 0.00052 0.00050 -3.1 0.00097 0.00094 0.00090 0.00087 0.00084 0.00082 0.00079 0.00076 0.00074 0.00071 -3.0 0.00135 0.00131 0.00126 0.00122 0.00118 0.00114 0.00111 0.00107 0.00104 0.00100 -2.9 0.00187 0.00181 0.00175 0.00169 0.00164 0.00159 0.00154 0.00149 0.00144 0.00139 -2.8 0.00256 0.00248 0.00240 0.00233 0.00226 0.00219 0.00212 0.00205 0.00199 0.00193 -2.7 0.00347 0.00336 0.00326 0.00317 0.00307 0.00298 0.00289 0.00280 0.00272 0.00264 -2.6 0.00466 0.00453 0.00440 0.00427 0.00415 0.00402 0.00391 0.00379 0.00368 0.00357 -2.5 0.00621 0.00604 0.00587 0.00570 0.00554 0.00539 0.00523 0.00508 0.00494 0.00480 -2.4 0.00820 0.00798 0.00776 0.00755 0.00734 0.00714 0.00695 0.00676 0.00657 0.00639 -2.3 0.01072 0.01044 0.01017 0.00990 0.00964 0.00939 0.00914 0.00889 0.00866 0.00842 -2.2 0.01390 0.01355 0.01321 0.01287 0.01255 0.01222 0.01191 0.01160 0.01130 0.01101 -2.1 0.01786 0.01743 0.01700 0.01659 0.01618 0.01578 0.01539 0.01500 0.01463 0.01426 -2.0 0.02275 0.02222 0.02169 0.02118 0.02068 0.02018 0.01970 0.01923 0.01876 0.01831 -1.9 0.02872 0.02807 0.02743 0.02680 0.02619 0.02559 0.02500 0.02442 0.02385 0.02330 -1.8 0.03593 0.03515 0.03438 0.03362 0.03288 0.03216 0.03144 0.03074 0.03005 0.02938 -1.7 0.04457 0.04363 0.04272 0.04182 0.04093 0.04006 0.03920 0.03836 0.03754 0.03673 -1.6 0.05480 0.05370 0.05262 0.05155 0.05050 0.04947 0.04846 0.04746 0.04648 0.04551 -1.5 0.06681 0.06552 0.06426 0.06301 0.06178 0.06057 0.05938 0.05821 0.05705 0.05592 -1.4 0.08076 0.07927 0.07780 0.07636 0.07493 0.07353 0.07215 0.07078 0.06944 0.06811 -1.3 0.09680 0.09510 0.09342 0.09176 0.09012 0.08851 0.08691 0.08534 0.08379 0.08226 -1.2 0.11507 0.11314 0.11123 0.10935 0.10749 0.10565 0.10383 0.10204 0.10027 0.09853 -1.1 0.13567 0.13350 0.13136 0.12924 0.12714 0.12507 0.12302 0.12100 0.11900 0.11702 -1.0 0.15866 0.15625 0.15386 0.15151 0.14917 0.14686 0.14457 0.14231 0.14007 0.13786

15
-0.9 0.18406 0.18141 0.17879 0.17619 0.17361 0.17106 0.16853 0.16602 0.16354 0.16109 -0.8 0.21186 0.20897 0.20611 0.20327 0.20045 0.19766 0.19489 0.19215 0.18943 0.18673 -0.7 0.24196 0.23885 0.23576 0.23270 0.22965 0.22663 0.22363 0.22065 0.21770 0.21476 -0.6 0.27425 0.27093 0.26763 0.26435 0.26109 0.25785 0.25463 0.25143 0.24825 0.24510 -0.5 0.30854 0.30503 0.30153 0.29806 0.29460 0.29116 0.28774 0.28434 0.28096 0.27760 -0.4 0.34458 0.34090 0.33724 0.33360 0.32997 0.32636 0.32276 0.31918 0.31561 0.31207 -0.3 0.38209 0.37828 0.37448 0.37070 0.36693 0.36317 0.35942 0.35569 0.35197 0.34827 -0.2 0.42074 0.41683 0.41294 0.40905 0.40517 0.40129 0.39743 0.39358 0.38974 0.38591 -0.1 0.46017 0.45620 0.45224 0.44828 0.44433 0.44038 0.43644 0.43251 0.42858 0.42465 0.0 0.50000 0.49601 0.49202 0.48803 0.48405 0.48006 0.47608 0.47210 0.46812 0.46414
Z Table
Normal Distribution - Right Tail Area
Z 0 0.01 0.02 0.03 0.04 0.05 0.06 0.07 0.08 0.09 0.00 0.50000 0.50399 0.50798 0.51197 0.51595 0.51994 0.52392 0.52790 0.53188 0.53586 0.10 0.53983 0.54380 0.54776 0.55172 0.55567 0.55962 0.56356 0.56749 0.57142 0.57535 0.20 0.57926 0.58317 0.58706 0.59095 0.59483 0.59871 0.60257 0.60642 0.61026 0.61409 0.30 0.61791 0.62172 0.62552 0.62930 0.63307 0.63683 0.64058 0.64431 0.64803 0.65173 0.40 0.65542 0.65910 0.66276 0.66640 0.67003 0.67364 0.67724 0.68082 0.68439 0.68793 0.50 0.69146 0.69497 0.69847 0.70194 0.70540 0.70884 0.71226 0.71566 0.71904 0.72240 0.60 0.72575 0.72907 0.73237 0.73565 0.73891 0.74215 0.74537 0.74857 0.75175 0.75490 0.70 0.75804 0.76115 0.76424 0.76730 0.77035 0.77337 0.77637 0.77935 0.78230 0.78524 0.80 0.78814 0.79103 0.79389 0.79673 0.79955 0.80234 0.80511 0.80785 0.81057 0.81327 0.90 0.81594 0.81859 0.82121 0.82381 0.82639 0.82894 0.83147 0.83398 0.83646 0.83891 1.00 0.84134 0.84375 0.84614 0.84849 0.85083 0.85314 0.85543 0.85769 0.85993 0.86214 1.10 0.86433 0.86650 0.86864 0.87076 0.87286 0.87493 0.87698 0.87900 0.88100 0.88298 1.20 0.88493 0.88686 0.88877 0.89065 0.89251 0.89435 0.89617 0.89796 0.89973 0.90147 1.30 0.90320 0.90490 0.90658 0.90824 0.90988 0.91149 0.91308 0.91466 0.91621 0.91774 1.40 0.91924 0.92073 0.92220 0.92364 0.92507 0.92647 0.92785 0.92922 0.93056 0.93189 1.50 0.93319 0.93448 0.93574 0.93699 0.93822 0.93943 0.94062 0.94179 0.94295 0.94408 1.60 0.94520 0.94630 0.94738 0.94845 0.94950 0.95053 0.95154 0.95254 0.95352 0.95449 1.70 0.95543 0.95637 0.95728 0.95818 0.95907 0.95994 0.96080 0.96164 0.96246 0.96327 1.80 0.96407 0.96485 0.96562 0.96638 0.96712 0.96784 0.96856 0.96926 0.96995 0.97062 1.90 0.97128 0.97193 0.97257 0.97320 0.97381 0.97441 0.97500 0.97558 0.97615 0.97670 2.00 0.97725 0.97778 0.97831 0.97882 0.97932 0.97982 0.98030 0.98077 0.98124 0.98169 2.10 0.98214 0.98257 0.98300 0.98341 0.98382 0.98422 0.98461 0.98500 0.98537 0.98574 2.20 0.98610 0.98645 0.98679 0.98713 0.98745 0.98778 0.98809 0.98840 0.98870 0.98899 2.30 0.98928 0.98956 0.98983 0.99010 0.99036 0.99061 0.99086 0.99111 0.99134 0.99158 2.40 0.99180 0.99202 0.99224 0.99245 0.99266 0.99286 0.99305 0.99324 0.99343 0.99361 2.50 0.99379 0.99396 0.99413 0.99430 0.99446 0.99461 0.99477 0.99492 0.99506 0.99520 2.60 0.99534 0.99547 0.99560 0.99573 0.99585 0.99598 0.99609 0.99621 0.99632 0.99643 2.70 0.99653 0.99664 0.99674 0.99683 0.99693 0.99702 0.99711 0.99720 0.99728 0.99736 2.80 0.99744 0.99752 0.99760 0.99767 0.99774 0.99781 0.99788 0.99795 0.99801 0.99807 2.90 0.99813 0.99819 0.99825 0.99831 0.99836 0.99841 0.99846 0.99851 0.99856 0.99861 3.00 0.99865 0.99869 0.99874 0.99878 0.99882 0.99886 0.99889 0.99893 0.99896 0.99900 3.10 0.99903 0.99906 0.99910 0.99913 0.99916 0.99918 0.99921 0.99924 0.99926 0.99929 3.20 0.99931 0.99934 0.99936 0.99938 0.99940 0.99942 0.99944 0.99946 0.99948 0.99950 3.30 0.99952 0.99953 0.99955 0.99957 0.99958 0.99960 0.99961 0.99962 0.99964 0.99965 3.40 0.99966 0.99968 0.99969 0.99970 0.99971 0.99972 0.99973 0.99974 0.99975 0.99976 3.50 0.99977 0.99978 0.99978 0.99979 0.99980 0.99981 0.99981 0.99982 0.99983 0.99983 3.60 0.99984 0.99985 0.99985 0.99986 0.99986 0.99987 0.99987 0.99988 0.99988 0.99989 3.70 0.99989 0.99990 0.99990 0.99990 0.99991 0.99991 0.99992 0.99992 0.99992 0.99992

16
3.80 0.99993 0.99993 0.99993 0.99994 0.99994 0.99994 0.99994 0.99995 0.99995 0.99995 3.90 0.99995 0.99995 0.99996 0.99996 0.99996 0.99996 0.99996 0.99996 0.99997 0.99997 4.00 0.99997 0.99997 0.99997 0.99997 0.99997 0.99997 0.99998 0.99998 0.99998 0.99998 4.10 0.99998 0.99998 0.99998 0.99998 0.99998 0.99998 0.99998 0.99998 0.99999 0.99999 4.20 0.99999 0.99999 0.99999 0.99999 0.99999 0.99999 0.99999 0.99999 0.99999 0.99999 4.30 0.99999 0.99999 0.99999 0.99999 0.99999 0.99999 0.99999 0.99999 0.99999 0.99999 4.40 0.99999 0.99999 1.00000 1.00000 1.00000 1.00000 1.00000 1.00000 1.00000 1.00000 4.50 1.00000 1.00000 1.00000 1.00000 1.00000 1.00000 1.00000 1.00000 1.00000 1.00000 4.60 1.00000 1.00000 1.00000 1.00000 1.00000 1.00000 1.00000 1.00000 1.00000 1.00000 4.70 1.00000 1.00000 1.00000 1.00000 1.00000 1.00000 1.00000 1.00000 1.00000 1.00000 4.80 1.00000 1.00000 1.00000 1.00000 1.00000 1.00000 1.00000 1.00000 1.00000 1.00000 4.90 1.00000 1.00000 1.00000 1.00000 1.00000 1.00000 1.00000 1.00000 1.00000 1.00000
T Table 1

17
T Table 2
18
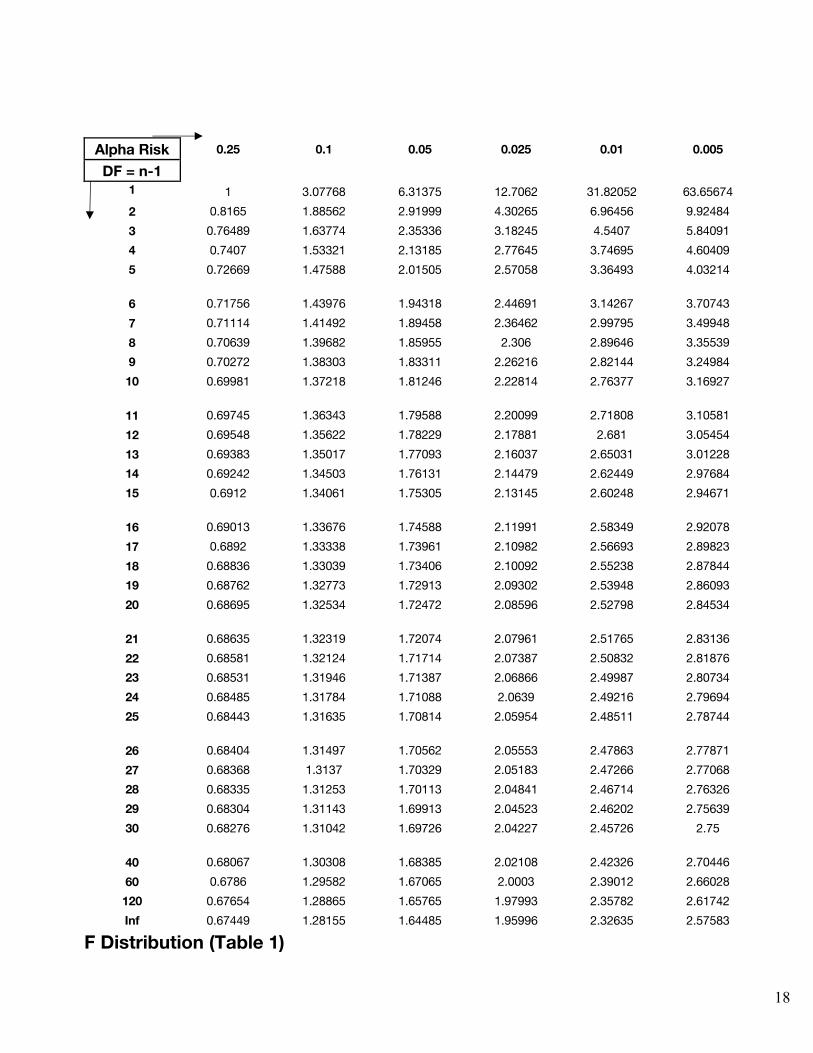
Alpha Risk 0.25 0.1 0.05 0.025 0.01 0.005
DF = n-1 1 1 3.07768 6.31375 12.7062 31.82052 63.65674 2 0.8165 1.88562 2.91999 4.30265 6.96456 9.92484 3 0.76489 1.63774 2.35336 3.18245 4.5407 5.84091 4 0.7407 1.53321 2.13185 2.77645 3.74695 4.60409 5 0.72669 1.47588 2.01505 2.57058 3.36493 4.03214 6 0.71756 1.43976 1.94318 2.44691 3.14267 3.70743 7 0.71114 1.41492 1.89458 2.36462 2.99795 3.49948 8 0.70639 1.39682 1.85955 2.306 2.89646 3.35539 9 0.70272 1.38303 1.83311 2.26216 2.82144 3.24984 10 0.69981 1.37218 1.81246 2.22814 2.76377 3.16927
11 0.69745 1.36343 1.79588 2.20099 2.71808 3.10581 12 0.69548 1.35622 1.78229 2.17881 2.681 3.05454 13 0.69383 1.35017 1.77093 2.16037 2.65031 3.01228 14 0.69242 1.34503 1.76131 2.14479 2.62449 2.97684 15 0.6912 1.34061 1.75305 2.13145 2.60248 2.94671
16 0.69013 1.33676 1.74588 2.11991 2.58349 2.92078 17 0.6892 1.33338 1.73961 2.10982 2.56693 2.89823 18 0.68836 1.33039 1.73406 2.10092 2.55238 2.87844 19 0.68762 1.32773 1.72913 2.09302 2.53948 2.86093 20 0.68695 1.32534 1.72472 2.08596 2.52798 2.84534
21 0.68635 1.32319 1.72074 2.07961 2.51765 2.83136 22 0.68581 1.32124 1.71714 2.07387 2.50832 2.81876 23 0.68531 1.31946 1.71387 2.06866 2.49987 2.80734 24 0.68485 1.31784 1.71088 2.0639 2.49216 2.79694 25 0.68443 1.31635 1.70814 2.05954 2.48511 2.78744
26 0.68404 1.31497 1.70562 2.05553 2.47863 2.77871 27 0.68368 1.3137 1.70329 2.05183 2.47266 2.77068 28 0.68335 1.31253 1.70113 2.04841 2.46714 2.76326 29 0.68304 1.31143 1.69913 2.04523 2.46202 2.75639 30 0.68276 1.31042 1.69726 2.04227 2.45726 2.75
40 0.68067 1.30308 1.68385 2.02108 2.42326 2.70446 60 0.6786 1.29582 1.67065 2.0003 2.39012 2.66028 120 0.67654 1.28865 1.65765 1.97993 2.35782 2.61742 Inf 0.67449 1.28155 1.64485 1.95996 2.32635 2.57583
F Distribution (Table 1)

19
F Distribution (Table 2)

20
F Distribution (Table 3)

21
Tabulated value for α = 0.01
F Distribution (Table 4)
D/N 1 2 3 4 5 6 7 8 91 4052.18 4999.5 5403.35 5624.58 5763.65 5858.99 5928.36 5981.07 6022.472 98.5 99 99.17 99.25 99.3 99.33 99.36 99.37 99.393 34.12 30.82 29.46 28.71 28.24 27.91 27.67 27.49 27.354 21.2 18 16.69 15.98 15.52 15.21 14.98 14.8 14.665 16.26 13.27 12.06 11.39 10.97 10.67 10.46 10.29 10.166 13.75 10.92 9.78 9.15 8.75 8.47 8.26 8.1 7.987 12.25 9.55 8.45 7.85 7.46 7.19 6.99 6.84 6.728 11.26 8.65 7.59 7.01 6.63 6.37 6.18 6.03 5.919 10.56 8.02 6.99 6.42 6.06 5.8 5.61 5.47 5.3510 10.04 7.56 6.55 5.99 5.64 5.39 5.2 5.06 4.9411 9.65 7.21 6.22 5.67 5.32 5.07 4.89 4.74 4.6312 9.33 6.93 5.95 5.41 5.06 4.82 4.64 4.5 4.3913 9.07 6.7 5.74 5.21 4.86 4.62 4.44 4.3 4.1914 8.86 6.51 5.56 5.04 4.69 4.46 4.28 4.14 4.0315 8.68 6.36 5.42 4.89 4.56 4.32 4.14 4 3.8916 8.53 6.23 5.29 4.77 4.44 4.2 4.03 3.89 3.7817 8.4 6.11 5.18 4.67 4.34 4.1 3.93 3.79 3.6818 8.29 6.01 5.09 4.58 4.25 4.01 3.84 3.71 3.619 8.18 5.93 5.01 4.5 4.17 3.94 3.77 3.63 3.5220 8.1 5.85 4.94 4.43 4.1 3.87 3.7 3.56 3.4621 8.02 5.78 4.87 4.37 4.04 3.81 3.64 3.51 3.422 7.95 5.72 4.82 4.31 3.99 3.76 3.59 3.45 3.3523 7.88 5.66 4.76 4.26 3.94 3.71 3.54 3.41 3.324 7.82 5.61 4.72 4.22 3.9 3.67 3.5 3.36 3.2625 7.77 5.57 4.68 4.18 3.85 3.63 3.46 3.32 3.2226 7.72 5.53 4.64 4.14 3.82 3.59 3.42 3.29 3.1827 7.68 5.49 4.6 4.11 3.78 3.56 3.39 3.26 3.1528 7.64 5.45 4.57 4.07 3.75 3.53 3.36 3.23 3.1229 7.6 5.42 4.54 4.04 3.73 3.5 3.33 3.2 3.0930 7.56 5.39 4.51 4.02 3.7 3.47 3.3 3.17 3.0740 7.31 5.18 4.31 3.83 3.51 3.29 3.12 2.99 2.8960 7.08 4.98 4.13 3.65 3.34 3.12 2.95 2.82 2.72120 6.85 4.79 3.95 3.48 3.17 2.96 2.79 2.66 2.56inf 6.63 4.61 3.78 3.32 3.02 2.8 2.64 2.51 2.41

22
Tabulated value for α = 0.01
F Distribution (Table 5)
D/N 10 12 15 20 24 30 40 60 120 inf1 6055.85 6106.32 6157.28 6208.73 6234.63 6260.65 6286.78 6313.03 6339.39 63662 99.4 99.42 99.43 99.45 99.46 99.47 99.47 99.48 99.49 99.53 27.23 27.05 26.87 26.69 26.6 26.5 26.41 26.32 26.22 26.134 14.55 14.37 14.2 14.02 13.93 13.84 13.75 13.65 13.56 13.465 10.05 9.89 9.72 9.55 9.47 9.38 9.29 9.2 9.11 9.026 7.87 7.72 7.56 7.4 7.31 7.23 7.14 7.06 6.97 6.887 6.62 6.47 6.31 6.16 6.07 5.99 5.91 5.82 5.74 5.658 5.81 5.67 5.52 5.36 5.28 5.2 5.12 5.03 4.95 4.869 5.26 5.11 4.96 4.81 4.73 4.65 4.57 4.48 4.4 4.3110 4.85 4.71 4.56 4.41 4.33 4.25 4.17 4.08 4 3.9111 4.54 4.4 4.25 4.1 4.02 3.94 3.86 3.78 3.69 3.612 4.3 4.16 4.01 3.86 3.78 3.7 3.62 3.54 3.45 3.3613 4.1 3.96 3.82 3.66 3.59 3.51 3.43 3.34 3.25 3.1714 3.94 3.8 3.66 3.51 3.43 3.35 3.27 3.18 3.09 315 3.8 3.67 3.52 3.37 3.29 3.21 3.13 3.05 2.96 2.8716 3.69 3.55 3.41 3.26 3.18 3.1 3.02 2.93 2.84 2.7517 3.59 3.46 3.31 3.16 3.08 3 2.92 2.83 2.75 2.6518 3.51 3.37 3.23 3.08 3 2.92 2.84 2.75 2.66 2.5719 3.43 3.3 3.15 3 2.92 2.84 2.76 2.67 2.58 2.4920 3.37 3.23 3.09 2.94 2.86 2.78 2.69 2.61 2.52 2.4221 3.31 3.17 3.03 2.88 2.8 2.72 2.64 2.55 2.46 2.3622 3.26 3.12 2.98 2.83 2.75 2.67 2.58 2.5 2.4 2.3123 3.21 3.07 2.93 2.78 2.7 2.62 2.54 2.45 2.35 2.2624 3.17 3.03 2.89 2.74 2.66 2.58 2.49 2.4 2.31 2.2125 3.13 2.99 2.85 2.7 2.62 2.54 2.45 2.36 2.27 2.1726 3.09 2.96 2.81 2.66 2.58 2.5 2.42 2.33 2.23 2.1327 3.06 2.93 2.78 2.63 2.55 2.47 2.38 2.29 2.2 2.128 3.03 2.9 2.75 2.6 2.52 2.44 2.35 2.26 2.17 2.0629 3 2.87 2.73 2.57 2.49 2.41 2.33 2.23 2.14 2.0330 2.98 2.84 2.7 2.55 2.47 2.39 2.3 2.21 2.11 2.0140 2.8 2.66 2.52 2.37 2.29 2.2 2.11 2.02 1.92 1.860 2.63 2.5 2.35 2.2 2.12 2.03 1.94 1.84 1.73 1.6120 2.47 2.34 2.19 2.03 1.95 1.86 1.76 1.66 1.53 1.38inf 2.32 2.18 2.04 1.88 1.79 1.7 1.59 1.47 1.32 1
23
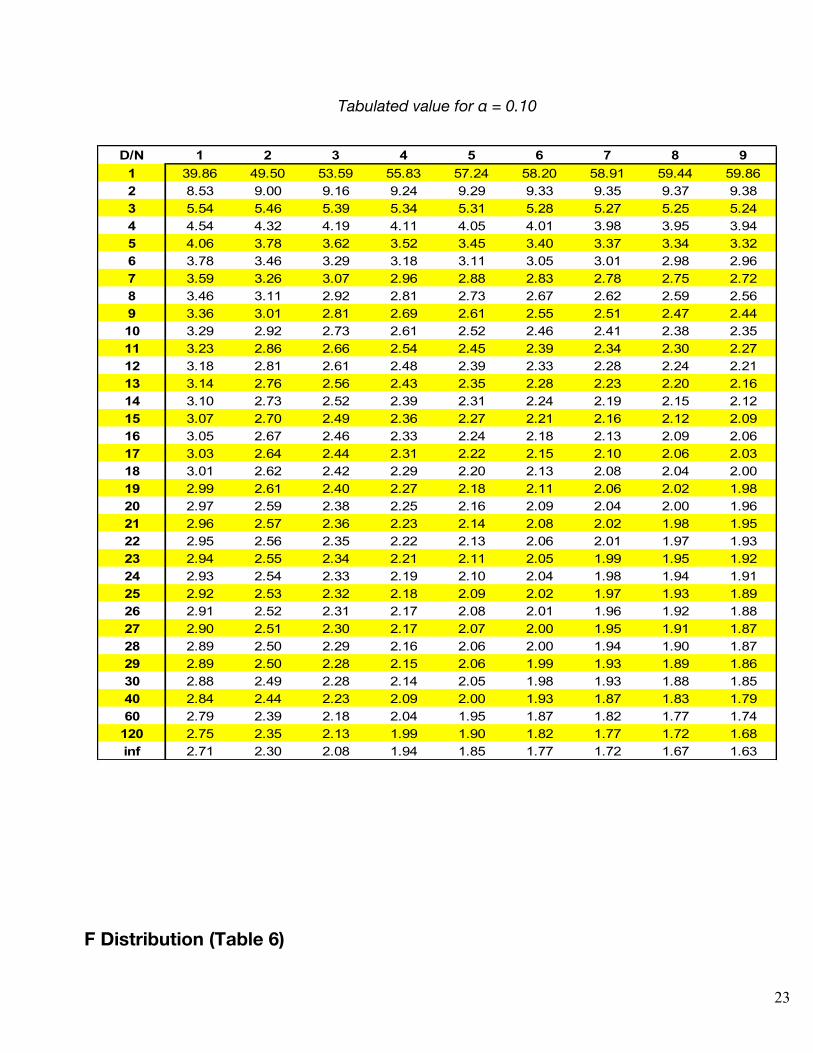
Tabulated value for α = 0.10
F Distribution (Table 6)
D/N 1 2 3 4 5 6 7 8 91 39.86 49.50 53.59 55.83 57.24 58.20 58.91 59.44 59.862 8.53 9.00 9.16 9.24 9.29 9.33 9.35 9.37 9.383 5.54 5.46 5.39 5.34 5.31 5.28 5.27 5.25 5.244 4.54 4.32 4.19 4.11 4.05 4.01 3.98 3.95 3.945 4.06 3.78 3.62 3.52 3.45 3.40 3.37 3.34 3.326 3.78 3.46 3.29 3.18 3.11 3.05 3.01 2.98 2.967 3.59 3.26 3.07 2.96 2.88 2.83 2.78 2.75 2.728 3.46 3.11 2.92 2.81 2.73 2.67 2.62 2.59 2.569 3.36 3.01 2.81 2.69 2.61 2.55 2.51 2.47 2.4410 3.29 2.92 2.73 2.61 2.52 2.46 2.41 2.38 2.3511 3.23 2.86 2.66 2.54 2.45 2.39 2.34 2.30 2.2712 3.18 2.81 2.61 2.48 2.39 2.33 2.28 2.24 2.2113 3.14 2.76 2.56 2.43 2.35 2.28 2.23 2.20 2.1614 3.10 2.73 2.52 2.39 2.31 2.24 2.19 2.15 2.1215 3.07 2.70 2.49 2.36 2.27 2.21 2.16 2.12 2.0916 3.05 2.67 2.46 2.33 2.24 2.18 2.13 2.09 2.0617 3.03 2.64 2.44 2.31 2.22 2.15 2.10 2.06 2.0318 3.01 2.62 2.42 2.29 2.20 2.13 2.08 2.04 2.0019 2.99 2.61 2.40 2.27 2.18 2.11 2.06 2.02 1.9820 2.97 2.59 2.38 2.25 2.16 2.09 2.04 2.00 1.9621 2.96 2.57 2.36 2.23 2.14 2.08 2.02 1.98 1.9522 2.95 2.56 2.35 2.22 2.13 2.06 2.01 1.97 1.9323 2.94 2.55 2.34 2.21 2.11 2.05 1.99 1.95 1.9224 2.93 2.54 2.33 2.19 2.10 2.04 1.98 1.94 1.9125 2.92 2.53 2.32 2.18 2.09 2.02 1.97 1.93 1.8926 2.91 2.52 2.31 2.17 2.08 2.01 1.96 1.92 1.8827 2.90 2.51 2.30 2.17 2.07 2.00 1.95 1.91 1.8728 2.89 2.50 2.29 2.16 2.06 2.00 1.94 1.90 1.8729 2.89 2.50 2.28 2.15 2.06 1.99 1.93 1.89 1.8630 2.88 2.49 2.28 2.14 2.05 1.98 1.93 1.88 1.8540 2.84 2.44 2.23 2.09 2.00 1.93 1.87 1.83 1.7960 2.79 2.39 2.18 2.04 1.95 1.87 1.82 1.77 1.74120 2.75 2.35 2.13 1.99 1.90 1.82 1.77 1.72 1.68inf 2.71 2.30 2.08 1.94 1.85 1.77 1.72 1.67 1.63

24
Tabulated value for α = 0.10
Chi- Squared Distribution (Table 1)
D/N 10 12 15 20 24 30 40 60 120 inf1 60.19 60.71 61.22 61.74 62.00 62.26 62.53 62.79 63.06 63.332 9.39 9.41 9.42 9.44 9.45 9.46 9.47 9.47 9.48 9.493 5.23 5.22 5.20 5.18 5.18 5.17 5.16 5.15 5.14 5.134 3.92 3.90 3.87 3.84 3.83 3.82 3.80 3.79 3.78 3.765 3.30 3.27 3.24 3.21 3.19 3.17 3.16 3.14 3.12 3.106 2.94 2.90 2.87 2.84 2.82 2.80 2.78 2.76 2.74 2.727 2.70 2.67 2.63 2.59 2.58 2.56 2.54 2.51 2.49 2.478 2.54 2.50 2.46 2.42 2.40 2.38 2.36 2.34 2.32 2.299 2.42 2.38 2.34 2.30 2.28 2.25 2.23 2.21 2.18 2.1610 2.32 2.28 2.24 2.20 2.18 2.16 2.13 2.11 2.08 2.0611 2.25 2.21 2.17 2.12 2.10 2.08 2.05 2.03 2.00 1.9712 2.19 2.15 2.10 2.06 2.04 2.01 1.99 1.96 1.93 1.9013 2.14 2.10 2.05 2.01 1.98 1.96 1.93 1.90 1.88 1.8514 2.10 2.05 2.01 1.96 1.94 1.91 1.89 1.86 1.83 1.8015 2.06 2.02 1.97 1.92 1.90 1.87 1.85 1.82 1.79 1.7616 2.03 1.99 1.94 1.89 1.87 1.84 1.81 1.78 1.75 1.7217 2.00 1.96 1.91 1.86 1.84 1.81 1.78 1.75 1.72 1.6918 1.98 1.93 1.89 1.84 1.81 1.78 1.75 1.72 1.69 1.6619 1.96 1.91 1.86 1.81 1.79 1.76 1.73 1.70 1.67 1.6320 1.94 1.89 1.84 1.79 1.77 1.74 1.71 1.68 1.64 1.6121 1.92 1.87 1.83 1.78 1.75 1.72 1.69 1.66 1.62 1.5922 1.90 1.86 1.81 1.76 1.73 1.70 1.67 1.64 1.60 1.5723 1.89 1.84 1.80 1.74 1.72 1.69 1.66 1.62 1.59 1.5524 1.88 1.83 1.78 1.73 1.70 1.67 1.64 1.61 1.57 1.5325 1.87 1.82 1.77 1.72 1.69 1.66 1.63 1.59 1.56 1.5226 1.86 1.81 1.76 1.71 1.68 1.65 1.61 1.58 1.54 1.5027 1.85 1.80 1.75 1.70 1.67 1.64 1.60 1.57 1.53 1.4928 1.84 1.79 1.74 1.69 1.66 1.63 1.59 1.56 1.52 1.4829 1.83 1.78 1.73 1.68 1.65 1.62 1.58 1.55 1.51 1.4730 1.82 1.77 1.72 1.67 1.64 1.61 1.57 1.54 1.50 1.4640 1.76 1.71 1.66 1.61 1.57 1.54 1.51 1.47 1.42 1.3860 1.71 1.66 1.60 1.54 1.51 1.48 1.44 1.40 1.35 1.29120 1.65 1.60 1.55 1.48 1.45 1.41 1.37 1.32 1.26 1.10inf 1.60 1.55 1.49 1.42 1.38 1.34 1.30 1.24 1.17 1.00
25
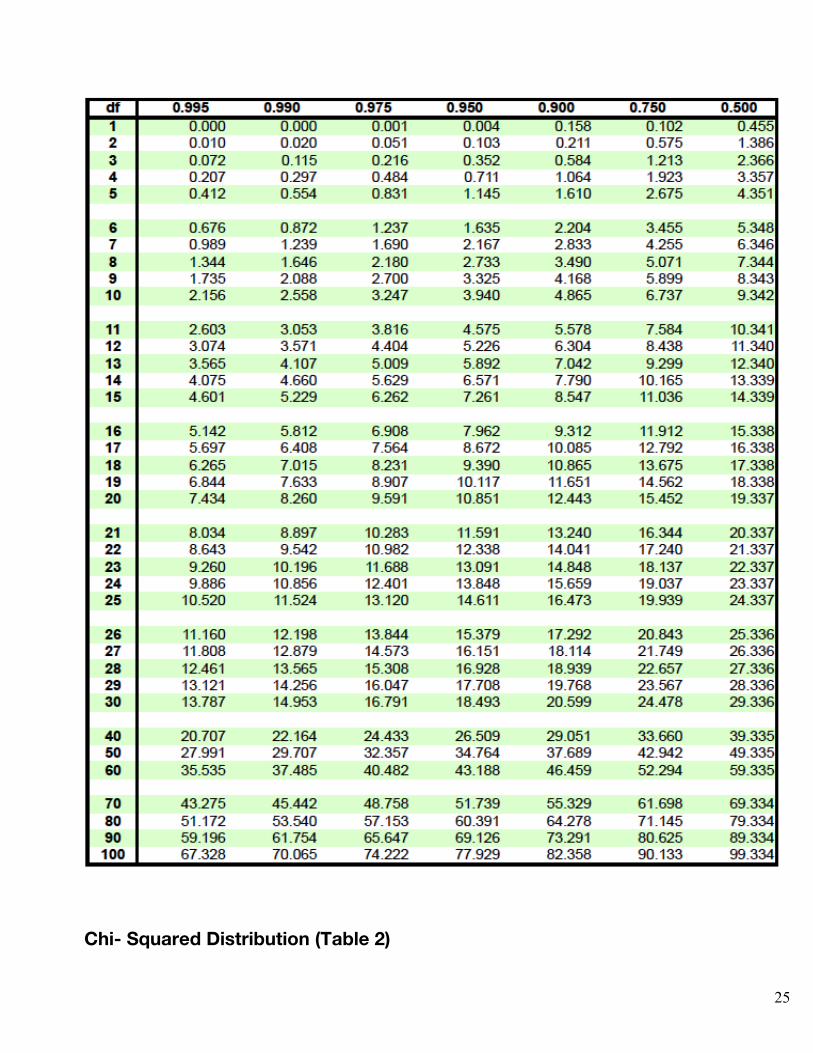
Chi- Squared Distribution (Table 2)

26
Control Charts – Table of Constants

27
X- Bar Chart constants
For sigma estimate
R Chart constants S Chart constants
Sample size = n A2 A3 d2 D3 D4 B3 B4
2 1.880 2.659 1.128 0.000 3.267 0.000 3.267 3 1.023 1.954 1.693 0.000 2.575 0.000 2.568 4 0.729 1.628 2.059 0.000 2.282 0.000 2.266 5 0.577 1.427 2.326 0.000 2.114 0.000 2.089 6 0.483 1.287 2.534 0.000 2.004 0.030 1.970 7 0.419 1.182 2.704 0.076 1.924 0.118 1.882 8 0.373 1.099 2.847 0.136 1.864 0.185 1.815 9 0.337 1.032 2.970 0.184 1.816 0.239 1.761 10 0.308 0.975 3.078 0.223 1.777 0.284 1.716 11 0.285 0.927 3.173 0.256 1.744 0.321 1.679 12 0.266 0.886 3.258 0.283 1.717 0.354 1.646 13 0.249 0.850 3.336 0.307 1.693 0.382 1.618 14 0.235 0.817 3.407 0.328 1.672 0.406 1.594 15 0.223 0.789 3.472 0.347 1.653 0.428 1.572 16 0.212 0.763 3.532 0.363 1.637 0.448 1.552 17 0.203 0.739 3.588 0.378 1.622 0.466 1.534 18 0.194 0.718 3.640 0.391 1.609 0.482 1.518 19 0.187 0.698 3.689 0.404 1.596 0.497 1.503 20 0.180 0.680 3.735 0.415 1.585 0.510 1.490 21 0.173 0.663 3.778 0.425 1.575 0.523 1.477 22 0.167 0.647 3.819 0.435 1.565 0.534 1.466 23 0.162 0.633 3.858 0.443 1.557 0.545 1.455 24 0.157 0.619 3.895 0.452 1.548 0.555 1.445 25 0.153 0.606 3.931 0.459 1.541 0.565 1.435