IAR C-SPY Hardware Debugger Systemsftp.indes.com/pub/mirrors/ftp.iar.se/ · quick introduction to...
37
IAR C-SPY Hardware Debugger Systems User Guide for Renesas PC7501 Emulator and ROM-monitor
Transcript of IAR C-SPY Hardware Debugger Systemsftp.indes.com/pub/mirrors/ftp.iar.se/ · quick introduction to...
CSPC7501R-1
IAR C-SPY Hardware Debugger Systems
User Guide
forRenesas PC7501 Emulator
and ROM-monitor
CSPC7501R-1
COPYRIGHT NOTICE
© Copyright 1995-2006 IAR Systems. All rights reserved.
No part of this document may be reproduced without the prior written consent of IAR Systems. The software described in this document is furnished under a license and may only be used or copied in accordance with the terms of such a license.
DISCLAIMER
The information in this document is subject to change without notice and does not represent a commitment on any part of IAR Systems. While the information contained herein is assumed to be accurate, IAR Systems assumes no responsibility for any errors or omissions.
In no event shall IAR Systems, its employees, its contractors, or the authors of this document be liable for special, direct, indirect, or consequential damage, losses, costs, charges, claims, demands, claim for lost profits, fees, or expenses of any nature or kind.
TRADEMARKSIAR Systems, From Idea to Target, IAR Embedded Workbench, visualSTATE, IAR MakeApp and C-SPY are trademarks owned by IAR Systems AB.
Microsoft is a registered trademark, and Windows is a trademark of Microsoft Corporation.
All other product names are trademarks or registered trademarks of their respective owners.
EDITION NOTICE
First edition: March 2006
Part number: CSPC7501R-1

Contents
Preface .................................................................................................................................... v
Who should read this guide ...........................................................................v
How to use this guide .........................................................................................v
What this guide contains ................................................................................vi
Other documentation .......................................................................................vi
Document conventions ...................................................................................vii
Introduction to C-SPY hardware debugger systems ..... 1
Overview .....................................................................................................................1
Differences between the C-SPY systems ...................................................2
The PC7501 Emulator driver .......................................................................3
Getting started with the PC7501 emulator ..................................................3
The ROM-monitor drivers ..............................................................................4
The C-SPY serial ROM-monitor driver ......................................................4
The C-SPY USB ROM-monitor driver .......................................................6
Getting started with the ROM-monitor .......................................................7
Setting up C-SPY hardware debugger systems ..................... 9Generic options for hardware debugging ............................................9
Setup options .................................................................................................. 10
Download options ......................................................................................... 11
Extra Options ................................................................................................. 13
Using the PC7501 Emulator ...................................................................... 15
Setting up the debugger system .............................................................. 15
Communication ............................................................................................. 15
Emulator menu .................................................................................................... 17
Hardware Setup ............................................................................................. 18
Download Firmware ..................................................................................... 21
TCP/IP Setup ................................................................................................. 21
Trace Setup ..................................................................................................... 21
CSPC7501R-1
iii

iv
Trace ................................................................................................................ 22
Using breakpoints .............................................................................................. 22
Breakpoint Usage dialog box ..................................................................... 22
Using the ROM-monitor ............................................................................... 23
Memory configuration .................................................................................... 23
Memory map .................................................................................................. 23
ROM-monitor setup ......................................................................................... 25
Serial Communication options ................................................................... 26
ROM-monitor menu ......................................................................................... 27
Resolving problems ......................................................................................... 27
CSPC7501R-1
IAR C-SPY Hardware Debugger SystemsUser Guide
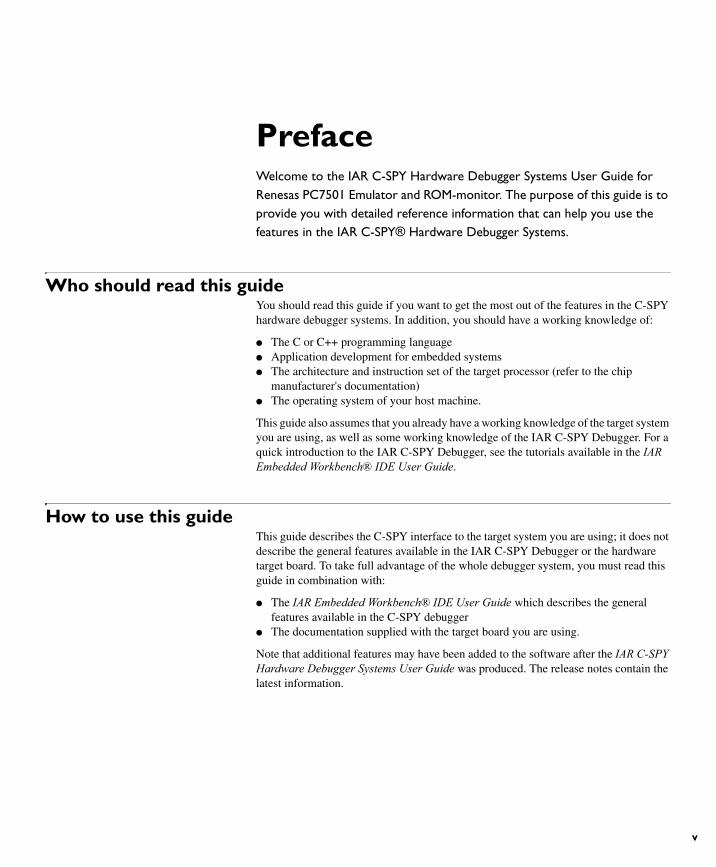
PrefaceWelcome to the IAR C-SPY Hardware Debugger Systems User Guide for Renesas PC7501 Emulator and ROM-monitor. The purpose of this guide is to provide you with detailed reference information that can help you use the features in the IAR C-SPY® Hardware Debugger Systems.
Who should read this guideYou should read this guide if you want to get the most out of the features in the C-SPY hardware debugger systems. In addition, you should have a working knowledge of:
● The C or C++ programming language● Application development for embedded systems● The architecture and instruction set of the target processor (refer to the chip
manufacturer's documentation)● The operating system of your host machine.
This guide also assumes that you already have a working knowledge of the target system you are using, as well as some working knowledge of the IAR C-SPY Debugger. For a quick introduction to the IAR C-SPY Debugger, see the tutorials available in the IAR Embedded Workbench® IDE User Guide.
How to use this guideThis guide describes the C-SPY interface to the target system you are using; it does not describe the general features available in the IAR C-SPY Debugger or the hardware target board. To take full advantage of the whole debugger system, you must read this guide in combination with:
● The IAR Embedded Workbench® IDE User Guide which describes the general features available in the C-SPY debugger
● The documentation supplied with the target board you are using.
Note that additional features may have been added to the software after the IAR C-SPY Hardware Debugger Systems User Guide was produced. The release notes contain the latest information.
CSPC7501R-1
v

vi
What this guide contains
What this guide containsBelow is a brief outline and summary of the chapters in this guide.
● Introduction to C-SPY hardware debugger systems introduces you to the available C-SPY hardware debugger systems to be used with the target board. The chapter briefly shows the difference in functionality provided by the different C-SPY drivers.
● Setting up C-SPY hardware debugger systems describes the general options that must be set for all hardware debugger systems.
● Using the PC7501 Emulator describes the additional options, menus, and features provided by the PC7501 Emulator debugger system.
● Using the ROM-monitor describes the additional options, menus, and features provided by the ROM-monitor debugger system.
Other documentationThe complete set of IAR development tools for the target processor are described in a series of guides. For information about:
● Programming for the IAR Compiler, refer to the IAR C/C++ Compiler Reference Guide
● Programming for the IAR Assembler, refer to the IAR Assembler Reference Guide● Using the IAR XLINK Linker, the IAR XAR Library Builder, and the IAR XLIB
Librarian, refer to the IAR Linker and Library Tools Reference Guide● Using the IAR CLIB or DLIB library, refer to the IAR Embedded Workbench IDE
online help system.
All of these guides are delivered in hypertext PDF or HTML format on the installation media. Some of them are also delivered as printed books.
Recommended web sites:
● The Renesas web site, www.Renesas.com, contains information and news about the target processors.
● The IAR Systems web site, www.iar.com, holds application notes and other product information.
● Finally, the Embedded C++ Technical Committee web site, www.caravan.net/ec2plus, contains information about the Embedded C++ standard.
CSPC7501R-1
IAR C-SPY Hardware Debugger SystemsUser Guide

Preface
Document conventionsThis book uses the following typographic conventions:
Style Used for
computer Text that you type or that appears on the screen.
parameter A label representing the actual value you should type as part of a command.
[option] An optional part of a command.
{a | b | c} Alternatives in a command.
bold Names of menus, menu commands, buttons, and dialog boxes that appear on the screen.
reference A cross-reference within this guide or to another guide.
… An ellipsis indicates that the previous item can be repeated an arbitrary number of times.
Identifies instructions specific to the IAR Embedded Workbench IDE interface.
Identifies instructions specific to the command line interface.
Identifies helpful tips and programming hints.
Table 1: Typographic conventions used in this guide
CSPC7501R-1
vii
viii
Document conventions
CSPC7501R-1
IAR C-SPY Hardware Debugger SystemsUser Guide

Introduction to C-SPY hardware debugger systemsThis guide introduces you to the IAR C-SPY hardware debugger systems and to how they differ from the IAR C-SPY Simulator.
This guide assumes that you already have some working knowledge of the target system you are using, as well as some working knowledge of the IAR C-SPY Debugger. For a quick introduction, see the tutorials in the IAR Embedded Workbench® IDE User Guide.
Please note that a few additional features may have been added to the software after this guide was produced. The release notes contain the latest information.
OverviewThe IAR C-SPY Debugger consists of both a general part which provides a basic set of C-SPY features, and a driver. The C-SPY driver is the part that provides communication with and control of the target system. The driver also provides a user interface—special menus, windows, and dialog boxes—to the functions provided by the target system, for instance special breakpoints. This driver is automatically installed during the installation of the IAR Embedded Workbench.
This guide describes the operation of the following IAR C-SPY Debugger drivers:
● PC7501 emulator driver● Serial ROM-monitor driver● USB ROM-monitor driver.
For further details about the concepts that are related to the IAR C-SPY Debugger, see the IAR Embedded Workbench® IDE User Guide.
CSPC7501R-1
1

2
Overview
DIFFERENCES BETWEEN THE C-SPY SYSTEMS
The following table summarizes the key differences between the C-SPY target systems:
1. Only one at a time.2. Limited to small code sections and a maximum of 64 breakpoints.
Contact your software distributor or IAR Systems representative for information about available C-SPY drivers. Below are general descriptions of the different drivers.
Feature Simulator PC7501 Emulator ROM-monitor
Data breakpoints x
Code breakpoint (OP-fetch) x x x
Execution in real time x x
Simulated interrupts x
Real interrupts x x
Cycle counter x x
Execution time counter x1
Code coverage x
Data coverage x
Profiling x x2
Trace x
Table 2: Differences between available debug support for different target systems
CSPC7501R-1
IAR C-SPY Hardware Debugger SystemsUser Guide

Introduction to C-SPY hardware debugger systems
The PC7501 Emulator driverTo use the C-SPY debugger for the PC7501 Emulator, you must choose the PC7501 Emulator driver on the Debugger Setup page in the IAR Embedded Workbench IDE.
The C-SPY driver is the part that provides communication with and control of the target system. The driver also provides the user interface—menus, windows, and dialog boxes—to the functions provided by the target system, for instance, control of the available hardware breakpoints.
Figure 1: Communication overview
GETTING STARTED WITH THE PC7501 EMULATOR
This section demonstrates how to get started with the IAR C-SPY Emulator. The application is built and downloaded to the target system, and then executed.
As an example, use one of the PC7501 example project available by choosing Help>Startup Screen. Click on the Example workspaces button. In the Open Example Workspace dialog, select C and C++ tutorial. In the Workspace window that appears, click the tutor page.
Running the application
1 Select the Debug build configuration from the drop-down list at the top of the Workspace window.
Host computer
C-SPYDebugger
C-SPY driver
LAN or USBconnection
On-chipemulation CPU
Emulator
Memory
CSPC7501R-1
3

4
The ROM-monitor drivers
2 Choose Project>Options to choose the derivative to emulate and the settings you want to use.
For more information about the C-SPY Emulator options, see Using the PC7501 Emulator, page 15.
Click OK to close the Options dialog box.
3 Choose Project>Make to compile and link the source code.
4 Start C-SPY by clicking the Debug button or by choosing Project>Debug. The Hardware Setup dialog box appears. Press OK; C-SPY will download the application to the target system.
5 To open the Terminal I/O window, choose View>Terminal I/O.
6 Choose Debug>Go or click the Go button to start the execution.
7 Click the Stop button to stop the execution or wait until program exit is reached.
The ROM-monitor driversTo use the C-SPY ROM-monitor, you must choose the corresponding ROM-monitor driver on the Debugger options page in the IAR Embedded Workbench IDE. There are two available ROM-monitor drivers:
● A serial ROM-monitor driver● A USB ROM-monitor driver.
THE C-SPY SERIAL ROM-MONITOR DRIVER
Using the C-SPY serial ROM-monitor driver, C-SPY can connect to various evaluation boards that have the Renesas ROM-monitor firmware programmed (the ROM-monitor program). This ROM-monitor program must be downloaded separately with a flash tool, and it runs in parallel with your application software. The firmware receives commands from the IAR C-SPY Debugger over a serial port or USB connection (via a COM Class driver, for example MCCI), and controls the execution of your application.
A suitable tool for downloading the Renesas ROM-monitor program is the Flash Starter Software for your processor, available for download from the Renesas web site www.renesas.com.
CSPC7501R-1
IAR C-SPY Hardware Debugger SystemsUser Guide

Introduction to C-SPY hardware debugger systems
The actual ROM-monitor program—together with installation notes—is usually supplied with the evaluation board.
Figure 2: C-SPY serial ROM-monitor communication overview
The Renesas USB 3D starter kits
The Renesas 3D boards that have a USB interface, communicate via a so-called MCCI COM Class Windows driver, delivered from third-party suppliers. When installing this driver, a free COM port is allocated on your host computer. Note that the serial C-SPY ROM-monitor driver must be used for debugging, not the C-SPY USB driver. To set up the correct COM port:
1 Choose System>Hardware>Device Manager from Windows’ control panel to check to what COM port the MCCI COM Class Windows driver has been assigned.
2 Select this port in Project>Debugger>ROM-monitor.
Host computer
Evaluation board
Non-volatile
RAM
IAR C-SPY Debugger
Serial ROM-monitor driver
Serial or USB connection
memory
ROM-monitor
Userapplication
Reservedfor monitor
Userapplication
CSPC7501R-1
5

6
The ROM-monitor drivers
THE C-SPY USB ROM-MONITOR DRIVER
The IAR C-SPY USB driver communicates with the Renesas USB Flash Writer M3A-0665 (USB Monitor board), which functions as an on-chip debugger that can be controlled by C-SPY. The actual ROM-monitor program—together with installation notes—is usually supplied with the evaluation board.
Figure 3: C-SPY USB ROM-monitor communication overview
Before you can connect to the evaluation board for the first time, you must install and run the Renesas tool Flash-over-USB (FoUSB). When this is done, USB drivers have been installed and the MCU firmware has been downloaded to the evaluation board. Note that this is only needed before you connect to the board for the first time.
The Flash-over-USB tool together with the installation notes are available for download from the Renesas web site www.renesas.com.
Host computer
IAR C-SPY Debugger
USB ROM-monitor driver
USB cable
Evaluation board
Non-volatile
RAM
memory
ROM-monitor
Userapplication
Reservedfor monitor
Userapplication
Flat cable
USB monitor board
CSPC7501R-1
IAR C-SPY Hardware Debugger SystemsUser Guide
Introduction to C-SPY hardware debugger systems
Supported evaluation boards
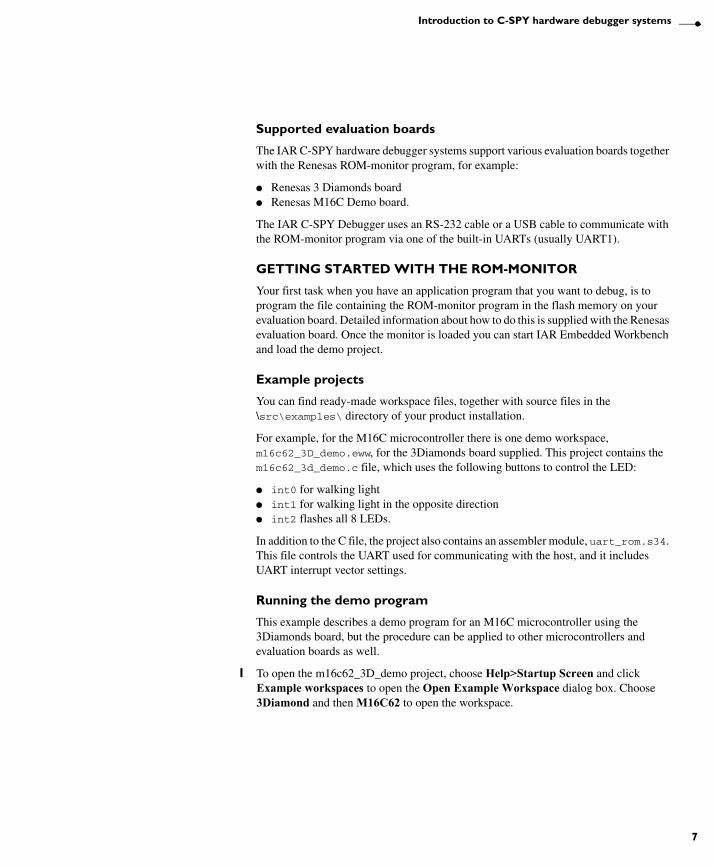
The IAR C-SPY hardware debugger systems support various evaluation boards together with the Renesas ROM-monitor program, for example:
● Renesas 3 Diamonds board● Renesas M16C Demo board.
The IAR C-SPY Debugger uses an RS-232 cable or a USB cable to communicate with the ROM-monitor program via one of the built-in UARTs (usually UART1).
GETTING STARTED WITH THE ROM-MONITOR
Your first task when you have an application program that you want to debug, is to program the file containing the ROM-monitor program in the flash memory on your evaluation board. Detailed information about how to do this is supplied with the Renesas evaluation board. Once the monitor is loaded you can start IAR Embedded Workbench and load the demo project.
Example projects
You can find ready-made workspace files, together with source files in the \src\examples\ directory of your product installation.
For example, for the M16C microcontroller there is one demo workspace, m16c62_3D_demo.eww, for the 3Diamonds board supplied. This project contains the m16c62_3d_demo.c file, which uses the following buttons to control the LED:
● int0 for walking light● int1 for walking light in the opposite direction● int2 flashes all 8 LEDs.
In addition to the C file, the project also contains an assembler module, uart_rom.s34. This file controls the UART used for communicating with the host, and it includes UART interrupt vector settings.
Running the demo program
This example describes a demo program for an M16C microcontroller using the 3Diamonds board, but the procedure can be applied to other microcontrollers and evaluation boards as well.
1 To open the m16c62_3D_demo project, choose Help>Startup Screen and click Example workspaces to open the Open Example Workspace dialog box. Choose 3Diamond and then M16C62 to open the workspace.
CSPC7501R-1
7

8
The ROM-monitor drivers
2 Choose Project>Options. In addition to the factory settings, make sure the following options are selected:
For further details about the C-SPY ROM-monitor options and how to configure C-SPY to interact with the target board, see Using the ROM-monitor, page 23.
Click OK to close the Options dialog box.
3 Click the Make button to compile and link the program.
4 Start C-SPY by clicking the Debug button or by choosing Project>Debug. If C-SPY should fail to establish contact with the ROM-monitor program, see Resolving problems, page 27.
5 Choose Debug>Go or click the Go button to start the program.
6 On the board, press the buttons INT1 to start the counter and INT0 to stop it. The Adtrg button resets the counter.
7 Click the Stop button to stop execution.
Category Page Option/Setting
Linker Include Linker command fileOverride default:
$TOOLKIT_DIR$\config\lnkm30624fg.xcl
Debugger Setup Driver: Serial ROM-Monitor
Serial Communication Port: COM1Baud: 38400Parity: NoneData bit: 8 data bitsStop bit: 2 stop bitsHandshaking: None
Table 3: Project options for ROM-monitor example
CSPC7501R-1
IAR C-SPY Hardware Debugger SystemsUser Guide

Setting up C-SPY hardware debugger systemsThis chapter describes the options and settings shared by both the PC7501 Emulator and the ROM-monitor. In addition, you must also read the chapter specific to the debugger system you are using.
Generic options for hardware debuggingBefore you start the C-SPY debugger you must set up the generic options for the debugger system. Choose Project>Options to open the Options dialog box.
CSPC7501R-1
9

10
Generic options for hardware debugging
SETUP OPTIONS
On the Setup page, select the appropriate driver.
Figure 4: Project options dialog box
For information about the settings Setup macros, Run to, and Device description file, as well as for information about the Plugins page, see the IAR Embedded Workbench® IDE User Guide.
To set the driver-specific options, select the appropriate driver from the Category list. When you have set all the required options, click OK in the Options dialog box. See Using the PC7501 Emulator, page 15, or Using the ROM-monitor, page 23, for details about these options.
CSPC7501R-1
IAR C-SPY Hardware Debugger SystemsUser Guide

Setting up C-SPY hardware debugger systems
DOWNLOAD OPTIONS
The Download page contains the options related to downloading.
Figure 5: Download page
Verify download
Select this option to check every byte after loading to verify the download and that the memory of the target hardware is writable and mapped in a consistent way. A warning message will be generated if there are any errors during download.
Suppress download
If you already have your application in memory, for instance when debugging a live target, select Suppress Download. The time-consuming downloading is then disabled. The implicit RESET performed at C-SPY startup is not disabled.
Flash download
Use the Flash download option and its suboptions to use a flash loader to download your application to flash memory. If a flash loader is available for the selected chip, it will be used as default. The flash loader API, documentation, and an implementation example is available to implement your own flash loader.
Note: Currently, the option of using a flash loader is only available to the C-SPY ROM-monitor debugger system.
A flash loader can be described as an agent that is downloaded to the target. It fetches the actual application from the C-SPY debugger and programs it into flash memory. The flash loader uses the file I/O mechanism to read the application program from the host.
CSPC7501R-1
11
12
Generic options for hardware debugging
When the Flash download option is enabled, the following steps will be performed when the debug session starts:
1 C-SPY downloads the flash loader into target RAM.
2 C-SPY starts execution of the flash loader.
3 The flash loader opens the file holding the application code.
4 The flash loader reads the application code and programs it into flash memory.
5 The flash loader terminates.
6 C-SPY switches context to the user application.
When building an application that will be downloaded to flash, special consideration is needed. Two output files must be generated. The first is the usual UBROF file that provides the debugger with debug and symbol information. The second file is a simple binary format file (simple code with the filename extension sim) that will be opened and read by the flash loader when downloading the application to flash memory.
The simple-code file must have the same path and name as the UBROF file except for the file extension.
To create the extra output file, choose Project>Options and select the Linker category. Select the Allow C-SPY-specific extra output file option. On the Extra Output page, select the Generate extra output file option. Choose the Simple-code output format and format variant None. Do not override the default output file. For reference information about these options, see the IAR Embedded Workbench® IDE User Guide.
Any errors during the download will be logged to a log file. The log file will have the same path and name as the output files but with the tail and filename extension _flash.log.
Flash loader arguments
By using this text field you can pass arguments to control the flash loader. Each flash loader can define its own set of specific arguments.
Override default flash base address
The default base address used for writing the first (lowest address) byte to flash is specified in the linker control file. It can sometimes be necessary to override the flash base address and start at a different location in the address space. One example when this can be needed is for devices that remap the location of the flash memory.
CSPC7501R-1
IAR C-SPY Hardware Debugger SystemsUser Guide

Setting up C-SPY hardware debugger systems
The numeric format of the field is:
Flash loader
In the flash loader text field, specify which flash loader to use and its path. A browse button is available for your convenience.
EXTRA OPTIONS
The Extra Options page provides you with a command line interface to the C-SPY debugger.
Figure 6: Extra Options page for C-SPY command line options
Use command line options
Additional command line arguments (not supported by the IAR Embedded Workbench IDE) for the C-SPY debugger can be specified here.
123456 Decimal number
0x123456 Hexadecimal number
0123456 Octal number
CSPC7501R-1
13

14
Generic options for hardware debugging
CSPC7501R-1
IAR C-SPY Hardware Debugger SystemsUser Guide

Using the PC7501 EmulatorThis chapter describes the options and settings needed for using the C-SPY PC7501 Emulator debugger system. The chapter also describes how to use the debugger. The application can be run in realtime when using these features, which provides a powerful tool for locating problems in the application or the hardware.
Setting up the debugger systemBefore you start the C-SPY debugger you must set up the generic options for the debugger system. For information about how to do this, see the chapter Setting up C-SPY hardware debugger systems in this guide. When this is done, you must set the emulator-specific options. To set PC7501 Emulator options, choose Project>Options and click the Communication tab in the C-SPY Debugger>PC7501 Emulator category.
COMMUNICATION
With the options on the Communication page you can modify the behavior of the communication with the emulator.
Figure 7: PC7501 Emulator communication options
CSPC7501R-1
15
16
Setting up the debugger system
USB
Use this option if a PC7501 Emulator is connected to your host computer via a USB cable. If more than one emulator is connected, choose which one to use with the Serial No option.
LAN
Use this option to debug using a PC7501 Emulator on the same local area network that your host computer is connected to. The emulator must first be assigned a TCP/IP address with the Emulator>TCP/IP Setup command, see Emulator menu, page 17.
Log communication
Use this option to log the communication between C-SPY and the target system to a file. To interpret the result, a detailed knowledge of the communication protocol is required.
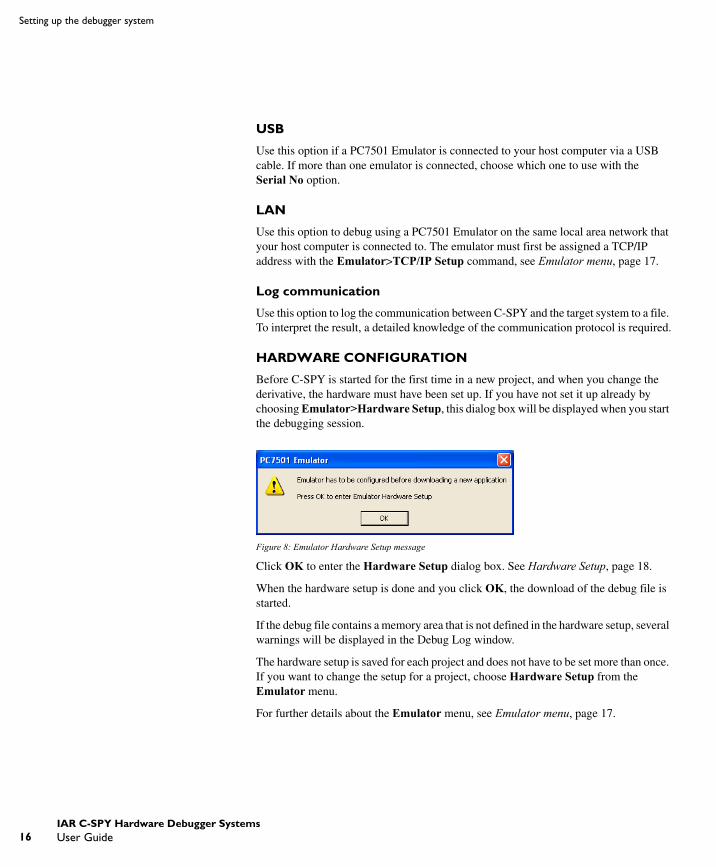
HARDWARE CONFIGURATION
Before C-SPY is started for the first time in a new project, and when you change the derivative, the hardware must have been set up. If you have not set it up already by choosing Emulator>Hardware Setup, this dialog box will be displayed when you start the debugging session.
Figure 8: Emulator Hardware Setup message
Click OK to enter the Hardware Setup dialog box. See Hardware Setup, page 18.
When the hardware setup is done and you click OK, the download of the debug file is started.
If the debug file contains a memory area that is not defined in the hardware setup, several warnings will be displayed in the Debug Log window.
The hardware setup is saved for each project and does not have to be set more than once. If you want to change the setup for a project, choose Hardware Setup from the Emulator menu.
For further details about the Emulator menu, see Emulator menu, page 17.
CSPC7501R-1
IAR C-SPY Hardware Debugger SystemsUser Guide
Using the PC7501 Emulator
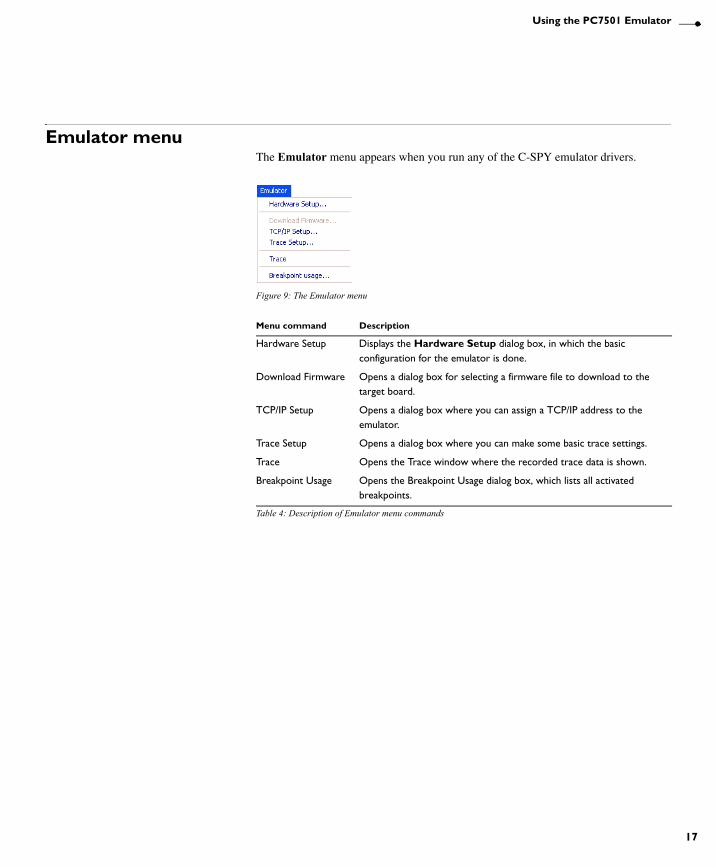
Emulator menuThe Emulator menu appears when you run any of the C-SPY emulator drivers.
Figure 9: The Emulator menu
Menu command Description
Hardware Setup Displays the Hardware Setup dialog box, in which the basic configuration for the emulator is done.
Download Firmware Opens a dialog box for selecting a firmware file to download to the target board.
TCP/IP Setup Opens a dialog box where you can assign a TCP/IP address to the emulator.
Trace Setup Opens a dialog box where you can make some basic trace settings.
Trace Opens the Trace window where the recorded trace data is shown.
Breakpoint Usage Opens the Breakpoint Usage dialog box, which lists all activated breakpoints.
Table 4: Description of Emulator menu commands
CSPC7501R-1
17
18
Emulator menu
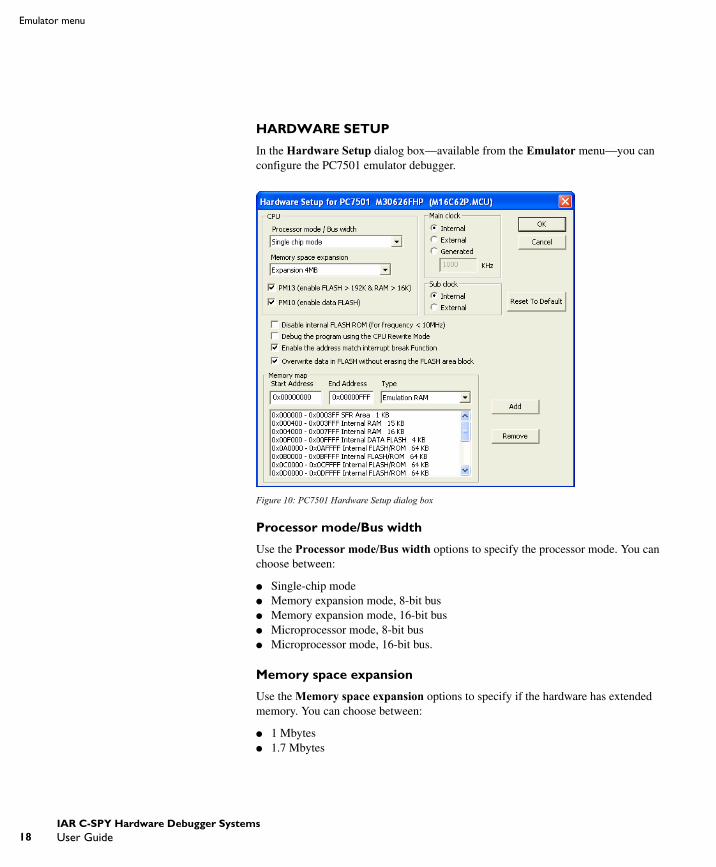
HARDWARE SETUP
In the Hardware Setup dialog box—available from the Emulator menu—you can configure the PC7501 emulator debugger.
Figure 10: PC7501 Hardware Setup dialog box
Processor mode/Bus width
Use the Processor mode/Bus width options to specify the processor mode. You can choose between:
● Single-chip mode● Memory expansion mode, 8-bit bus● Memory expansion mode, 16-bit bus● Microprocessor mode, 8-bit bus● Microprocessor mode, 16-bit bus.
Memory space expansion
Use the Memory space expansion options to specify if the hardware has extended memory. You can choose between:
● 1 Mbytes● 1.7 Mbytes
CSPC7501R-1
IAR C-SPY Hardware Debugger SystemsUser Guide

Using the PC7501 Emulator
● 4 Mbytes.
PM13 (enable FLASH > 192K & RAM > 16K)
To extend the internal reserved memory area, select this option to set the control bit (PM13, bit 3 at 000005H) to 1. By default, the internal reserved area expansion bit is set to 0. When this option is selected, flash memory larger than 192 Kbytes and RAM larger than 16 Kbytes can be used.
PM10 (enable data FLASH)
Select this option to set the CS2 area select bit (PM10, bit 0 at 000005H) to 1. By default, the CS2 area select bit is set to 0. When this option is selected, data flash memory can be used.
Main clock
Use the Main clock options to set the CPU clock source:
● The Internal option uses the target clock as the CPU clock● The External option uses the emulator as the CPU clock● The Generated option uses a clock generated by the emulator, running at a
frequency between 1000 kHz and 99,999 kHz. Type the desired frequency.
Sub clock
Use the Sub clock options to set the CPU sub clock source:
● The Internal option uses the target clock as the CPU sub clock.● The External option uses the emulator as the CPU sub clock
Disable internal FLASH ROM
Select this option to prevent your application to be downloaded into the microcontroller unit’s internal FLASH ROM. You might have to use this option if the internal FLASH ROM cannot be rewritten. This is the case, for instance, when you are using the MCU in low power mode; typically at a clock frequency below 10,000 kHz.
By default, this option is not selected.
Debug the program using the CPU Rewrite Mode
Select this option if you are debugging the target system using the CPU Rewrite Mode.
When debugging in CPU rewrite mode, the following limitations apply:
● Address match breakpoints cannot be set● No software breakpoints can be set in the internal ROM area.
CSPC7501R-1
19

20
Emulator menu
By default, the option is not selected.
Enable the address match interrupt break function
Selecting this option stops the target application immediately before it executes an instruction at a specified address. This mechanism uses the MCU’s address interrupt function (that is, hardware breakpoints), so when you debug that interrupt function itself you must deselect this option. The number of available hardware breakpoints depends on the derivative you are using.
Overwrite data in FLASH without erasing the FLASH area block
If you select this option, writing to the flash memory area will merge the new data with the previous flash contents, and the addresses that are not being written to will keep their previous contents.
Memory map
With the Memory map options you can specify the emulation memory areas.
To define a new memory area, select a memory type from the Type drop-down list, then enter a start address in the Start address text box and select the memory length from the Length drop-down list. Click Add to add the memory area to the emulation memory map.
The following memory types are available:
Unallocated memory areas, except the SFR area, are always set as guarded, which means that they are read- and write-protected. If an application reads or writes in guarded memory or writes in ROM, the execution is stopped.
To clear an existing memory area, select it in the Memory map list and click Remove. Click Remove All to remove all memory areas.
Type Description
SFR Area The size of the SFR area is defined by the device description file.
Internal RAM The size of the Internal RAM area is defined by the device description file.
Emulation RAM The emulator alternate RAM area, which can be selected in steps of 4 Kbytes. Up to four emulation RAM areas can be defined. This is the only memory area whose size can defined in this dialog box.
Internal DATA/FLASH The size of the Internal DATA/FLASH area is defined by the device description file.
Internal FLASH/ROM The size of the Internal FLASH/ROM area is defined by the device description file.
Table 5: Available memory types in IE-78 emulator
CSPC7501R-1
IAR C-SPY Hardware Debugger SystemsUser Guide

Using the PC7501 Emulator
Reset To Default
Click the Reset To Default button to restore the factory settings.
DOWNLOAD FIRMWARE
If you need to download new firmware, for example if you are changing the processor configuration or if you need to upgrade the firmware, choose the Emulator>Download Firmware command. The PC7501 firmware files have the filename extension .s and are located in the target_processor\config\Renesas\ directory of your product installation.
TCP/IP SETUP
Opens a dialog box where you can assign a TCP/IP address to the emulator. The first time you do this, you must connect to the emulator via USB. After you have changed a TCP/IP address, you must switch the emulator off and then on again for the change to take effect.
TRACE SETUP
Opens a dialog box where you can make some basic trace settings.
Figure 11: PC7501 Trace Setup dialog box
Option Description
Time measurement source
This option decides whether the clock tick counter takes its value from a built-in 16 MHz clock or increments per executed machine instruction (Machine cycles). This value is used by both the cycle counter and the Trace window.
Trace buffer size The size of the trace buffer in bytes. The trace buffer can be between 10 and 262143 bytes. The larger the buffer is, the longer it takes each time you stop.
Table 6: PC7501 Trace Setup options
CSPC7501R-1
21

22
Using breakpoints
TRACE
The Trace window—available from the Emulator menu—displays a recorded sequence of executed machine instructions. In addition, the window can display trace data for expressions. For more information, see the IAR Embedded Workbench® IDE User Guide.
Using breakpointsThis section describes issues related to using breakpoints in the C-SPY hardware debugger systems.
BREAKPOINT USAGE DIALOG BOX
The Breakpoint Usage dialog box—available from the Emulator menu—lists all active breakpoints. For more information, see the IAR Embedded Workbench® IDE User Guide.
C-SPY USE OF BREAKPOINTS
If you set a breakpoint using the IAR CLIB runtime environment, C-SPY sets two breakpoints for internal use. To do this, the breakpoints in the emulator are used. The fact that C-SPY uses breakpoints is normally not a problem. However, one exception is C-SPY profiling, which require many breakpoints. (The PC7501 Emulator has 64 software breakpoints and 2–8 hardware breakpoints.)
Note: If you are using the IAR DLIB runtime environment, only one internal breakpoint will be needed per breakpoint that you set.
C-SPY will set a breakpoint if:
● the C-SPY option Run to has been selected (one breakpoint is set temporarily after each reset)
● the stack plugin is being used (if the C-SPY option Run to has been selected, the breakpoint needed for that will be used also by the stack plugin)
● the linker option With runtime control modules has been selected (debug support for program termination and optionally file I/O).
Exceeding the number of available software breakpoints will cause the debugger to single step. This will significantly reduce the execution speed.
You can prevent the debugger from using breakpoints in these situations by deselecting these options.
CSPC7501R-1
IAR C-SPY Hardware Debugger SystemsUser Guide

Using the ROM-monitorThis chapter describes the specific options, settings, configurations, and memory layout needed for using the C-SPY ROM-monitor debugger system. The chapter also describes how to use the debugger. The application can be run in real time when using these features, which provides a powerful tool for locating problems in the application or the hardware.
Generic settings for hardware debugger systems are described in the chapter Setting up C-SPY hardware debugger systems.
Memory configurationUnderstanding the memory layout is important to avoid conflicts between the ROM-monitor program and your own application.
MEMORY MAP
This picture illustrates the memory map of the M16C/R8C flash device. The exact addresses are hardware-dependent; check the hardware manual.
The parts of the code that you want to debug should be downloaded in flash memory. Application code is by default placed in the CODE segment.
CSPC7501R-1
23

24
Memory configuration
ROM-MONITOR PROGRAM
The size of the ROM-monitor program is usually 8 or 16 Kbytes. The ROM-monitor program is located in the internal flash memory. It also uses about 100 bytes of RAM for its internal data.
Interrupt restrictions
The UART1 is reserved for use by the ROM-monitor program and therefore you cannot use the UART1 transmit/receive interrupts in your application. You are free to use all other interrupts. However, mind the following issues:
● When using interrupts and moving the INTB (that is, moving the variable vector), make sure to set UART1 transmit and UART1 receive (software interrupt numbers 19 and 20) to the UART handler. This address is defined in the file uart_rom.s34
● Do not disable interrupts by clearing the I flag, as the ROM-monitor program uses the UART1 in an interrupt-driven mode. If you have disabled the interrupt time over 260µs (for the communication speed 38400 Baud) in your interrupt service routine (ISR), there can be a communication problem between C-SPY and the ROM-monitor program. If that happens, the solution is to minimize the time when the interrupt is disabled. You can achieve this by enabling interrupts, by setting the I flag, at the beginning of your ISR.
● When using interrupts in your application, do not set the Interrupt Priority Level (IPL) to 7, since the highest priority level is used by the ROM-monitor.
MODIFYING THE LINKER COMMAND FILE
With the C-SPY ROM-monitor comes a set of pre-defined linker command file templates. If none of these template files correspond with the memory layout of your target, you must modify a file to suit your target configuration.
The following two examples show the part of a linker file that sets up the memory areas available for your application on a target with 384 Kbytes of ROM and 31 Kbytes of RAM.
Example 1 – Space is not reserved for a ROM-monitor program
//Memory areas available for the application-D_USER_RAM_BEGIN=400-D_USER_RAM_END=7FFF-D_USER_ROM_BEGIN=A000-D_USER_ROM_END=FFCFF
Example 2 – Space is reserved for a 16 Kbyte ROM-monitor program
//Memory areas available for the application-D_USER_RAM_BEGIN=400
CSPC7501R-1
IAR C-SPY Hardware Debugger SystemsUser Guide
Using the ROM-monitor
-D_USER_RAM_END=7CFF-D_USER_ROM_BEGIN=A000-D_USER_ROM_END=FBDFF
The symbols _USER_RAM_END and _USER_ROM_END have been adjusted so that your application cannot overwrite the ROM-monitor program.
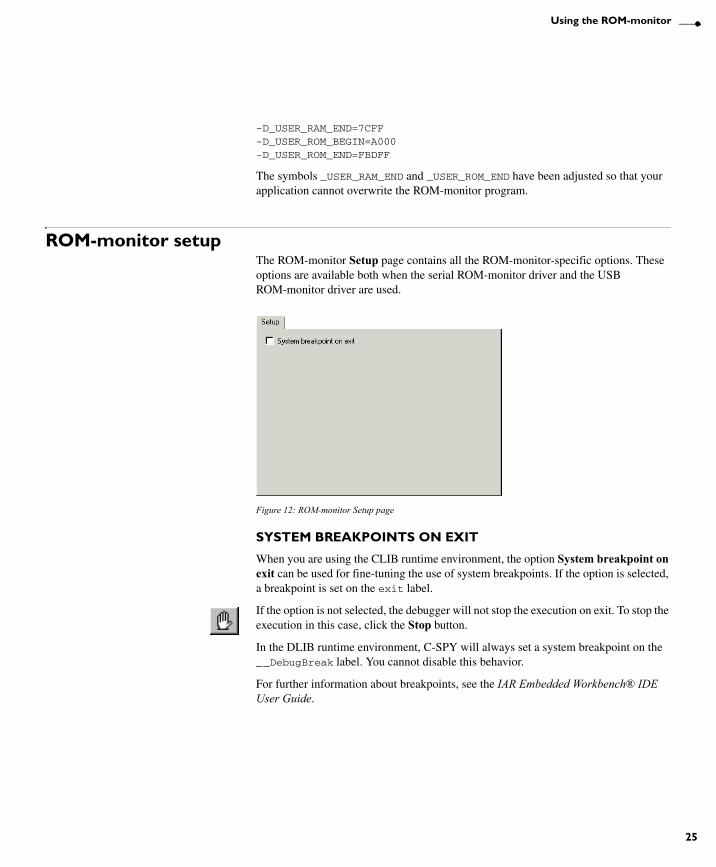
ROM-monitor setupThe ROM-monitor Setup page contains all the ROM-monitor-specific options. These options are available both when the serial ROM-monitor driver and the USB ROM-monitor driver are used.
Figure 12: ROM-monitor Setup page
SYSTEM BREAKPOINTS ON EXIT
When you are using the CLIB runtime environment, the option System breakpoint on exit can be used for fine-tuning the use of system breakpoints. If the option is selected, a breakpoint is set on the exit label.
If the option is not selected, the debugger will not stop the execution on exit. To stop the execution in this case, click the Stop button.
In the DLIB runtime environment, C-SPY will always set a system breakpoint on the __DebugBreak label. You cannot disable this behavior.
For further information about breakpoints, see the IAR Embedded Workbench® IDE User Guide.
CSPC7501R-1
25

26
ROM-monitor setup
SERIAL COMMUNICATION OPTIONS
The Serial Communication page contains all communication options. These options are available only when the serial ROM-monitor driver is used.
Figure 13: Serial Communication page
C-SPY tries to connect with the selected serial port when making the first contact with the evaluation board. If these options have not been specified, C-SPY will try using the COM1 port. Of course the evaluation board has to support a baud rate of 38400.
Log communication
For troubleshooting purposes, there is a possibility to log all characters sent between C-SPY and the ROM-monitor program to a file. If you check the Log communication check box, the file cspycomm.log will be used in the current working directory.
Option Setting
Port One of the supported ports: COM1, COM2, COM3, COM4
Baud rate 38400
Parity Only None is supported.
Data bit Only 8 data bits is supported.
Stop bit Only 2 stop bits is supported.
Handshaking None
Table 7: Serial Communication options
CSPC7501R-1
IAR C-SPY Hardware Debugger SystemsUser Guide

Using the ROM-monitor
ROM-monitor menuThe ROM-monitor menu appears when running any of the C-SPY ROM-monitor drivers.
Figure 14: ROM-monitor menu
The following commands are available on the menu:
Resolving problems This section includes suggestions for resolving the most common problems that can occur when debugging with the IAR C-SPY Debugger in conjunction with a ROM-monitor program.
For problems concerning the operation of the evaluation board, refer to the documentation supplied with it, or contact your hardware distributor.
GENERAL PROBLEMS WITH TARGET MEMORY
Reload the application with the Suppress download and Verify All options set on the Download page of the C-SPY options. This will verify whether the memory contents have changed, or the program is self-modifying. For more information, see ROM-monitor setup, page 25.
Menu command Description
Breakpoint usage Opens the Breakpoint Usage window. For more information about this window, see the IAR Embedded Workbench® IDE User Guide or the online help system available from the Help menu.
Release target on Go Real-time execution. C-SPY does not interfere during execution of application. If a breakpoint is hit, you will not be alerted. To regain control, click the Stop button.
Leave target running Leaves an executing application running when closing the debug session.
Table 8: Description of commands on ROM-monitor menu
CSPC7501R-1
27

28
Resolving problems
STOP ONLY WORKS FROM TIME TO TIME
When C-SPY sends the stop command while the application is running, the application must be interrupted. This is of course done with an interrupt; the problem is that the interrupt is not generated or not handled properly. The CPU must have interrupts enabled and the serial port must be set to generate interrupts.
WRITE FAILURE DURING LOAD
There are two possible reasons for this. If the number of errors is considerable, you have probably linked the whole application incorrectly. On the other hand, if only a small number of errors occur, the most probable cause is incorrectly mapped interrupt vectors. In either case you need to examine the linker command file closely.
MONITOR WORKS, BUT APPLICATION DOES NOT RUN
Your application is probably linked to some illegal code area (like the interrupt table). Examine the linker command file and verify that the start addresses of CODE and DATA segments are correct.
MONITOR CRASHES WHEN RUNNING AN APPLICATION
If the monitor crashes, the board will need a reset. This happens when the application writes data to restricted memory areas (like the monitor’s RAM or the application code).
Stack overflow or interrupt vectors that are not properly installed may also be the problem.
NO CONTACT WITH THE MONITOR
There are several possible reasons for C-SPY can fail to establish contact with the ROM-monitor program.
● A protocol error could have occurred. Try resetting your evaluation board and restart C-SPY.
● Check that the correct options for serial communication have been specified in the IAR Embedded Workbench. See Serial Communication options, page 26.
● Verify that the serial cable is properly plugged in and not damaged or of the wrong type.
● Examine the linker command file to make sure that the monitor has not been linked to the wrong address.
● Verify that the target chip is properly mounted on the evaluation board.● Make sure that the evaluation board is supplied with sufficient power. In some cases
the power supplied from the PC’s COM port is not enough, and you have to connect a separate power supply to the evaluation board.
CSPC7501R-1
IAR C-SPY Hardware Debugger SystemsUser Guide

Using the ROM-monitor
If C-SPY still fails to make contact with the ROM-monitor program, you should generate a log file—see Log communication, page 26—and send it to your local distributor or nearest IAR Support office. See the contact information on the IAR web site, www.iar.com.
CSPC7501R-1
29