Iaq and productivity ammar alshemery (fmp event) - april 2014 (1)
27
Does Good Indoor Air Quality Really Improve Workplace Productivity? FMP and Property Event – 29 & 30 April 2014 Ammar Al-Shemery Associate Director of the Abu Dhabi Campus Head of Operations and Campus Services
-
Upload
global-business-events -
Category
Technology
-
view
73 -
download
1
Transcript of Iaq and productivity ammar alshemery (fmp event) - april 2014 (1)
Does Good Indoor Air Quality Really Improve Workplace Productivity?
FMP and Property Event – 29 & 30 April 2014
Ammar Al-ShemeryAssociate Director of the Abu Dhabi CampusHead of Operations and Campus Services

Contents
• Why the need for good indoor air?
• HVAC Systems
• Productivity in the Workplace
• Case Study

Why the need for good indoor air?Estimated that inefficient buildings cost British business £135bn per year in lost opportunity (Glensler, 2005)
1-2% improvement in productivity has a larger economic return than 100% saving in energy costs” (CIBSE1999)
Indoor air pollution is the 8th most important in the range of risk factors in the global burden of disease and responsible for 2.7% of it (WHO, 2005)
50% of all illnesses are either caused or aggravated by polluted indoor air. (The American College of Allergy, Asthma and Immunology, ACAAI, 2009)
The total annual cost of poor IAQ to U.S. employers is $15 billion due to worker inefficiency and sick leave (OSHA, 2008)

(Bartlett, 2006)

Definition of Indoor Air Quality?
The environmental characteristics inside buildings that may affect human health, comfort, or work performance. IAQ characteristics include the concentrations of amounts of pollutants in indoor air, as well as air temperature and humidity.(Lawrence Berkeley National Laboratory, 2011)
Air within a building occupied for at least one hour by people of varying states of health. This can include the office, classroom, transport facility, shopping centre, hospital and home. National Health and Medical Research Council of Australia (NHMRC)
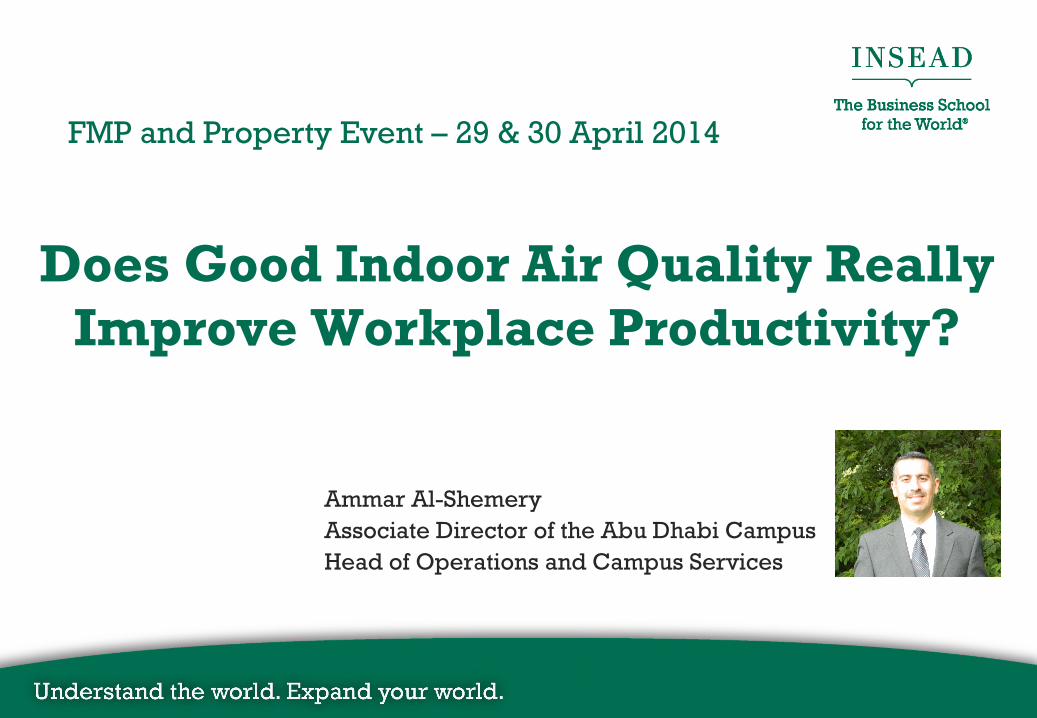
Major Source of Contaminants Contaminants Major Source
Particles Dust (generated inside and outside), smoking, cooking
Allergens (a substance that can cause an allergic reaction)
Molds, pets, many other resources
Bacteria and viruses People, moisture, petsCarbon dioxide (CO2) Occupants breathing, combustionOdoriferous chemicals People, cooking, molds, chemicals, smokingVolatile Organic Compound (VOC)
Construction materials, furnishings, cleaning products
Tobacco smoke SmokingCarbon monoxide (CO) Incomplete and/or faulty combustion, smokingRadon (Rn) Radioactive decay of radium in the soilFormaldehyde (HCHO) Construction materials, furniture, smokingOxides of Nitrogen Combustion, smokingSulfur dioxide CombustionOzone Photocopiers, electrostatic air cleaners
McDowall, 2007
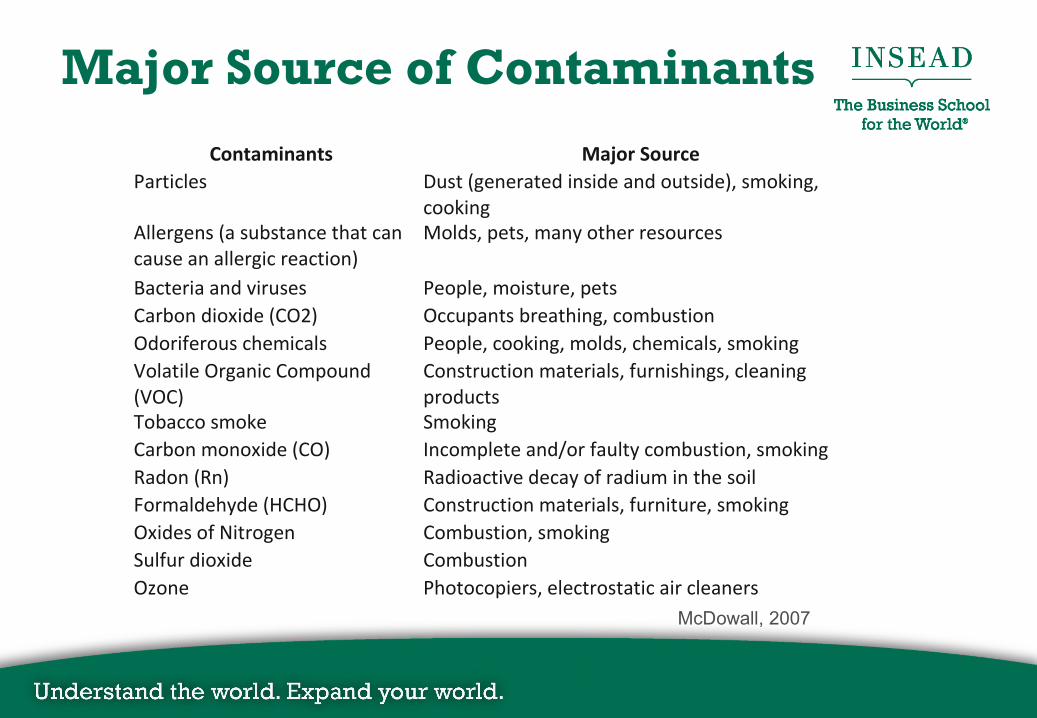
HVAC SystemsObjectives of the HVAC system
To control:
1)Air temperature
2)Humidity
3)Air circulation
4)Air quality(ASHRAE, 2004)
Energy Analysis and Comfort Solutions Inc., 2006
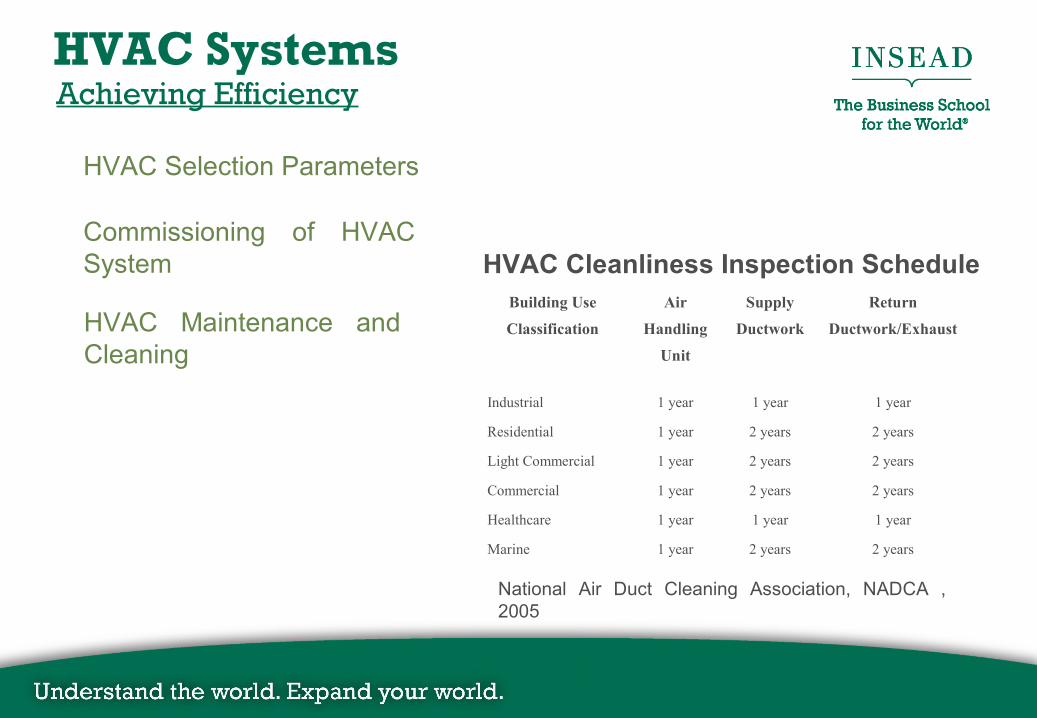
Achieving Efficiency
HVAC Selection Parameters
Commissioning of HVAC System
HVAC Maintenance and Cleaning
National Air Duct Cleaning Association, NADCA , 2005
Building Use
Classification
Air
Handling
Unit
Supply
Ductwork
Return
Ductwork/Exhaust
Industrial 1 year 1 year 1 year
Residential 1 year 2 years 2 years
Light Commercial 1 year 2 years 2 years
Commercial 1 year 2 years 2 years
Healthcare 1 year 1 year 1 year
Marine 1 year 2 years 2 years
HVAC Cleanliness Inspection Schedule
HVAC Systems
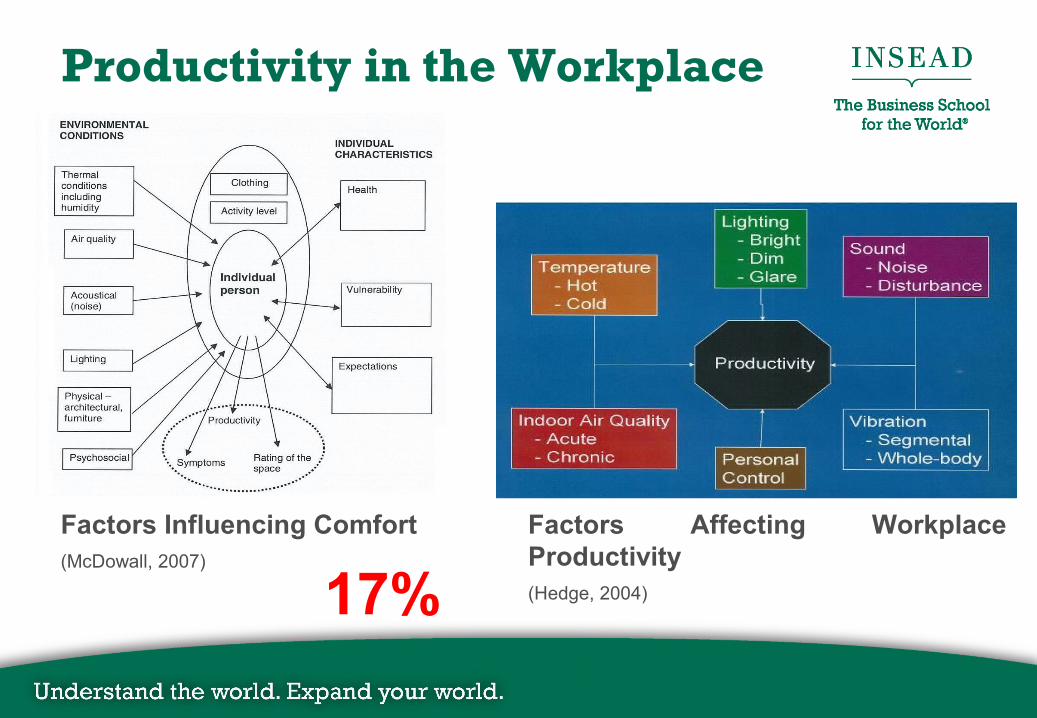
Productivity in the Workplace
Factors Influencing Comfort(McDowall, 2007)
Factors Affecting Workplace Productivity(Hedge, 2004)17%

Measuring Productivity
McCartney & Humphreys (2002)
Lorsch and Abdou (1994)
Wyon (1996)
A- Simulated work
B- Diagnostic tests
C- Embedded tasks
D- Absenteeism records
E- Self-assessment
F- Use of existing measures
D- Absenteeism records
Productivity in the Workplace

CASE STUDYThe Facility

MethodologyCASE STUDY
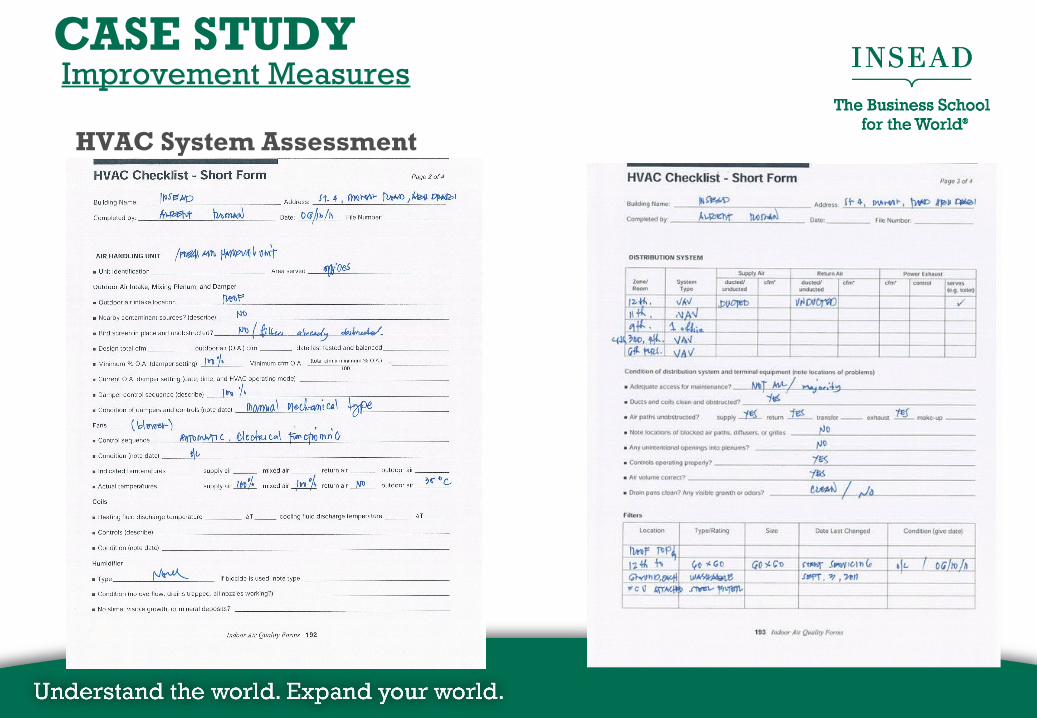
Improvement Measures
HVAC System Assessment
CASE STUDY
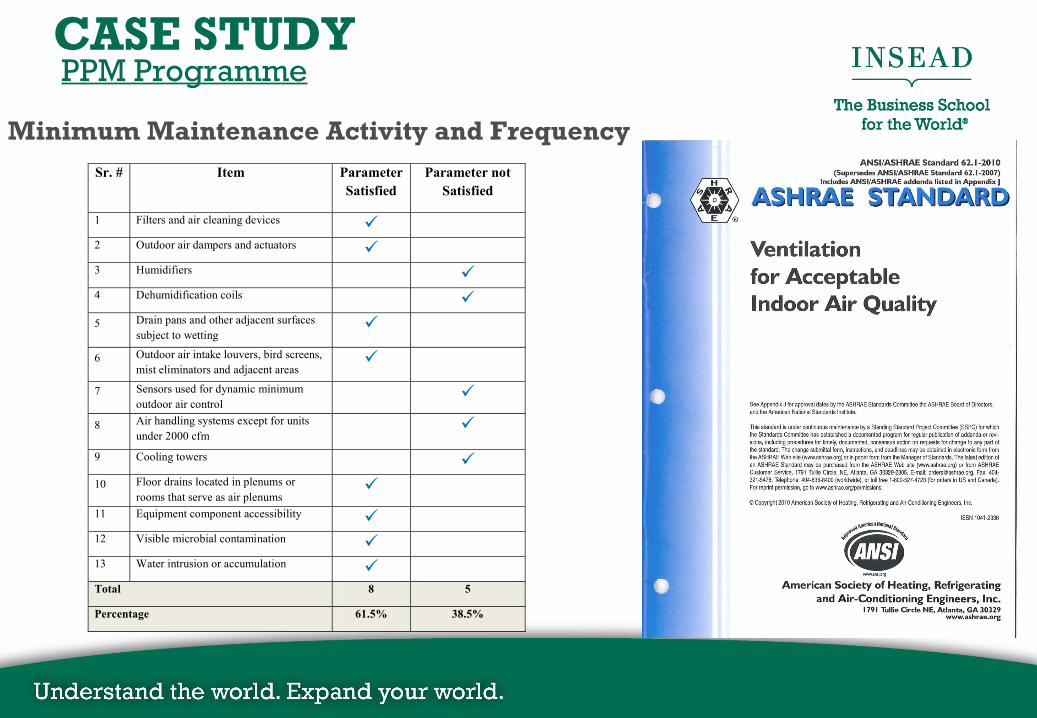
PPM Programme
Sr. # Item Parameter Satisfied
Parameter not Satisfied
1 Filters and air cleaning devices
2 Outdoor air dampers and actuators
3 Humidifiers
4 Dehumidification coils
5 Drain pans and other adjacent surfaces subject to wetting
6 Outdoor air intake louvers, bird screens, mist eliminators and adjacent areas
7 Sensors used for dynamic minimum outdoor air control
8 Air handling systems except for units under 2000 cfm
9 Cooling towers
10 Floor drains located in plenums or rooms that serve as air plenums
11 Equipment component accessibility
12 Visible microbial contamination
13 Water intrusion or accumulation
Total 8 5
Percentage 61.5% 38.5%
Minimum Maintenance Activity and Frequency
CASE STUDY
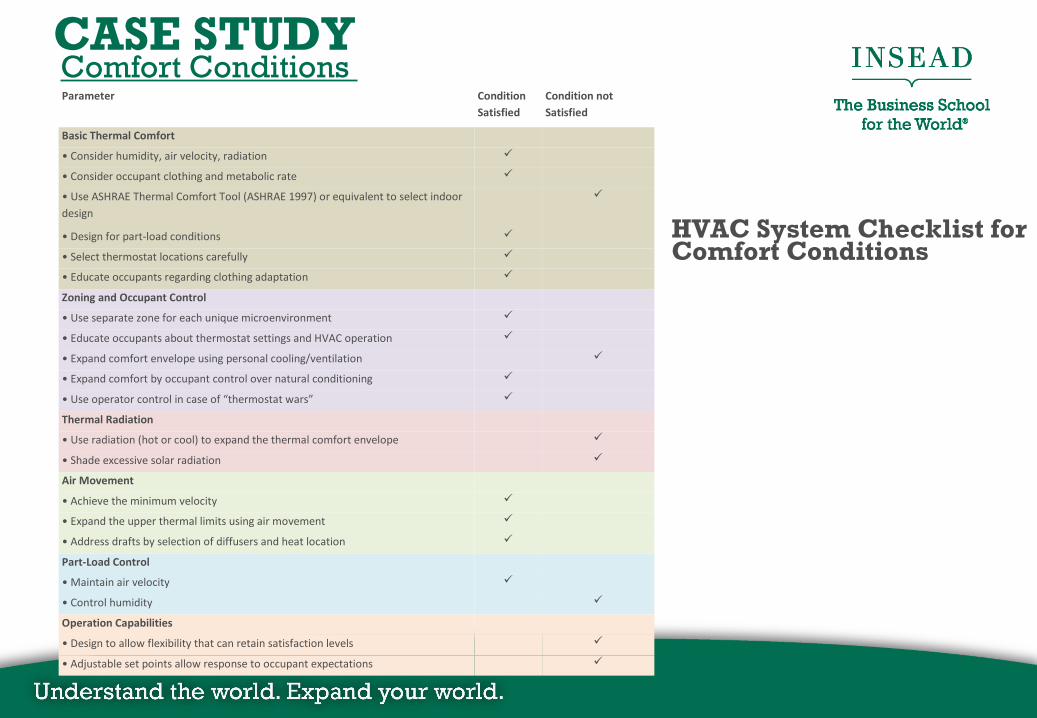
Comfort Conditions CASE STUDY
Parameter Condition Satisfied
Condition not Satisfied
Basic Thermal Comfort
• Consider humidity, air velocity, radiation
• Consider occupant clothing and metabolic rate
• Use ASHRAE Thermal Comfort Tool (ASHRAE 1997) or equivalent to select indoor design
• Design for part-load conditions
• Select thermostat locations carefully
• Educate occupants regarding clothing adaptation
Zoning and Occupant Control
• Use separate zone for each unique microenvironment
• Educate occupants about thermostat settings and HVAC operation
• Expand comfort envelope using personal cooling/ventilation
• Expand comfort by occupant control over natural conditioning
• Use operator control in case of “thermostat wars”
Thermal Radiation
• Use radiation (hot or cool) to expand the thermal comfort envelope
• Shade excessive solar radiation
Air Movement
• Achieve the minimum velocity
• Expand the upper thermal limits using air movement
• Address drafts by selection of diffusers and heat location
Part-Load Control
• Maintain air velocity
• Control humidity
Operation Capabilities
• Design to allow flexibility that can retain satisfaction levels
• Adjustable set points allow response to occupant expectations
HVAC System Checklist for Comfort Conditions
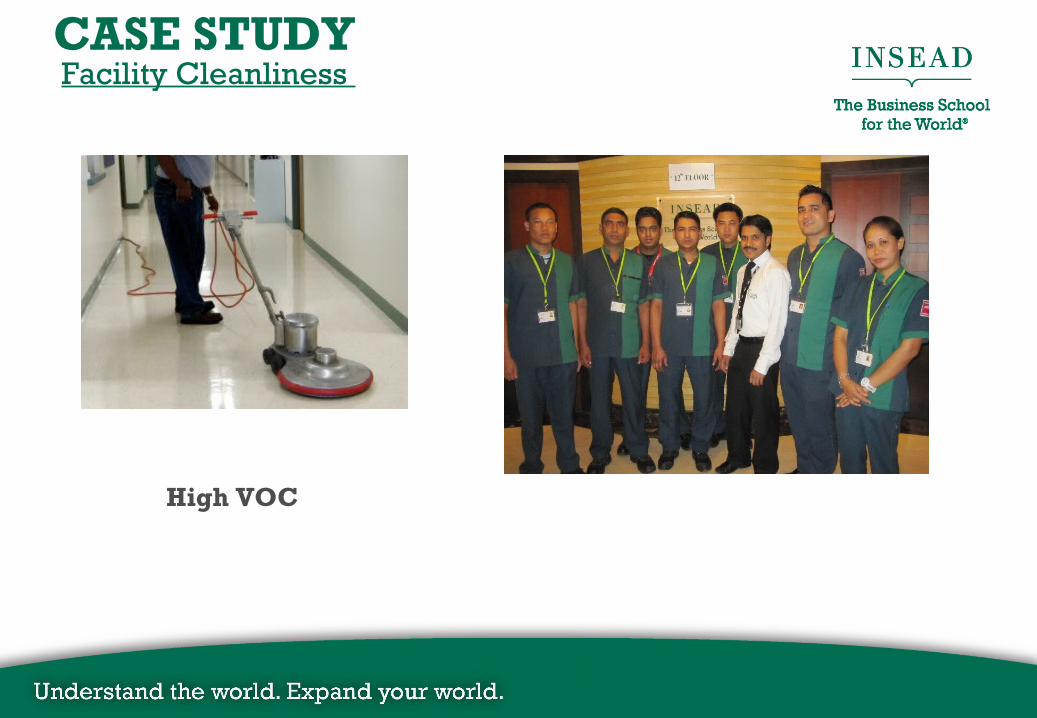
Facility Cleanliness CASE STUDY
High VOC
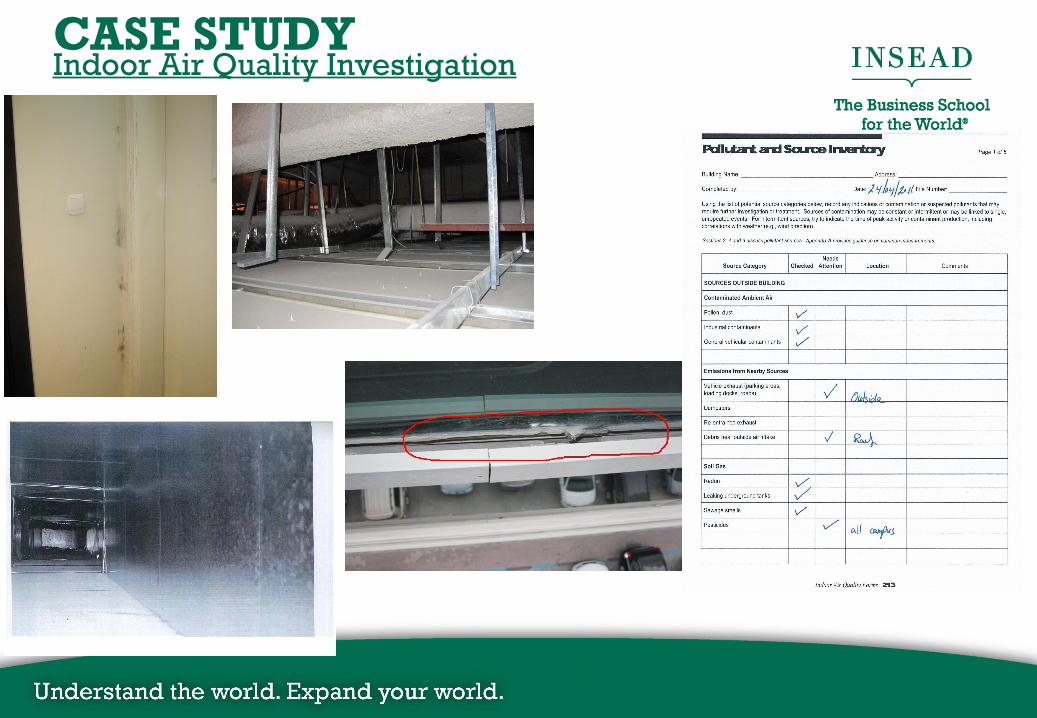
Indoor Air Quality InvestigationCASE STUDY

On-Site Improvements
Changing cleaning material and detergents to green materials that are more environmental friendly.
Adjusting air dampers for better ventilation rates
Adjusting VCDs (volume control dampers) towards better air movement.
Installing a temporary fan near the 9th floor corridor door to balance air pressure.
Placing lockable plastic covers on thermostat controls
Implementing “Zone Operating Schedule”
Sealing window gaps to avoid infiltration and enhance building envelope.
CASE STUDY

Indoor Air Quality TestCASE STUDY
Direct Instrumental Method of Analysis
8 hours
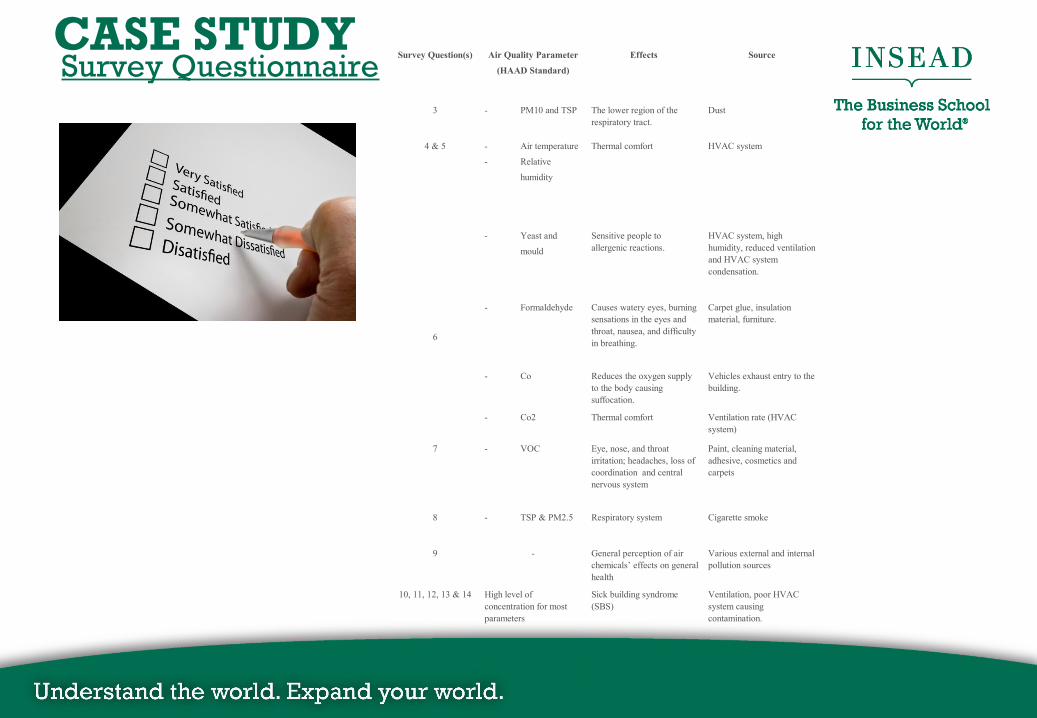
Survey QuestionnaireCASE STUDY
Survey Question(s) Air Quality Parameter
(HAAD Standard)
Effects Source
3 - PM10 and TSP The lower region of the respiratory tract.
Dust
4 & 5 - Air temperature
- Relative
humidity
Thermal comfort HVAC system
6
- Yeast and
mould
Sensitive people to allergenic reactions.
HVAC system, high humidity, reduced ventilation and HVAC system condensation.
- Formaldehyde Causes watery eyes, burning sensations in the eyes and throat, nausea, and difficulty in breathing.
Carpet glue, insulation material, furniture.
- Co Reduces the oxygen supply to the body causing suffocation.
Vehicles exhaust entry to the building.
- Co2 Thermal comfort Ventilation rate (HVAC system)
7 - VOC Eye, nose, and throat irritation; headaches, loss of coordination and central nervous system
Paint, cleaning material, adhesive, cosmetics and carpets
8 - TSP & PM2.5 Respiratory system Cigarette smoke
9 - General perception of air chemicals’ effects on general health
Various external and internal pollution sources
10, 11, 12, 13 & 14 High level of concentration for most parameters
Sick building syndrome (SBS)
Ventilation, poor HVAC system causing contamination.
Absenteeism RecordsCASE STUDY
Cause of absence that is related only to respiratory, allergy, headache…etc problems was taken into consideration
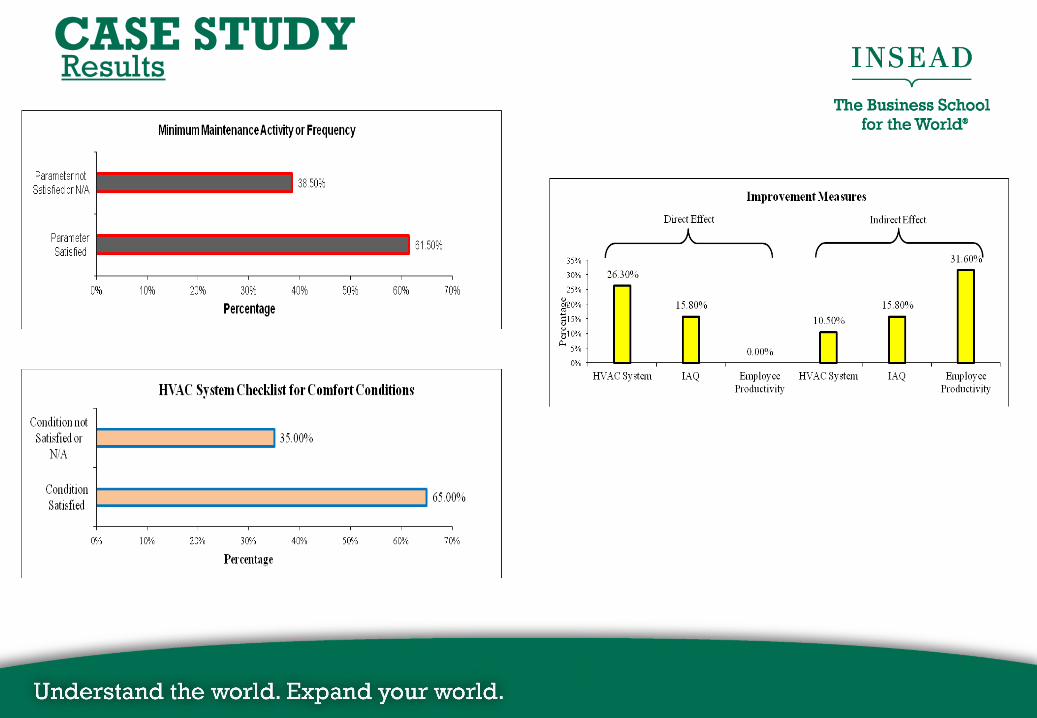
ResultsCASE STUDY
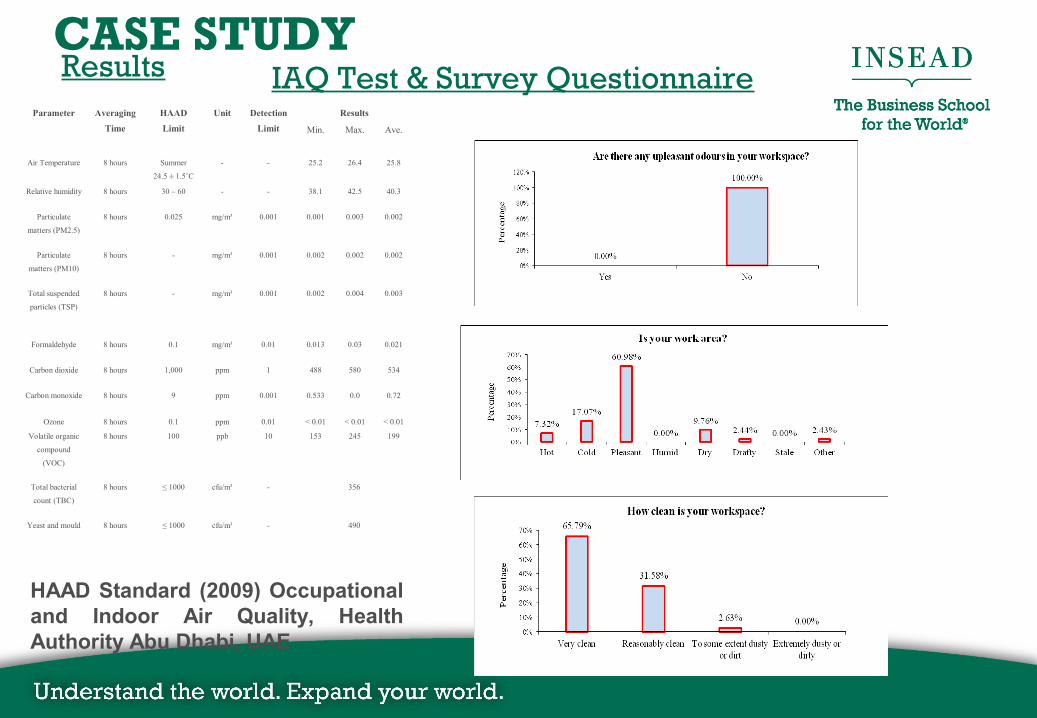
IAQ Test & Survey QuestionnaireParameter Averaging
Time
HAAD
Limit
Unit Detection
Limit
Results
Min. Max. Ave.
Air Temperature 8 hours Summer
24.5 ± 1.5˚C
- - 25.2 26.4 25.8
Relative humidity 8 hours 30 – 60 - - 38.1 42.5 40.3
Particulate
matters (PM2.5)
8 hours 0.025 mg/m³ 0.001 0.001 0.003 0.002
Particulate
matters (PM10)
8 hours - mg/m³ 0.001 0.002 0.002 0.002
Total suspended
particles (TSP)
8 hours - mg/m³ 0.001 0.002 0.004 0.003
Formaldehyde 8 hours 0.1 mg/m³ 0.01 0.013 0.03 0.021
Carbon dioxide 8 hours 1,000 ppm 1 488 580 534
Carbon monoxide 8 hours 9 ppm 0.001 0.533 0.0 0.72
Ozone 8 hours 0.1 ppm 0.01 < 0.01 < 0.01 < 0.01
Volatile organic
compound
(VOC)
8 hours 100 ppb 10 153 245 199
Total bacterial
count (TBC)
8 hours ≤ 1000 cfu/m³ - 356
Yeast and mould 8 hours ≤ 1000 cfu/m³ - 490
HAAD Standard (2009) Occupational and Indoor Air Quality, Health Authority Abu Dhabi, UAE
ResultsCASE STUDY

Conclusion
36%
Savings over 1 year upon implementing improvement measures
1000 £
CASE STUDY
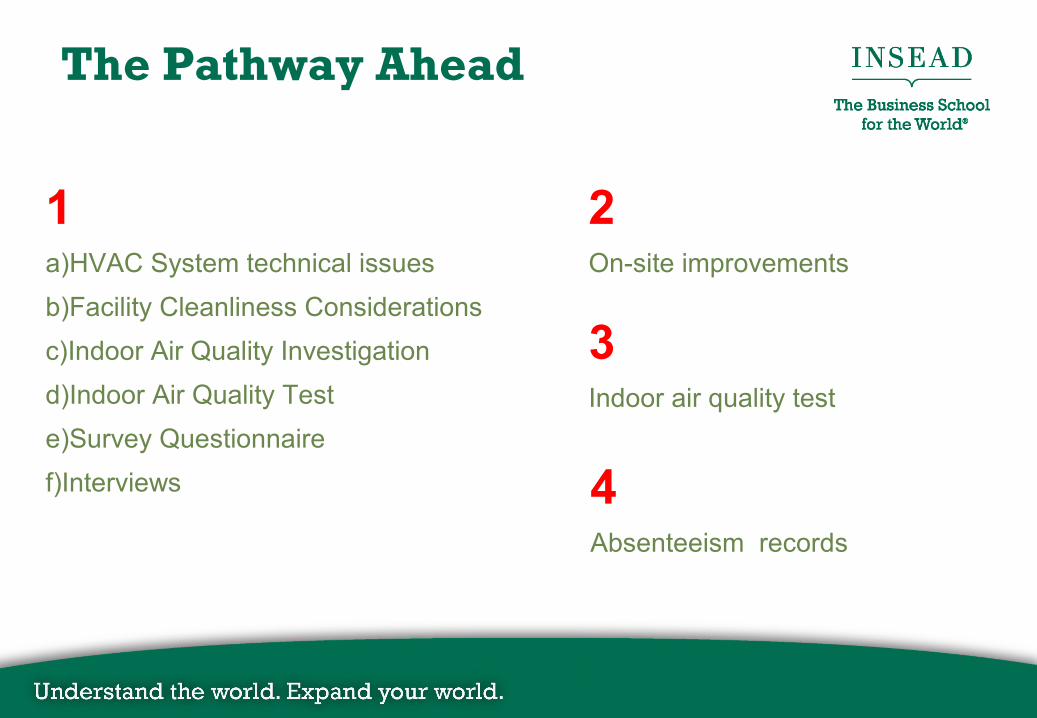
The Pathway Ahead
1a)HVAC System technical issues
b)Facility Cleanliness Considerations
c)Indoor Air Quality Investigation
d)Indoor Air Quality Test
e)Survey Questionnaire
f)Interviews
2On-site improvements
3Indoor air quality test
4Absenteeism records
SO…..
Does Good Indoor Air Quality Really Improve Workplace Productivity?

THANK YOU FOR YOUR ATTENTION…