IALEP Conference Process Mapping Training Session IALEP PowerPoints... · SIPOC diagram is a type...
111
TUESDAY, SEPTEMBER 17, 2013 IALEP Conference Process Mapping Training Session
Transcript of IALEP Conference Process Mapping Training Session IALEP PowerPoints... · SIPOC diagram is a type...

T U E S D A Y , S E P T E M B E R 1 7 , 2 0 1 3
IALEP Conference Process Mapping Training Session
Agenda
Welcome
Overview / Background
Introductions
SIPOC
Process Mapping
TIM U. WOOD
Brainstorming
Clean Sheet Redesign
Review

Columbus Trivia

Columbus-born Jerrie Mock is the 1st woman to fly solo around the world in 1964. How long did it take her?
1 2 3 4
17%
0%
17%
67%1. 30 days
2. 45 days
3. 60 days
4. 65 days
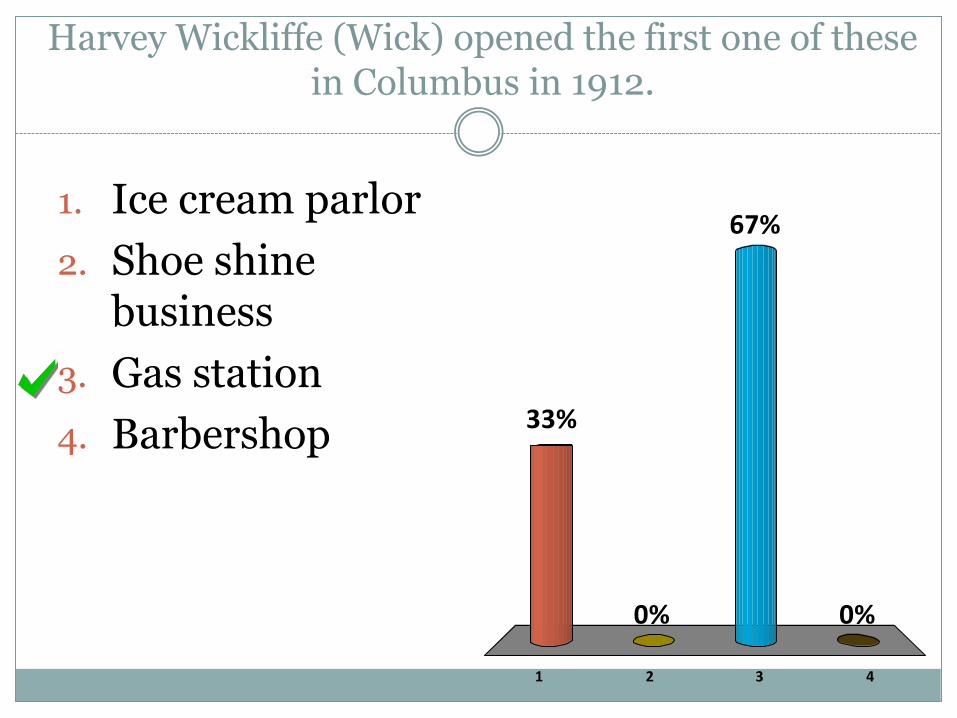
Harvey Wickliffe (Wick) opened the first one of these in Columbus in 1912.
1 2 3 4
33%
0%
67%
0%
1. Ice cream parlor
2. Shoe shine business
3. Gas station
4. Barbershop

Columbus was named after the explorer, Christopher Columbus?
1 2
0%
100%1. True
2. False

Participant Scores
3 Participant 3A1C22
3 Participant 3A1CFC
2 Participant 3A1B83
2 Participant 3A1C36
1 Participant 3A1C19
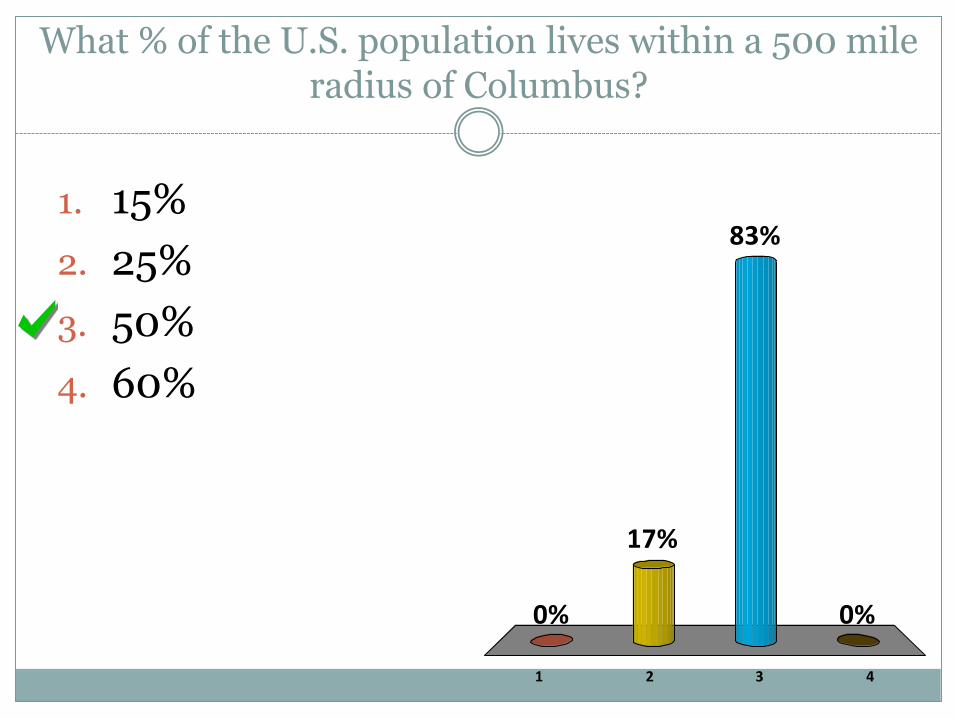
What % of the U.S. population lives within a 500 mile radius of Columbus?
1 2 3 4
0% 0%
83%
17%
1. 15%
2. 25%
3. 50%
4. 60%

What was the name of the Columbus minor league baseball affiliate in 1955?
1 2 3 4
33% 33%
17%17%
1. Senators
2. Red Birds
3. Clippers
4. Jets
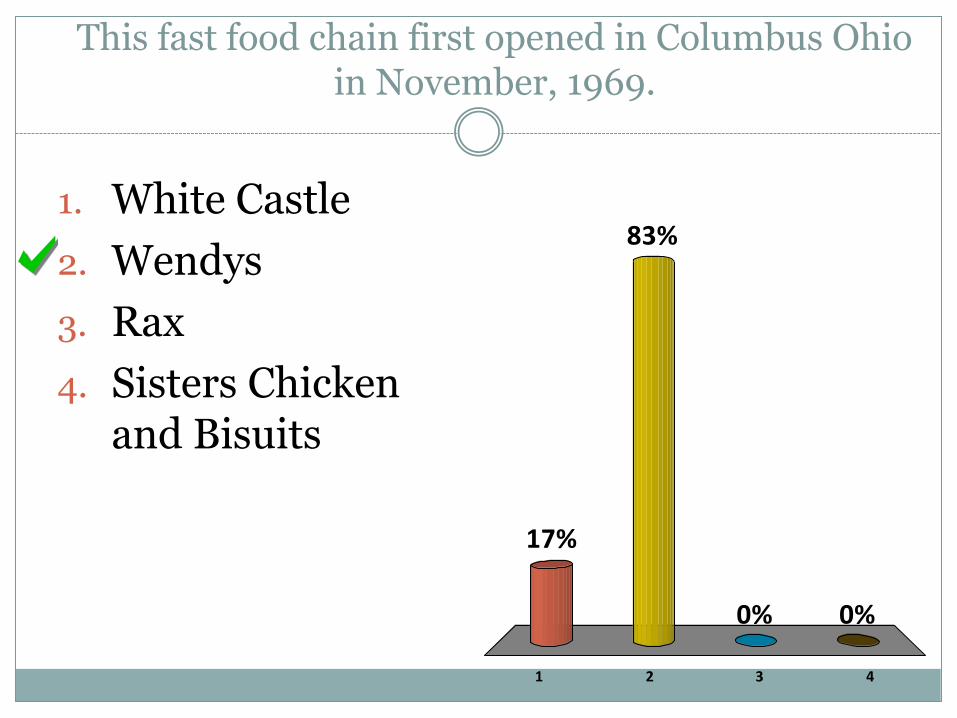
This fast food chain first opened in Columbus Ohio in November, 1969.
1 2 3 4
17%
0%0%
83%1. White Castle
2. Wendys
3. Rax
4. Sisters Chicken and Bisuits
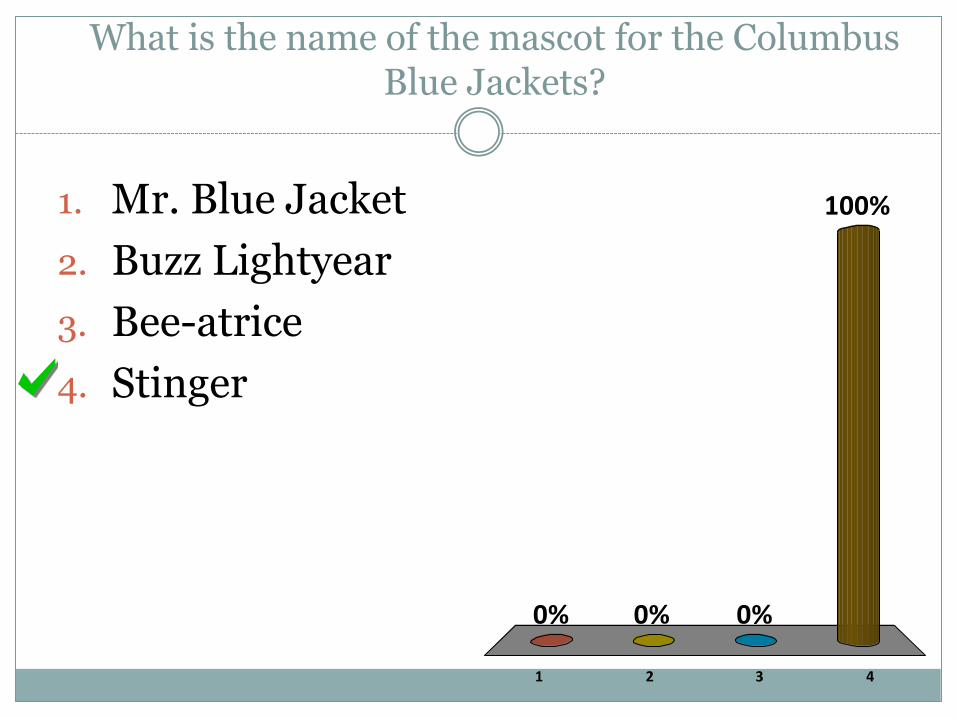
What is the name of the mascot for the Columbus Blue Jackets?
1 2 3 4
0%
100%
0%0%
1. Mr. Blue Jacket
2. Buzz Lightyear
3. Bee-atrice
4. Stinger

Participant Scores
7 Participant 3A1C22
6 Participant 3A1CFC
5 Participant 3A1B83
5 Participant 3A1C36
4 Participant 3A1CD7

Jim Grote founded this pizza restaurant in Columbus in 1963.
1 2 3 4
0% 0%
17%
83%1. Adriatico‟s
2. Donatos
3. Hound Dogs
4. Rubino‟s
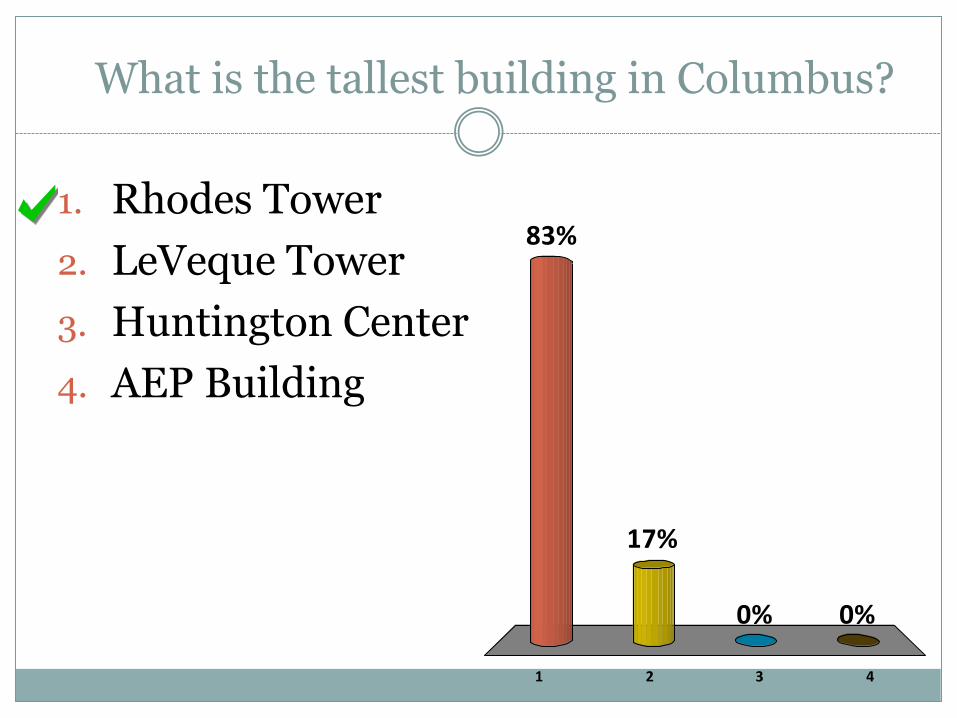
What is the tallest building in Columbus?
1 2 3 4
83%
0%0%
17%
1. Rhodes Tower
2. LeVeque Tower
3. Huntington Center
4. AEP Building
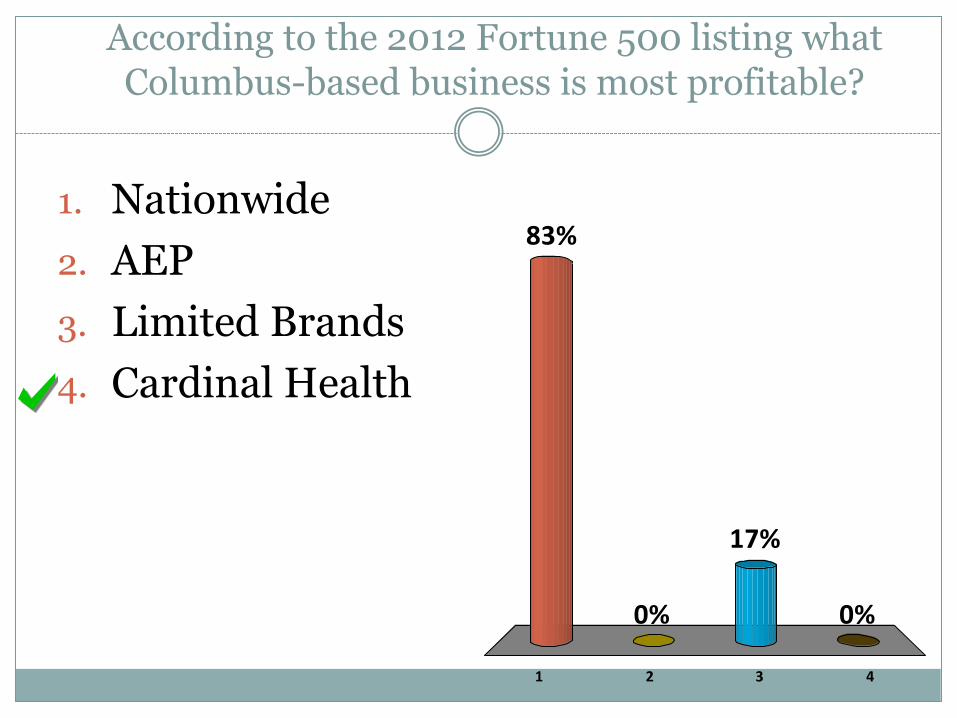
According to the 2012 Fortune 500 listing what Columbus-based business is most profitable?
1 2 3 4
83%
0%
17%
0%
1. Nationwide
2. AEP
3. Limited Brands
4. Cardinal Health

Participant Scores
9 Participant 3A1C22
7 Participant 3A1B83
7 Participant 3A1CFC
6 Participant 3A1C36
6 Participant 3A1CD7
What is Lean?
Foundations of Lean
Lean is defined as a systematic approach to identifying and eliminating waste through:
Continuous improvement
Sequencing the service or product at the pull of the customer
Lean focuses on speed without sacrificing quality for the customer
Lean Basics
Lean Government refers to the application of Lean production principles and methods to identify and implement the most efficient and value added way to provide government services. Government agencies have found that Lean methods enable them to better understand how their processes work, to quickly identify and implement improvements, and to build a culture of continuous improvement.
A key characteristic of a Lean organization is its ability to improve itself constantly by bringing problems to the surface and resolving them.

Seven Key Principals of Lean
Define value in the eyes of the customer
Identify the process for a service or product
Create continuous flow without interruptions
Reduce defects in services or products
Let customer pull what they want
Pursue perfection (Six Sigma)
Eliminate or reduce variation
Lean Example
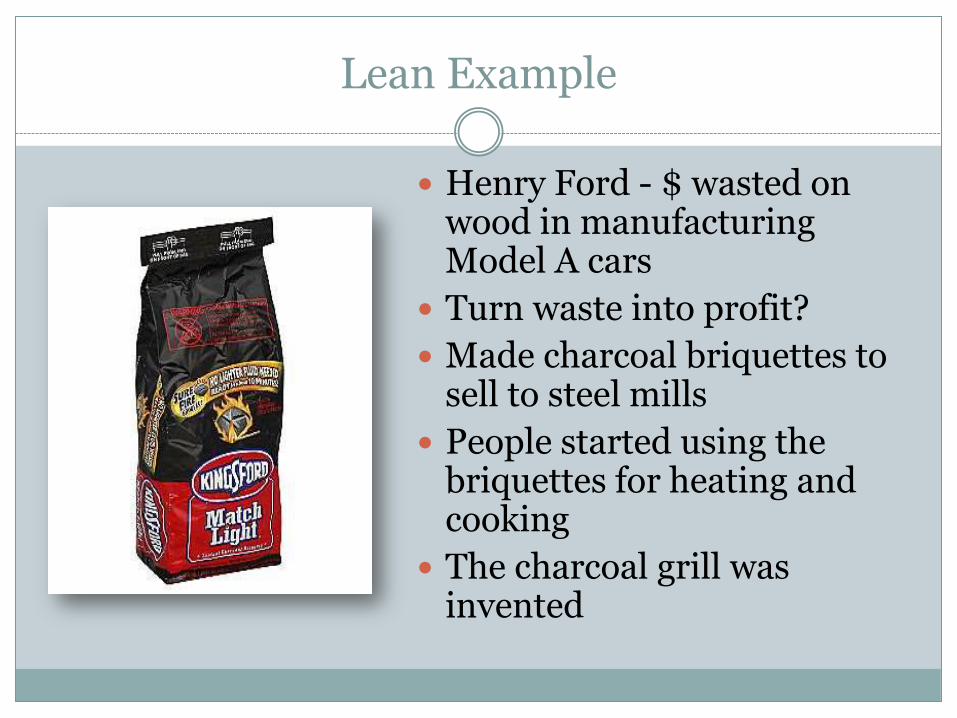
Henry Ford - $ wasted on wood in manufacturing Model A cars
Turn waste into profit?
Made charcoal briquettes to sell to steel mills
People started using the briquettes for heating and cooking
The charcoal grill was invented

What is Six Sigma?

What is Six Sigma?
Six Sigma is a business management strategy originally developed by Motorola, USA in 1986
Six Sigma seeks to improve the quality of process outputs by identifying and removing the causes of defects (errors) and minimizing variability in business processes
A six sigma process is one in which 99.99966% of the outputs produced are statistically expected to be free of defects (3.4 defects per million)

Is 99% Good Enough?
NOT 99% good
But 99.99966% good
What’s the difference?

No electricity for seven hours each month
One hour without electricity every 34 years
99 % Good 99.99966% Six Sigma

200,000 wrong prescriptions given to patients each year
68 wrong prescriptions given to patients each year
99% Good
99.99966% Six Sigma
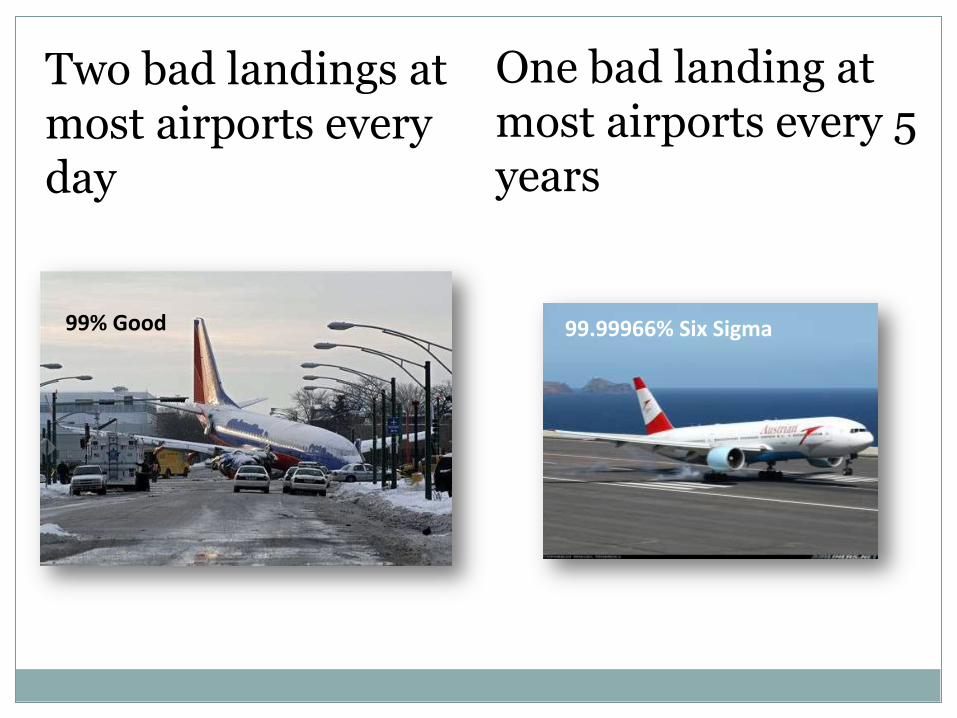
Two bad landings at most airports every day
One bad landing at most airports every 5 years
99% Good 99.99966% Six Sigma

T H E “ F I R S T ” P I C T U R E O F Y O U R P R O C E S S
SIPOC

SIPOC – Why and What?
SIPOC diagram is a type of process map to identify the primary elements of a process.
It provides a macro view that brings together Suppliers, Inputs, Process, Outputs, and Customers.

SIPOC Purpose:
The purpose of a SIPOC Diagram is to define and document:
Suppliers
Inputs/Requirements
Key Process Steps
Outputs/Requirements
Customers

SIPOC Purpose:
Additional Benefits of SIPOC:
Documents process name
Process Owner
Start/stop “triggers”
Assumptions about the process
Operational definitions of key terms
Gets everyone on same page

SIPOC Time
Time: Plan at least one hour to complete a SIPOC.
Time can vary depending on complexity of process, knowledge of participants and previous experience creating SIPOCs.

SIPOC Where to Start
S: Supplier
I: Inputs
P: Process
O: Outputs
C: Customer
Where to start???
Always start with the Process!

Process
SIPOC is a high level view of the process
SIPOC •50,000 Feet View
Business Process Map
•10,000 Feet View
Standard Work
•1,000 Feet View

List the 5-7 key steps in the process being mapped
List the outputs of each step of the process
List the inputs into each step of the process
List the suppliers of each input of the process
Suppliers Inputs Process Outputs Customer
1 2 3 4 5

Process
Keep it High Level: Only 5-7 steps for the process
This activity also gives you the scope of your process
Here is the tricky part: Make sure the team reaches consensus that you have created an accurate representation of the process before moving on.
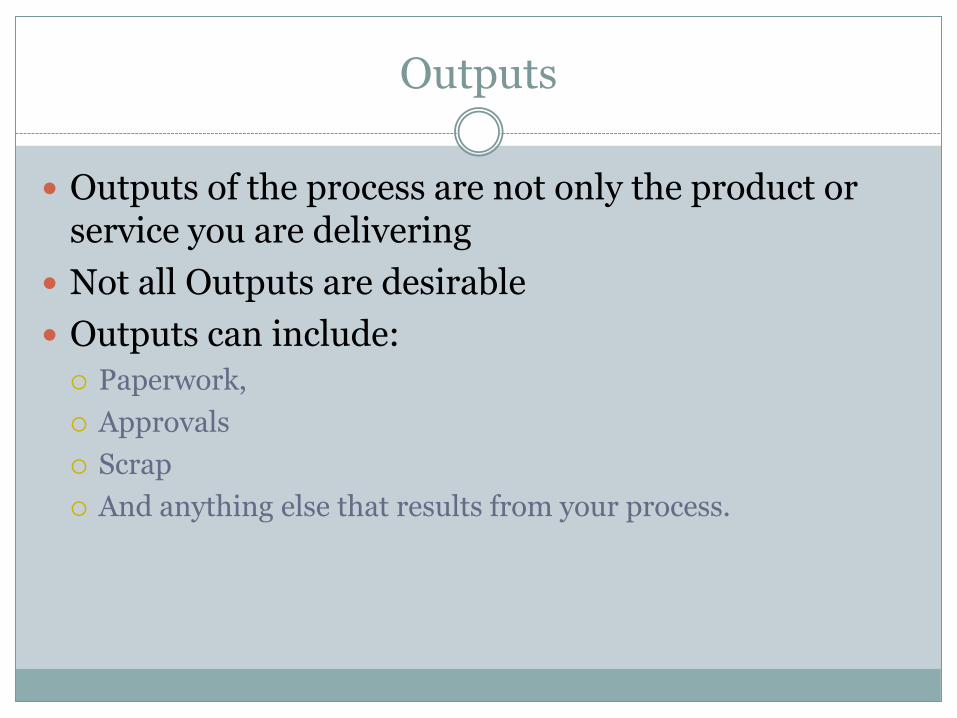
Outputs
Outputs of the process are not only the product or service you are delivering
Not all Outputs are desirable
Outputs can include:
Paperwork,
Approvals
Scrap
And anything else that results from your process.

Customers
Identify the Customers.
In most cases, the customer isn't the person who will eventually receive the product or service, but the recipients of each output of your process.
Think about where each output goes and you know who the customer is for your process.
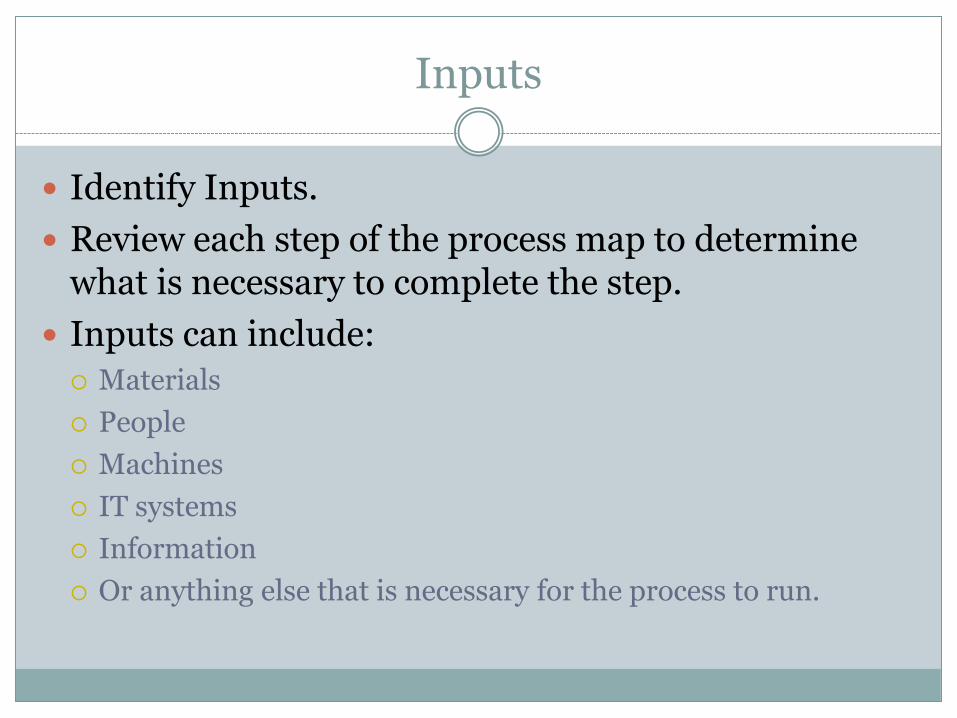
Inputs
Identify Inputs.
Review each step of the process map to determine what is necessary to complete the step.
Inputs can include:
Materials
People
Machines
IT systems
Information
Or anything else that is necessary for the process to run.

Suppliers
Identify the Suppliers.
List all of the suppliers who provide your inputs.
These might include:
The company that supplies your widgets
The team that performed previous steps
Or the IT Department
Don't forget your customers; they are often suppliers to a process as well.

Other things of Note
Document any Parking Lot Activities
Document Operational Definitions of Key terms
Document any IT systems
Reach consensus before moving on to the next steps
SIPOC can be the beginning for many different projects
Great for management that does not have time for a full process mapping event
Makes the Invisible - visible

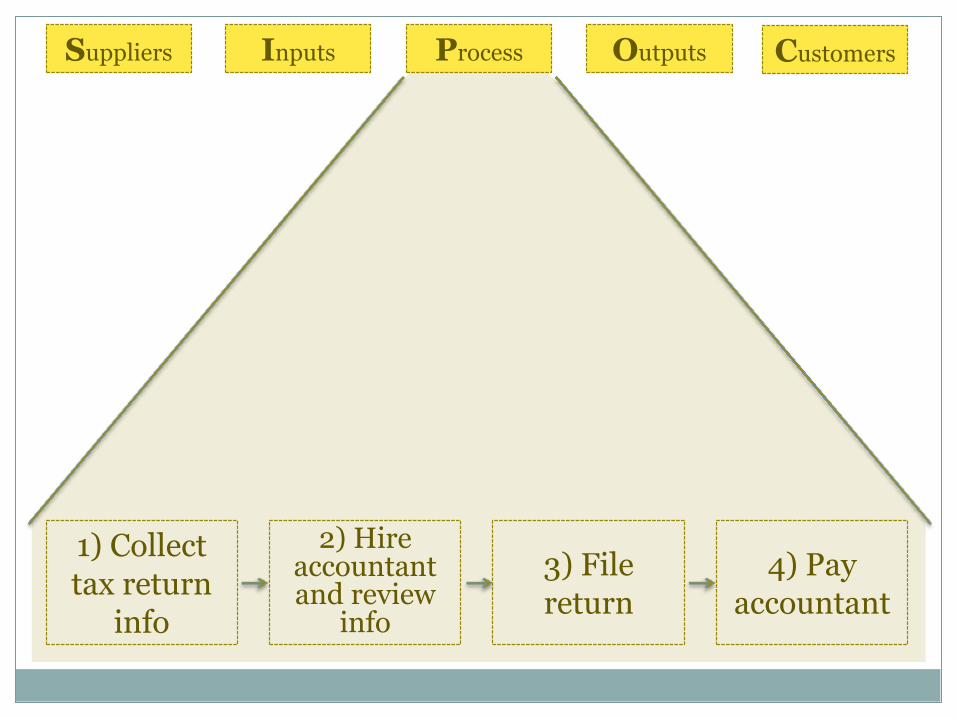
SIPOC
The Process of filing your tax return
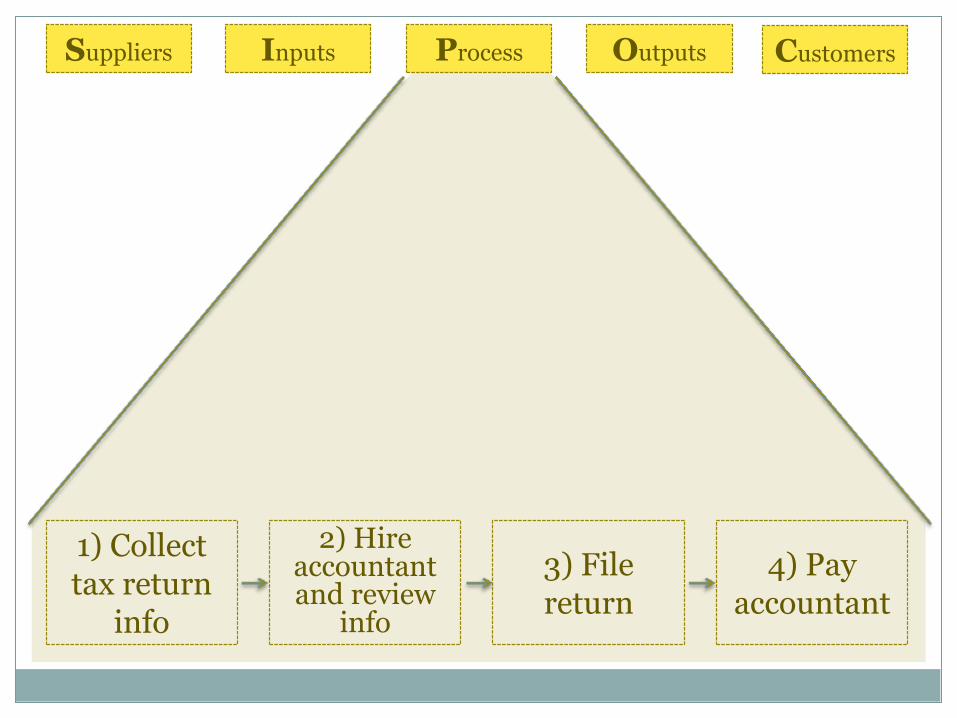
1) Collect tax return
info
2) Hire accountant and review
info
3) File return
4) Pay accountant
Suppliers Inputs Process Outputs Customers
1) Collect tax return
info
2) Hire accountant and review
info
3) File return
4) Pay accountant
Suppliers Inputs Outputs Customers Process

1) Collect tax return
info
2) Hire accountant and review
info
3) File return
4) Pay accountant
Suppliers Inputs Process Outputs Customers
•Government •Employer •Charities •Church •Investment Firms
•Forms •Wage statements
•Donation records
•Donation receipts
•Interest statements
•Completed tax return
•Copy for accountant
•Copy for yourself
•Payment to accountant
•Government tax agency
•Accountant

Group Exercise
Complete a SIPOC for another process
Grocery shopping
Getting your oil changed
Ordering a pizza
Getting a driver‟s license
Taking the dog to the vet
Getting fast food for lunch

SIPOC

Columbus Division of Police Trivia

What year was the Columbus Police Canine unit established?
1 2 3 4
0% 0%
50%50%1. 1998
2. 1992
3. 1982
4. 1989

How many sworn personnel are in the Columbus Division of Police?
1 2 3 4
100%
0%0%0%
1. 1,827
2. 1,027
3. 2,108
4. 2,807

Participant Scores
10 Participant 3A1C22
9 Participant 3A1B83
9 Participant 3A1CFC
7 Participant 3A1C19
7 Participant 3A1CD7

What is the average response time of the Columbus Police Helicopter Unit for first on the scene of dispatched runs?
1 2 3 4
17%
33%33%
17%
1. 2.3 minutes
2. 1.5 minutes
3. 2.1 minutes
4. 1.3 minutes
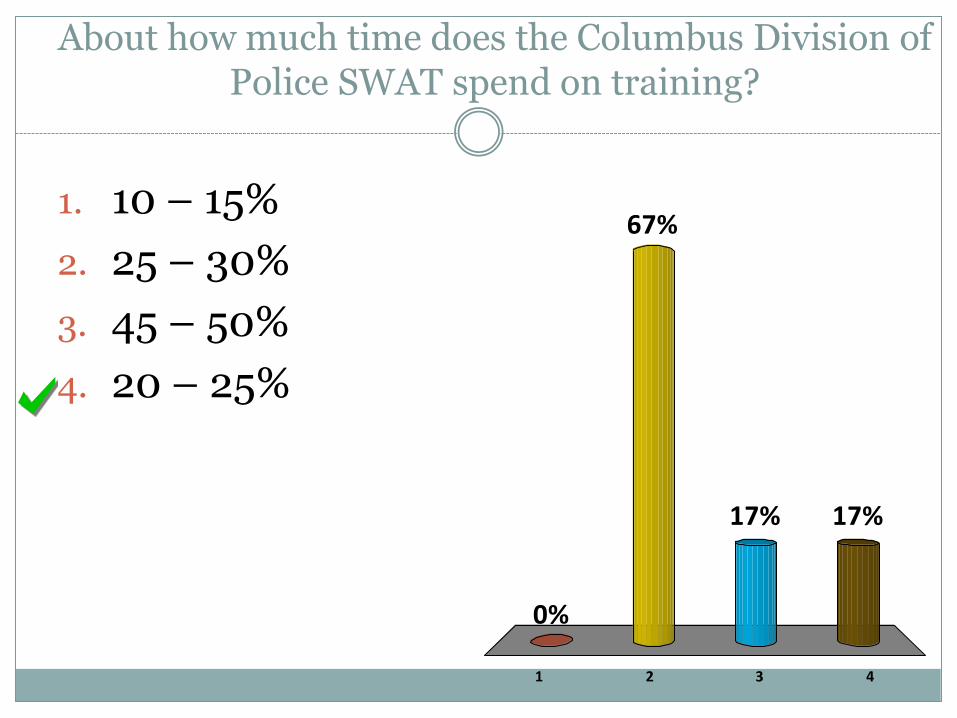
About how much time does the Columbus Division of Police SWAT spend on training?
1 2 3 4
0%
17%17%
67%1. 10 – 15%
2. 25 – 30%
3. 45 – 50%
4. 20 – 25%

Per the most recent census data what is the ratio of police officers to civilians in the city of Columbus?
1 2 3 4
0%
83%
0%
17%
1. 1 officer for every 342 civilians
2. 1 officer for every 3000 civilians
3. 1 officer for every 10 civilians
4. 1 officer for every 512 civilians
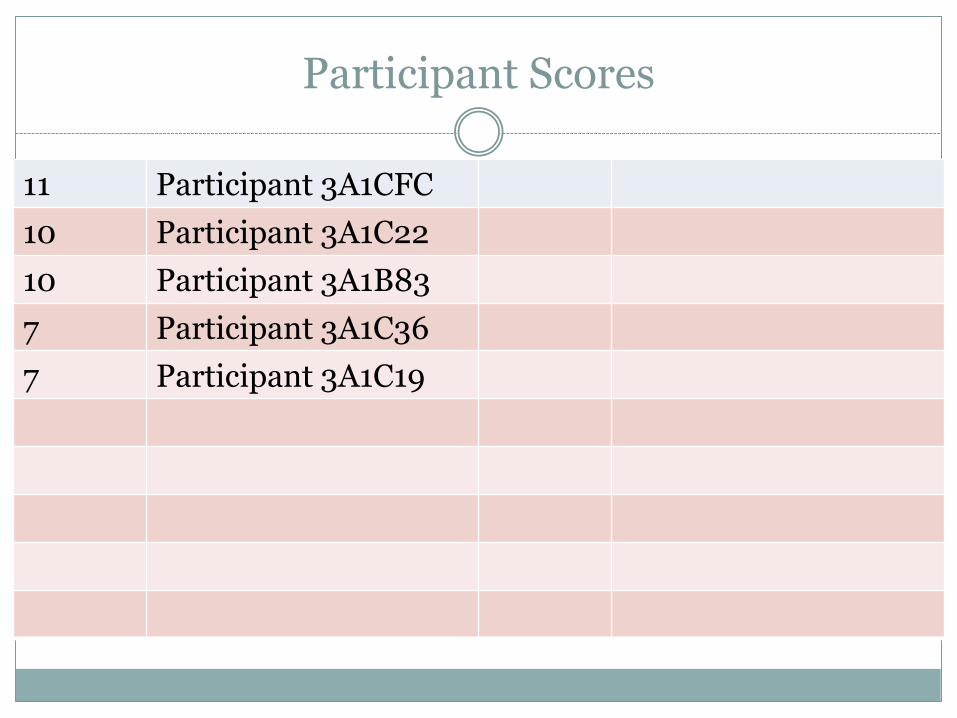
Participant Scores
11 Participant 3A1CFC
10 Participant 3A1C22
10 Participant 3A1B83
7 Participant 3A1C36
7 Participant 3A1C19
L O O K I N G F O R V A L U E , S T E P - B Y - S T E P
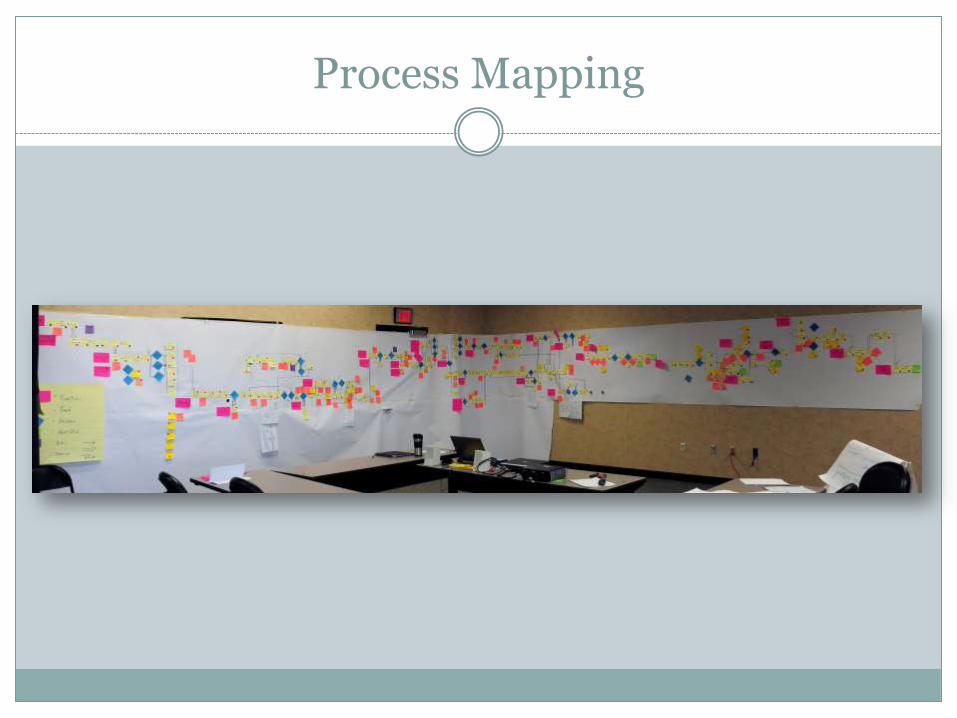
Process Mapping
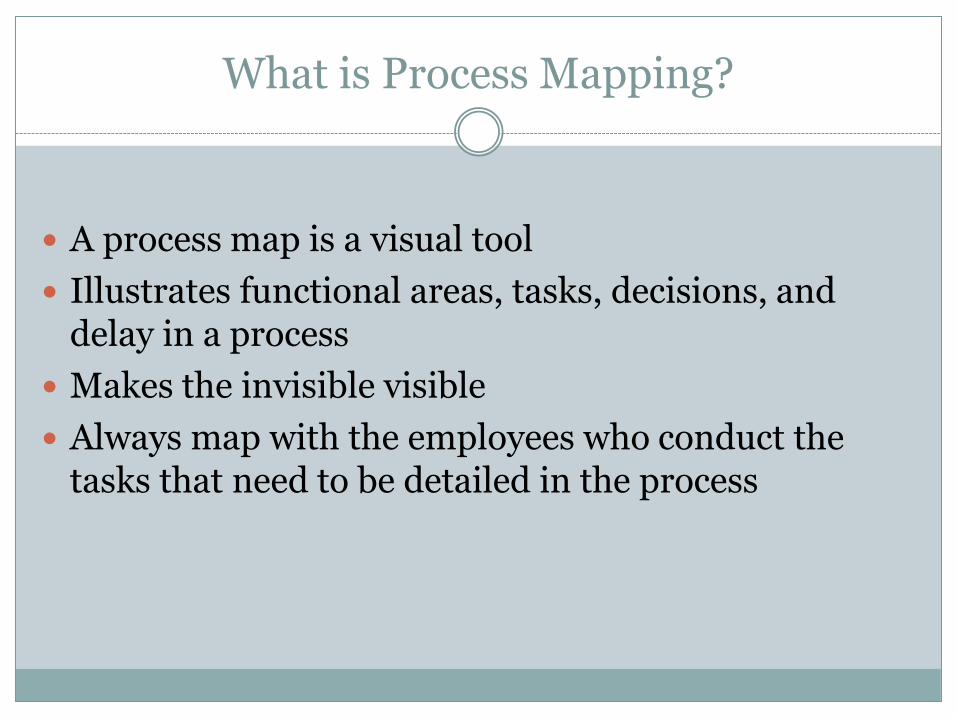
What is Process Mapping?
A process map is a visual tool
Illustrates functional areas, tasks, decisions, and delay in a process
Makes the invisible visible
Always map with the employees who conduct the tasks that need to be detailed in the process

Why Should You Process Map?
Clear and detailed visual of what is occurring in the process
Identify the flow of the process
Detail all stakeholders involved in the process
Identify process handoffs and loop backs
Can help in the identification of waste (TIM U WOOD)

Process Mapping Materials
Flip chart paper or butcher block paper
Masking tape
Washable markers
Fine point Sharpie markers
Pink, Yellow, Blue, Green, and Purple 4”x5” Post-it notes
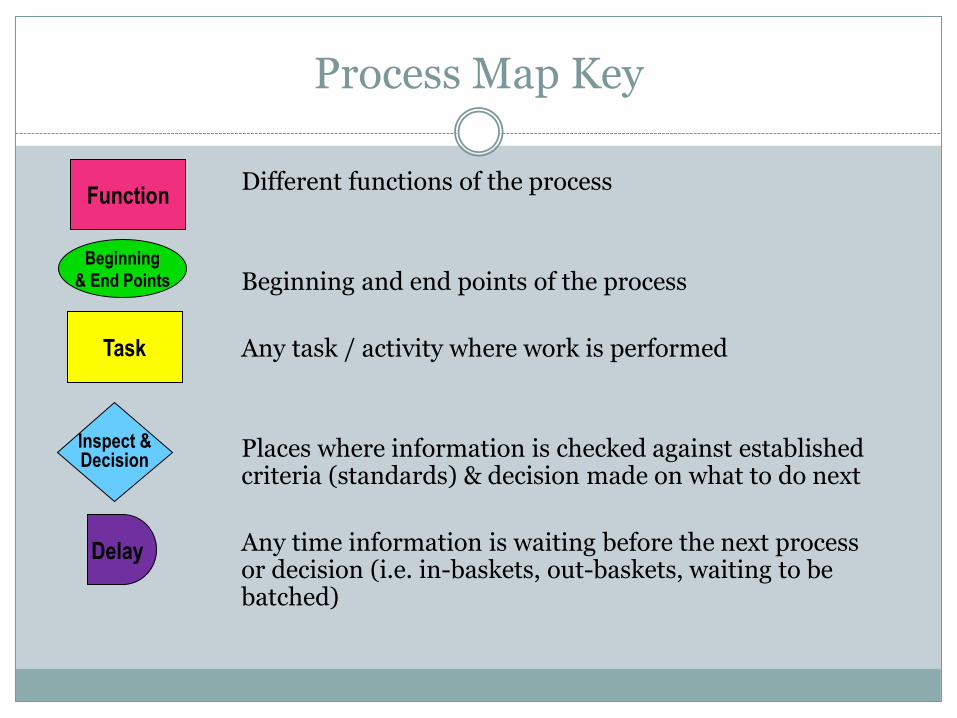
Process Map Key
Different functions of the process
Beginning and end points of the process
Any task / activity where work is performed
Places where information is checked against established criteria (standards) & decision made on what to do next
Any time information is waiting before the next process or decision (i.e. in-baskets, out-baskets, waiting to be batched)
Task
Inspect & Decision
Delay
Beginning
& End Points
Function

Process Map Arrows
Used between tasks performed by the same person or area, but no physical movement has occurred
Indicates physical movement of information/product from one function to another
Demonstrates electronic movement of information from one person/function to another
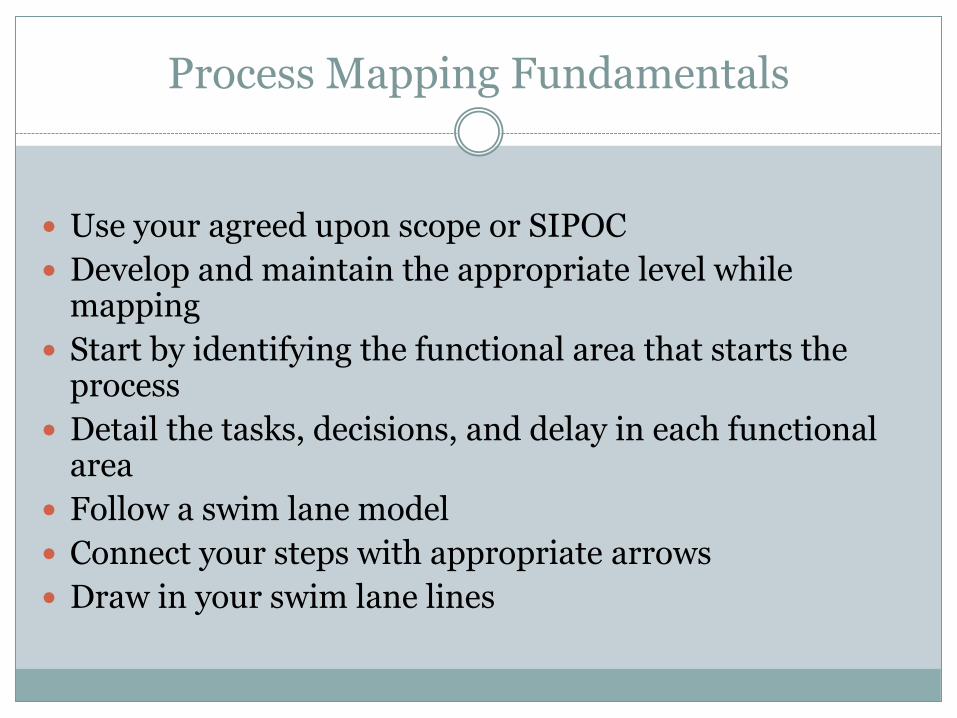
Process Mapping Fundamentals
Use your agreed upon scope or SIPOC
Develop and maintain the appropriate level while mapping
Start by identifying the functional area that starts the process
Detail the tasks, decisions, and delay in each functional area
Follow a swim lane model
Connect your steps with appropriate arrows
Draw in your swim lane lines

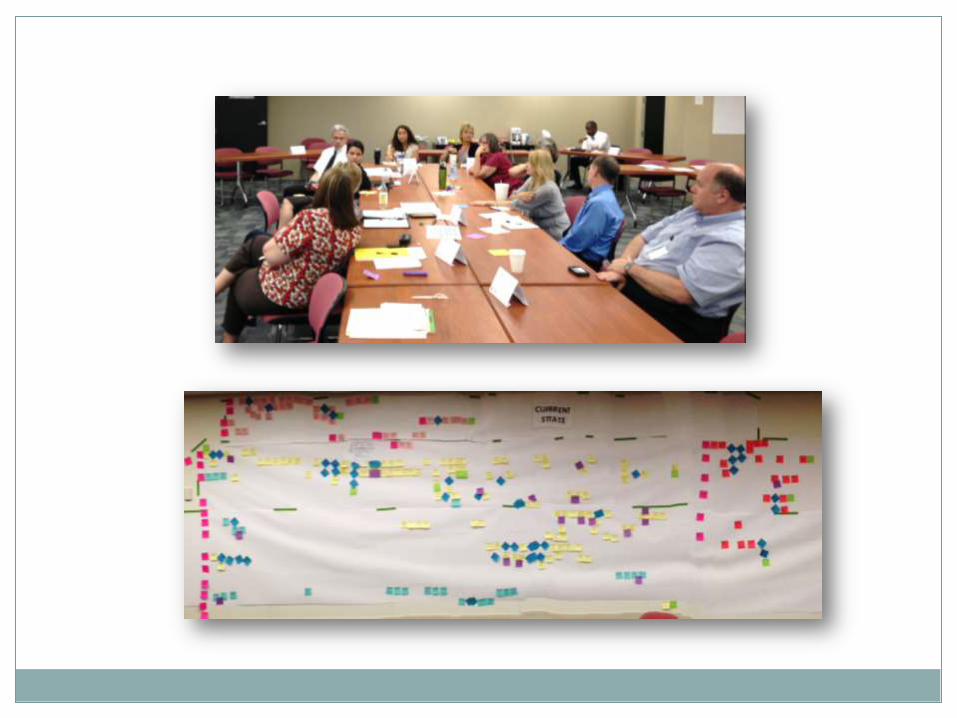
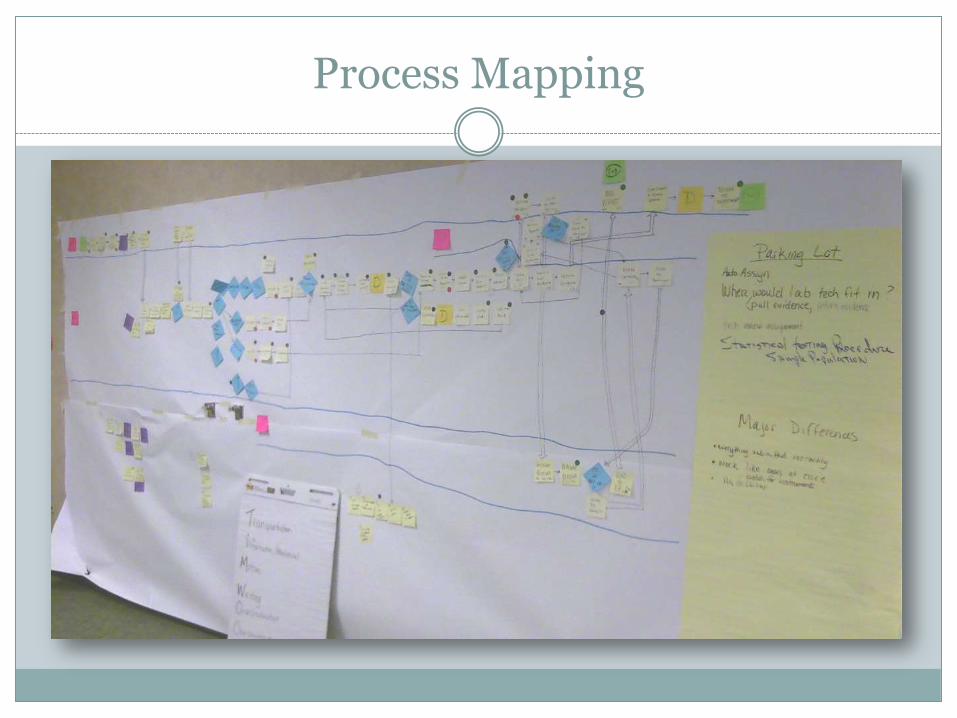
Process Mapping
Process Mapping

Process Mapping

Process Mapping Tips
Title and date your map
Use your SIPOC or scope as the beginning and ending steps on the map
Refer to the SIPOC often to keep the group on track
Avoid getting into the weeds
Create a mapping key and go over before mapping
Hang flip chart paper near the map for Parking Lot issues or Ah-Ha Moments

Process Mapping Tips
Create group ground rules before mapping
Assign roles to the team-involve them!
Take the happy path first
Focus on the process owners during the appropriate times
Repeat tasks back to the group
Never judge the group
Do not let the group jump to solutions while mapping
Only map what is currently happening

Process Mapping Tips
Use the 80/20 Rule
Read the group-watch for body language
Draw lines in with a pencil first before using the marker
Take breaks!
Count the functional areas, tasks, decisions, delays, handoffs, and loop backs
Be patient and stay engaged
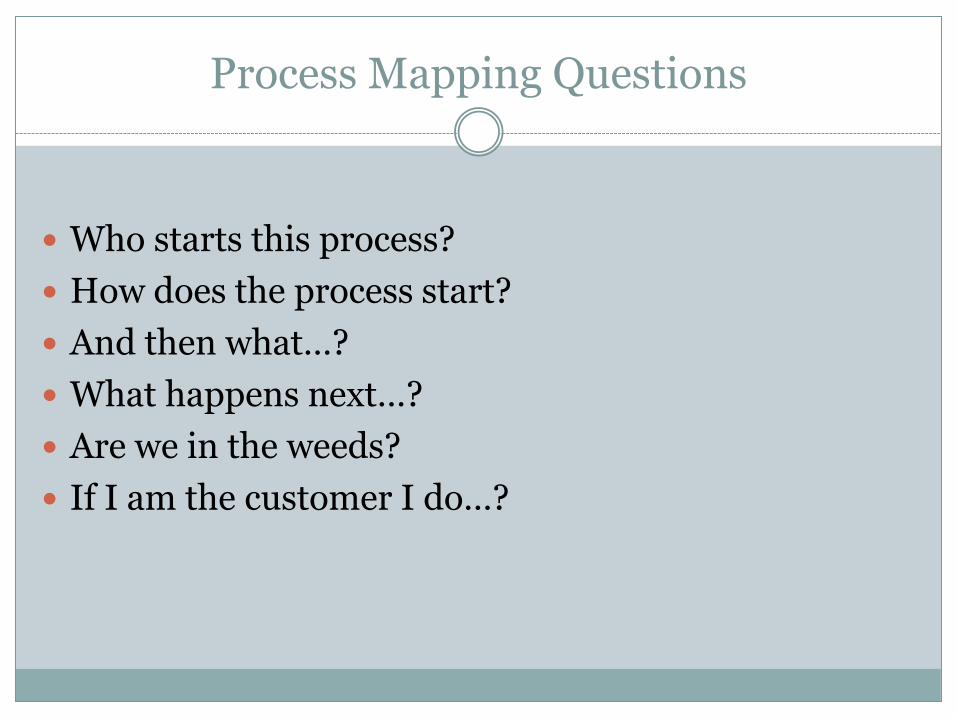
Process Mapping Questions
Who starts this process?
How does the process start?
And then what…?
What happens next…?
Are we in the weeds?
If I am the customer I do…?

Processing Mapping Activity
T H E B A D G U Y
TIM U. WOOD

Value Added (VA)
Value Added Activities (VA)-Transforms information into services and products the customer is willing to accept
VA Activities Must Meet Three Requirements:
Done right the first time
Transformational
Customer is willing to pay for
Typically 1% of a process is Value Added

Add Value
Does the task add form, feature, or function to the product or service?
Does the task enable a competitive advantage (reduced price, faster delivery, fewer defects)?
Would the customer be willing to pay extra or prefer us over the competition if he or she knew we were doing this task?

Non Value Added (NVA)
Non-Value Added Activities (NVA)
Consumes resources
Does not directly contribute to service
Customer does not care
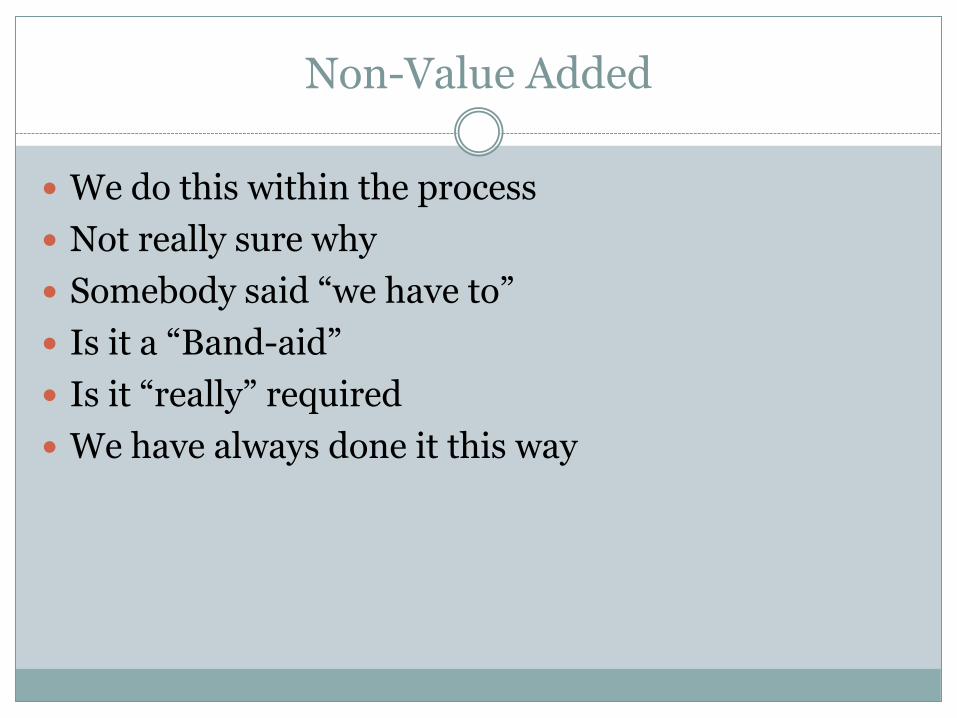
Non-Value Added
We do this within the process
Not really sure why
Somebody said “we have to”
Is it a “Band-aid”
Is it “really” required
We have always done it this way
Non Value Added but Necessary (NVAN)
Non-Value Added but Necessary (NVAN)
Customer does not care
Required to perform the step by current statute or law

Meet TIM U WOOD
Transportation
Information/Inventory
Motion Waiting
Over Processing
Over Production
Defect
Underutilization

Transportation
Transport from office to office
Transport from floor to floor
Transport from building to building
Trucking
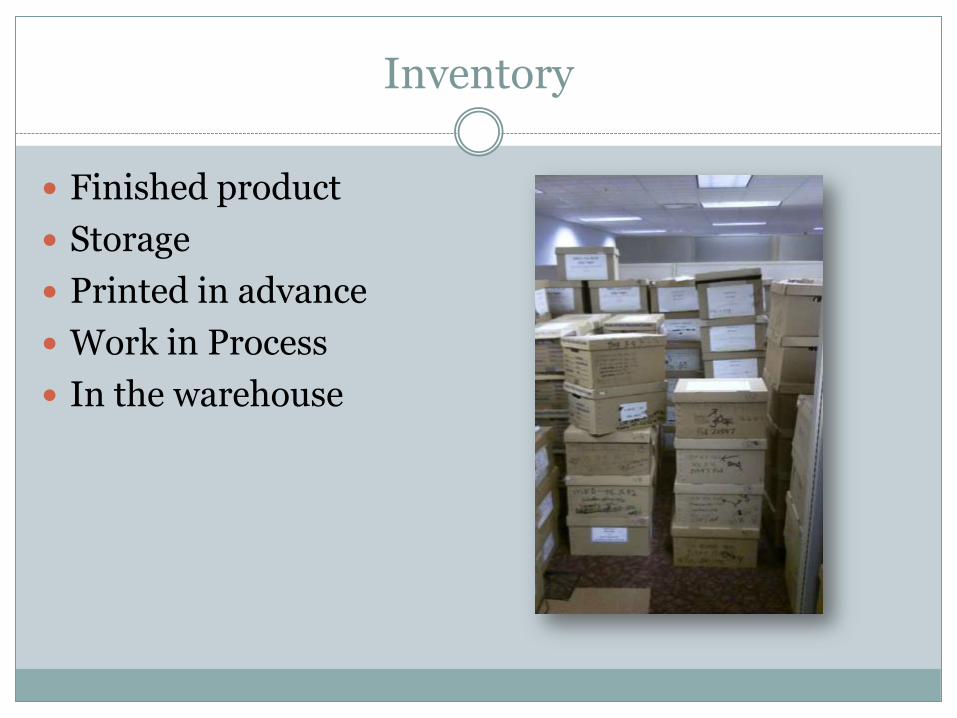
Inventory
Finished product
Storage
Printed in advance
Work in Process
In the warehouse

Motion
Inter-office movement
Office to office
Cubicle to cubicle
Going to the copier/scanner
Going to the FAX
Going to the storeroom
Reaching
Bending
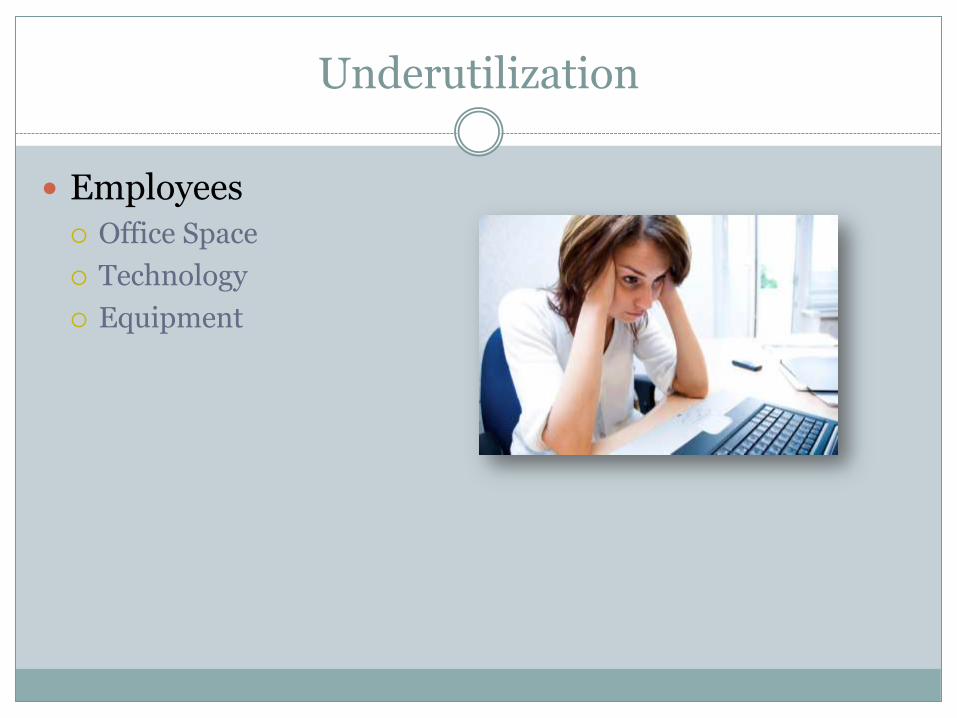
Underutilization
Employees
Office Space
Technology
Equipment

Waiting
Non productive time
Waiting for:
Copier
Scanner
Delivery
Catch up
The person upstream
Mail/UPS
Computer
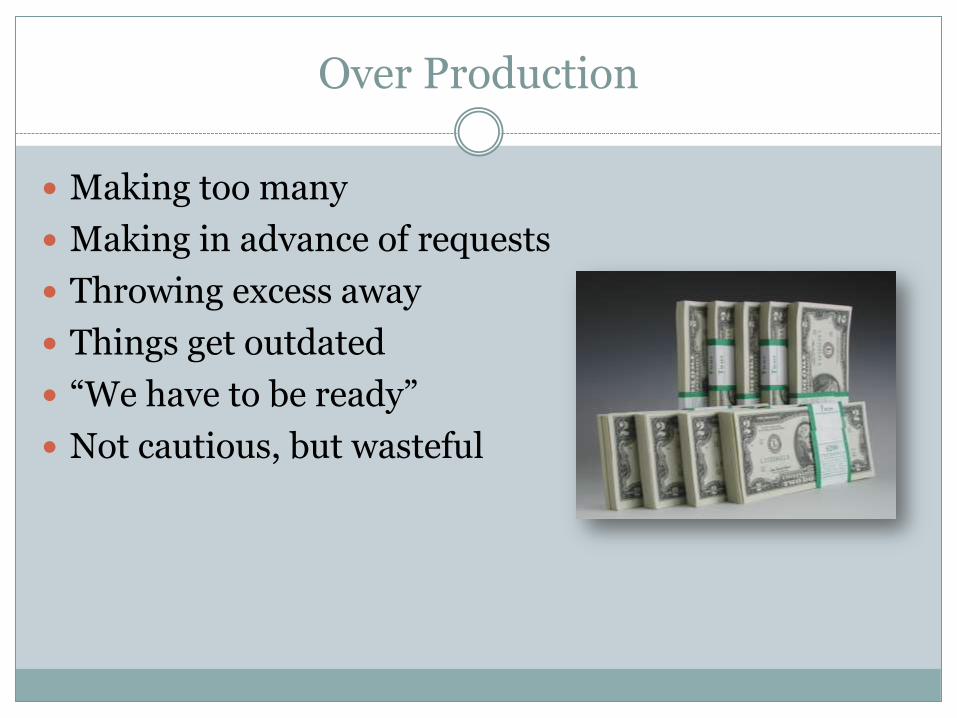
Over Production
Making too many
Making in advance of requests
Throwing excess away
Things get outdated
“We have to be ready”
Not cautious, but wasteful
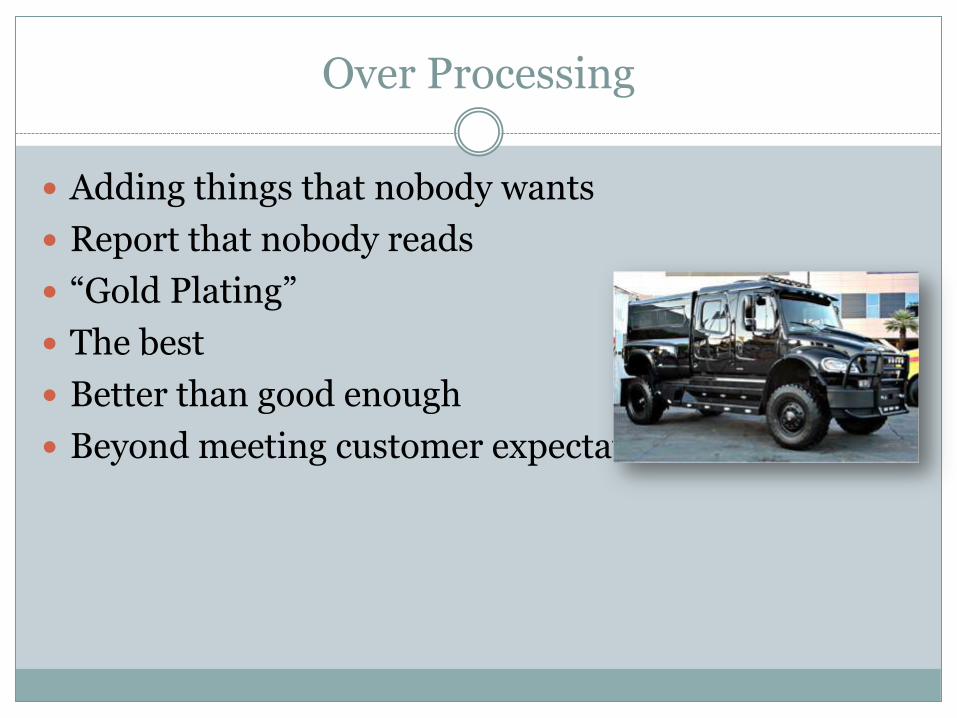
Over Processing
Adding things that nobody wants
Report that nobody reads
“Gold Plating”
The best
Better than good enough
Beyond meeting customer expectations

Defects
Mistakes
Broken
Inaccurate
Can‟t read
Can‟t understand
Wasted materials
Returned
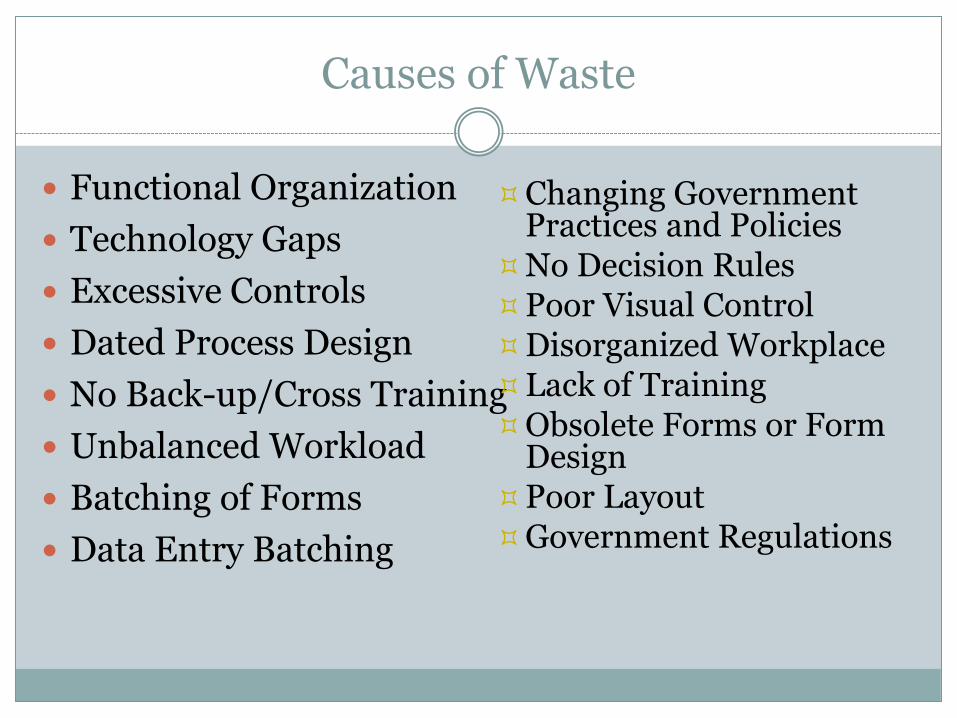
Causes of Waste
Functional Organization
Technology Gaps
Excessive Controls
Dated Process Design
No Back-up/Cross Training
Unbalanced Workload
Batching of Forms
Data Entry Batching
Changing Government Practices and Policies
No Decision Rules Poor Visual Control Disorganized Workplace Lack of Training Obsolete Forms or Form
Design Poor Layout Government Regulations

Customer complaints Customer calls Calls to legislators Waiting Defects
Transportation Inventory Motion Over production Over processing Misplaced skills Bad materials Slow machines Re-work Waste Storage Paperwork Approvals
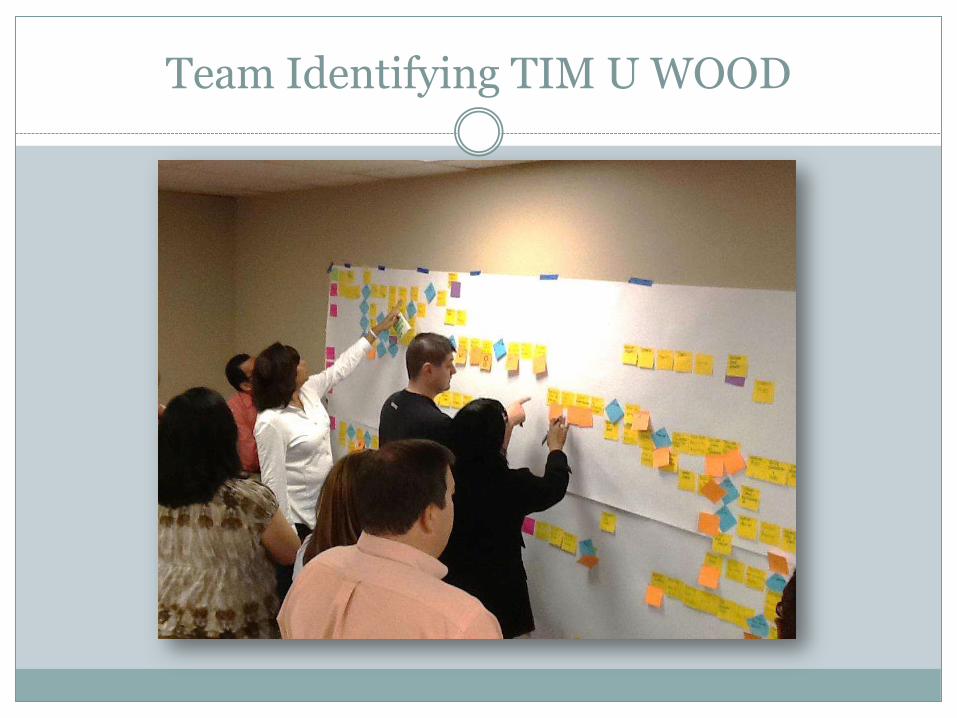
Team Identifying TIM U WOOD

TIM WOOD

Clean Sheet Redesign

Concepts to Remember During Re-design
Design processes around value-adding activities
Work performed where it makes the most sense
Ensure a continuous flow
Reduce waiting, moving, and rework time
Reduce or eliminate batching
Reduce checks and reviews
Build quality in to reduce inspection and rework (Poka-yoke)

Taxation – Tax Appeal Process
Current State = 143 steps, 4 entry points
Future State = 96 steps, 1 entry point
Lead time reduced from 32 months to as few as 7 - 20 days

ODOT Real Estate Document Process
Current State = 61 steps, 22 handoffs
Future State = 11 steps, 8 handoffs
Cost to process each records box fell from $705 to $1 by processing electronically

Public Safety – Trooper Recruitment
Current State = 235 steps, 28 decisions, 76 handoffs, 50 delays
Future State = 34 steps, 8 decisions, 11 handoffs, 15 delays
Lead time reduced from a range of 191 days to more than a year, down to 61 days
LeanOhio Trivia
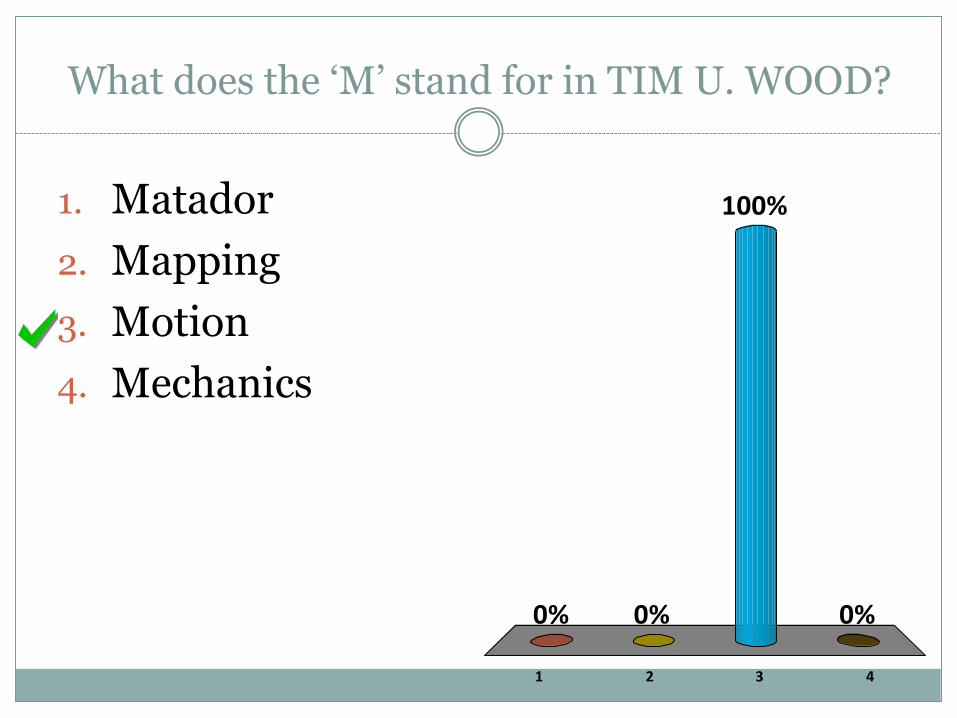
What does the „M‟ stand for in TIM U. WOOD?
1 2 3 4
0% 0%
100%
0%
1. Matador
2. Mapping
3. Motion
4. Mechanics

What is a SIPOC used for?
1 2 3 4
0% 0%
100%
0%
1. High-level brainstorming
2. Time travel
3. High-level process mapping
4. Standardization

Participant Scores
13 Participant 3A1CFC
12 Participant 3A1B83
12 Participant 3A1C22
9 Participant 3A1C36
9 Participant 3A1C19

A SIPOC is typically conducted at what level?
1 2 3 4
0% 0%
33%
67%1. 10,000 ft
2. 50,000 ft
3. 100,000 ft
4. Any level
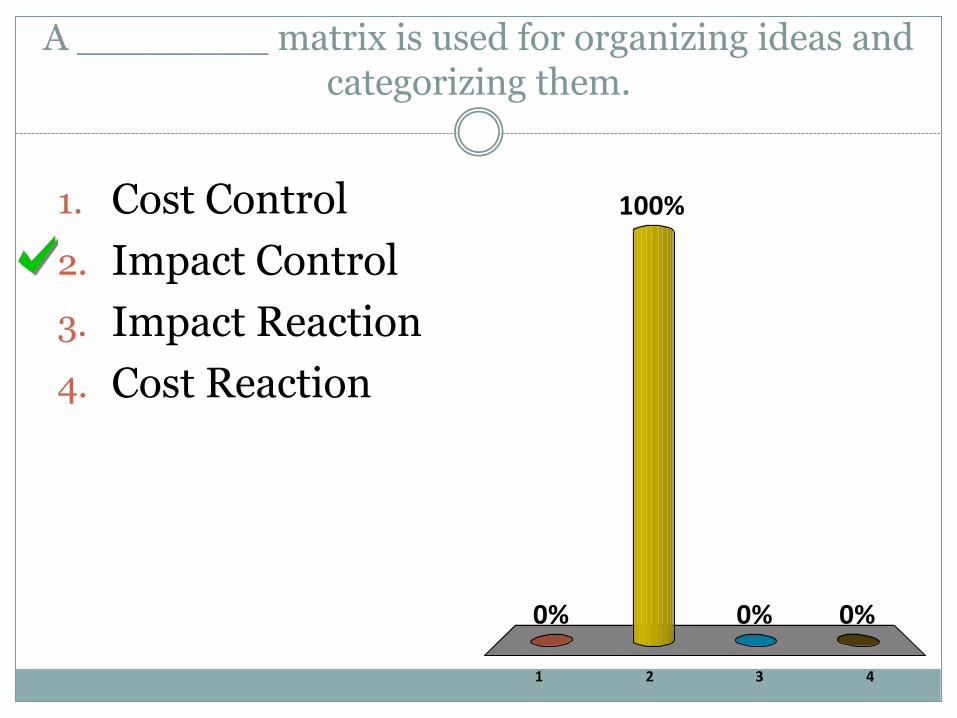
A ________ matrix is used for organizing ideas and categorizing them.
1 2 3 4
0% 0%0%
100%1. Cost Control
2. Impact Control
3. Impact Reaction
4. Cost Reaction

Participant Scores
15 Participant 3A1CFC
14 Participant 3A1B83
14 Participant 3A1C22
11 Participant 3A1C19
10 Participant 3A1C36

A Six Sigma process contains how many defects per million?
1. 2. 3. 4.
0%
100%
0%0%
1. 2.4
2. 4.3
3. 4.2
4. 3.4

_____ is defined as a systematic approach to identifying and eliminating waste.
1 2 3 4
0% 0%0%
100%1. Six Sigma
2. Lean
3. Customer Service
4. Kaizen

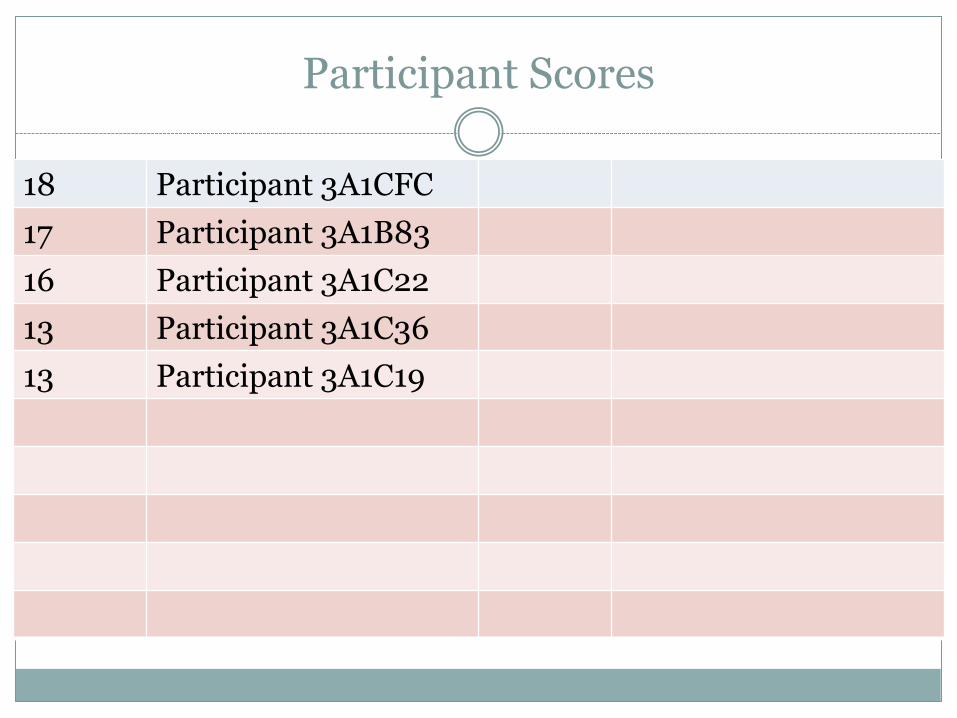
Participant Scores
17 Participant 3A1CFC
16 Participant 3A1B83
16 Participant 3A1C22
13 Participant 3A1C19
12 Participant 3A1C36

How many rooms on currently in “this” Hilton?
1 2 3 4
17% 17%17%
50%1. 410
2. 285
3. 313
4. 433

On average, how many post-it notes does LeanOhio use in a Kaizen event?
1 2 3 4
17%
50%
33%
0%
1. 750
2. 1,500
3. 1,100
4. 2,400

And the winner is…
Participant Scores
18 Participant 3A1CFC
17 Participant 3A1B83
16 Participant 3A1C22
13 Participant 3A1C36
13 Participant 3A1C19
Additional Information
http://lean.ohio.gov/