IAEG2006 Paper number 302 3D SEISMIC … · iaeg2006 paper number 302 1 3d seismic tomography...
15
IAEG2006 Paper number 302 1 3D SEISMIC TOMOGRAPHY SURVEY OF A MINESHAFT AT PEWFALL, ST. HELENS LEVÉ DE TOMOGRAPHIE SISMIQUE 3D D’UN PUITS DE MINE À PEWFALL, ST. HELENS D.A. Gunn 1 , B. Dyer 2 , L.M. Nelder 3 , M.G. Raines 4 , D.J.R. Morgan 5 & S. Caunt 6 1 British Geological Survey. (e-mail: [email protected]) 2 Semore Seismic Ltd.. (e-mail: [email protected]) 3 British Geological Survey. (e-mail: [email protected]) 4 British Geological Survey. (e-mail: [email protected]) 5 British Geological Survey. (e-mail: [email protected]) 6 The Coal Authority. (e-mail: [email protected]) Abstract: Mineshafts disturb the velocity properties in the surrounding rockmass, which can be detected using seismic surveying. Seismic tomography surveys are improved by accounting for effects on ray paths of diffraction about the shaft and refraction in the disturbed rockmass. In true 3D processing this requires lateral ray bending around the mineshaft, which is often not achieved in pseudo-3D from 2D stitching. Prior to survey set-up modelling has provided valuable insight and has aided field survey configuration. 3D field tomographic images were produced from cross-hole surveys about a mineshaft between cased, water-filled boreholes. A repeatable high voltage sparker provided the seismic energy source and a string of 20 passive hydrophones provided the receivers. Good quality field data were gathered by stacking a small number of shots from each source location. Ray bending was applied to initial tomograms that were produced using straight ray paths between source and receiver locations. 2D inversions between perimeter boreholes about the shaft indicated velocities to 1.5km/s above a zone with velocities to 2km/s overlying a variable thickness zone with velocities from 2km/s to 2.75km/s with a basal high velocity zone with velocities to 3.2km/s. This was tied into the local geology using borehole logs where the host formation possibly comprised a sandstone or siltstone rich unit bounded by mudstone rich units above and below. 3D processing using insufficient ray coverage produced very low velocity artefacts in the inverted velocity matrix. Increased ray coverage from further boreholes led to the shaft being imaged as a perturbation to the velocity field by a low-velocity pipe structure caused by ray bending that is consistent with the processes of refraction and diffraction. Pre-survey modelling is recommended on a site-by-site basis to aid the design of optimum survey configurations. Résumé: Les puits de mine perturbent les propriétés de vitesse dans la masse rocheuse environnante, ceci peut être détecté par un levé sismique. Les levés de tomographie sismique sont améliorés si l’on tient compte des effets sur les trajectoires des rayons qu’ont la diffraction au niveau du puits et la réfraction au niveau de la masse rocheuse disloquée. Pour un véritable traitement 3D, il faut une courbure latérale des rayons au niveau du puis de mine, ceci n’étant pas souvent réalisé en pseudo 3D à partir de l’assemblage 2D. Avant le levé, une modélisation de la configuration a procuré un aperçu inestimable et a facilité la configuration du levé sur le terrain. Des images tomographiques de terrain 3D ont été produites à partir de levés transversaux au niveau d’un puits de mine entre des trous de sonde gainés et remplis d’eau. Un étinceleur haute tension répétable a fourni la source d’énergie sismique et une série de 20 hydrophones passifs a fourni les récepteurs. Des données de terrain de bonne qualité ont été collectées en superposant un petit nombre de tirs en provenance de chaque lieu de source. La courbure de rayons a été appliquée sur les premiers tomogrammes produits avec des trajectoires de rayons droites entre les lieux de source et de réception. Des inversions 2D entre les trous de sonde périmétriques au niveau du puits ont indiqué des vitesse de 1,5 km/s supérieures à une zone ayant des vitesses de 2 km/s reposant sur une zone d’épaisseur variable ayant des vitesses allant de 2 km/s à 2,75 km/s avec une zone à vitesse de base élevée avec des vitesses de 3,2 km/s. Ceci a été rapproché de la géologie locale par des journaux de sondage lorsque la formation hôte a probablement compris un ensemble riche en grès ou en siltstone entouré au-dessus et en dessous d’ensembles riches en mudstone. Le traitement 3D avec une couverture insuffisante de rayons a produit des artéfacts de très faible vitesse dans la matrice de vitesse inversée. Une couverture de rayons augmentée d’autres trous de sonde a mené au puits imagé sous la forme d’une perturbation au niveau du champ des vitesses par une structure de faible vitesse causée par la courbure des rayons correspondant aux processus de réfraction et de diffraction. Une modélisation préalable au levé est recommandée en fonction des sites pour faciliter la conception de configurations optimales des levés. Keywords: 3D models, abandoned mines, engineering properties, geological hazards, geophysics, site investigation INTRODUCTION Cross-hole seismic surveys provide a technique for engineering site investigation capable of assessing the ground between multiple boreholes, (Jackson et al. 2001). They have developed over the last three decades from simple horizontal scans between two boreholes to 3-D tomographic surveys using many pairs of boreholes and thousands of measurements from individual rays. The propagation of transient seismic waves between boreholes is controlled by the dynamic elastic properties and ‘strength-type’ ground conditions, thus, they can provide good responses to disturbances caused by the excavation of a mineshaft in the ground.
Transcript of IAEG2006 Paper number 302 3D SEISMIC … · iaeg2006 paper number 302 1 3d seismic tomography...

IAEG2006 Paper number 302
1
3D SEISMIC TOMOGRAPHY SURVEY OF A MINESHAFT AT PEWFALL, ST. HELENS
LEVÉ DE TOMOGRAPHIE SISMIQUE 3D D’UN PUITS DE MINE À PEWFALL, ST. HELENS D.A. Gunn1, B. Dyer2, L.M. Nelder3, M.G. Raines4, D.J.R. Morgan5 & S. Caunt6 1 British Geological Survey. (e-mail: [email protected]) 2 Semore Seismic Ltd.. (e-mail: [email protected]) 3 British Geological Survey. (e-mail: [email protected]) 4 British Geological Survey. (e-mail: [email protected]) 5 British Geological Survey. (e-mail: [email protected]) 6 The Coal Authority. (e-mail: [email protected])
Abstract: Mineshafts disturb the velocity properties in the surrounding rockmass, which can be detected using
seismic surveying. Seismic tomography surveys are improved by accounting for effects on ray paths of diffraction about the shaft and refraction in the disturbed rockmass. In true 3D processing this requires lateral ray bending around the mineshaft, which is often not achieved in pseudo-3D from 2D stitching. Prior to survey set-up modelling has provided valuable insight and has aided field survey configuration. 3D field tomographic images were produced from cross-hole surveys about a mineshaft between cased, water-filled boreholes. A repeatable high voltage sparker provided the seismic energy source and a string of 20 passive hydrophones provided the receivers. Good quality field data were gathered by stacking a small number of shots from each source location. Ray bending was applied to initial tomograms that were produced using straight ray paths between source and receiver locations. 2D inversions between perimeter boreholes about the shaft indicated velocities to 1.5km/s above a zone with velocities to 2km/s overlying a variable thickness zone with velocities from 2km/s to 2.75km/s with a basal high velocity zone with velocities to 3.2km/s. This was tied into the local geology using borehole logs where the host formation possibly comprised a sandstone or siltstone rich unit bounded by mudstone rich units above and below. 3D processing using insufficient ray coverage produced very low velocity artefacts in the inverted velocity matrix. Increased ray coverage from further boreholes led to the shaft being imaged as a perturbation to the velocity field by a low-velocity pipe structure caused by ray bending that is consistent with the processes of refraction and diffraction. Pre-survey modelling is recommended on a site-by-site basis to aid the design of optimum survey configurations.
Résumé: Les puits de mine perturbent les propriétés de vitesse dans la masse rocheuse environnante, ceci peut être détecté par un levé sismique. Les levés de tomographie sismique sont améliorés si l’on tient compte des effets sur les trajectoires des rayons qu’ont la diffraction au niveau du puits et la réfraction au niveau de la masse rocheuse disloquée. Pour un véritable traitement 3D, il faut une courbure latérale des rayons au niveau du puis de mine, ceci n’étant pas souvent réalisé en pseudo 3D à partir de l’assemblage 2D. Avant le levé, une modélisation de la configuration a procuré un aperçu inestimable et a facilité la configuration du levé sur le terrain. Des images tomographiques de terrain 3D ont été produites à partir de levés transversaux au niveau d’un puits de mine entre des trous de sonde gainés et remplis d’eau. Un étinceleur haute tension répétable a fourni la source d’énergie sismique et une série de 20 hydrophones passifs a fourni les récepteurs. Des données de terrain de bonne qualité ont été collectées en superposant un petit nombre de tirs en provenance de chaque lieu de source. La courbure de rayons a été appliquée sur les premiers tomogrammes produits avec des trajectoires de rayons droites entre les lieux de source et de réception. Des inversions 2D entre les trous de sonde périmétriques au niveau du puits ont indiqué des vitesse de 1,5 km/s supérieures à une zone ayant des vitesses de 2 km/s reposant sur une zone d’épaisseur variable ayant des vitesses allant de 2 km/s à 2,75 km/s avec une zone à vitesse de base élevée avec des vitesses de 3,2 km/s. Ceci a été rapproché de la géologie locale par des journaux de sondage lorsque la formation hôte a probablement compris un ensemble riche en grès ou en siltstone entouré au-dessus et en dessous d’ensembles riches en mudstone. Le traitement 3D avec une couverture insuffisante de rayons a produit des artéfacts de très faible vitesse dans la matrice de vitesse inversée. Une couverture de rayons augmentée d’autres trous de sonde a mené au puits imagé sous la forme d’une perturbation au niveau du champ des vitesses par une structure de faible vitesse causée par la courbure des rayons correspondant aux processus de réfraction et de diffraction. Une modélisation préalable au levé est recommandée en fonction des sites pour faciliter la conception de configurations optimales des levés.
Keywords: 3D models, abandoned mines, engineering properties, geological hazards, geophysics, site
investigation
INTRODUCTION Cross-hole seismic surveys provide a technique for engineering site investigation capable of assessing the ground
between multiple boreholes, (Jackson et al. 2001). They have developed over the last three decades from simple horizontal scans between two boreholes to 3-D tomographic surveys using many pairs of boreholes and thousands of measurements from individual rays. The propagation of transient seismic waves between boreholes is controlled by the dynamic elastic properties and ‘strength-type’ ground conditions, thus, they can provide good responses to disturbances caused by the excavation of a mineshaft in the ground.

IAEG2006 Paper number 302
2
Cross-hole seismic techniques have been used at the site scale to monitor rock parameters (Paulsson et al. 1985) and several applications to civil engineering are described by McCann et al. (1986), who show how a tunnel has a significant effect on seismic velocity and amplitude. The principle behind borehole seismic transmission tomography (compressional waves) is to divide the rockmass between several boreholes into a number of cells of constant velocity. The velocity of these cells is then assessed using a large number of rays with wide angular ray coverage. In a practical survey the number of ray paths and the mathematical inversion procedure determines the number of cells in the velocity matrix. Limitations to the grid cell size are imposed by wavelength and large velocity contrasts. Diffraction can be significant when spatial changes in velocity occur over distances comparable to the wavelength, making it inappropriate to use cell sizes less than the wavelength of the seismic pulse. Large unknown velocity contrasts can lead to difficulties in ray tracing and in such cases assuming straight rays is often preferred (e.g. Dyer & Worthington, 1988; Jackson & McCann, 1997; Weilandt 1987). An analysis of the Pewfall survey data indicated that the frequencies propagated at the Pewfall sites were no greater than 500Hz and that velocities were generally within the range from 1.0 to 3.0kms-1. Thus, the estimated minimum survey wavelength is 2m, which is the grid cell size used to invert the survey data.
a. Orientation of survey grids relative to bedrock geology. (arrows pointing origin on both grids.)
b. Borehole configurations about the shafts in local grid co-ordinates.
Normal Fault
Grid B
Grid C
Scale50m
Observedmineshaft
North
Lower Coal Measures Formation
Middle Coal Measures Formation
Ravenshead Rock
Main Bedrock Geology
Location of mineshaft on grid
4
6
8
10
12
14
16
18
20
22
24
18 20 22 24 26 28 30 32 34 36 38
BH 1
BH 2
BH 3
BH 4
BH 5
BH 6
BH 7
BH 8
26
28
30
32
34
36
38
40
42
44
46
20 22 24 26 28 30 32 34 36 38 40
BH 1
BH 3
BH 5
BH 7
NorthNorthSite B Site C
Air-filled mineshaft
Back-filled mineshaft
Figure 1. Location, orientation and configuration of survey sites with respect to the bedrock geology.
FIELD TOMOGRAPHIC SURVEYS AND DATA PROCESSING
Site location and geology The survey area was located on the former site of the Pewfall Colliery, which is roughly mid-way between St.
Helens and Wigan. Since the cessation of mining the site has been returned to agriculture, but some fenced off mineshafts remain in neighbouring fields. Bedrock geology consists of the Lower Coal Measures Formation, the Middle Coal Measures Formation and the Ravenshead Rock with a regional dip of 30° to the south-east. The site is cut by a normal fault (the Bullstake Fault) that is downthrown to the south-west, with a dip of 70° and strikes to the south-east (see Figure 1a). The bedrock geology is overlain by glacial till to an unknown thickness but is possibly up to 10m thick. Two 50m x 50m survey grids were established and denoted Site B, which was on a gentle, south-west facing slope, and, Site C, which was in a shallow trough that widened and whose axis also dipped to the south-west, (Figure 1a). The origin of Grid B was located at British National Grid co-ordinates 355120.95E, 398376.82N and the origin of Grid C was located at BNG 355208.89E, 398346.88N. The north-eastern half of Site B is covered by the remnants

IAEG2006 Paper number 302
3
of an old spoil heap. Within each grid a range of surface geophysical walk-over surveys (Busby et al. 2004a, 2004b) were undertaken to identify anomalies that could be interpreted as potential locations for mineshafts known to be located somewhere within each grid. Having identified suitable locations an arrangement of eight boreholes spaced every 45 degrees were drilled on the circumference of a circle of radius 7.5m from a centre coincident with the middle of the shaft in Grid B, (Figure 1b). However, an arrangement of only four boreholes spaced every 90 degrees were drilled on the circumference of a circle of radius 7.5m from a centre coincident with the middle of the shaft in Grid C, (Figure 1b).
B & C Receivers B Sources B Configuration C Sources C Combinations
20 locations 11 locations 20 combinations 19 locations 6/7 combinations Position Number
Depth ( m )
Position Number
Depth ( m )
Transmit Borehole
Receive Borehole
Position Number
Depth ( m )
Transmit Borehole
Receive Borehole
1 1 1 1 1 4 1 2 1 5 2 1.5 2 2 1 5 2 3 3 1 3 2 3 3 1 6 3 4 5 1 4 2.5 4 4 2 4 4 5 5 3 5 3 5 6 2 5 5 6 7 1 6 4 6 8 2 6 6 7 7 3 7 5 7 10 2 7 7 8 7 5 8 6 8 12 2 8 8 9 9 7 9 14 3 1 9 10
10 8 10 16 3 5 10 11 11 9 11 18 3 6 11 12 12 10 3 7 12 13 13 11 3 8 13 14 14 12 5 8 14 15 15 13 6 4 15 16 16 14 7 1 16 17 17 15 7 4 17 18 18 16 7 5 18 19 19 17 8 4 19 20 20 18 8 6
Table 1. Borehole combination: source and receiver location of the seismic tomographic surveys at Pewfall.
26
28
30
32
34
36
38
40
42
44
46
20 22 24 26 28 30 32 34 36 38 40
BH 1
BH 3
BH 5
BH 7
Site C North
4
6
8
10
12
14
16
18
20
22
24
18 20 22 24 26 28 30 32 34 36 38
BH 1
BH 2
BH 3
BH 4
BH 5
BH 6
BH 7
BH 8
Site B North
Figure 2. Borehole combinations in the tomographic surveys. (colour coded to indicate transmitting borehole.) Field Operations
A field tomographic survey involves the use of a transmitter and receiver placed on opposite sides of a structure and moved in a series of possible combinations to obtain time delay measurements across the structure, as shown in Figure 2. Table 1 indicates the source and receiver depths, and the transmit-receive borehole combinations used in the surveys. Ray paths used in the survey include those between the source locations and the receiver locations in Table 1 above. The use of surface source / receiver locations was not utilised in this survey. Seismic records were gathered for all receivers in the ‘Receive Borehole’ that were the stacked average of eight shots from each source location in the ‘Source Borehole’. At site B the total survey comprised twenty borehole combinations, but at site C only six were shot, as shown in Figure 2. At site C the combination between boreholes 1 and 5 was repeated in reverse shot because at one stage the field team suspected poor acoustic coupling between the formation and borehole 5. (The coupling was

IAEG2006 Paper number 302
4
considered satisfactory after a successful repeat shoot). Boreholes were completed with slotted casing in a plastic mesh sleeve that was grouted in using a bentonite/cement mix. Drillers’ logs were made from the cutting from all holes. Prior to casing formation density and induction logs were run in all eight holes in site B, and additional 3-arm caliper, XYZ verticality and full waveform sonic logs were run in boreholes 4 and 8 in site B, (Wilkinson et al. 2004, Beamish et al. 2005). Data Processing
Data processing was organised in three overall stages: time picking, 2D inversions and 3D inversions. Time picking was undertaken semi-automatically using a combination of a simple ‘threshold and track’ automatic time picking algorithm before manually adjusting badly picked traces. Arrival times were picked as the onset of the first event on each receiver seismograms. This procedure produced up to 4400 arrival times for site B; one for each ray path through the survey volume.
The objective of the 2D inversions was to ascertain the general velocity-depth intervals and the general velocity structure between each transmit-receive borehole configuration. These could then be compared and assessed against the borehole log data. In this manner a generalised background geological model could be established within which the performance of the 3D inversion could be evaluated. Assessment of the general velocity-depth intervals was achieved be constructing a simple ‘layer-cake’ velocity-depth structure using horizontal rays. The velocity of each layer was calculated via the assignment of the appropriate field measured delay time along each horizontal ray path. Assessment of the general velocity structure was achieved using a bent ray 2D inversion. The bent ray 2D inversion procedure involved the construction of a 2D velocity matrix between each transmit-receive borehole combination, which was formulated in the following manner: An initial velocity matrix was formed by assigning the field-measured delay times to straight ray paths (from each source to each receiver). A ray tracing procedure (Moser 1991) was then applied to the initial velocity matrix, which causes the ray paths to bend such that the minimum travel time from source to receiver is achieved. A final velocity matrix was generated by a back projection along the minimum time ray paths. The inversion utilised a typical commercial tomographic software package using the simultaneous iterative re-construction technique (SIRT), (Dyer & Worthington 1988). The data presented have been produced using DIVINE Version 4.01 Transmission and Reflection Tomographic Imaging Software. To negate the effect of slow ray segments in the made ground cover and drift materials the bent ray inversion was restricted to sources and receivers from 6m depth and below.
The objective of the 3D inversion was to assess the performance of the seismic (acoustic) tomography technique in the detection of an air-filled mineshaft at site B and a back-filled mineshaft at site C. The 3D inversion undertaken following the same procedure as the 2D inversion: step 1 initial velocity matrix from straight rays from sources to receivers and step 2 ray trace through the initial velocity matrix and form a second velocity matrix from a back projection along the bent rays.
The closeness of match of the 2D and the 3D inversions can be assessed after each step via the difference between the field-measured travel times and the travel times modelled along the ray paths through the inverted velocity matrix. These difference errors can be evaluated either by observing the modelled and real time picks on the field seismograms or by a contour plot. A continual reduction in the errors after each step indicates that the inversion procedure has stabilised towards a closest matching solution.
Table 2. Pewfall B: Horizontal layer cake velocity-depth intervals for borehole combinations.
Velocity ( km/s ) at source depths indicatedPanel 2m 4m 6m 8m 10m 12m 14m 16m 18mT1-R4 1.05 1.1 1.45 1.76 2.25 2.7 2.9 3.1 3.05T1-R5 1.05 1.1 1.37 1.66 1.96 2.35 2.73 2.94 3T1-R6 0.8 0.94 1.35 1.64 1.98 2.41 2.7 3.15 3.08T2-R4 0.79 1.15 1.44 1.68 2.2 2.8 2.91 3.1 3.1T2-R5 1.03 1.15 1.36 1.62 2.05 2.62 3 3.13 3.1T2-R6 0.85 1.02 1.32 1.56 1.95 2.44 2.74 2.95 2.95T2-R7 1 1.17 1.51 1.76 2.25 2.69 2.76 3 2.95T2-R8 1.04 1.2 1.67 1.99 2.47 2.79 2.94 3.1 3.05T3-R1 1.03 1.22 1.77 2.24 2.68 3.03 3.22 3.38 3.38T3-R5 0.9 1.1 1.44 1.61 1.86 2.54 2.96 2.96 3.13T3-R6 1.41 1.54 1.89 2.41 2.71 2.82 2.94T3-R7 1.02 1.21 1.52 1.73 2.18 2.61 2.82 2.99 2.99T3-R8 0.98 1.23 1.71 2.07 2.42 2.75 2.93 3.1 3.1T5-R8 1.04 1.12 1.38 1.68 2.06 2.48 2.85 3.05 3.05T6-R4 0.82 0.98 1.12 1.47 1.71 2.28 2.68 2.8 3.01T7-R1 0.75 1.23 1.5 1.8 2.3 2.6 2.9 3.2 3.1T7-R4 0.95 1.09 1.44 1.69 2.17 2.67 2.86 2.95 2.95T7-R5 0.86 0.98 1.28 1.53 1.97 2.55 2.83 3.08 3.15T8-R4 1.01 1.11 1.44 1.76 2.22 2.57 2.7 2.84 2.84T8-R6 0.88 1.1 1.27 1.5 2.14 2.69 2.85 3.01 2.95
General Velocity-Depth IntervalsLoose Very Low Low Intermediate HighCover
Large velocity T1 = Transmitting borehole BH 1Contrast R4 = Receiving Borehole BH 4
IAEG2006 Paper number 302
5
RESULTS 2 Boreholes – 2D Inversions Air-Filled Mineshaft on Site B
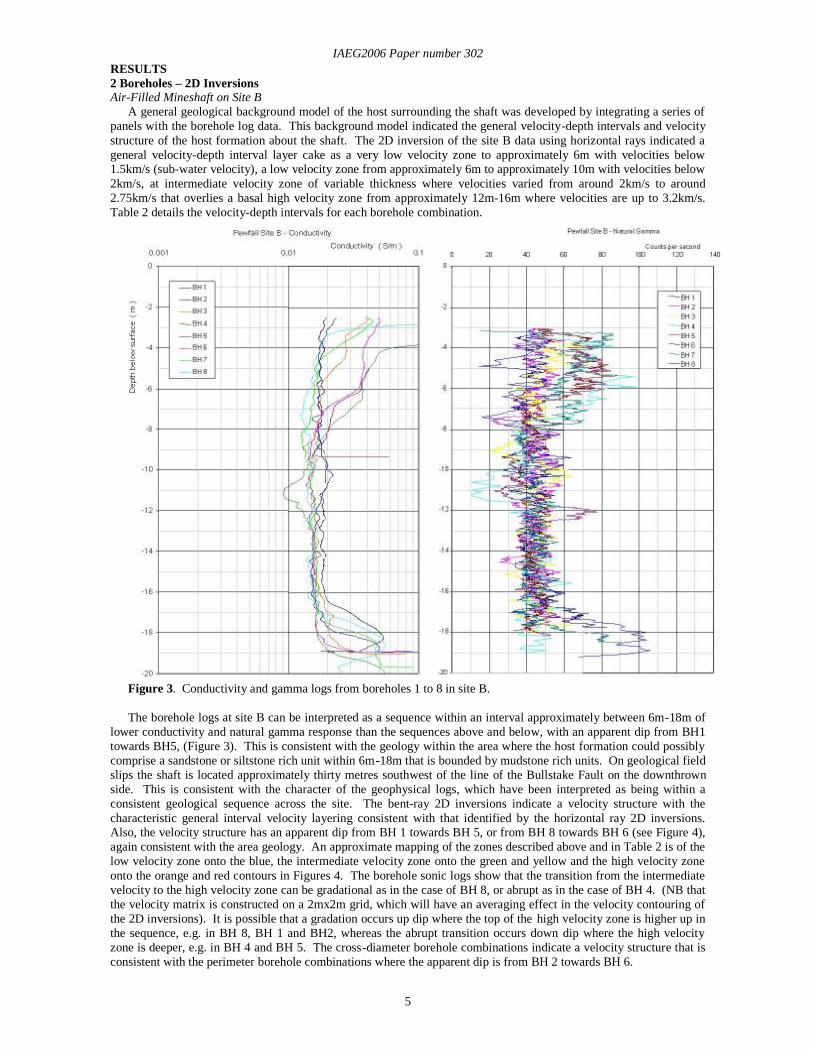
A general geological background model of the host surrounding the shaft was developed by integrating a series of panels with the borehole log data. This background model indicated the general velocity-depth intervals and velocity structure of the host formation about the shaft. The 2D inversion of the site B data using horizontal rays indicated a general velocity-depth interval layer cake as a very low velocity zone to approximately 6m with velocities below 1.5km/s (sub-water velocity), a low velocity zone from approximately 6m to approximately 10m with velocities below 2km/s, at intermediate velocity zone of variable thickness where velocities varied from around 2km/s to around 2.75km/s that overlies a basal high velocity zone from approximately 12m-16m where velocities are up to 3.2km/s. Table 2 details the velocity-depth intervals for each borehole combination.
Figure 3. Conductivity and gamma logs from boreholes 1 to 8 in site B. The borehole logs at site B can be interpreted as a sequence within an interval approximately between 6m-18m of
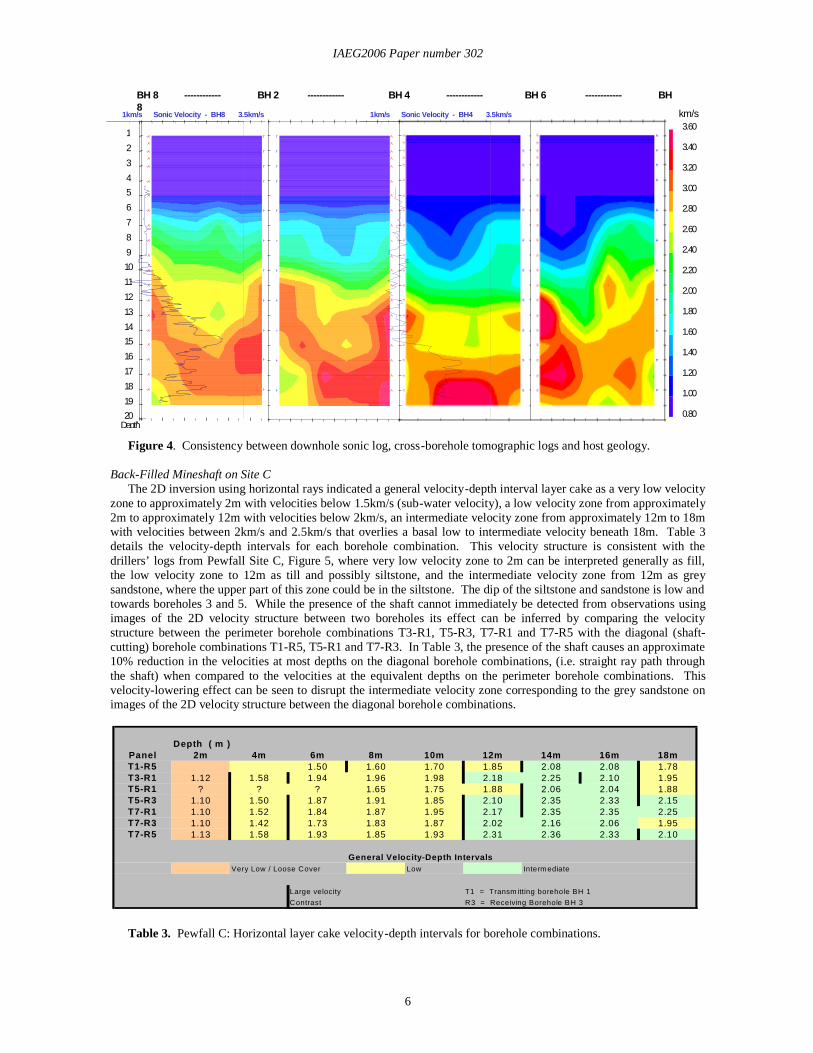
lower conductivity and natural gamma response than the sequences above and below, with an apparent dip from BH1 towards BH5, (Figure 3). This is consistent with the geology within the area where the host formation could possibly comprise a sandstone or siltstone rich unit within 6m-18m that is bounded by mudstone rich units. On geological field slips the shaft is located approximately thirty metres southwest of the line of the Bullstake Fault on the downthrown side. This is consistent with the character of the geophysical logs, which have been interpreted as being within a consistent geological sequence across the site. The bent-ray 2D inversions indicate a velocity structure with the characteristic general interval velocity layering consistent with that identified by the horizontal ray 2D inversions. Also, the velocity structure has an apparent dip from BH 1 towards BH 5, or from BH 8 towards BH 6 (see Figure 4), again consistent with the area geology. An approximate mapping of the zones described above and in Table 2 is of the low velocity zone onto the blue, the intermediate velocity zone onto the green and yellow and the high velocity zone onto the orange and red contours in Figures 4. The borehole sonic logs show that the transition from the intermediate velocity to the high velocity zone can be gradational as in the case of BH 8, or abrupt as in the case of BH 4. (NB that the velocity matrix is constructed on a 2mx2m grid, which will have an averaging effect in the velocity contouring of the 2D inversions). It is possible that a gradation occurs up dip where the top of the high velocity zone is higher up in the sequence, e.g. in BH 8, BH 1 and BH2, whereas the abrupt transition occurs down dip where the high velocity zone is deeper, e.g. in BH 4 and BH 5. The cross-diameter borehole combinations indicate a velocity structure that is consistent with the perimeter borehole combinations where the apparent dip is from BH 2 towards BH 6.
IAEG2006 Paper number 302
6
Depth Depth 0.80
1.00
1.20
1.40
1.60
1.80
2.00
2.20
2.40
2.60
2.80
3.00
3.20
3.40
3.60 0 1 2 3 4 5 6 7 8 9 10 11 12 13 14 15 16 17 18 19 20Depth
BH 8 ------------ BH 2 ------------ BH 4 ------------ BH 6 ------------ BH 8
1km/s Sonic Velocity - BH8 3.5km/s 1km/s Sonic Velocity - BH4 3.5km/s km/s
Figure 4. Consistency between downhole sonic log, cross-borehole tomographic logs and host geology.
Back-Filled Mineshaft on Site C The 2D inversion using horizontal rays indicated a general velocity-depth interval layer cake as a very low velocity
zone to approximately 2m with velocities below 1.5km/s (sub-water velocity), a low velocity zone from approximately 2m to approximately 12m with velocities below 2km/s, an intermediate velocity zone from approximately 12m to 18m with velocities between 2km/s and 2.5km/s that overlies a basal low to intermediate velocity beneath 18m. Table 3 details the velocity-depth intervals for each borehole combination. This velocity structure is consistent with the drillers’ logs from Pewfall Site C, Figure 5, where very low velocity zone to 2m can be interpreted generally as fill, the low velocity zone to 12m as till and possibly siltstone, and the intermediate velocity zone from 12m as grey sandstone, where the upper part of this zone could be in the siltstone. The dip of the siltstone and sandstone is low and towards boreholes 3 and 5. While the presence of the shaft cannot immediately be detected from observations using images of the 2D velocity structure between two boreholes its effect can be inferred by comparing the velocity structure between the perimeter borehole combinations T3-R1, T5-R3, T7-R1 and T7-R5 with the diagonal (shaft-cutting) borehole combinations T1-R5, T5-R1 and T7-R3. In Table 3, the presence of the shaft causes an approximate 10% reduction in the velocities at most depths on the diagonal borehole combinations, (i.e. straight ray path through the shaft) when compared to the velocities at the equivalent depths on the perimeter borehole combinations. This velocity-lowering effect can be seen to disrupt the intermediate velocity zone corresponding to the grey sandstone on images of the 2D velocity structure between the diagonal borehole combinations.
Table 3. Pewfall C: Horizontal layer cake velocity-depth intervals for borehole combinations.
Depth ( m )Panel 2m 4m 6m 8m 10m 12m 14m 16m 18mT1-R5 1.50 1.60 1.70 1.85 2.08 2.08 1.78T3-R1 1.12 1.58 1.94 1.96 1.98 2.18 2.25 2.10 1.95T5-R1 ? ? ? 1.65 1.75 1.88 2.06 2.04 1.88T5-R3 1.10 1.50 1.87 1.91 1.85 2.10 2.35 2.33 2.15T7-R1 1.10 1.52 1.84 1.87 1.95 2.17 2.35 2.35 2.25T7-R3 1.10 1.42 1.73 1.83 1.87 2.02 2.16 2.06 1.95T7-R5 1.13 1.58 1.93 1.85 1.93 2.31 2.36 2.33 2.10
General Velocity-Depth IntervalsVery Low / Loose Cover Low Interm ediate
Large velocity T1 = Transm itting borehole BH 1Contrast R3 = Receiving Borehole BH 3

IAEG2006 Paper number 302
7
BH1 BH3 BH5 BH7
B H 1 B H 3 B H 5 B H 7
F i l l 2 m
F i l l 2 m
F i l l 2 m
F i l l 2 m
T i l l 8 .7 m … … … … … S i l t s to n e 1 1 m … … … … … . G r e y S a n d s to n e D r i l le d to 2 2 .2 m (C o m p le te d d e p th = 2 0 .8 m )
T i l l 9 .5 m … … … … … . S i l ts to n e 1 4 .5 m … … … … ... G r e y S a n d s to n e D r i l le d to 2 2 .5 m . (C o m p le te d d e p th = 2 1 .6 m )
T i l l 1 1 .5 m … … … … ... S i l t s to n e 1 5 .5 m … … … … .. G r e y S a n d s to n e D r i l le d to 2 2 .7 m (C o m p le te d d e p th = 2 0 .8 5 m )
T i l l 9 .5 m … … … … … . S i l t s to n e 1 2 m … … … … … . G r e y S a n d s to n e D r i l l e d to 2 2 .8 m (C o m p le te d d e p th = 2 0 .5 5 m )
a. Drillers’ log for Pewfall C.
b. Velocity structure for Pewfall C, (scale bar in km/s).
km/s
Figure 5. Consistency between tomographic image and general geology of the host rock about site C.

IAEG2006 Paper number 302
8
4 Boreholes – 3D Inversions Boreholes BH2-BH4-BH6-BH8 Site B
Figure 6 shows horizontal and vertical slices of the velocity matrix produced by a 3D inversion using only boreholes 2, 4, 6 and 8. Three targets of consistently low velocity are clearly distinguished and disturb the velocity structure that was indicated in the 2D inversions. These low velocity targets are artefacts of the inversion where there is relatively low ray coverage, which in this case is in four approximately triangular shaped zones bounded by the perimeter and diagonal ray paths. (A fourth low velocity target just emerges in the other low ray coverage area between 8m-10m). These artefacts appear as low velocity pipe structures on the vertical slices in the X-Z and Y-Z planes that incorporate the shaft. The effect of these artefacts is sufficient to obscure the general velocity structure of the host formation and produces a very broken up appearance to the X-Z and Y-Z tomographic images.
BH2 BH4
BH8 BH6
BH2 BH4
BH8 BH6
Low velocity pipes
Depth Interval 12m – 14mDepth Interval 6m – 8m
Vertical Sections
a. Horizontal slices at different depth intervals (black dotted lines indicate approx. diagonal ray paths).
b. Vertical sections along the x-axis and y-axis respectively.
km/s
km/s
Figure 6. Slices through the 3D velocity matrix of site B using four (even numbered) boreholes.

IAEG2006 Paper number 302
9
Boreholes BH1-BH3-BH5-BH7 Site B Figure 7 shows horizontal and vertical slices of the velocity matrix produced by a 3D inversion using only
boreholes 1, 3, 5 and 7. The velocity structure begins to develop a consistency with the structure indicated with the 2D inversions. However, it is difficult to distinguish a clear feature that could be related to perturbations caused by an air-filled shaft. An overall velocity structure that is consistent with the structure developed from the 2D inversions is better developed in the vertical X-Z and Y-Z planes between the odd boreholes incorporating the shaft, but still has a broken up appearance, (Figure 7b). A central low velocity pipe-feature develops in the Y-Z plane between 8m-13m depth, but is not continuous and the image is terminated with low velocity artefacts between 18m-19m depth. This feature is absent in the X-Z plane, and again the low velocity artefacts are due to a focussing of inversion errors into cells with relatively low ray coverage.
Low velocity pipe?
Arte
fact
s
BH1
BH3
BH7
BH5
Vertical Sections
Depth Interval 12m – 14mDepth Interval 6m – 8ma. Horizontal slices at different depth intervals (black dotted lines indicate approx. diagonal ray paths).
b. Vertical sections along the x-axis and y-axis respectively.
km/s
km/s
Figure 7. Slices through the 3D velocity matrix of site B using four odd numbered boreholes. Boreholes BH1-BH3-BH5-BH7 Site C
The survey undertaken at Pewfall site B utilised a vertical spacing of 2m between successive transmitter depth-locations within the transmitting boreholes. Inversions based on combinations utilised from a total of four boreholes produced erroneous artefacts in the 3D velocity structure in zones where there was poor ray coverage. To partially improve ray coverage, the vertical spacing between successive transmitter depth-locations in the transmitting borehole was reduced to 1m for the survey at site C. This produces a velocity structure from the 3D inversion that appears to be far more consistent with the structure indicated by the 2D inversions, when compared with the case from site B, (see Figure 8). Note the onset of 2km/s velocities around the perimeter from around 12m depth onwards. The effect of the

IAEG2006 Paper number 302
10
shaft can be seen as a lower velocity central zone to the horizontal slices from 10m depth and deeper (dashed circle in Figure 8). The effect of the shaft can be seen on X-Z and Y-Z planes as higher velocity zones around the perimeter that are broken up by a central low velocity zone, Figure 8b.
38 36 34 32 30 28 26 24 22 0
2
4
6
8
10
12
14
16
18
20
22
Pewfall C x-axis (m)
Depth (m)Image section 4 range 34.0 to 36.0
0.80
1.00
1.20
1.40
1.60
1.80
2.00
2.20
2.40
2.60
2.80
3.00
3.20
3.40
3.60 44 42 40 38 36 34 32 30 28
Pewfall C y-axis (m)
Image section 4 range 28.0 to 30.0
0 .8 0
1 .0 0
1 .2 0
1 .4 0
1 .6 0
1 .8 0
2 .0 0
2 .2 0
2 .4 0
2 .6 0
2 .8 0
3 .0 0
3 .2 0
3 .4 0
3 .6 0
3 8 3 6 3 4 3 2 3 0 2 8 2 6 2 4 2 2P e w f a ll C x -a x is (m )
3 8 3 6 3 4 3 2 3 0 2 8 2 6 2 4 2 2 2 8
3 0
3 2
3 4
3 6
3 8
4 0
4 2
4 4
P e w f a ll C x -a x is (m )
P e w f a ll C y -a x i s (m )
0 .8 0
1 .0 0
1 .2 0
1 .4 0
1 .6 0
1 .8 0
2 .0 0
2 .2 0
2 .4 0
2 .6 0
2 .8 0
3 .0 0
3 .2 0
3 .4 0
3 .6 0
3 8 3 6 3 4 3 2 3 0 2 8 2 6 2 4 2 2 2 8
3 0
3 2
3 4
3 6
3 8
4 0
4 2
4 4
P e w f a ll C x -a x is (m ) 3 8 3 6 3 4 3 2 3 0 2 8 2 6 2 4 2 2
2 8
3 0
3 2
3 4
3 6
3 8
4 0
4 2
4 4
P e w f a ll C x -a x is (m )
P e w f a ll C y -a x is (m )
Depth Interval 10m – 12m Depth Interval 12m – 14m
Depth Interval 14m – 16m Depth Interval 16m – 18m
BH
1
BH3
BH7
BH
5
Vertical Sections
a. Horizontal slices at different depth intervals (black dotted lines indicate approx. diagonal ray paths).
b. Vertical sections along the x-axis and y-axis respectively.
km/s
km/s
km/s
Central low
velocityzone
Figure 8. Slices through the 3D velocity matrix of site C using four odd numbered boreholes.

IAEG2006 Paper number 302
11
The strong low velocity pipe-artefacts observed in the 3D inversion using combinations based on the four even numbered boreholes at Pewfall site B are not present in the inversions using the odd numbered boreholes in both sites B and C. A key cause of artefacts is often due to use of insufficient cell size in the inversion given the ray coverage through the volume under investigation. Ray coverage should be sufficiently large to provide reasonable average cell velocities within the volume imaged. As size is reduced less and less ray paths will pass through the cell to provide a reasonable value for average velocity. The use of small cell sizes in the inversion is limited when only a low number of boreholes are available. Improvements can be made in the field by increasing vertical resolution by reducing the vertical spacing between shots points, e.g 1m spacing for site C when compared to 2m spacing for site B). Using site C as an example Figure 9 shows the effect of changing the cell size on the inverted image, where artefacts are introduced as the cell sizes are reduced for a given ray coverage. The use of additional boreholes at Pewfall site C would have led to improved ray coverage, an improved velocity image and better detection of the mineshaft. However, where only a few boreholes are available, as could be the case in many commercial situations, larger cell sizes can be used to indicate low velocity anomalies associated with shafts for example under buildings where drilling is restricted.
38 36 34 32 30 28 26 24 22 28
30
32
34
36
38
40
42
44
Pewfall C - x-axis ( m )
y-axis (m)
Image section 15 range 14.0 to 15.0
0.80 1.00 1.20 1.40 1.60 1.80 2.00 2.20 2.40 2.60 2.80 3.00 3.20 3.40 3.60
40 38 36 34 32 30 28 26 24 22 20Pewfall C - x-axis ( m )
Image section 5 range 13.3 to 16.7
38 36 34 32 30 28 26 24 22Pewfall C x-axis (m)
Image section 8 range 14.0 to 16.0
km/sshaft shaft
Figure 9. Effect of cell size on the 3D velocity structure of Pewfall site C. (mineshaft shown as dashed circle).
8 Boreholes – 3D Inversions – Pewfall Site B Figure 10 shows a series of horizontal slices in the X-Y plane of the velocity matrix produced by a 3D inversion
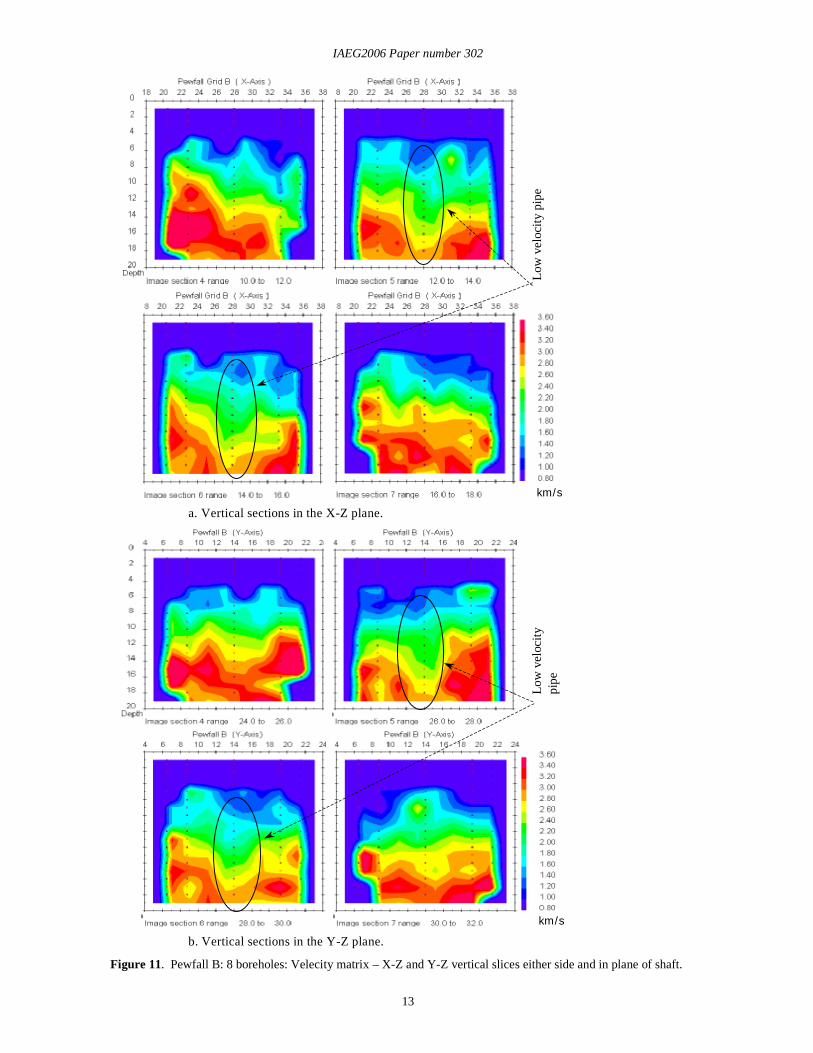
using all eight boreholes at Pewfall site B. The velocity structure is well developed and consistent with the structure indicated with the 2D inversions. The apparent dip direction is from BH1 and BH2 towards BH5 and BH6, which can be seen on velocity-depth intervals as higher velocities initially developing from the zone around BH1 and BH2. The development of a central low velocity zone is consistent from a depth of 10m and below. This low velocity zone appears as a pipe structure in the vertical X-Z and Y-Z slices that incorporate the shaft, (see figure 11). A consistent velocity structure is re-established either side of the low velocity pipe, where the X-Z planes indicate a dip towards an increasing x-ordinate and the Y-Z planes appear to be near the strike azimuth showing a thinning of the high velocity zone down dip with an increasing x-ordinate.
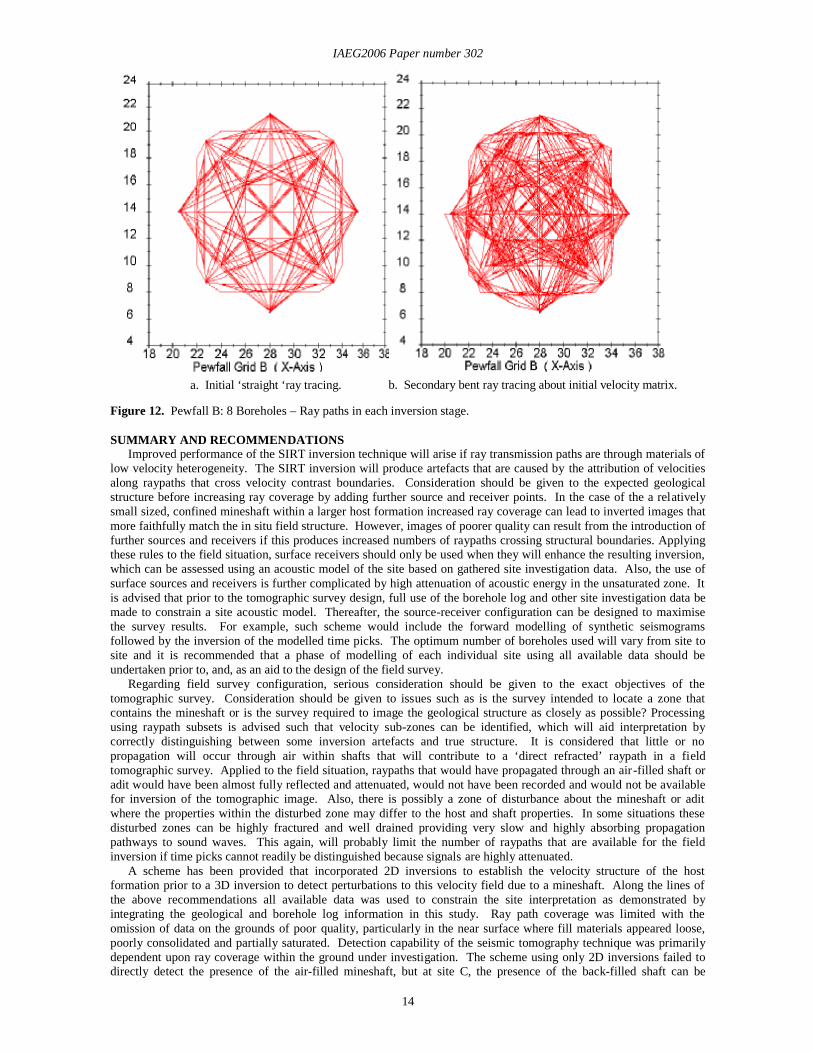
During the inversion process an initial velocity matrix was formed using the minimum travel time ray-tracing algorithm to generate straight ray paths, (see Figure 12a). (Some ray paths don’t appear straight because the algorithm traces rays between nodes along the edges of the cubic grid used in the inversion; this non-straightness increases with the coarseness of the grid). The initial velocity matrix was then formed and used as a basis to trace rays that bend due to refraction effects, (see Figure 12b). It is not likely that any wave that propagated through the shaft was recorded as a first arrival in the field survey. Thus, while the inversion procedure uses straight ray paths passing through the shaft to form the velocity matrix, the first arrival in the field situation would have comprised waves either diffracting around the shaft or refracting within a zone of disturbance about the shaft. Given no a priori knowledge of the shaft location at any site the inversion procedure must always begin with an initial velocity matrix formed from straight rays. Thereafter the rays can be bent and with sufficient ray coverage ray bending will approach the actual in situ velocity structure. 3D inversion using a four-borehole combination did not provide sufficient ray coverage and the velocity matrices were poorly developed. This contrasts with the 3D inversion using eight boreholes that provides far greater ray coverage about the mineshaft and allows the rays to be traced about the central low velocity zone. In comparison to the straight ray paths of Figure 12a, far more bent rays have been traced in the zone surrounding the shaft in Figure 12b. Increased ray coverage in this zone has improved the velocity matrix formed using eight boreholes and led to the detection of perturbations caused by the mineshaft when forming the second matrix.

IAEG2006 Paper number 302
12
BH2 BH4
BH8 BH6
BH1
BH3
BH5
BH7
km/s
Figure 10. Pewfall B: 8 Boreholes - Velocity matrix slices with depth.
IAEG2006 Paper number 302
13
km/s
Low
vel
ocity
pi
pe
km/s
Low
vel
ocity
pip
e
a. Vertical sections in the X-Z plane.
b. Vertical sections in the Y-Z plane.
Figure 11. Pewfall B: 8 boreholes: Velecity matrix – X-Z and Y-Z vertical slices either side and in plane of shaft.
IAEG2006 Paper number 302
14
a. Initial ‘straight ‘ray tracing. b. Secondary bent ray tracing about initial velocity matrix.
Figure 12. Pewfall B: 8 Boreholes – Ray paths in each inversion stage. SUMMARY AND RECOMMENDATIONS
Improved performance of the SIRT inversion technique will arise if ray transmission paths are through materials of low velocity heterogeneity. The SIRT inversion will produce artefacts that are caused by the attribution of velocities along raypaths that cross velocity contrast boundaries. Consideration should be given to the expected geological structure before increasing ray coverage by adding further source and receiver points. In the case of the a relatively small sized, confined mineshaft within a larger host formation increased ray coverage can lead to inverted images that more faithfully match the in situ field structure. However, images of poorer quality can result from the introduction of further sources and receivers if this produces increased numbers of raypaths crossing structural boundaries. Applying these rules to the field situation, surface receivers should only be used when they will enhance the resulting inversion, which can be assessed using an acoustic model of the site based on gathered site investigation data. Also, the use of surface sources and receivers is further complicated by high attenuation of acoustic energy in the unsaturated zone. It is advised that prior to the tomographic survey design, full use of the borehole log and other site investigation data be made to constrain a site acoustic model. Thereafter, the source-receiver configuration can be designed to maximise the survey results. For example, such scheme would include the forward modelling of synthetic seismograms followed by the inversion of the modelled time picks. The optimum number of boreholes used will vary from site to site and it is recommended that a phase of modelling of each individual site using all available data should be undertaken prior to, and, as an aid to the design of the field survey.
Regarding field survey configuration, serious consideration should be given to the exact objectives of the tomographic survey. Consideration should be given to issues such as is the survey intended to locate a zone that contains the mineshaft or is the survey required to image the geological structure as closely as possible? Processing using raypath subsets is advised such that velocity sub-zones can be identified, which will aid interpretation by correctly distinguishing between some inversion artefacts and true structure. It is considered that little or no propagation will occur through air within shafts that will contribute to a ‘direct refracted’ raypath in a field tomographic survey. Applied to the field situation, raypaths that would have propagated through an air -filled shaft or adit would have been almost fully reflected and attenuated, would not have been recorded and would not be available for inversion of the tomographic image. Also, there is possibly a zone of disturbance about the mineshaft or adit where the properties within the disturbed zone may differ to the host and shaft properties. In some situations these disturbed zones can be highly fractured and well drained providing very slow and highly absorbing propagation pathways to sound waves. This again, will probably limit the number of raypaths that are available for the field inversion if time picks cannot readily be distinguished because signals are highly attenuated.
A scheme has been provided that incorporated 2D inversions to establish the velocity structure of the host formation prior to a 3D inversion to detect perturbations to this velocity field due to a mineshaft. Along the lines of the above recommendations all available data was used to constrain the site interpretation as demonstrated by integrating the geological and borehole log information in this study. Ray path coverage was limited with the omission of data on the grounds of poor quality, particularly in the near surface where fill materials appeared loose, poorly consolidated and partially saturated. Detection capability of the seismic tomography technique was primarily dependent upon ray coverage within the ground under investigation. The scheme using only 2D inversions failed to directly detect the presence of the air-filled mineshaft, but at site C, the presence of the back-filled shaft can be

IAEG2006 Paper number 302
15
inferred from lower velocities in 2D velocity matrices produced from rays between boreholes that pass through the shaft compared to matrices produced from rays that pass through the host rock only.
3D inversion schemes using four boreholes in some configurations in site B failed to provide ray coverage to detect the perturbations in the velocity field caused by the air-filled mineshaft. The ray pattern in one case led to the production of low velocity artefacts on the velocity matrix in cells which had no ray paths through them. The resolution of the velocity images is directly affected by total ray coverage and the wavelength of the waves propagating within the volume of ground investigated. Improving ray coverage with different borehole combinations, increased borehole numbers, closer source separations and reducing the wavelengths improves the resolution of velocity images, and thus, effectiveness in indicating velocity anomalies caused by mineshafts. A central low velocity zone was developed by changing the ray-coverage using a different four-borehole configuration on site B. A central low velocity zone was also developed using a four-borehole configuration at site C about the back-filled mineshaft. The low velocity zone in site C was also more clearly distinguished by using an increased cell size (of 3m square instead of the standard 2m square). Using eight boreholes and a 2m square cell size in a 3D inversion scheme increased ray coverage around the air-filled mineshaft on site B was achieved. Its presence was detected via perturbations to the velocity field caused by the bending of rays about the shaft consistent with the processes of refraction and diffraction. This phenomenon cannot be modelled in pseudo-3D via stitching of multiple 2D images. This is because detection of the mineshaft requires vertical and lateral ray bending about the shaft, which cannot be achieved in 2D ray tracing. ACKNOWLEDGEMENTS This paper is published with the permission of the Executive Director of the British Geological Survey (NERC). The authors gratefully acknowledge the financial support of The Coal Authority (Contract Ref: CA 18/C1251). Finally, the authors thank Mr. Bob Heaton for provision of services during the site surveys.
REFERENCES
Beamish, D., 2004. Theoretical modelling studies of cross-borehole geophysical techniques applied to the investigation of former mine entries. British Geological Survey Internal Report CR/04/100. 61p.
Beamish, D., Chambers, J.E., Gunn, D.A., Wilinson, P.B, Binley, A., Ogilvy, R.D., Meldrum P.I., & Weller A.L., 2005. Cross-hole Tomographic Imaging of a Back-filled Mineshaft, Pewfall Colliery, Site C. A report for the Coal Authority, Contract CA18/C1251. British Geological Survey Commissioned Report CR/05/006.
J P Busby, D J R Morgan, D Beamish, R D Ogilvy, J Chambers, P Wilkinson, D Gunn, M G Raines, and J C Gofton, (2004a). Surface geophysical mapping of an abandoned mineshaft, Pewfall colliery, Site B. British Geological Survey Commissioned Report CR/04/119.
J P Busby, D J R Morgan, D Beamish, R D Ogilvy, J Chambers, P Wilkinson, D Gunn, M G Raines, and J C Gofton, (2004b). Surface geophysical mapping of an abandoned mineshaft, Pewfall colliery, Site C. British Geological Survey Commissioned Report CR/04/120.
Dyer, B. and M. H. Worthington 1988. Some sources of distortion in tomographic velocity images. Geophys. Prosp. 36 (3): 209-222.
Jackson, P. D. and D. M. McCann, 1997. Cross-hole seismic tomography for engineering site investigation, Modern Geophysics in Engineering Geology. D. M. McCann, Fenning, P.J., & Reeves, G.M., London, Geological Society Engineering Geology Special Publication, 12, 249-266.
P.D. Jackson, D.A. Gunn, R.C. Flint, D.M. McCann, M. Bent, D. Howes, Cross-hole seismic measurements for detection of disturbed ground beneath existing structures, NDT & E International 34 (2) (2001) pp. 155-162.
McCann, D.M., Baria, R., Jackson, P.D. & A.S.P. Green, 1986. Application of cross-hole seismic measurements in site investigation. Geophysics, 51, (4), pp 914-925.
Moser, T.J., (1991). Shortest path calculation of seismic rays. Geophysics, 56 (1), pp 59-67.
Paulsson, B.N.P., Cook, N.G.W & McEvilly, T.V., 1985. Elastic wave velocities and attenuation in an underground granitic repository for nuclear waste. Geophysics, 50, (4), 551-570.
Weilandt, E., (1987). On the validity of ray approximation for interpreting delay times. In: Nolet, G., Ed. Seismic tomography. Dordrecht, Holland: D. Reidel, 1987, 85 – 98.
Wilkinson, P.B., Gunn, D.A., Ogilvy, R.D., Binley, A. & Niessen, J., 2004. Cross-hole tomographic imaging of an air-filled mineshaft, Pewfall colliery, Site B. A report for the Coal Authority, contract CA18/C1251. British Geological Survey Commissioned Report CR/04/226.