IAEA Embry Riddle Aircraft Engine & Fleet Planning February 28 2013
32
Aircraft Engine & Fleet Planning Embry Riddle Executive Program Daytona Beach, FL - February 28, 2012 Dr. Hooman Rezaei IAEA Founder & President @IAEA1, : International Aircraft Engine Association www.turbineengine.org
Transcript of IAEA Embry Riddle Aircraft Engine & Fleet Planning February 28 2013

Aircraft Engine & Fleet Planning Embry Riddle Executive Program
Daytona Beach, FL - February 28, 2012
Dr. Hooman Rezaei
IAEA Founder & President
@IAEA1, : International Aircraft Engine Association
www.turbineengine.org
www.turbineengine.org 2
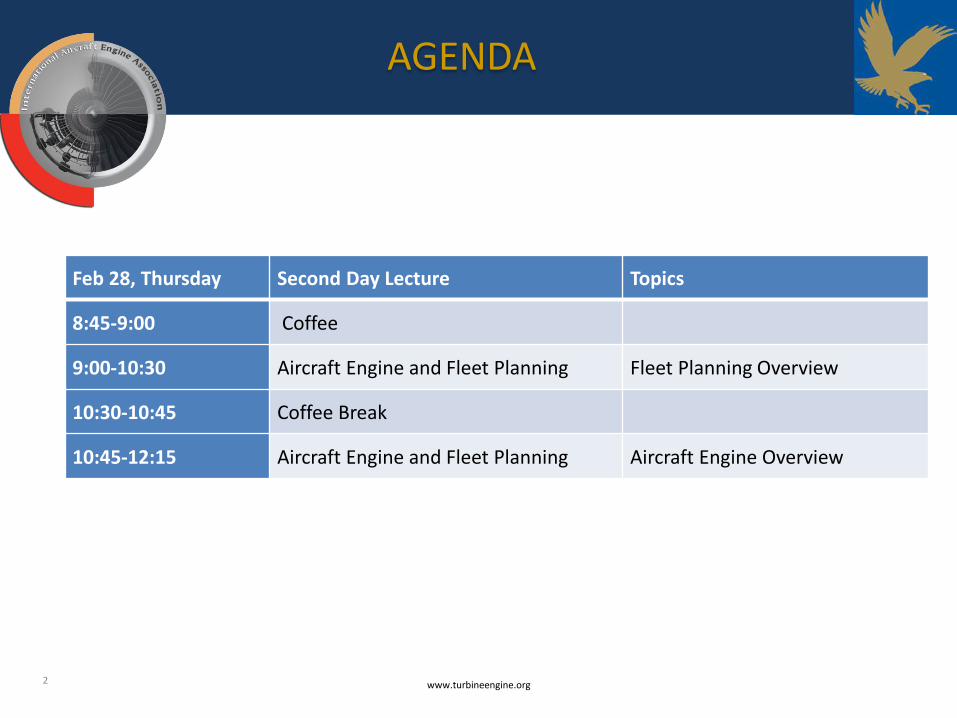
Feb 28, Thursday Second Day Lecture Topics
8:45-9:00 Coffee
9:00-10:30 Aircraft Engine and Fleet Planning Fleet Planning Overview
10:30-10:45 Coffee Break
10:45-12:15 Aircraft Engine and Fleet Planning Aircraft Engine Overview
AGENDA

www.turbineengine.org 4
Commercial Aviation Growing Steadily
A380
777
737
A320
EJet
2.7 3.5
7 8.3
3.5 10
38 42
40 42
8.7 9.2
Production rate (’12 ’14)
787
CRJ 2.5 2.5
Traffic growth (Trillion RPKs)
5.4%
CAGR
‘10 ’14F ’20F
Highest production ramp rates in 3 decades … inconsistent with demand growth
9.3%
CAGR
Boeing and Airbus are increasing rates to ~40 / month. That means: 40 x 2 (Airbus & Boeing) x 11.5 mth. / yr. = 920 / yr. or ~1,000 including the other new single aisles.1,000 x 5 years = 5,000 / 10 yrs. = 10,000 / 20 yrs. = 20,000 aircraft.

www.turbineengine.org 5
Narrowbody 60%
Narrowbody 57%
2012 20,840 Aircraft
2022 29,955 Aircraft
Regional 17%
Regional 19%
Widebody 23%
Widebody 24%
10 Year Projection
3.7% CAGR
Narrowbody Aircraft Models Maintain Majority
Source Data: TeamSAI

www.turbineengine.org 6
Lease vs. Own
Increasing Trend of Leasing – Forecast 50%+ by 2020
1970 3,722 Aircraft
17 Leased (.5%)
1980 6,037 Aircraft
100 Leased (1.7%)
1990 9,160 Aircraft 1,343 Leased
(14.7%)
2000 15,032 Aircraft 3,715 Leased
(24.7%)
2012 21,741 Aircraft 7,943 Leased
(36.5%)
Source: Boeing

www.turbineengine.org
7 Source Boeing.com
Global Point To Point
B777-200LR: 300 Passenger – 9400 NM – 19 Hour Flight

www.turbineengine.org
8 Source Airbus.com
Extensive Regional Coverage
A321: 185 Passenger – 3200 NM
www.turbineengine.org 9
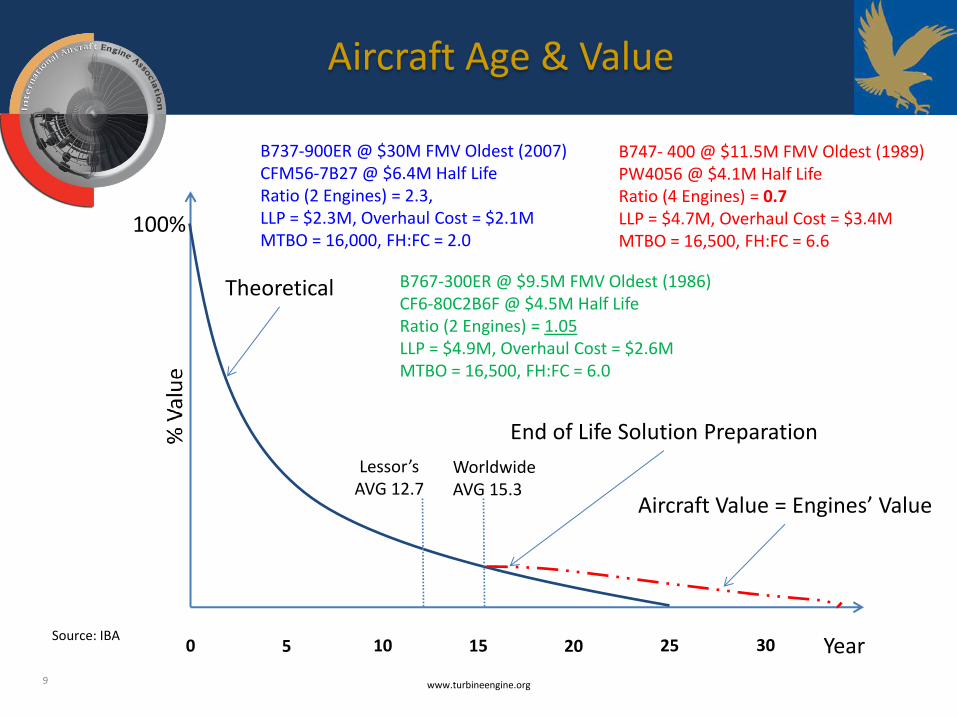
Aircraft Age & Value
5 10 15 20 25 30 Year
Lessor’s AVG 12.7
Worldwide AVG 15.3
0
100%
Theoretical
End of Life Solution Preparation
Aircraft Value = Engines’ Value
B737-900ER @ $30M FMV Oldest (2007) CFM56-7B27 @ $6.4M Half Life Ratio (2 Engines) = 2.3, LLP = $2.3M, Overhaul Cost = $2.1M MTBO = 16,000, FH:FC = 2.0
B747- 400 @ $11.5M FMV Oldest (1989) PW4056 @ $4.1M Half Life Ratio (4 Engines) = 0.7 LLP = $4.7M, Overhaul Cost = $3.4M MTBO = 16,500, FH:FC = 6.6
B767-300ER @ $9.5M FMV Oldest (1986) CF6-80C2B6F @ $4.5M Half Life Ratio (2 Engines) = 1.05 LLP = $4.9M, Overhaul Cost = $2.6M MTBO = 16,500, FH:FC = 6.0
Source: IBA
www.turbineengine.org 10
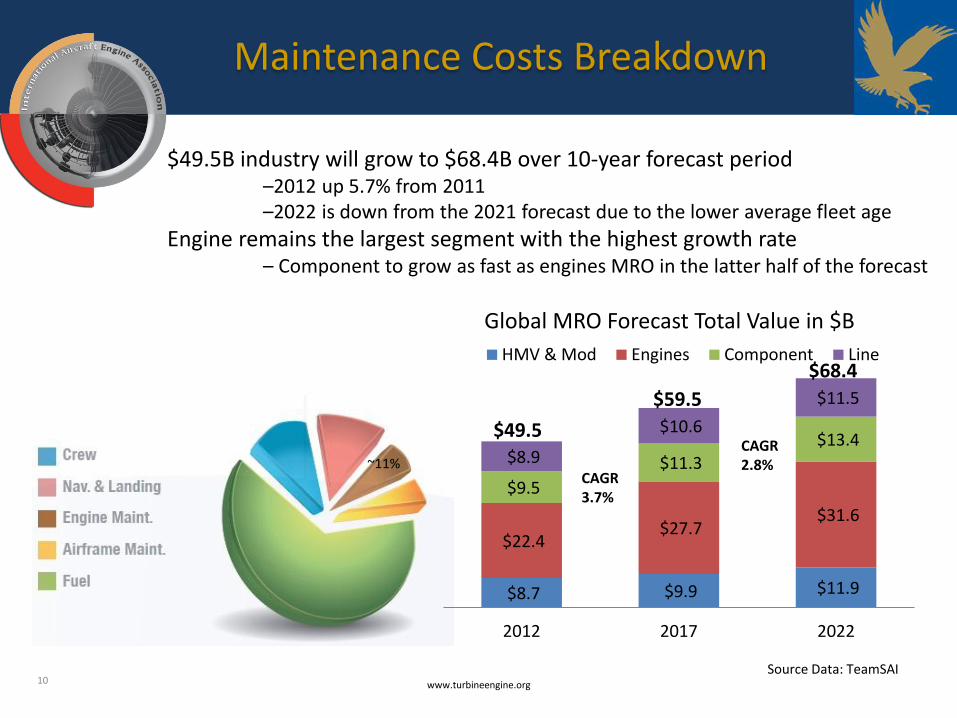
Maintenance Costs Breakdown
~11%
$8.7 $9.9 $11.9
$22.4 $27.7
$31.6
$9.5
$11.3 $13.4
$8.9
$10.6
$11.5
2012 2017 2022
HMV & Mod Engines Component Line
Global MRO Forecast Total Value in $B
CAGR 3.7%
CAGR 2.8%
$49.5B industry will grow to $68.4B over 10-year forecast period –2012 up 5.7% from 2011 –2022 is down from the 2021 forecast due to the lower average fleet age
Engine remains the largest segment with the highest growth rate – Component to grow as fast as engines MRO in the latter half of the forecast
Source Data: TeamSAI
$49.5
$59.5
$68.4

www.turbineengine.org 11
Fuel Cost Impact
Retiring Older Asset, Inducting Newer Fleet & Technologies
0
20
40
60
80
100
120
0
5
10
15
20
25
30
352
00
3
20
04
20
05
20
06
20
07
20
08
20
09
20
10
20
11
20
12
20
13
% O
per
atin
g C
ost
Source: IATA Economics

www.turbineengine.org 12
Multidisciplinary Function
CEO’s STRATEGIC VISION
FINANCE
ENGINEERING
OPERATIONS
STRATEGIC PLANNING
FLEET PLANNING AIRCRAFT
ACQUISITION

www.turbineengine.org 13
Aircraft Engine Industry

World Regions
Africa 2,045 4%
Asia Pacific 6,634 15%
China 3,599 8%
Eastern Europe 2,115 5%
India 770 2%
South America 2,965 7%
Middle East 2,456 5%
North America 14,951 33%
Western Europe 9,728 21%
Total (2012) 45,263
Total (2022) 62,544 +38%
OEMs 2012 2022
CFMI 16,658 26,951
GE Aviation 9,860 13,085
Rolls Royce 6,134 7,775
Pratt & Whitney 7,441 7,638
IAE 4,118 5,405
EA = GE + P&W 120 824
Power Jet 8 592
Honeywell 924 276
ACAE - TBD
CFMI Fleet Largest Share of 37% , +15
RR’s Fleet Overtake P&W’s Fleet by 2022
Source Fleet Data: Ascend
An Industry With 150,000+ Professionals
www.turbineengine.org 14
Commercial Engine Industry Overview

www.turbineengine.org 15
Fuel Consumption #1 Cost
SFC: The weight flow rate of fuel required to produce a unit of power or thrust

Fan Size Trend
FAN DIA , Nacelle DIA , Engine Weight , Landing Gear FOD , Transportation Cost , Maintenance Cost
www.turbineengine.org 16

Geared Fan Performance
www.turbineengine.org 17
Fan Diameter High Bypass Ratio Low Bypass Ratio
High
Low
Noise
Fuel Burn
Geared
Direct Drive
Direct Drive: Larger Fan → Lager LPT → Heavier Engine Geared: Larger Fan → Smaller LPT → Lighter Engine

Gearbox on LEAP’s Architecture? Open Rotor?
www.turbineengine.org 18
Fan Drive System

www.turbineengine.org 19
Airline Shop OEM Shop Independent
LHT 5A/5B/5C/7
Snecma all models
GA Telesis 5B/5C
SR Technics
5B/5C/7
TAP 3/5B/5C
Iberia 5A/5B/5C
GE Strothers all models
Air France/KLM 3/5A/5B/5C/7
China Airlines
5B/5C/7
GE Wales all models
NEC 3/5B/7
MTU Zhuhai
3/5B/7
Alitalia 5B
Kelly 5A/5B/5C
GE Celma 3/5A/5B/5C
AeroThrust 3/7
American 7
CEES 3
Delta Tech Ops
3/7
GE Malaysia
3
GMF 3
IAI 3/7
IHI 3/5A
LTAI 3/7
MTU Hannover
3/7
JTS 3
Snecma Morocco
3/7
Snecma Sichuan
5B/7
STA 3/7
TEC 3/5C/7
Timco 3
United 3
Ameco 3
Snecma Brussels
3
ANA 5A
PIA 3
GE Varig 3
Avio 3
Olympic 5C
KAL 7
JAT 3
SAMES 3/7
MTU Vancouver 3
7000+ GTF and LEAP Sold – Non Available For 3rd Party
PBH Coverage – Source TEAMSAI CFMI: ~35% Installed Trent: ~90% Installed V2500: ~43% Installed V2500: ~ 80% Future Deliveries
PW/China Eastern 3/5B/7
X
Standard Aero 7
Kelly 3/7
JALCO 3
$22B+ Global MRO Market → OEMRO

Success Story: GE90 Implementation Result: Fundamentally Different Fleet Management
www.turbineengine.org 20
Operation: Fan-Propulsor Architecture

Engineering: Modular Management
Challenge: Tracking time/cycles/config on each module
www.turbineengine.org 21

www.turbineengine.org 22
High T4 & Fan DIA CMC & TiAl

www.turbineengine.org 23
Engine Fleet Management Goals
1. Optimize Engine Maintenance Cost (MC)
2. Improve Engine Fleet Reliability
3. Decrease Aircraft Indirect Operating Cost (AC IOC)
4. Decrease Fleet Fuel Consumption

www.turbineengine.org 24
Operator’s Mission
• Help achieve the EFM goals, the operator’s mission is to:
a) Improve the engine reliability
b) Decrease the engine operating and repair costs
• To increase the engine reliability, it is required to:
a) Increase the level of engine performance
b) Decrease the number of delays & cancellations (D&C)
c) Decrease the number of operational events
• Decrease the engine operating and repair costs, it is required to decrease the:
a) Shop visit rate (SVR)
b) Shop visit cost (SVC)
c) Line & base maintenance cost
d) Number of operational discrepancies (OD)
• In-flight shutdown (IFSD)
• Aircraft turn back (ATB)
• Aborted takeoff (ATO)
• Flight diverted (FLT-DIV)

www.turbineengine.org 25
Engine Related Variable Cost Drivers
Maintenance Cost per Engine Flight Hour (MC/EFH)
• 4% of total operating cost
• Equation: MC/EFH = SVR X SVC + L&B Cost
– SVR = Shop Visit Rate
• 43% of all engine shop visits are planned
• 57% of all engine shop visits are unplanned, which is used as one measurement of engine reliability
– SVC = Shop Visit Cost
• Includes partial and full engine refurbishment.
• Costs vary from $ 0.5 to 1.5 million.
• Varies with engine type and workscope plan
– L&B Cost = Cost to perform on-wing maintenance.
Aircraft Indirect Operating Cost (AC IOC)
• 10% of total operating cost (1% of total from the engines)
• Equation: AC IOC = OD + D&C + OTHER
– OD: Operational Discrepancies, each one costs approximately $150,000
• IFSD: Event requires the engine to be shutdown
• ATB: Event requiring aircraft return to the airport after takeoff
• ATO: Event stopping takeoff before aircraft lifts off the runway
• FLT-DIV: Event re-routing the aircraft to a different location from its destination
- D&C = Delays and cancellations
• Events are classified under schedule interruptions (SI)
• Delay is considered if it lasts over 15 minutes.
- OTHER = Discrepancies
• There are other discrepancies; however, they have minor impacts on the AC IOC and engine reliability.
Fuel Cost (FC)
• 11% of total operating cost
• Equation: FC = AIRCRAFT + ENGINE
– Aircraft rigging and trimming (performance retention)
– Aircraft operations (optimum flight path)
– Engine deterioration
– Engine route structure (cycle to hour ratios)

www.turbineengine.org 26
Engine Related Variable Cost Drivers
AC IOC (10%)
= + + OD D&C OTHER
PARTIAL/FULL REFURBISHMENT ($ 0.5 – 5.0 MILLION)
$25,000
AIRCRAFT RELATED
IFSD ($150,000)
OTHER
FUEL (11%)
= AIRCRAFT + ENGINE
DETERIORATION
ROUTE STRUCTURE
PERFORMANCE
OPERATIONS
PLANNED (43%)
UNPLANNED (57%)
MC/EFH
(4%)
= SVR SVC x + L&B MAINT COST
< 6% OF TOTAL MC

www.turbineengine.org 27
Engine Shop Visit Rate Impact
0.1024
0.00
0.02
0.04
0.06
0.08
0.10
0.12
0 5 10 15 20 25 30 35 40 45
NUMBER OF MONTHS
BA
SIC
SH
OP
VIS
ITS
PE
R 1
,000 H
OU
RS TARGET LEVEL 0.0973 5%
.1024
1000 x $1,200,000 = $123
= .0973
1000 x $1,200,000 = $117
MC
FLEET YEAR = = 6 x 40 x 4,000 = $960,000
x SVC = MC
EFH =
SVR
1000
EFH = $6
DMC
x # ENG. x HOURS
YEAR EFH
DMC

www.turbineengine.org 28
Shop Visit Impact on Engine MC
SVR x SVC = MC x EFH/YR MC/YR
SVR PER
1,000 HRS
AVERAGE COST PER
SV ($)
MC/ EFH
($/HR) X = X
EFH/YR (HRS)
MC/ENG PER YR
($)
SV TOTAL
100% SV 0.1024 $1,200,000 $ 122.90 4,000 $ 491,520
SV OIL SYSTEM
5.0 % SV
0.0051 $1,200,000 $ 6.14 4,000 $ 24,576
SV IMPACT
ON MC/ENG

www.turbineengine.org 29
Operational Discrepancy IOC Impact
0.0052
0.000
0.002
0.004
0.006
0.008
0.010
0.012
0.014
0.016
0 5 10 15 20 25 30 35 40 45
NUMBER OF MONTHS
OP
ERA
TIO
NA
L D
ISC
REP
AN
CY
(x1
,00
0 H
OU
RS)
x # OD’s
YEAR =
0.0045
1,000 4,000 = 0.018
# OD’s
EFH x
EFH
YEAR =
OD PROBABILITY COST
YEAR = = 0.018 x $150,000 = $2,700
# OD’s
YEAR OD
OD COST x
RISK COST PER ENGINE PER YEAR
( # OD’s per EFH ) * ( OD COST ) = ( 0.0045 / 1,000 ) * ( $150,000 ) = $ 0.68 / EFH
TARGET LEVEL 13% 0.0045

www.turbineengine.org 30
Majority Future Fleet Lessors Owned
Fuel Consumption, Noise, Emission and $/Flight Hour
EIS Part Out $Z
TSN = 0 Hr TSN = X Hr
SV1 $Y1
SV2 $Y2
SV3 $Y3
$/Flight Hour =$𝑌1+$𝑌2+$𝑌3
𝑋
Fleet Planning & Cost of Ownership

Dr. Hooman Rezaei has more than 15 years of experience in Aviation industry and is currently Managing Director at Oasis Aviation Consulting providing total aircraft engine management services globally. Prior to Oasis Aviation Consulting, he worked in positions spanning from military advanced R&D to global sales of aftermarket services at Pratt & Whitney. He led major Power-By-Hour aircraft engine maintenance services P&Ls, developed $1bn+ CFM56 MRO sales plan and closed a major PBH services contract in the Middle East region. Hooman is the founder of the International Aircraft Engine Association with more than 7400 members globally integrating the aircraft engine industry on a global ecommerce platform. Through IAEA, he has developed and offers a front to back engineering and business review executive program on aircraft engines. Hooman has completed his Ph.D. in Turbomachinery at Michigan State University and is an author of several technical papers in this field. He holds a MS Degree in Management with Finance Concentration from Rensselaer Polytechnic Institute. Contact: P.O. Box 4405 Irvine, CA 92616, USA Mobile: +1 (860) 992-2452 Email: [email protected]
www.turbineengine.org 31
About Instructor

THANK YOU!
International Aircraft Engine Association P.O. Box 4405 Irvine, CA 92616 USA Email: [email protected] Telephone: +1 (310) 266-5514 @IAEA1 International Aircraft Engine Association
www.turbineengine.org 32