IAB Report 1H 2010 Final
25
www.pwc.com www.iab.net IAB Internet Ad v ertisin g R evenue Report An Industry Survey Conducted by PwC and Sponsored by the Interactive Advertis ing Bureau (IAB) 2010 First Half-Year Results
-
Upload
techcrunch -
Category
Documents
-
view
222 -
download
0
Transcript of IAB Report 1H 2010 Final

8/8/2019 IAB Report 1H 2010 Final
http://slidepdf.com/reader/full/iab-report-1h-2010-final 1/25
www.pwc.comwww.iab.net
I A B I n t e r n e t A d v e r t is in g R e v e n u e R e p o r t An Industry Survey Conducted by PwCand Sponsored by the Interactive Advertising Bureau (IAB)
2010 First Half-Year Results
8/8/2019 IAB Report 1H 2010 Final
http://slidepdf.com/reader/full/iab-report-1h-2010-final 2/25
Background 3
Executive Summary 4
Detailed Findings 5
• 2010 Secon Quarter an First-Ha Year Resu ts
• Annual and Quarterly Trends
• Industry Concentration
• vert s ng ormats
• Industry Category Spending
• Pricing Models
• Definitions
• Survey Scope and Methodology
• Organization Profiles
PwC 2

8/8/2019 IAB Report 1H 2010 Final
http://slidepdf.com/reader/full/iab-report-1h-2010-final 3/25
About the IAB Internet Adver tising Revenu eReportConducted by PwC on an ongoing basis, with results released quarterly, the
“ ” Advertising Bureau (IAB) in 1996. This report utilizes data and informationreported directly to PwC, publicly available online corporate data andinformation provided by online ad selling companies.
The results reported are considered the most accurate measurement of n erne on ne a ver s ng revenues ecause e a a s comp e rec y
from information supplied by companies selling advertising online. All-inclusive, the report includes data reflecting online advertising revenuesfrom Web sites, commercial online services, ad networks and emailproviders, as well as other companies selling online advertising.
The report is conducted independently by PwC on behalf of the IAB. PwCdoes not audit the information and provides no opinion or other form of assurance with respect to the information. Only aggregate results arepublished and individual company information is held in strict confidence with PwC. Further details regarding scope and methodology are provided in
e appen x o s repor .
David SilvermanPwC
PwC 3
8/8/2019 IAB Report 1H 2010 Final
http://slidepdf.com/reader/full/iab-report-1h-2010-final 4/25
IAB Interne t Advertising Revenu e Repor t2010 Second-Quarter and First Six-Mon thsHighlights
“ ”n erne a ver s ng revenues revenues n e n e a es o a e . on or e rs s xmonths of 2010, with Q2 2010 accounting for approximately $6.2 billion. Internet advertisingrevenues for the first six months of 2010 increased 11.3 percent from the same period in 2009.
Key trends underlying 2010 year-to-date results
• Revenues Incr eased 11.3% in the first half o f 2010 — Internet advertising revenue in the. . tota e .2 on n t e secon quarter o 2010, an ncrease o 4.1 percent rom t e 2010
first quarter total of $5.9 billion, and an increase of 13.9 percent from the 2009 second-quartertotal of $5.4 billion. Year-to-date Internet advertising revenues through June 2010 totaled $12.1 billion, up 11.3 percent from the $10.9 billion reported for the same six-month period in 2009.
“With the strongest first half on record, 2010 has so far indicated that Internet advertising is back,and better than ever. While the recession clearly affected short term growth in 2009, with double
,continue to be strong.”
- David Silverman, Partner, PwC
• Search Continues to Lead, followed by Display Banners and Classifieds— Searchrevenue accounted for 47 percent of year to date revenues, flat over the 47 percent reported in the
. , , ,followed by Classifieds (10 percent), and Lead Generation (5 percent) of 2010 year to daterevenues.
“Consumers’ appetite for immersive online experiences is limitless as technological innovationand creativity give rise to new forms of entertainment and information in the digital age. Thisreport highlights marketers’ ongoing adoption of interactive media to build brands—and that’sonl oin to continue.”
PwC
- Randall Rothenberg, President and CEO, IAB
4
8/8/2019 IAB Report 1H 2010 Final
http://slidepdf.com/reader/full/iab-report-1h-2010-final 5/25
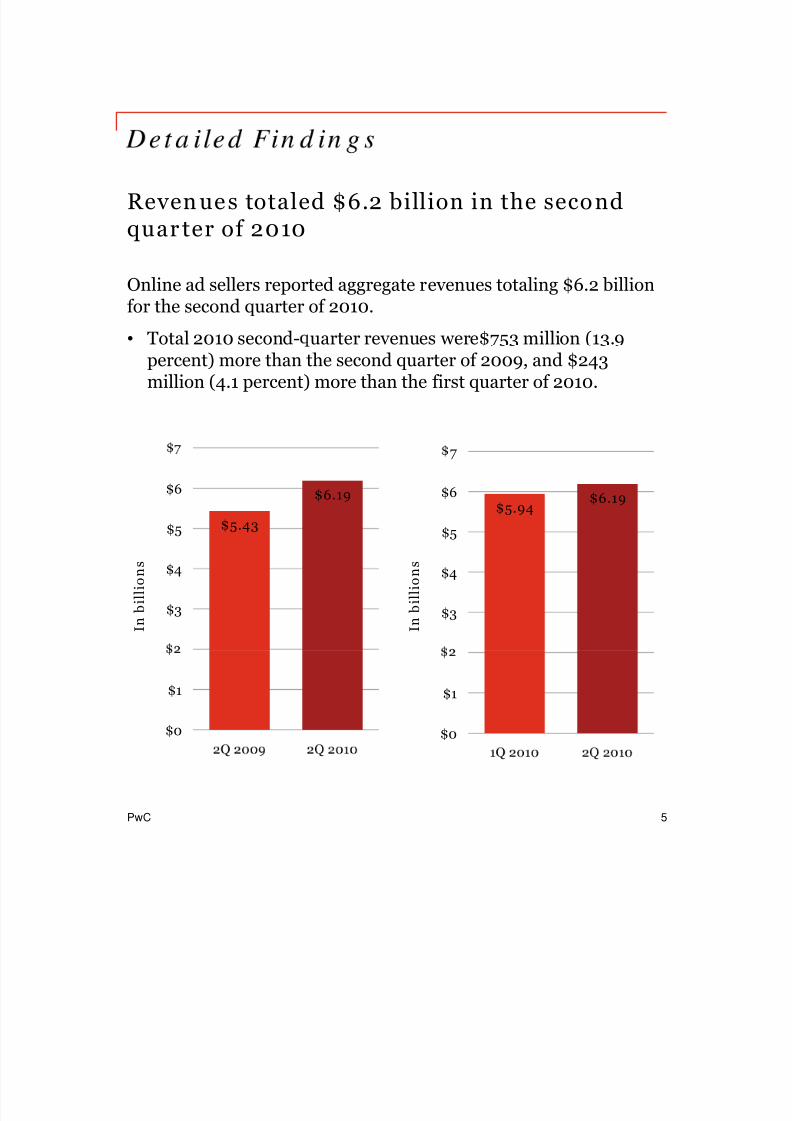
Reven ues totaled $6.2 billion in the secondquar ter of 2010
Online ad sellers reported aggregate revenues totaling $6.2 billionfor the second quarter of 2010.
• Total 2010 second- uarter revenues were$753 million (13.9percent) more than the second quarter of 2009, and $243million (4.1 percent) more than the first quarter of 2010.
$5.43
$6.19
$5
$6$5.94
$6.19
$5
$6
7
$3
$4
I n b i l l i o n s
$3
$4
I n b i l l i o n s
$0
$1
$0
$1
PwC 5
8/8/2019 IAB Report 1H 2010 Final
http://slidepdf.com/reader/full/iab-report-1h-2010-final 6/25
-
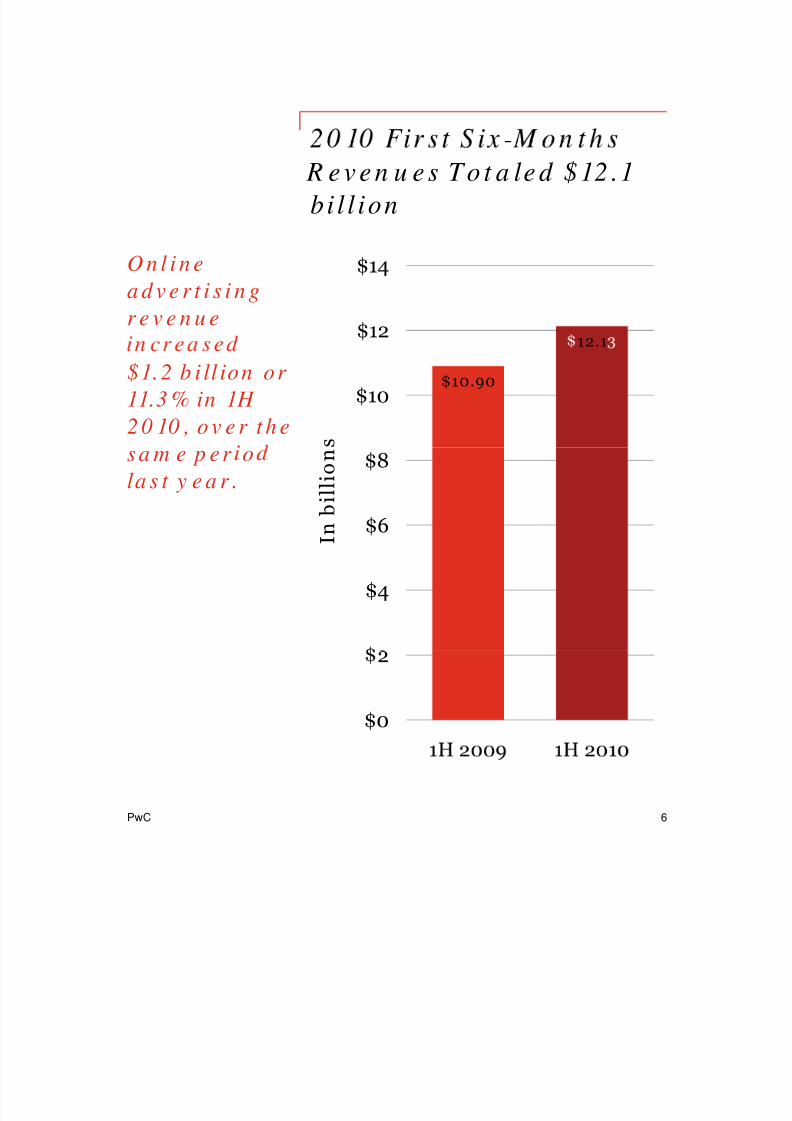
R e v e n u e s To t a le d $ 12 .1bi l l ion
O n l i n ea d v e r t i s i n gr e v e n u e
12.1$12
$14
$1.2 b i ll ion o r 11.3 % in 1H 2 0 10 , o v e r t h e
$10.90$10
ss a m e p er ola s t y e a r .
$6
$8
I n b i l l i o n
$4
$0
2
PwC 6

8/8/2019 IAB Report 1H 2010 Final
http://slidepdf.com/reader/full/iab-report-1h-2010-final 7/25
-
T r e n d s
Second-quarter revenues shows signs of improvement, recoveringfrom a weak 2Q 2009 with a record $6.19 billion in revenues .
Second-Quar ter Revenue, 2000–2010
$5.09$5.75 $5.43
$6.19
$5
$6
7
$2.0$2.37
$2.99
$4.06
$2
$3
$4
I n b i l l i o n s
1.85$1.46
$1.66
$0
$1
2Q 2Q 2Q 2Q 2Q 2Q 2Q 2Q 2Q 2Q 2Q
PwC 7
8/8/2019 IAB Report 1H 2010 Final
http://slidepdf.com/reader/full/iab-report-1h-2010-final 8/25
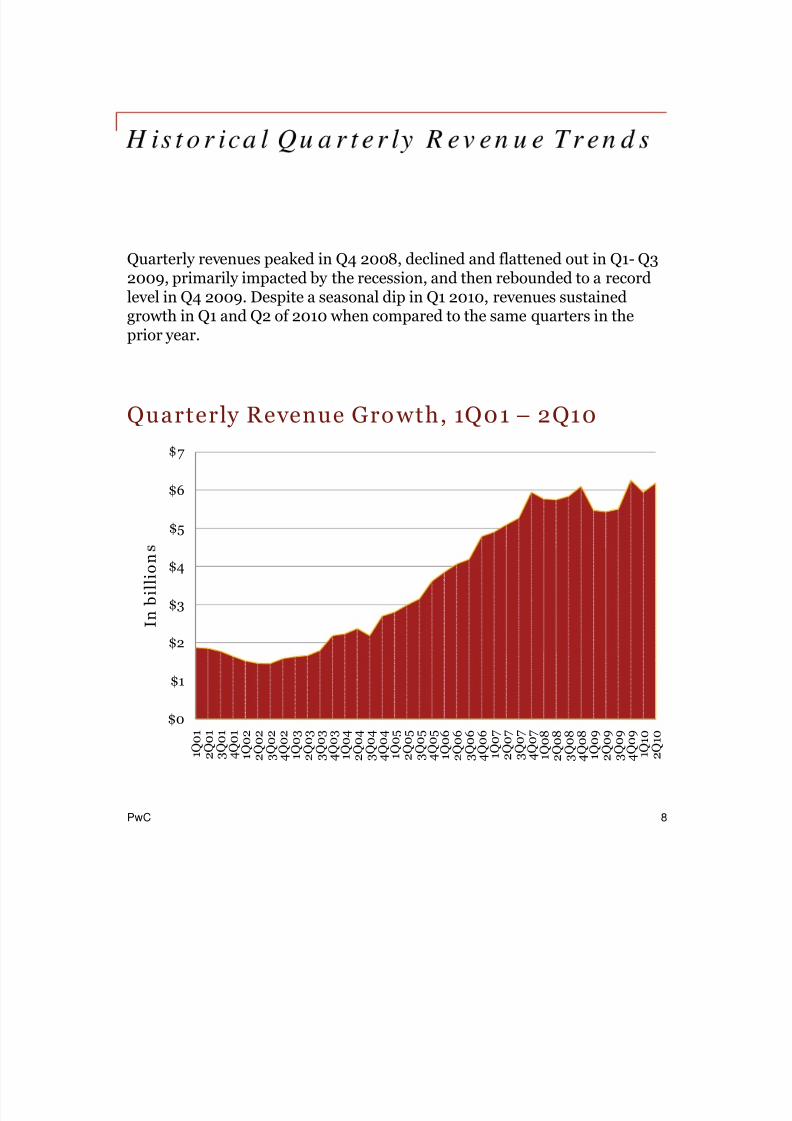
Quarterly revenues peaked in Q4 2008, declined and flattened out in Q1- Q32009, primarily impacted by the recession, and then rebounded to a recordlevel in Q4 2009. Despite a seasonal dip in Q1 2010, revenues sustainedgrowth in Q1 and Q2 of 2010 when compared to the same quarters in theprior year.
Quarterly Revenue Gro wth, 1Q01 – 2Q10
$5
$6
7
$2
$3
$4
I n b i l l i o n
$0
$1
Q 0 1
Q 0 1
Q 0 1
Q 0 1
Q 0 2
Q 0 2
Q 0 2
Q 0 2
Q 0 3
Q 0 3
Q 0 3
Q 0 3
Q 0 4
Q 0 4
Q 0 4
Q 0 4
Q 0 5
Q 0 5
Q 0 5
Q 0 5
Q 0 6
Q 0 6
Q 0 6
Q 0 6
Q 0 7
Q 0 7
Q 0 7
Q 0 7
Q 0 8
Q 0 8
Q 0 8
Q 0 8
Q 0 9
Q 0 9
Q 0 9
Q 0 9
Q 1 0
Q 1 0
PwC 8
2 3 1 2 3 4 1 2 3 4 1 2 3 4 1 2 3 4 1 2 3 4 1 2 3 4 1 2 3 4 1 2 3 4 2
8/8/2019 IAB Report 1H 2010 Final
http://slidepdf.com/reader/full/iab-report-1h-2010-final 9/25
First ha lf vs. Second half
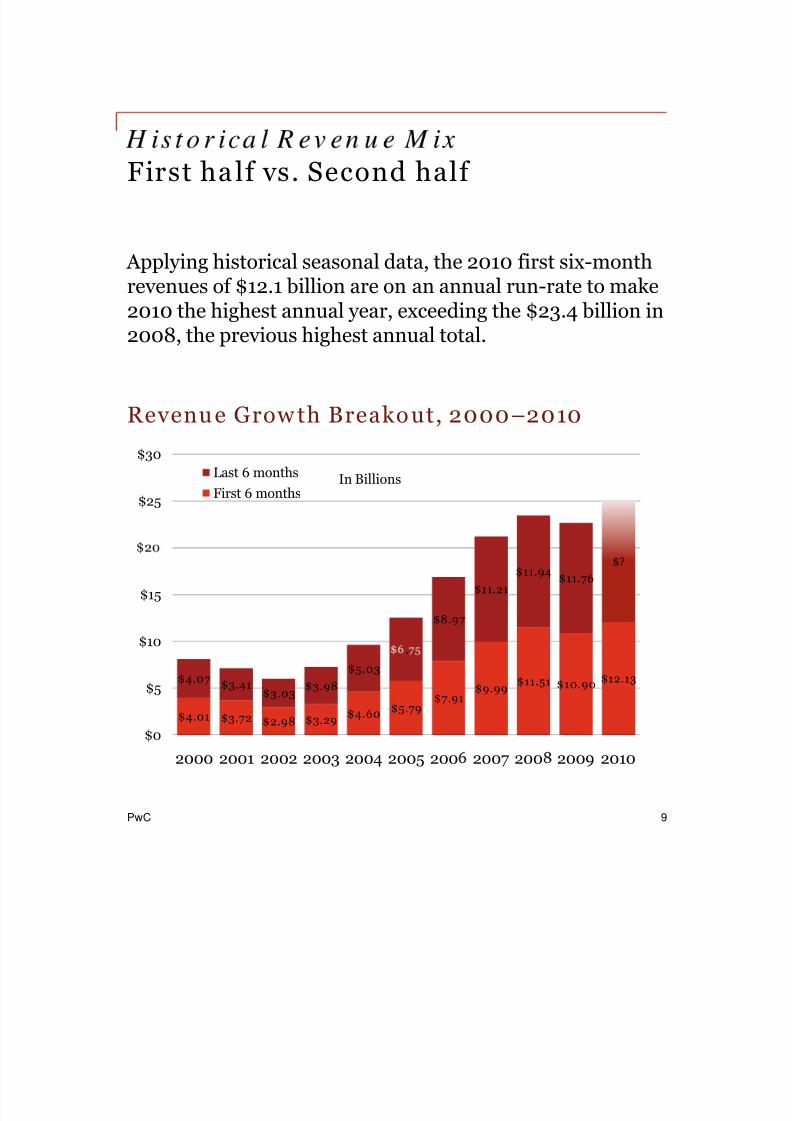
Applying historical seasonal data, the 2010 first six-monthrevenues of $12.1 billion are on an annual run-rate to make2010 the highest annual year, exceeding the $23.4 billion in
2008, the previous highest annual total.
Revenue Grow th Breakout, 2000–2010
$25
$30
In BillionsLast 6 monthsFirst 6 months
$8.97
$11.21$11.94 $11.76
$?
$10
$15
$4.01 $3.72 $2.98 $3.29 $4.60 $5.79$7.91 $9.99
$11.51 $10.90 $12.13$4.07 $3.41$3.03 $3.98
$5.03
.
$0
$5
PwC 9
2000 2001 2002 2003 2004 2005 200 2007 200 2009 2010
8/8/2019 IAB Report 1H 2010 Final
http://slidepdf.com/reader/full/iab-report-1h-2010-final 10/25
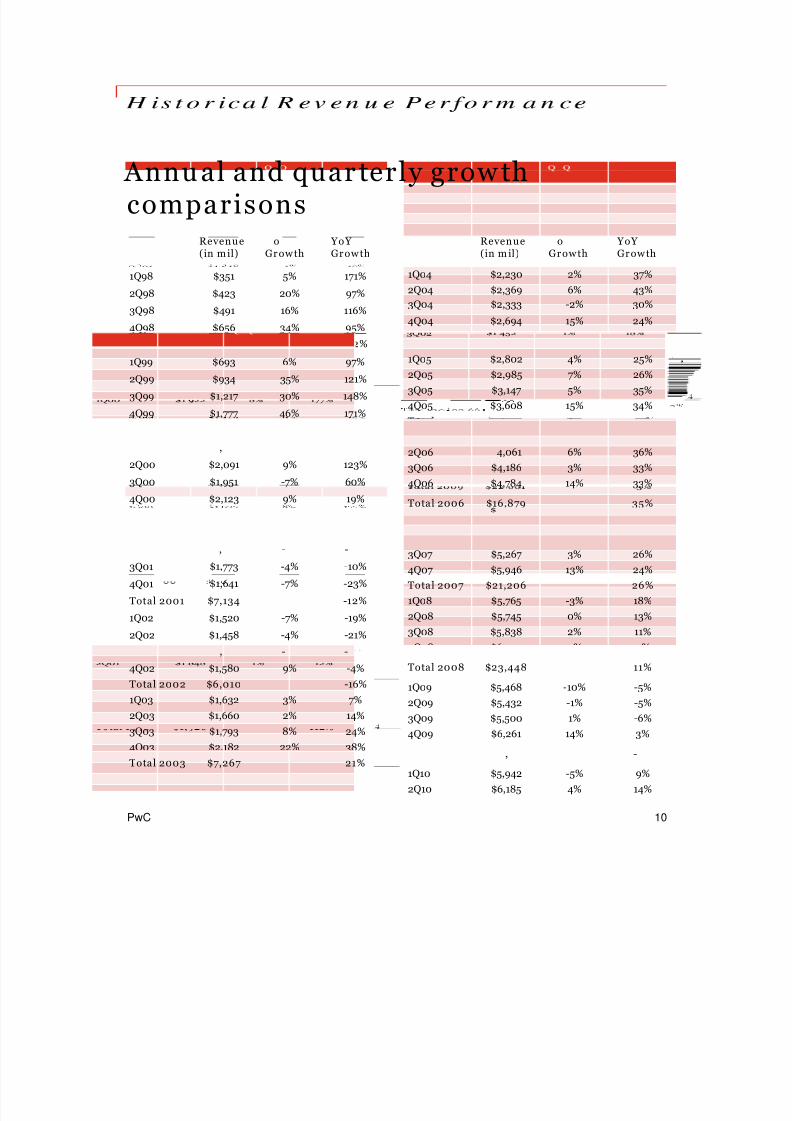
Annu al and quar terly grow thcomparisons
Revenue o YoY Revenue o YoY (in m il) Growth Growth
1Q04 $2,230 2% 37%2Q04 $2,369 6% 43%3Q04 $2,333 -2% 30%
4Q04 $2,694 15% 24%
Total 2004 $9,626 33%
(in mil) Growth Growth
1Q98 $351 5% 171%
2Q98 $423 20% 97%
3Q98 $491 16% 116%
4Q98 $656 34% 95%
Total 1 8 1 20 112%1Q05 $2,802 4% 25%2Q05 $2,985 7% 26%3Q05 $3,147 5% 35%4Q05 $3,608 15% 34%Total 2005 $12,542 30%1Q06 $3,848 7% 37%
1Q99 $693 6% 97%
2Q99 $934 35% 121%
3Q99 $1,217 30% 148%
4Q99 $1,777 46% 171%
Total 1999 $4,621 141%
2Q06 4,061 6% 36%3Q06 $4,186 3% 33%4Q06 $4,784 14% 33%
Total 2006 $16,879 35%
1Q07 $4,899 2% 27%2Q07 $5,094 4% 25%
,
2Q00 $2,091 9% 123%
3Q00 $1,951 -7% 60%
4Q00 $2,123 9% 19%
Total 2000 $8,087 75%1Q01 $1,872 -12% -3%
- - 3Q07 $5,267 3% 26%4Q07 $5,946 13% 24%Total 2007 $21,206 26%1Q08 $5,765 -3% 18%2Q08 $5,745 0% 13%3Q08 $5,838 2% 11%
Q08 $6 100 % 2%
, - -
3Q01 $1,773 -4% -10%
4Q01 $1,641 -7% -23%
Total 2001 $7,134 -12%
1Q02 $1,520 -7% -19%
2Q02 $1,458 -4% -21%
- -Total 2008 $23,448 11%
1Q09 $5,468 -10% -5%2Q09 $5,432 -1% -5%3Q09 $5,500 1% -6%4Q09 $6,261 14% 3%
, - -
4Q02 $1,580 9% -4%Total 2002 $6,010 -16%1Q03 $1,632 3% 7%2Q03 $1,660 2% 14%3Q03 $1,793 8% 24%4Q03 $2,182 22% 38%
PwC
, -
1Q10 $5,942 -5% 9%2Q10 $6,185 4% 14%
10
Total 2003 $7,267 21%
8/8/2019 IAB Report 1H 2010 Final
http://slidepdf.com/reader/full/iab-report-1h-2010-final 11/25
R em a in s H ig h
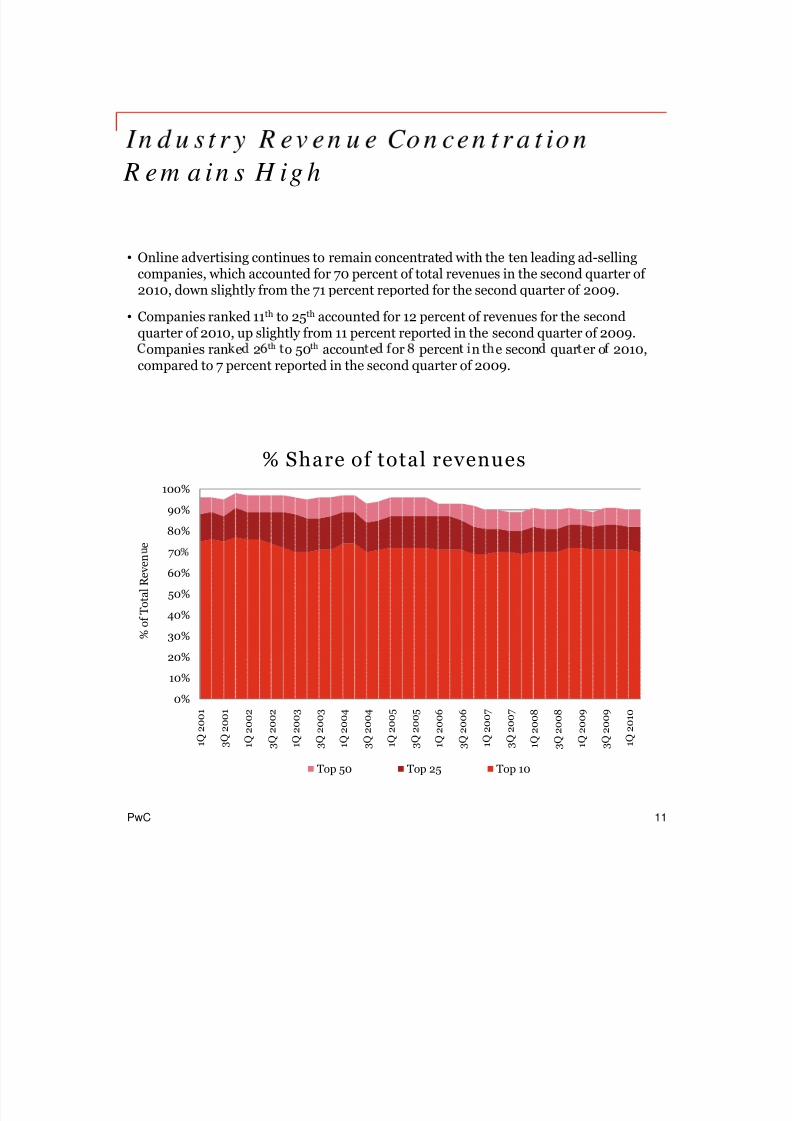
• Online advertising continues to remain concentrated with the ten leading ad-sellingcompanies, which accounted for 70 percent of total revenues in the second quarter of 2010, down slightly from the 71 percent reported for the second quarter of 2009.
• Companies ranked 11 th to 25 th accounted for 12 percent of revenues for the secondquarter of 2010, up slightly from 11 percent reported in the second quarter of 2009.
ompan es ran e 2 o 50 accoun e or percen n e secon quar er o 2010,compared to 7 percent reported in the second quarter of 2009.
80%
90%
100%
e
% Share of total revenues
30%
40%
50%
60%
70
% o
f T o t a l R e v e n
0%
10%
20%
1 Q 2 0 0 1
3 Q 2 0 0 1
1 Q 2 0 0 2
3 Q 2 0 0 2
1 Q 2 0 0 3
3 Q 2 0 0 3
1 Q 2 0 0 4
3 Q 2 0 0 4
1 Q 2 0 0 5
3 Q 2 0 0 5
1 Q 2 0 0 6
3 Q 2 0 0 6
1 Q 2 0 0 7
3 Q 2 0 0 7
1 Q 2 0 0 8
3 Q 2 0 0 8
1 Q 2 0 0 9
3 Q 2 0 0 9
1 Q 2 0 1 0
PwC
Top 50 Top 25 Top 10
11
8/8/2019 IAB Report 1H 2010 Final
http://slidepdf.com/reader/full/iab-report-1h-2010-final 12/25
, ,
A d Fo r m a t s
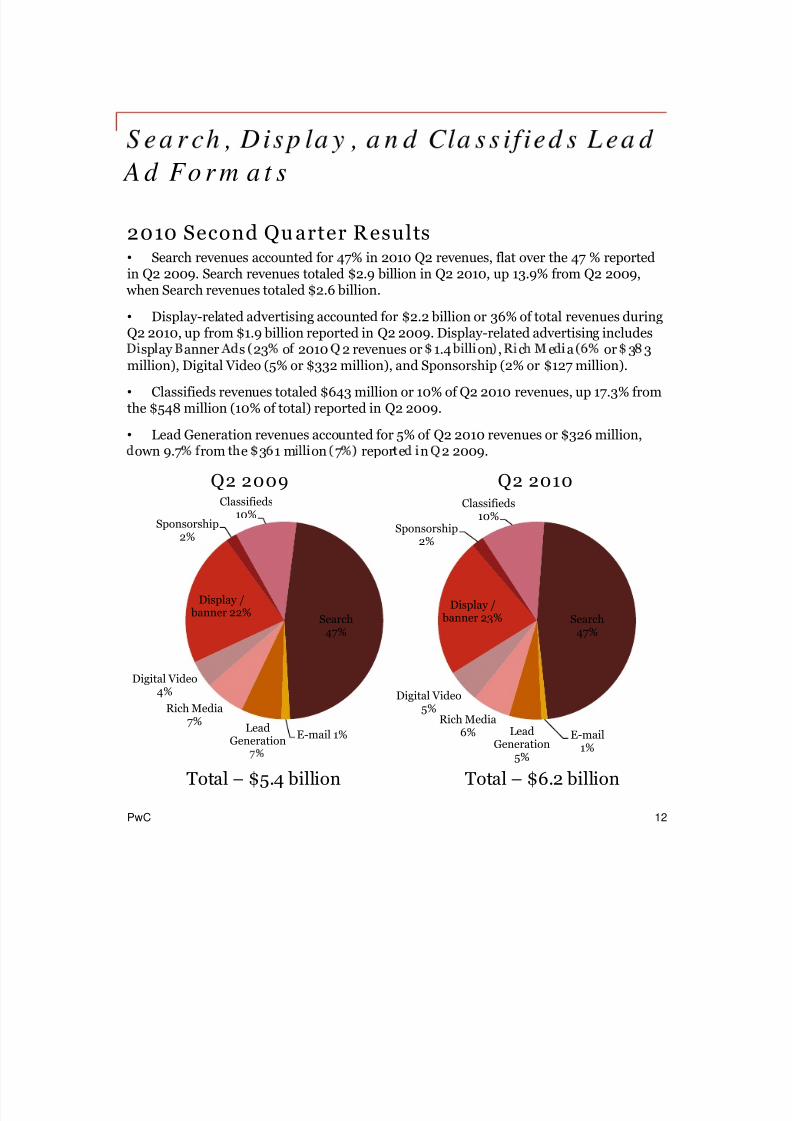
2010 Second Qu arter R esults• Search revenues accounted for 47% in 2010 Q2 revenues, flat over the 47 % reportedin Q2 2009. Search revenues totaled $2.9 billion in Q2 2010, up 13.9% from Q2 2009, when Search revenues totaled $2.6 billion.
• Display-related advertising accounted for $2.2 billion or 36% of total revenues duringQ2 2010, up from $1.9 billion reported in Q2 2009. Display-related advertising includes
sp ay anner s 23 o 2010 2 revenues or 1.4 on , c e a or 3 3million), Digital Video (5% or $332 million), and Sponsorship (2% or $127 million).
• Classifieds revenues totaled $643 million or 10% of Q2 2010 revenues, up 17.3% fromthe $548 million (10% of total) reported in Q2 2009.
• Lead Generation revenues accounted for 5% of Q2 2010 revenues or $326 million,own 9.7 rom e 3 1 m on 7 repor e n 2 2009.
Sponsorship2%
Classifieds
10%
Q2 2009
Sponsorship2%
Classifieds
10%
Q2 2010
Display / banner 22% Search
47%
Display / banner 23% Search
47%
E-mail 1%LeadGeneration
Rich Media7%
Digital Video4%
E-mail1%
LeadGeneration
Rich Media6%
Digital Video5%
PwC 12
Total – $5.4 billion5%
Total – $6.2 billion
8/8/2019 IAB Report 1H 2010 Final
http://slidepdf.com/reader/full/iab-report-1h-2010-final 13/25
, ,
A d Fo r m a t s
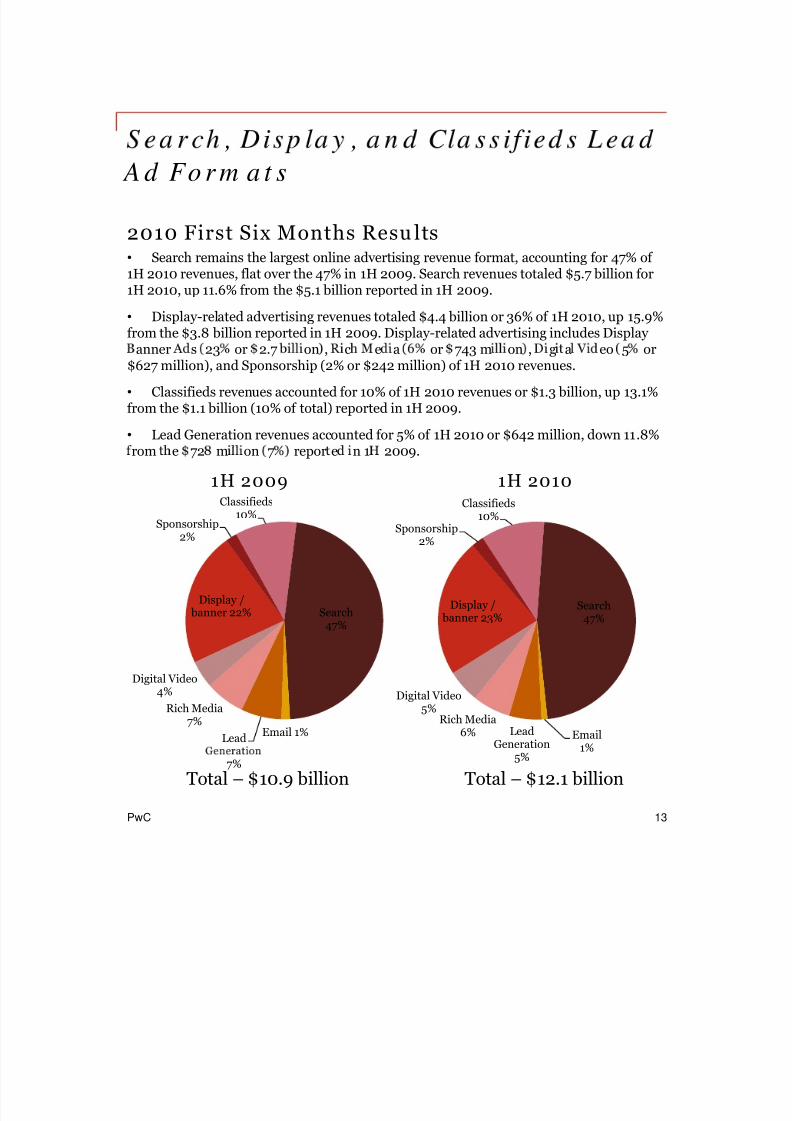
2010 First Six Months Resu lts• Search remains the largest online advertising revenue format, accounting for 47% of 1H 2010 revenues, flat over the 47% in 1H 2009. Search revenues totaled $5.7 billion for1H 2010, up 11.6% from the $5.1 billion reported in 1H 2009.
• Display-related advertising revenues totaled $4.4 billion or 36% of 1H 2010, up 15.9%from the $3.8 billion reported in 1H 2009. Display-related advertising includes Display
anner s 23 or 2.7 on , c e a or 743 m on , g a eo 5 or$627 million), and Sponsorship (2% or $242 million) of 1H 2010 revenues.
• Classifieds revenues accounted for 10% of 1H 2010 revenues or $1.3 billion, up 13.1%from the $1.1 billion (10% of total) reported in 1H 2009.
• Lead Generation revenues accounted for 5% of 1H 2010 or $642 million, down 11.8%rom e 72 m on 7 repor e n 1 2009.
Sponsorship2%
Classifieds
10%
1H 2009
Sponsorship2%
Classifieds
10%
1H 2010
Display / banner 22% Search
47%
Display / banner 23%
Search47%
Email 1%Lead
Rich Media7%
Digital Video4%
Email1%
LeadGeneration
Rich Media6%
Digital Video5%
PwC 13
7% 5%
Total – $10.9 billion Total – $12.1 billion
8/8/2019 IAB Report 1H 2010 Final
http://slidepdf.com/reader/full/iab-report-1h-2010-final 14/25
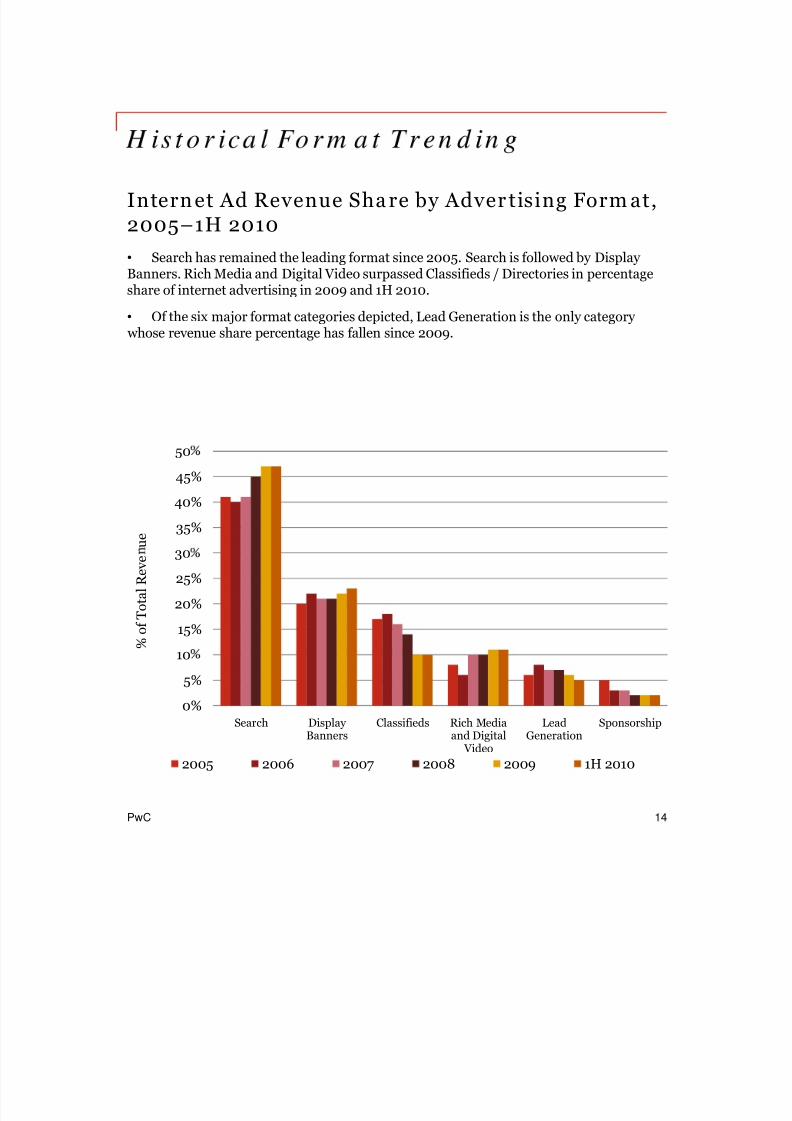
Intern et Ad Revenue Sha re by Adver tising Form at,2005–1H 2010• Search has remained the leading format since 2005. Search is followed by Display Banners. Rich Media and Digital Video surpassed Classifieds / Directories in percentageshare of internet advertising in 2009 and 1H 2010.
• Of the six major format categories depicted, Lead Generation is the only category whose revenue share percentage has fallen since 2009.
35%
40%
45%
50
u e
15%
20%
25%
30
% o
f T o t a
l R e v e
0%
5%
10
Search Display Banners
Classifieds Rich Mediaand Digital
Video
LeadGeneration
Sponsorship
PwC 14
2005 2006 2007 2008 2009 1H 2010
8/8/2019 IAB Report 1H 2010 Final
http://slidepdf.com/reader/full/iab-report-1h-2010-final 15/25
Co n s u m er A d S p en d in g
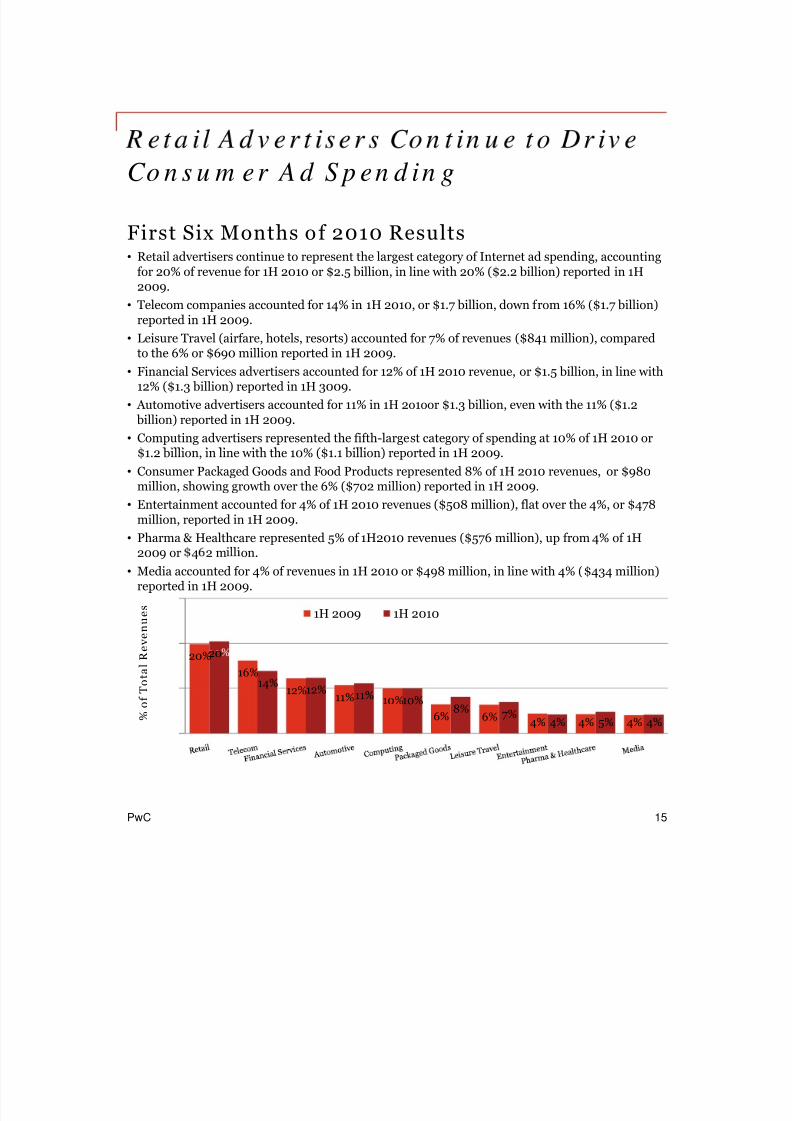
First Six Months o f 2010 Results• Retail advertisers continue to represent the largest category of Internet ad spending, accounting
for 20% of revenue for 1H 2010 or $2.5 billion, in line with 20% ($2.2 billion) reported in 1H2009.
• Telecom companies accounted for 14% in 1H 2010, or $1.7 billion, down from 16% ($1.7 billion)reported in 1H 2009.
• Leisure Travel (airfare, hotels, resorts) accounted for 7% of revenues ($841 million), comparedto the 6% or $690 million reported in 1H 2009.
• Financial Services advertisers accounted for 12% of 1H 2010 revenue, or $1.5 billion, in line with12% ($1.3 billion) reported in 1H 3009.
• Automotive advertisers accounted for 11% in 1H 2o1oor $1.3 billion, even with the 11% ($1.2 billion) reported in 1H 2009.
• Computing advertisers represented the fifth-largest category of spending at 10% of 1H 2010 or$1.2 billion, in line with the 10% ($1.1 billion) reported in 1H 2009.
• Consumer Packaged Goods and Food Products represented 8% of 1H 2010 revenues, or $980million, showing growth over the 6% ($702 million) reported in 1H 2009.
• Entertainment accounted for 4% of 1H 2010 revenues ($508 million), flat over the 4%, or $478million, reported in 1H 2009.
• Pharma & Healthcare represented 5% of 1H2010 revenues ($576 million), up from 4% of 1H2009 or 4 2 m on.
• Media accounted for 4% of revenues in 1H 2010 or $498 million, in line with 4% ($434 million)reported in 1H 2009.
e v e n u e s
1H 2009 1H 2010
20%16%
12% 11% 10%6% 6% 4% 4% 4%
20
14%12% 11% 10%
8% 7%4% 5% 4%
% o
f T
o t a
l R
PwC 15
8/8/2019 IAB Report 1H 2010 Final
http://slidepdf.com/reader/full/iab-report-1h-2010-final 16/25
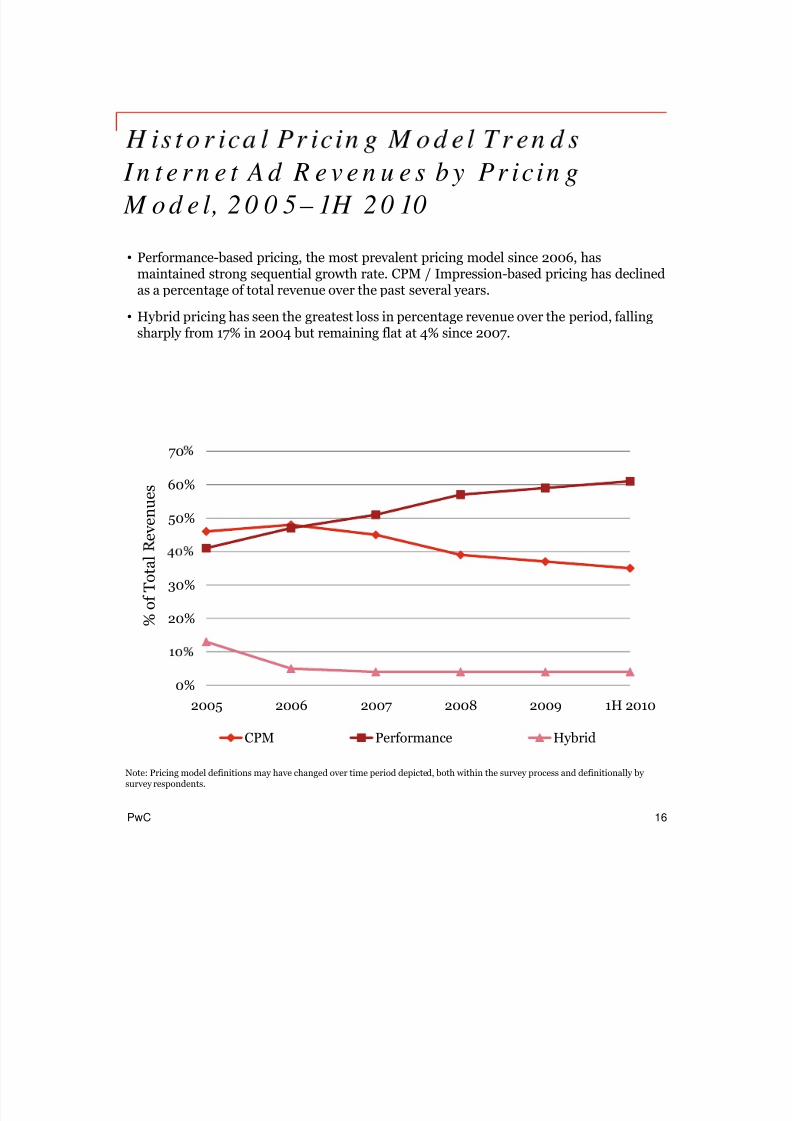
I n t e r n e t A d R e v e n u e s b y Pr icin g M o d e l, 2 0 0 5 – 1H 2 0 10
• Performance-based pricing, the most prevalent pricing model since 2006, hasmaintained strong sequential growth rate. CPM / Impression-based pricing has declinedas a percentage of total revenue over the past several years.
• Hybrid pricing has seen the greatest loss in percentage revenue over the period, fallingsharply from 17% in 2004 but remaining flat at 4% since 2007.
50%
60%
70
e v e n u e s
20%
30%
% o
f T o t a
l
0%2005 2006 2007 2008 2009 1H 2010
CPM Performance Hybrid
PwC 16
Note: Pricing model definitions may have changed over time period depicted, both within the survey process and definitionally by survey respondents.
8/8/2019 IAB Report 1H 2010 Final
http://slidepdf.com/reader/full/iab-report-1h-2010-final 17/25
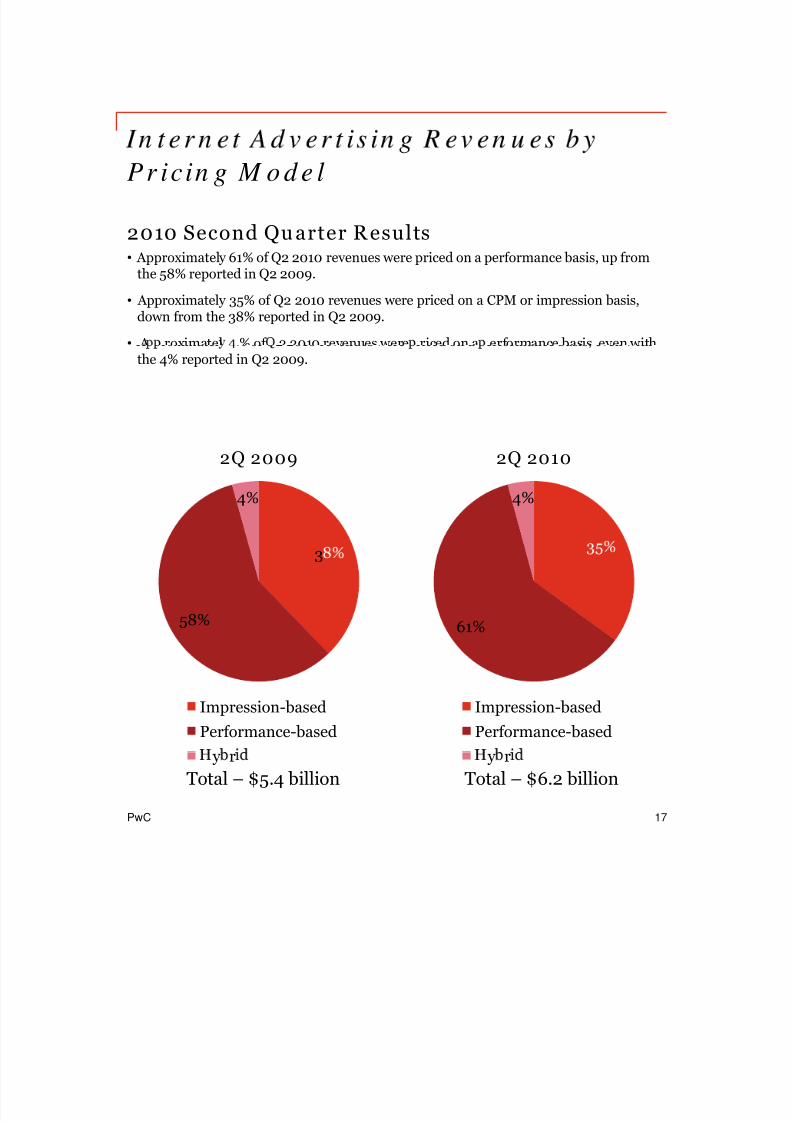
Pr icin g M o d e l
2010 Second Qu arter R esults• Approximately 61% of Q2 2010 revenues were priced on a performance basis, up from
the 58% reported in Q2 2009.
• Approximately 35% of Q2 2010 revenues were priced on a CPM or impression basis,down from the 38% reported in Q2 2009.
• A roximatel % of 2 2010 revenues were riced on a erformance basis even withthe 4% reported in Q2 2009.
4%
2Q 2009
4%
2Q 2010
3
58% 61%
Impression-basedPerformance-based
Impression-basedPerformance-based
PwC 17
y r y rTotal – $5.4 billion Total – $6.2 billion
8/8/2019 IAB Report 1H 2010 Final
http://slidepdf.com/reader/full/iab-report-1h-2010-final 18/25
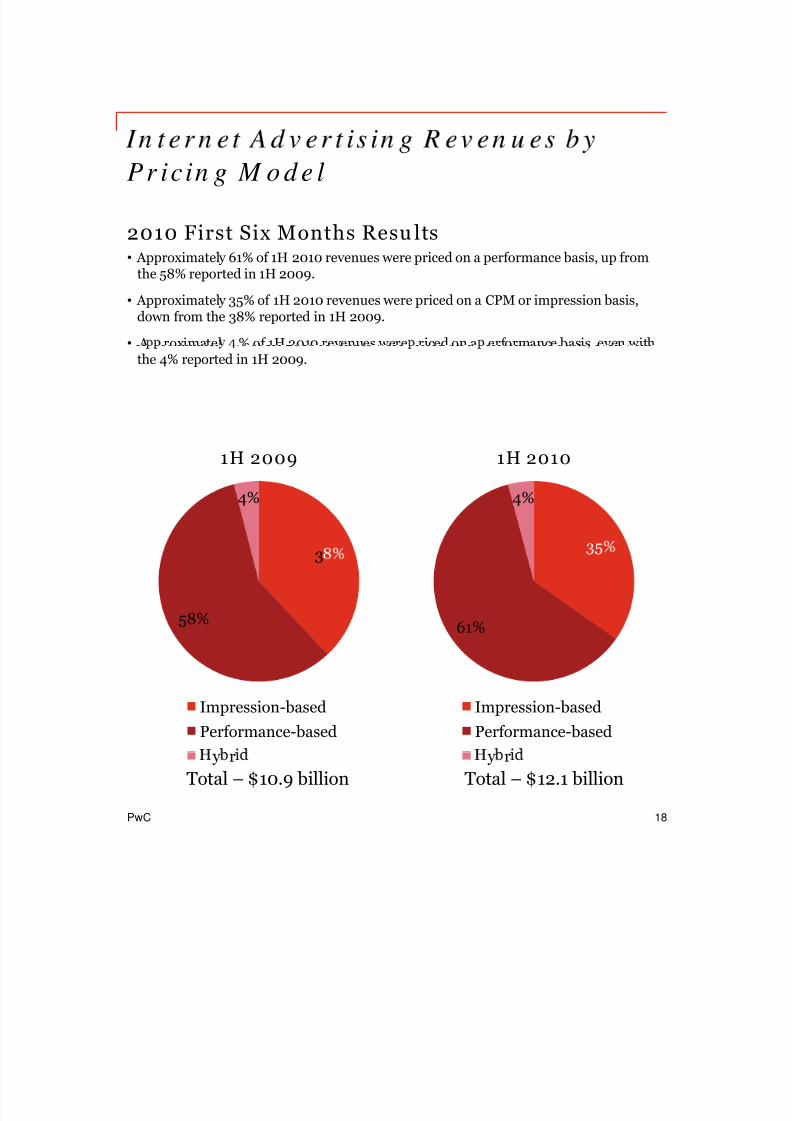
Pr icin g M o d e l
2010 First Six Months Resu lts• Approximately 61% of 1H 2010 revenues were priced on a performance basis, up from
the 58% reported in 1H 2009.
• Approximately 35% of 1H 2010 revenues were priced on a CPM or impression basis,down from the 38% reported in 1H 2009.
• A roximatel % of 1H 2010 revenues were riced on a erformance basis even withthe 4% reported in 1H 2009.
4%
1H 2009
4%
1H 2010
3
58% 61%
Impression-basedPerformance-based
Impression-basedPerformance-based
PwC 18
y r y rTotal – $10.9 billion Total – $12.1 billion
8/8/2019 IAB Report 1H 2010 Final
http://slidepdf.com/reader/full/iab-report-1h-2010-final 19/25
Definitions o f Leading Industry Categories
The industry categories used in the IAB Internet Advertising Revenue Report were sources from the North American Standard Industrial Classification (SIC) Manual. †
Retail – includes mail order/catalog, apparel, restaurants/fast food, home furnishings/textiles, toys, petfood/supplies, appliances, jewelry, drug stores, retail stores and cosmetics.
Automotive – includes all automotive-related categories including sale/purchase of vehicles and parts andmaintenance.
Entertainment – includes film, music, TV, box office, video games and amusement & recreation.
Consumer Packaged Goods – includes packaged goods, food products, household products andtobacco.
Leisure Travel – includes travel hotel airlines and resorts.
Computing Products – includes hardware (computers, computer storage devices, and computerperipheral equipment), consumer electronics, prepackaged software (operating, utility and applicationsprograms), local area network systems and network systems integration, computer processing and datapreparation and data processing services.
Financial Services – includes commercial banks, credit agencies, personal credit institutions, consumerfinance companies, loan companies, business credit institutions and credit card agencies. Also includescompan es engage n t e un erwr t ng, purc ase, sa e or ro erage o secur t es an ot er nanc acontracts.
Telecommunications – includes point-to-point communications services, including telephone voice anddata communications, two-way mobile/cellular communications services and other non-vocal messagecommunications services (e.g., cablegram, electronic mail and facsimile). Includes multi-channel videoproviders on a subscription fee basis (e.g., cable television, wireless cable television and direct broadcastsatellite services).
Media – includes establishments primarily engaged in radio and television broadcasting (network andstation) including commercial, religious, educational and other radio or television stations. Also includes
establishments primarily engaged in publishing newspapers, periodicals and books.Pharma and Healthcare - includes pharmaceutical products, facilities, services , researches and biological products. Also comprises establishments providing health care and social assistance forindividuals as well as personal care, toiletries, and cosmetics products.
PwC 19
†Survey participants reported results based on the 21 industry categories listed on page 22, which were used specifically for theIAB Internet Advertising Revenue Report. This is consistent with other relevant industry categorization sources that measureadvertising spending by industry. For purposes of this report, PricewaterhouseCoopers classified a number of individualcategories under “Retail.”
8/8/2019 IAB Report 1H 2010 Final
http://slidepdf.com/reader/full/iab-report-1h-2010-final 20/25
Definitions o f Advertising Form ats
Classifieds and a uctions —fees advertisers pay Internet companies to list specific products or services (e.g., online job boards and employment listings, real estate listings, automotive listings, auction-based listings, yellow pages).Digital Video Comme rcials —TV-like advertisements that may appear as in-page video commercials or before,during, and/or after a variety of content in a player environment including but not limited to, streaming video,animation, gaming, and music video content. This definition includes digital video commercials that appear in live,archived and downloadable streaming content.
D sp ay ver t s n g Ban ner s — a vert ser pays an Internet company or space to sp ay a stat c or yper-linked banner or logo on one or more of the Internet company’s pages.
Email —banner ads, links or advertiser sponsorships that appear in email newsletters, email marketing campaigns andother commercial email communications. Includes all types of electronic mail (e.g., basic text or HTML-enabled).
Lead Gener ation —fees advertisers pay to Internet advertising companies that refer qualified purchase inquiries (e.g.,auto dealers which pay a fee in exchange for receiving a qualified purchase inquiry online) or provide consumerinformation (demographic, contact, behavioral) where the consumer opts into being contacted by a marketer (email,
, , . . ., - - , - - ,can include user applications (e.g., for a credit card), surveys, contests (e.g., sweepstakes) or registrations.
Rich media —advertisements that incorporate animation, sound, and/or interactivity in any format. Rich media can beused either singularly or in combination with the following technologies: sound, Flash, and with programminglanguages such as Java, JavaScript, and DHTML. It is deployed via standard Web and wireless applications includingstatic (e.g. .html) and dynamic (e.g. .asp) Web pages, and may appear in ad formats such as banners, buttons andinterstitials. Interstitials are included in the rich media category and represent full- or partial-page text and imageserver- ush advertisements which a ear in the transition between two a es of content. Forms of interstitials caninclude splash screens, page takeovers and pop-up windows.
Search —fees advertisers pay Internet companies to list and/or link their company site domain name to a specificsearch word or phrase (includes paid search revenues). Search categories include:• Paid listings— text links appear at the top or side of search results for specific keywords. The more a marketer
pays, the higher the position it gets. Marketers only pay when a user clicks on the text link.• Contextual search— text links appear in an article based on the context of the content, instead of a user-
submitted keyword. Payment only occurs when the link is clicked.• Paid inclusion— guarantees that a marketer’s URL is indexed by a search engine. The listing is determined by the
engine's search algorithms.• Site optimization— modifies a site to make it easier for search engines to automatically index the site and
hopefully result in better placement in results.
Sponsorship —represents custom content and/or experiences created for an advertiser which may or may not includead elements such as display advertising, brand logos, advertorial or pre-roll video. Sponsorships fall into severalcategories:• S otli hts are custom built a es incor oratin an advertiser’s brand and housin a collection of content usuall
around a theme;• Advergaming can range from an advertiser buying all the ad units around a game or a “sponsored by” link to
creating a custom branded game experience;• Content & Section Sponsorship is when an advertiser exclusively sponsors a particular section of the site or email
(usually existing content) re-skinned with the advertiser’s branding;• Sweepstakes & Contests can range from branded sweepstakes on the site to a full-fledge branded contest with
submissions and judging
PwC 20

8/8/2019 IAB Report 1H 2010 Final
http://slidepdf.com/reader/full/iab-report-1h-2010-final 21/25
Survey Scope
The Interactive Advertising Bureau (IAB) retained PricewaterhouseCoopers to establish acomprehensive standard for measuring the growth of Internet/online advertisingrevenues.
• The IAB Internet Advertising Revenue Report is part of an ongoing IAB mission toprovide an accurate barometer of Internet advertising growth.
• To achieve differentiation from existing estimates and accomplish industry-wideacceptance, key aspects of the survey include:
- Obtaining historical data directly from companies generating Internet/onlineadvertising revenues;
- a ng e survey as nc us ve as poss e, encompass ng a orms oInternet/online advertising, including Web sites, consumer online services, adnetworks and email providers; and
- Ensuring and maintaining a confidential process, only releasing aggregate data.
• PricewaterhouseCoopers:
- Compiles a database of industry participants selling Internet/online advertising
revenues.- Conducts a quantitative mailing survey with leading industry players, including
Web publishers, ad networks, commercial online service providers, emailproviders and other online media companies.
- Supplemental Data is acquired through the use of publicly disclosed information
- Requests and compiles several specific data items, including monthly grosscommissionable advertising revenue by industry category and transaction.
- Identifies non-participating companies and applies a conservative revenue
estimate based on available public sources.- Analyzes the findings, identifies and reports key trends.
PwC 21

8/8/2019 IAB Report 1H 2010 Final
http://slidepdf.com/reader/full/iab-report-1h-2010-final 22/25
Survey Industry Categories
Automotive
Beer/Wine/Liquor
Business Products/Services
Computers (Hardware/Software)
Financial Services (Banks,
Insurance, Securities,Mortgages)
Personal Care, Toiletries andCosmetics
Restaurants/ Fast food
Retail, Mail Order, Catalogs and Apparel
Telecommunications:Telephony, Cable/Satellite TV
Consumer Packaged Goods,Food, Non-Alcoholic Beveragesand Candy
Educational Services
rugs an eme es
Manufacturing
Media
Professional Sports and Sporting& Athletic Goods
erv ces, s
Toys/Games
Leisure Travel (Airfare, Hotels,Resorts)
Business Travel (Airfare, Hotels,, , ,
Box Office, Video Games, Amusement/Recreational)
Real Estateesorts
About the Interact ive Adver tisin Bureau
The Interactive Advertising Bureau (IAB) is comprised of more than 460 leading media and technology companies who are responsible for selling 86% of online advertising in the United States. On behalf of its members, the IAB is dedicated to the growth of the interactive advertising marketplace, of
interactive’s share of total marketing spend, and of its members’ share of total marketing spend. TheIAB educates marketers, agencies, media companies and the wider business community about the value of interactive advertising. Working with its member companies, the IAB evaluates andrecommends standards and practices and fields critical research on interactive advertising. Founded in1996, the IAB is headquartered in New York City with a Public Policy office in Washington, D.C. Formore information, please visit www.iab.net.
PwC 22

8/8/2019 IAB Report 1H 2010 Final
http://slidepdf.com/reader/full/iab-report-1h-2010-final 23/25
Overall Report Guidance Provided by IAB LeadershipExecutive Committee
ChairmanDavid Moore24/7 Real Media
Dave MorganSimulmedia Inc.
PresidentRandall RothenbergIAB
Bob CarriganIDG Communications
Vice ChairNeil AsheCBS Interactive
Peter NaylorNBC Universal
Disney Interactive Media Group
Conde Nast Digital
Board of DirectorsKevin ArrixMTV Networks
Neil Ashe
Peter HoranGoodmail Systems
Kathleen Kayse
Randall RothenbergInteractive Advertising Bureau
Scott Schillern erac ve
Adam BainTwitter
John BattelleFederated Media
Bob CarriganIDG Communications
e pra n rey e worDiscovery
Randy KilgoreTremor Media
Jeff LevickAOL
Leon Levitt
omcas
Tina SharkeyBabyCenter
Tad SmithCablevision
Elisa SteeleYahoo!
Sarah ChubbCondéNast Digital
Jarvis CoffinBurst Media
Kevin ConroyUnivision
Cox Newspapers
Chris MaThe Washington Post Company
Greg McCastle
AT&T Converged ServicesKirk McDonaldTime Inc
Nada StirrattFox Interactive Media/MySpace
Bill ToddValueClick
Lisa UtzscheiderAmazon
Greg D’AlbaCNN
Jory Des JardinsBlogHer
Jeff GoldsteinSocialMedia.com
Mitch Golub
.
David Moore24/7 Real Media
David MorganSimulmedia Inc.
Mike MurphyFacebook
Rik van der KooiMicrosoft
Steve WadsworthDisney Interactive Media Group
Jeff WebberUSAToday
Dennis Woodsidecars.com
Jack Griffin
Time Inc.
Peter NaylorNBC Universal
Martin NisenholtzNY Times Company
Ex-OfficioTreasurer Secretary Founding Chairman
PwC 23
Bruce GordonDisney Interactive Media Group
Joseph RosenbaumReed Smith LLP
Rich LeFurgyArcher Advisors
8/8/2019 IAB Report 1H 2010 Final
http://slidepdf.com/reader/full/iab-report-1h-2010-final 24/25
PwC (www.pwc.com) provides industry-focused assurance, tax and advisory services for public andprivate clients. More than 146,000 people in 150 countries connect their thinking, experience andsolutions to build public trust and enhance value for clients and their stakeholders.
PricewaterhouseCoopers’ New Media Group was the first practice of its kind at a Big Four firm.Currently located in New York, Los Angeles, Boston, Seattle and the Bay Area, our New Media Groupnc u es accoun ng, ax an consu ng pro ess ona s w o ave roa an eep exper ence n e ree
areas that converge to form new media: advanced telecommunications, enabling software and contentdevelopment/distribution.
Our services include:
• Business assurance services
• Web audience measurement and advertising delivery auditing and advisory
• IAB Measurement Certification Compliance auditing
• Privacy policy structuring, attestation and compliance advisory
• Mergers & Acquisition assistance
• Tax planning and compliance
• Capital sourcing and IPO assistance
For more information about our New Media Group, contact one of the following PwC professionals:
New York
New York
New York av verm an
Partner, Assurance [email protected]
u ss a p e nz aPartner, Advisory [email protected]
ean aoSr. Manager, Assurance Services646.471.0620 [email protected]
PwC 24
8/8/2019 IAB Report 1H 2010 Final
http://slidepdf.com/reader/full/iab-report-1h-2010-final 25/25
.
This publication has been prepared for general guidance on matters of, .
not act upon the information contained in this publication withoutobtaining specific professional advice. No representation or warranty
(express or implied) is given as to the accuracy or completeness of theinformation contained in this publication, and, to the extent permittedby law, PricewaterhouseCoopers LLP, its members, employees andagents do not accept or assume any liability, responsibility or duty ofcare for any consequences of you or anyone else acting, or refrainingto act, in reliance on the information contained in this ublication or forany decision based on it.
© 2010 PricewaterhouseCoopers LLP. All rights reserved. In thisdocument, “PwC” refers to PricewaterhouseCoopers LLP which is amember firm of PricewaterhouseCoopers International Limited, eachmember firm of which is a separate legal entity.


![IAB & OnDeviceResearch Infographic - Mobile Commerce ... · Title: IAB & OnDeviceResearch Infographic - Mobile Commerce Global Perspective [Final] Created Date: 9/21/2016 2:35:24](https://static.fdocuments.in/doc/165x107/602565b541976628a032b4a1/iab-ondeviceresearch-infographic-mobile-commerce-title-iab-ondeviceresearch.jpg)