I80 PRELIM RESULTS working paper versiondocx
17
UC Davis Working Papers Title Preliminary Results from a Field Experiment of Three Fuel Economy Feedback Designs Permalink https://escholarship.org/uc/item/11r5b3cs Authors Stillwater, Tai Kurani, Kenneth S. Publication Date 2012-08-01 eScholarship.org Powered by the California Digital Library University of California brought to you by CORE View metadata, citation and similar papers at core.ac.uk provided by eScholarship - University of California
Transcript of I80 PRELIM RESULTS working paper versiondocx
UC DavisWorking Papers
TitlePreliminary Results from a Field Experiment of Three Fuel Economy Feedback Designs
Permalinkhttps://escholarship.org/uc/item/11r5b3cs
AuthorsStillwater, TaiKurani, Kenneth S.
Publication Date2012-08-01
eScholarship.org Powered by the California Digital LibraryUniversity of California
brought to you by COREView metadata, citation and similar papers at core.ac.uk
provided by eScholarship - University of California

Institute of Transportation Studies ◦ University of California, Davis
One Shields Avenue ◦ Davis, California 95616
PHONE (530) 752-6548 ◦ FAX (530) 752-6572
www.its.ucdavis.edu
Working Paper – UCD-ITS-WP-12-01
Preliminary Results from a Field Experiment of Three Fuel Economy
Feedback Designs
August 2012
Tai Stillwater Kenneth S. Kurani

PRELIMINARY RESULTS FROM A FIELD EXPERIMENT OF THREE FUEL ECONOMY FEEDBACK DESIGNS
Tai Stillwater
Kenneth S. Kurani
Institute of Transportation Studies
WORKING PAPER
8/2012

Stillwater, Kurani 1
ABSTRACT 1 Energy feedback to drivers is one method to engage drivers in energy saving driving styles. In contrast to 2 the occasional broadcasting of general driving tips, in-vehicle energy feedback gives drivers access to 3 accurate information about their specific driving situation on an ongoing basis. The increasing prevalence 4 of such feedback in new vehicles suggests a belief that ongoing, in-vehicle feedback is better. However, 5 there is little reliable evidence of the effectiveness of energy feedback in real-word driving in passenger 6 vehicles. This study begins to fill this gap. Participants are given a commercially-available fuel 7 consumption display and recording device to use in their personal vehicle for two months. For the first 8 month the display is blank as the device records a baseline of driving and fuel consumption. For the 9 second month the display is switched on to show drivers one of three feedback designs. This paper 10 presents preliminary results (N=36) of a larger study that will include 150 drivers along the California-11 Nevada Interstate-80 corridor. Using a mixed-effects linear model, we find an average decrease of 12 between 2% and 8% in fuel consumption (gallons/100 miles) between the without- and with-feedback 13 months, depending on the feedback designs. Categorizing trips into types based on distance and multiple 14 speed characteristics, there are differences in the apparent effectiveness of feedback across trip types. 15 Most trips average approximately 5% reduction in fuel consumption. The long distance highway trip type 16 showed only a 1% decrease in fuel consumption between the two study periods. 17
18
19
Stillwater, Kurani 2
INTRODUCTION 1 Past research indicates that the adoption of more efficient driving styles due to feedback can realistically 2 decrease passenger vehicle fuel consumption by 5% (1–3). The driving behaviors that result in this effect 3 are a suite of energy-saving behaviors that have come to be known as ecodriving: moderating top speeds 4 and acceleration and increased coasting (especially approaching stops). However, the potential 5 improvements from practicing an eco-driving style are mediated by roadway design, traffic levels, 6 competing norms about driving styles, and drivers’ own interest and knowledge regarding eco-driving 7 compared to other goals they have for, and while, driving. As an example, a goal such as saving time 8 rather than fuel, whether it manifests as an attempt to make it through the next traffic signal before it 9 changes or high-speed freeway driving, would conflict with eco-driving. In this paper, we focus on the 10 impact of in-vehicle fuel economy feedback on on-road fuel consumption. Drivers’ attitudes, interests, 11 and knowledge are organized into a framework to help explain driver behaviors in response to fuel 12 consumption feedback. Further, we organize the analysis into different types of trips to help to account for 13 the mediating effects of traffic level and trip length. To expand the relevance of this study to the broad 14 variety of feedback designs being deployed in new cars today, we test the effectiveness of three common 15 feedback designs on on-road fuel consumption. The experiment will eventually reach a sample size of 150 16 drivers in cities and towns along the Interstate-80 corridor from San Francisco, CA to Reno, NV. This 17 will result in the equivalent 25 driver-years of data: half without the feedback designs we present to 18 drivers and half with feedback. Here, we present preliminary results from the first 36 drivers from Davis, 19 CA, representing six driver-years of data. 20
BACKGROUND 21
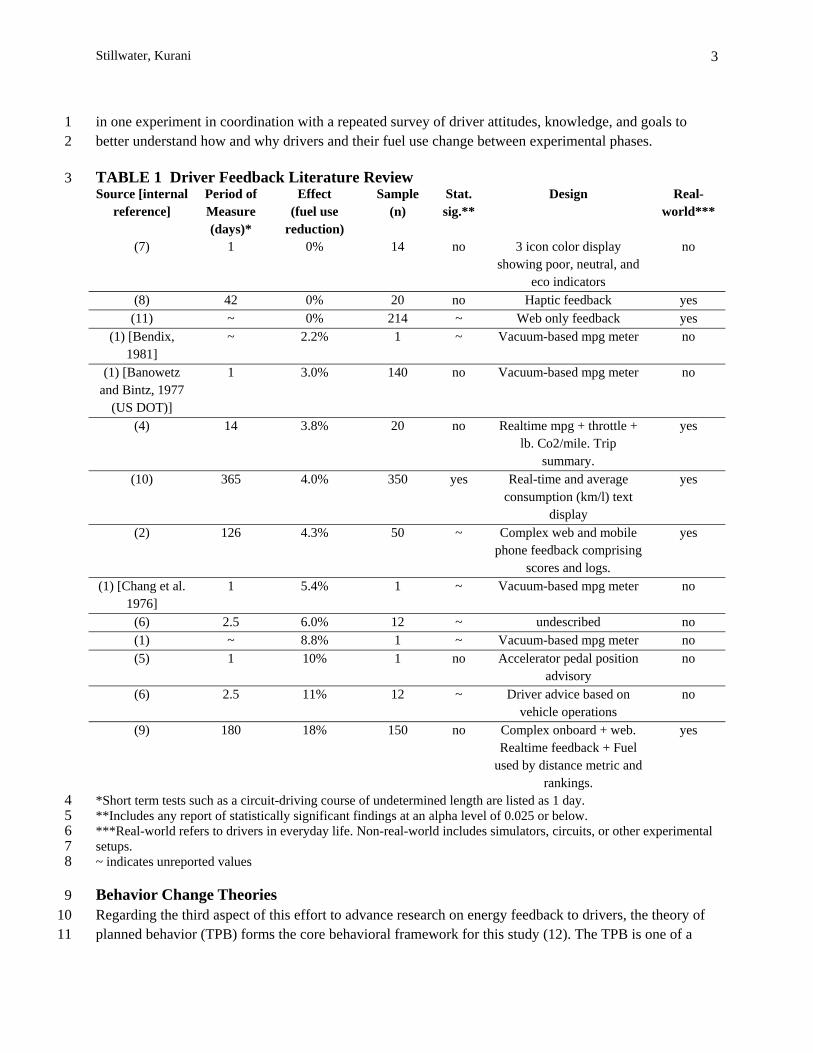
Review of Driver Feedback Studies 22 A meta-analysis of 15 studies found in the scholarly and popular literature in the past 30 years indicates 23 that feedback and driver training can lead to fuel consumption reductions (1, 2, 4–11) (Table 1). However, 24 few of the studies were completed in naturalistic driving setting and only one (10) presented statistically 25 significant results. The majority of studies were based on feedback that consisted of a real-time numeric 26 or graphical gauge display of fuel economy, i.e., miles-per-gallon (MPG). The apparent difference 27 between the effects estimated in short term (one event or a single day of driving) vs. long term (greater 28 than two weeks) studies may be due to short term studies being more likely to include a positive 29 performance bias, e.g., asking individuals try to drive carefully to perform well in the experiment. In 30 long-term studies, it is unlikely that an individual would continue to display such behavior for the benefit 31 of the test, as over time the experiment will recede in importance as general life habits and goals re-assert 32 themselves. One experiment found that in the short term, individuals who were simply asked to drive 33 more carefully (without additional training or feedback) increased their fuel economy by 10% (1). The 34 suggestion is that in the short term, an experimental effect unrelated to the goals of the study may be 35 responsible for a large amount of the effect being attributed to feedback designs. 36
The research design deployed here attempts to improve on past studies in three ways. First, it 37 includes a large enough sample, detailed sub-second data, and a long enough data collection period to 38 allow more sensitive analysis to reach statistical significance. Second, it includes a long enough duration 39 to suppress the effects of a short-term positive performance bias. Third, it tests multiple feedback designs 40
Stillwater, Kurani 3
in one experiment in coordination with a repeated survey of driver attitudes, knowledge, and goals to 1 better understand how and why drivers and their fuel use change between experimental phases. 2
TABLE 1 Driver Feedback Literature Review 3 Source [internal
reference] Period of Measure (days)*
Effect (fuel use
reduction)
Sample (n)
Stat. sig.**
Design Real-world***
(7) 1 0% 14 no 3 icon color display showing poor, neutral, and
eco indicators
no
(8) 42 0% 20 no Haptic feedback yes (11) ~ 0% 214 ~ Web only feedback yes
(1) [Bendix, 1981]
~ 2.2% 1 ~ Vacuum-based mpg meter no
(1) [Banowetz and Bintz, 1977
(US DOT)]
1 3.0% 140 no Vacuum-based mpg meter no
(4) 14 3.8% 20 no Realtime mpg + throttle + lb. Co2/mile. Trip
summary.
yes
(10) 365 4.0% 350 yes Real-time and average consumption (km/l) text
display
yes
(2) 126 4.3% 50 ~ Complex web and mobile phone feedback comprising
scores and logs.
yes
(1) [Chang et al. 1976]
1 5.4% 1 ~ Vacuum-based mpg meter no
(6) 2.5 6.0% 12 ~ undescribed no (1) ~ 8.8% 1 ~ Vacuum-based mpg meter no (5) 1 10% 1 no Accelerator pedal position
advisory no
(6) 2.5 11% 12 ~ Driver advice based on vehicle operations
no
(9) 180 18% 150 no Complex onboard + web. Realtime feedback + Fuel
used by distance metric and rankings.
yes
*Short term tests such as a circuit-driving course of undetermined length are listed as 1 day. 4 **Includes any report of statistically significant findings at an alpha level of 0.025 or below. 5 ***Real-world refers to drivers in everyday life. Non-real-world includes simulators, circuits, or other experimental 6 setups. 7 ~ indicates unreported values 8
Behavior Change Theories 9 Regarding the third aspect of this effort to advance research on energy feedback to drivers, the theory of 10 planned behavior (TPB) forms the core behavioral framework for this study (12). The TPB is one of a 11
Stillwater, Kurani 4
number of rational behavior models that include decision-making pre-cursors such as attitudes about the 1 behavior, perceptions of applicable social norms, or perceptions of behavioral control. The TPB 2 behavioral model has generated a large literature including such applications as recycling (13) and 3 drivers’ propensity to speed (14). 4
Recent studies indicate that additional factors not included in the TPB play critical roles in 5 behavior change, notably goals, as described in the extended model of goal directed behavior (EMGDB) 6 (15), and personality (16). The TPB was proposed as a model to explain behavioral intention and outcome 7 behavior (once the context was taken into account) and was not originally meant as a methodology by 8 which to modify behavior, although the popularity of the TPB is largely due to researchers interested in 9 theory-based behavioral interventions, and the TPB is seen as a model for studying intervention efficacy 10 (17). 11
TPB, as we amend it with other behavioral precursors, helps us understand why individuals may 12 or may not find feedback motivating and engaging. A general hypothesis from the TPB, for instance 13 would be that an individual’s sense they have control over fuel consumption will lead to greater savings 14 (if savings are possible in that specific context). To test this, and other theory-based hypotheses that have 15 been shown to be applicable to ecodriving in past studies we have included a repeated questionnaire to 16 measure such attitudes and goals both before and after feedback. In addition, an interview at the end of 17 the study allows participants to discuss their own motivations in their own words. The questionnaire and 18 interview results will be presented with the final dataset at the conclusion of the study in mid-2013, and 19 are not included further in this paper. 20
DESCRIPTION OF THE EXPERIMENT 21 We test three versions of fuel consumption feedback in a two month natural driving experiment. To 22 enhance our estimate of the efficacy of the three tested designs, thirty to forty participants will be enrolled 23 in three additional distinct regions in two states, for a total of 150 individual drivers and 25 vehicle years 24 in the experiment (12.5 baseline vehicle-years and 12.5 treatment vehicle-years). 25
Study regions and household selection process 26 To ensure that the estimates of fuel savings can be generalized to many driving situations, four distinct 27 metropolitan regions along the I-80 corridor were selected for study, comprising San Francisco, Davis, 28 and Sacramento, CA as well as Reno NV. This paper details the preliminary results from Davis, CA. 29
In order to assess the unique effects and attributes of the three feedback designs, an a priori 30 random assignment of each household to a single display type is made such that within each geographic 31 region; an equal number of households will be assigned to each display type. Thus, 50 households will 32 complete the experiment with each display for a total of 150 samples. 33
A household sample was selected with the participation of the American Automobile Association 34 of Northern California, Nevada, and Utah (AAANCNU). Household recruitment criteria included the 35 requisite insurance coverage, residence in the study area, and ownership of at least one non-hybrid, post-36 1996 model year vehicle. The data display and recording device plugs into the Onboard Diagnostic Port 37 (OBD) required on motor vehicles in the U.S. since 1996. A letter stating the general outline of the study 38 was sent to 300 to 500 qualifying drivers in each region. The letter included a link to a recruiting survey, 39

Stillwater, Kurani 5
in which household vehicle ownership, income, and license status were queried in order to build a 1 database of likely participants. Participants were enrolled in the study from the pool of respondents to the 2 online survey. 3
Each household was visited by a researcher who formally enrolled the qualified and participating 4 drivers in the study and installed the device in the participating vehicles. It was explained to drivers that 5 for the first month the display would be blank—except to log-in who was driving—to record a baseline of 6 driving and fuel consumption. It was further explained that after one month a researcher would return to 7 the household to reprogram the device to enable the fuel economy feedback the household would drive 8 for another month, and finally a researcher would return a final time to interview the participants about 9 their experience and retrieve the device. 10
Statistical support for the selected sample size 11 A retrospective statistical power analysis was used to estimate the minimal detectible fuel economy 12 improvement based on the results of a prior study of the effects of in-vehicle feedback (18). As the 13 experimental contexts differ between the two studies, the power analysis is simply an indicator of size of 14 the effects the present study may detect. The analysis indicates a sample size of 25 drivers can detect a 15 fuel economy effect as low as 1.3% (alpha=0.05). Divided into attitudinal groups that had different 16 responses to the screen, the power analysis indicates a sample of approximately 10 can detect a fuel 17 economy effect as low as 2% (alpha=0.05). These results suggest that a sample size of 50 is sufficient to 18 ensure the desired level of statistical significance, and that a sample size of 50 per feedback style is also 19 likely to allow further analysis of attitudinal group membership and differing effects of the screens across 20 the groups. 21
Screen selections 22 Three feedback display designs were selected to span the range of designs tested for user comprehension 23 and satisfaction in the 2010 NHTSA Fuel Economy Driver Interface Report (19). The implications for the 24 design and sample size of the field test are discussed below. The selection of three screens from the 25 NHTSA report’s seven representative screens is based on three factors: reducing cognitive load by 26 reducing the number of different screen types we will have any of our drivers view (measured by user 27 response time), improving comprehension (measured by a user task with a binary correct/incorrect result), 28 and increasing user satisfaction (measured by user self-reports). The three screens are implemented nearly 29 as shown in the NHTSA report, although higher-contrast colors are used to increase visibility in the 30 vehicle (Figures 1-3). 31
Data Recording Details 32 The device used was the commercially DrewTech DashDaq display and data logger. Fuel-consumption 33 data were recorded from the OBD-II port at an average of 20hz for the duration of each recorded trip. 34 Standard conversions were used to calculate fuel consumption from recorded Mass Air Flow (MAF) 35 sensor and distance from the Vehicle Speed Sensor (VSS). For vehicles using the speed-density engine 36 control strategy, i.e., those that do not include a MAF sensor, synthetic MAF values were calculated using 37 the vehicle engine displacement, intake air temperature, engine RPM, and an assumption of 80% 38 volumetric efficiency. When available, the Lambda sensor was also recorded to adjust the fuel 39 consumption values in periods of rich or lean fuel-air mixtures. In addition to the OBD-II engine data, a 40

Stillwater, Kurani 6
GPS receiver logs altitude at a 1hz rate for estimates of elevation and road grade. To enable proper 1 estimation of the effect of the interface in vehicles with multiple drivers, the display was programmed to 2 allow each driver to enter a personal driver identification number, allowing up to three drivers per vehicle 3 to be recorded. 4
5
FIGURE 1 “Numbers” Feedback Design (NHTSA Design CS06). Real-time MPG (1), trip 6 average MPG (2), current value shown by a green bar chart. (A) the mean value is set to 7 the EPA combined cycle fuel economy rating for that vehicle. (B) the current value is also 8 shown in numeric form (C). 9
10
11
FIGURE 2 “Accelerator” Feedback Design (NHTSA Design CSO2). Trip-level leaf 12 representation of fuel economy (1) where the center point (A) represents the EPA 13 combined cycle Fuel Economy Rating. Instantaneous acceleration bar (2); rightward shows 14 acceleration and leftward shows deceleration. The acceleration bar is truncated to 0.25G in 15 each direction. 16

Stillwater, Kurani 7
1
2
FIGRUE 3 “Shrubbery” Feedback Design (NHTSA Design CSO3). Real-time (1A) and 3 trip-level (2) leaf representations of fuel economy. The mean value of the bars is set to the 4 EPA combined cycle fuel economy rating for that vehicle (B). 5 6
DATA TREATMENT AND ANALYSIS 7 Each trip was recorded as a separate comma separated value (CSV) file on a 4GB memory card n the 8 DashDaq. Typically, each of the first 36 drivers generated 500MB to 1GB of data during the 2 months of 9 the experiment; it was apparent at the visit between the without and with feedback phases that a few 10 drivers would generate more than 4GB of data. For these drivers, their first month of data was transferred 11 from the memory card before the start of their second month. During the initial analysis each trip file was 12 loaded into the statistical package R to generate summary trip statistics including the vehicle and driver 13 identification, distance, fuel consumed, ambient temperature, elevation changes, and speed statistics 14 including mean, maximum, and variance. 15
First, the trips were clustered into five distinct types as described in the Trip Type section below 16 to test for differences in effectiveness of the feedback based on the driving pattern (e.g. city and highway 17 trips). The data analysis then proceeded to estimate fuel consumption in the without and with feedback 18 months. Fuel consumption and distance were then used to calculate an overall fuel consumption rate, 19 gallons per 100 miles (GP100M), for each trip. 20
To generate the sort of overall average effects reported in much prior work, an overall t-test was 21 used to make an estimate of un-adjusted driving data (wherein the fuel consumption was not controlled 22 for factors such as the vehicle or driver, temperatures, or trip types). Then a t-test for each feedback 23 design was performed to make an unadjusted estimate for each design. Several additional steps are taken 24 to refine this analysis. To adjust for changing drivers, vehicles, temperatures, and driving patterns a mixed 25 effects linear regression model was fit to the data. The regression model includes a consumption offset for 26 each driver-vehicle combination in households with more than one vehicle to account for the different 27 intrinsic efficiency of different household vehicles. Then multiple explanatory factors besides the 28 experimental treatment are added to control for the effects of temperature, trip patterns, and in drivers or 29 vehicles during the course of the experiment. Two regression models were fit to the data. The first tests 30 the average effect of feedback on fuel consumption within different driving patterns. The second tests the 31

Stillwater, Kurani 8
differential effect of the three feedback designs while controlling for driving patterns. The models and 1 interpreted output are shown in Tables 4 and 5 and Figures 1 and 2. 2
Contextual vs. Behavioral Factors 3 The agency of drivers, i.e., their freedom to act, exists within multiple layers of structure that both 4 facilitate and constrain agency. The extent of fuel consumption improvements that a driver can achieve 5 through willful changes in driving style are shaped by driving context, especially for a given trip and 6 vehicle. Contextual factors that structure the limits of the effects of feedback (and eco-driving more 7 generally) include road width and number of lanes, frequency of stops, road speeds, traffic levels, and 8 other network, regulatory, enforcement, and land-use details. To determine what changes in observed on-9 road energy use are due to driver behavior, e.g., drivers exercising their agency to ecodrive in response to 10 new energy feedback, it is essential to use a model of fuel consumption that separates contextual structure 11 from driver agency. As this study focuses specifically on driver behavior in the act of driving the vehicle, 12 e.g. ecodriving, other factors such as ambient temperature and the trip drive-cycle are contextual factors 13 exogenous to ecodriving and are therefore included as explanatory model terms to reduce unexplained 14 variance in the dependent variable and increase the precision of the behavior change estimate. 15
Triptypes16
To reduce drive-cycle variance in the model, and to assess the effectiveness of feedback in varying drive-17 cycles, trips were clustered using the K-means methodology to cluster trips according to drive-cycle 18 characteristics. The four dimensions used for clustering are the trip distance, mean speed, maximum 19 speed, and speed variance (i.e. the average sum of squared errors from the mean speed to the true speed). 20 Five distinct trip types were found using the scree-plot method (Table 3). The names are based solely on 21 the information in the table and are meant for easy reference, not as accurate descriptions of all the trips in 22 each type. 23
TABLE 3 Trip Types 24 Trip Type
Name Distance (Miles)
Mean Speed (MPH)
Maximum Speed (MPH)
Speed Variance (MPH)
1 Milk Run 1 11 29 93 2 Short Arterial 3 19 43 184 3 Cross-Town 8 32 69 502 4 Inter-City 26 48 75 571 5 Regional 79 55 79 475
RESULTS 25
T-test results 26 The t-test on the differences in mean fuel consumption between experimental periods shows a decrease in 27 fuel consumption per mile of 7% (p = 0.007). This difference is in the range of previous estimates (Table 28 1). There are differences across the three feedback designs. Those who saw the Numbers display (Figure 29 1) show a decrease of 14% (p = 0.006) during the with feedback month compared to their without 30

Stillwater, Kurani 9
feedback month. The comparative reductions are 10% (p = .018) for those who saw the Accelerator 1 display and -3.7% (p = 0.3) for the Shrubbery display, i.e., their fuel consumption increased in the 2 presence of their feedback design. 3
Per the discussion of the effects context have on energy outcomes, these overall mean differences 4 are subject to further testing for the effects of possible changes in context: ambient temperatures, an 5 individual driver’s trip patterns, and a difference in total miles driven by drivers in the two periods. In the 6 latter case, drivers who drive more miles can dominate the results, distorting the effect of the feedback for 7 any one typical driver. A mixed-effects linear model was used to estimate the average changes in on-road 8 fuel consumption by each driver due to the feedback. The model results are shown in Table 4 and shown 9 in Figure 4. 10
Regression Model Results 11 In the regression models, trips shorter than 0.25 miles are excluded to remove the effects of 12
reparking, or other periods that the vehicle may have been started and shut-off without driving. Trip type 13 1 (Milk Run) is used as the model baseline. Explanatory variables include temperature difference from 14
72F (to account for heating as well as cooling), average road grade, and an interaction effect between 15 experimental phase and trip type. Unique driver-vehicle combinations are included as the random-effect 16 grouping to control for differences in average fuel consumption between vehicle types. 17
The Trip Model (Table 4 and Figure 4) shows that there is a significant decrease in fuel 18 consumption in four of the five trip types; the exception is the regional type (79 mile mean distance, 19 55mph mean speed). 20
TABLE 4 Trip Type Model Testing Effectiveness of Feedback in Varying Driving 21 Circumstances on GP100M Fuel Consumption 22 Parameter Value Std.Error DF p-value
(Intercept) 7.8 0.21 6045 <.0001
abs(72 - temp) -0.0015 0.001 6045 0.31
grade 0.0015 0.001 6045 0.009
Feedback -0.47 0.072 6045 <.0002
Trip: Short Arterial -2.0 0.058 6045 <.0003
Trip: Cross Town -3.1 0.068 6045 <.0004
Trip: Inter City -3.8 0.073 6045 <.0005
Trip: Regional -4.1 0.13 6045 <.0006
Feedback + Trip: Short Arterial 0.18 0.09 6045 0.043
Feedback + Trip: Cross Town 0.27 0.10 6045 0.007
Feedback + Trip: Inter City 0.25 0.11 6045 0.022
Feedback + Trip: Regional 0.43 0.20 6045 0.036 N=6103 trips, 47 driver-vehicle combinations R2 = 0.49

Stillwater, Kurani 10
1
FIGURE 4 Average Fuel Consumption and Reduction in Fuel Consumption across Trip 2 Categories. Results are shown for a trip with 72° ambient temperature, 0% grade 3
4 The Feedback Design model (Table 5 and Figure 5) also regresses the independent variables on 5
the dependent variable GP100M (Gallons/ 100 Miles driven). Trips below 0.25 miles are excluded. The 6 participants who saw the Numbers feedback design are used as the model baseline. Explanatory variables 7 are the same as in the trip model. 8
The Feedback Design model results show that the differences between feedback designs are 9 smaller than suggested by the overall t-test, and importantly that group 3 (Shrubbery) likely also had a net 10 decrease in average fuel consumption in the with feedback period. Their apparent increase in the overall 11 means test appears to be due to changes in trip patterns: they either made more trips that were of a more 12 energy-intensive type in the first period, or more efficient drivers drove more frequently in the second 13 period. It is unclear if concurrent changes in trip-type, as shown in Table 6, can be partially attributed to 14 feedback, so the energy effects of trip-type shifts are currently removed from the analysis. 15
The model supports the general finding of the overall t-tests for each feedback design. Drivers 16 who saw the Numbers interface experienced the greatest improvement in fuel economy in the with 17 feedback period, followed by those who saw the Accelerator feedback, and then those who saw 18 Shrubbery. 19
TABLE 5 Group Model Testing Differential Effectiveness of the Three Feedback Designs 20 on GP100M Fuel Consumption 21
Parameter Value Std.Error DF p-value
(Intercept) 8.0 0.36 6047 <.0001
abs(72 - temp) -0.0013 0.0014 6047 0.35
grade 0.0015 0.0006 6047 0.009

Stillwater, Kurani 11
Trip: Short Arterial -1.8 0.043 6047 <.0001
Trip: Cross Town -2.9 0.052 6047 <.0001
Trip: Inter City -3.6 0.056 6047 <.0001
Trip: Regional -3.8 0.10 6047 <.0001
Feedback -0.49 0.059 6047 <.0001
Style: Accelerator -0.26 0.50 44 0.60
Style: Shrubbery -0.97 0.48 44 0.051
Feedback + Style: Accelerator 0.24 0.083 6047 0.0042
Feedback + Style: Shrubbery 0.38 0.082 6047 <.0001 N=6103 trips, 47 driver-vehicle combinations R2 = 0.48
1
2
3
FIGURE 5 Average Fuel Consumption and Reduction in Fuel Consumption across 4 Feedback Styles. Results are shown for a trip with 72° ambient temperature, 0% grade, 5 and Short Arterial characteristics (the median trip type observed in the study) 6
TABLE 6 Trip Distributions between Experimental Periods 7 Trip Type # Trips
Feedback-Off # Trips
Feedback-On % Change
Milk Run 873 679 -22% Short Arterial 1303 1067 -18% Cross-Town 716 544 -32% Inter-City 553 378 -31% Regional 103 72 -30%

Stillwater, Kurani 12
CONCLUSIONS 1 This experiment tested 1) the efficacy of in-vehicle fuel economy feedback to drivers on energy 2 consumption outcomes, and 2) the differential efficacy of three different designs of such feedback. The 3 designs are drawn from a set of comprehensive survey designs (19) and include a variety of fuel economy 4 and acceleration measures presented in graphical and numerical forms. Preliminary results from the first 5 set of 36 drivers indicate that energy consumption is reduced in the presence of feedback. Controlling for 6 contextual differences between the without and with feedback phases, the presence of three feedback 7 designs are correlated with reductions in fuel consumption of 8%, 4% and 2%, respectively, for a median 8 trip of the Short Arterial type. The type of driving appears also to be important; feedback had little or no 9 impact on energy consumption for long-distance highway driving. All other trip types showed reduction 10 in energy consumption of between 4 and 6%. A mixed-effects linear model controls for vehicle effects 11 and trip factors, e.g., drive-cycle and ambient temperature, making it possible to separate changes in trip 12 patterns from changes in driving style. In so doing, it was possible to ascertain that an apparent decrease 13 in fuel economy in the presence of one kind of feedback was likely due to differences in trip making, not 14 driving style, between the without and with feedback periods. 15
NEXT STEPS 16 This paper presented the preliminary data from a group of 36 drivers from a future total of 150 drivers in 17 a wider variety of driving contexts. This analysis will be extended to incorporate the final data set in early 18 2013. However, for larger sample tests, a more flexible mixed effects model will be used to account for 19 changes in trip patterns that could also be the result of ecodriving feedback. In addition, the driver survey 20 results and interviews from the participating drivers will be incorporated to help explain why driver 21 feedback was or was not effective, as well as to help distinguish why some feedback styles may be more 22 useful than others. Finally, a larger sample will allow an examination of the effect of feedback over time 23 to determine if the effect is increasing, stable, or decreasing over the one-month period. 24
ACKNOWLEDGEMENT 25 This research is funded by the U.S. Department of Energy through Oak Ridge National Laboratory. The 26 authors are solely responsible for the contents. 27
REFERENCES 28
[1] Greene, D. L. Driver Energy Conservation Awareness Training: Review and Recommendations 29 for a National Program. Oak Ridge National Laboratory, 1986. 30
[2] Ando, R., Y. Nishihori, and D. Ochi. Development of a System to Promote Eco-Driving and Safe-31 Driving. No. 6294, 2010, pp. 207–218. 32
[3] Barkenbus, J. N. Eco-driving: An overlooked climate change initiative. Energy Policy, Vol. 38, 33 No. 2, Feb. 2010, pp. 762–769. 34
[4] Boriboonsomsin, K., A. Vu, and M. Barth. Eco-Driving: Pilot Evaluation of Driving Behavior 35 Changes Among US Drivers. University of California, Riverside, 2010. 36
Stillwater, Kurani 13
[5] Syed, F. U., and D. Filev. Real time Advisory System for Fuel Economy Improvement in a Hybrid 1 Electric Vehicle. 2008. 2
[6] van der Voort, M. A prototype fuel-efficiency support tool. Transportation Research Part C: 3 Emerging Technologies, Vol. 9, No. 4, Aug. 2001, pp. 279–296. 4
[7] Lee, H., W. Lee, and Y.-K. Lim. The effect of eco-driving system towards sustainable driving 5 behavior. 2010. 6
[8] Larsson, H., and E. Ericsson. The effects of an acceleration advisory tool in vehicles for reduced 7 fuel consumption and emissions. Transportation Research Part D: Transport and Environment, 8 Vol. 14, No. 2, Mar. 2009, pp. 141–146. 9
[9] Satou, K., R. Shitamatsu, M. Sugimoto, and E. Kamata. Development of the on-board eco-driving 10 support system. International Scientific Journal for Alternative Energy and Ecology, Vol. 9, No. 11 852, 2010, pp. 35–40. 12
[10] Wahlberg, A. E. af. Long-term effects of training in economical driving: Fuel consumption, 13 accidents, driver acceleration behavior and technical feedback. International Journal of Industrial 14 Ergonomics, Vol. 37, No. 4, Apr. 2007, pp. 333–343. 15
[11] Driving Change: City of Denver Case Study. Enviance Corporation, 2009. 16
[12] Ajzen, I. Understanding Attitudes and Predicting Social Behavior. M. Fishbein. 17 http://search.ebscohost.com/login.aspx?direct=true&db=epref&AN=UAPSB.AJZEN.PRENTICE18 HALL.AIHJ&site=ehost-live. 19
[13] Tonglet, M., P. Phillips, and A. Read. Using the Theory of Planned Behaviour to investigate the 20 determinants of recycling behaviour: a case study from Brixworth, UK. Resources, Conservation 21 and Recycling, No. 41, Apr. 2004, pp. 191–214. 22
[14] Paris, H., and S. Broucke. Measuring cognitive determinants of speeding: An application of the 23 theory of planned behaviour. Transportation Research Part F: Traffic Psychology and Behaviour, 24 Vol. 11, No. 3, May 2008, pp. 168–180. 25
[15] Perugini, M., and M. Conner. Predicting and understanding behavioral volitions: the interplay 26 between goals and behaviors. European Journal of Social Psychology, Vol. 30, No. 5, Sep. 2000, 27 pp. 705–731. 28
[16] Jackson, T. Motivating Sustainable Consumption. Sustainable Development Research Network, 29 2005. 30
[17] Ajzen, I. Behavioral Interventions Based on the Theory of Planned Behavior. http://www-31 unix.oit.umass.edu/aizen/pdf/tpb.intervention.pdf. 32

Stillwater, Kurani 14
[18] Stillwater, T. “Comprehending Consumption: The Behavioral Basis and Implementation of Driver 1 Feedback for Reducing Vehicle Energy Use.” Ph.D. Thesis, UC Davis 2011. 2
[19] Jenness, J. W., J. Singer, J. Walrath, and E. Lubar. Fuel Economy Driver Interfaces : Design 3 Range and Driver Opinions Report on Task 1 and Task 2. 2009. 4
5