I T D V C L COMMUNICATIONS RESEARCH LABORATORY … · Yasuhiro Koyama, Tetsuro Kondo, Junichi...
44
COMMUNICATIONS RESEARCH LABORATORY V L B I T C D C R L Serial No. 21 November 2002 CONTENTS The 2nd CRL TDC Symposium ...................................................... 1 Proceedings of the 2nd CRL TDC Symposium (Kashima, September 20, 2002) An evaluation of positioning error estimated by the mesoscale non-hydrostatic model – Preliminary report – ...... 2 Ryuichi Ichikawa, Hiromu Seko, and Michael Bevis Holographic measurement of Kashima 34-m radio telescope surface accuracy – Preliminary report – ...... 3 Hiroshi Ohkubo, Tetsuro Kondo, Ikuto Yonezawa, and Hiro Osaki Dependence of correlation dimension of QSO radio wave intensity time series on red shift ...... 5 Md. M. R. Khan and N. Tanizuka S-band RFI problems at Kashima 34-m antenna and a passive filter for mit- igation ...... 9 Eiji Kawai, Hiroshi Ohkubo, Junichi Nakajima, and Jun Amagai Measurements of harmful interferences in the HF-UHF bands caused by ex- tension of power line communication bandwidth ..... 12 Fuminori Tsuchiya, Hiroaki Misawa, Tomoyuki Nakajo, Ichiro Tomizawa, Junichi Nakajima, Masatoshi Ohishi, Takayuki Ono, and Akira Morioka Advancement of Versatile Scientific Sampling Processor (VSSP) ..... 16 Hiro Osaki VLBI observations using IP-VLBI system for orbit determination of deep space spacecraft – Group delay measurements of GEOTAIL and NOZOMI telemetry signals – ..... 18 Testuro Kondo ([email protected]), Ryuichi Ichikawa, Yasuhiro Koyama, Mamoru Sekido, and Hiro Osaki (continued on inside front cover)
Transcript of I T D V C L COMMUNICATIONS RESEARCH LABORATORY … · Yasuhiro Koyama, Tetsuro Kondo, Junichi...

COMMUNICATIONS RESEARCH LABORATORY
VLB I T
CD
C R L Serial No. 21 November 2002
CONTENTS
The 2nd CRL TDC Symposium . . . . . . . . . . . . . . . . . . . . . . . . . . . . . . . . . . . . . . . . . . . . . . . . . . . . . . 1
Proceedings of the 2nd CRL TDC Symposium (Kashima, September 20,2002)
An evaluation of positioning error estimated by the mesoscale non-hydrostaticmodel – Preliminary report –
. . . . . . 2
Ryuichi Ichikawa, Hiromu Seko, and Michael Bevis
Holographic measurement of Kashima 34-m radio telescope surface accuracy– Preliminary report –
. . . . . . 3
Hiroshi Ohkubo, Tetsuro Kondo, Ikuto Yonezawa, and Hiro Osaki
Dependence of correlation dimension of QSO radio wave intensity time serieson red shift
. . . . . . 5
Md. M. R. Khan and N. Tanizuka
S-band RFI problems at Kashima 34-m antenna and a passive filter for mit-igation
. . . . . . 9
Eiji Kawai, Hiroshi Ohkubo, Junichi Nakajima, and Jun Amagai
Measurements of harmful interferences in the HF-UHF bands caused by ex-tension of power line communication bandwidth
. . . . . 12
Fuminori Tsuchiya, Hiroaki Misawa, Tomoyuki Nakajo, Ichiro Tomizawa, JunichiNakajima, Masatoshi Ohishi, Takayuki Ono, and Akira Morioka
Advancement of Versatile Scientific Sampling Processor (VSSP) . . . . . 16
Hiro Osaki
VLBI observations using IP-VLBI system for orbit determination of deepspace spacecraft – Group delay measurements of GEOTAIL and NOZOMItelemetry signals –
. . . . . 18
Testuro Kondo ([email protected]), Ryuichi Ichikawa, Yasuhiro Koyama, MamoruSekido, and Hiro Osaki
(continued on inside front cover)

International e-VLBI experiments . . . . . 23Yasuhiro Koyama, Tetsuro Kondo, Junichi Nakajima, Moritaka Kimura, HisaoUose, and Sotetsu Iwamura
Yamaguchi 32m radio telescope and an on-line observation system . . . . . 27
Kenta Fujisawa
Development of compact VLBI system . . . . . 29Ikuto Yonezawa, Junichi Nakajima, Hiroshi Ohkubo, Masato Tsuboi, and TakashiKasuga
The implementation of the PC based Giga bit VLBI system . . . . . 31
Moritaka Kimura and Junichi Nakajima
VLBI development merge into to PC commodity . . . . . 34Junichi Nakajima, Moritaka Kimura, Yasuhiro Koyama, Hiro Osaki, and TetsuroKondo
Current status of the VERA . . . . . 36
Osamu Kameya, Hideyuki Kobayashi, and the VERA team
VSOP-2, a next generation space-VLBI mission . . . . . 38
Yasuhiro Murata, Hisashi Hirabayashi, and members of Space VLBI WG
- News - News - News - News -
Farewell ceremony of Kashima 26-m antenna . . . . . . . . . . . . . . . . . . . . . . . . . . . . . . . . . . . . . 41

November 2002 1
The 2nd CRL TDC Symposium
Yasuhiro Koyama ([email protected])
Kashima Space Research CenterCommunications Research Laboratory893-1 Hirai, Kashima, Ibaraki 314-8501, Japan
As a Technology Development Center (TDC)of the IVS, Communications Research Laboratory(CRL) had held IVS Technology Development Cen-ter Meeting twice every year until March 2001.The laboratory has executed a transition from anagency belonging to the Japanese government toIndependent Administrative Institution on April 1,2001. After the transition, the IVS Technology De-velopment Center Meeting was reformed to make ita symposium and we started to call for contributedpapers from broader community. Originally, thesecond symposium was to be held in March 2002,but was postponed until this time because therewas the Second IVS General Meeting in February2002. The second IVS Technology DevelopmentCenter Symposium was then held on September20, 2002 at the large conference hall of the mainresearch building in the Kashima Space ResearchCenter. At the symposium, 17 oral presentationsand 4 poster presentations were given and duringthe day.On the same day, the farewell ceremony of the
26m antenna in the Kashima Space Research Cen-ter was held since it will close its history soon. Theantenna had been a symbol of the geodetic VLBIresearch in Japan. Motions of the plates aroundJapan and inter-plate deformations were activelyinvestigated by using the antenna. The positionof the reference point of the antenna based onthe International Terrestrial Reference Frame wasused as the essential reference to establish Geode-tic Coordinates 2000 which was officially adoptedas a national coordinate system of Japan. Con-trastively, the importance of the geodetic VLBI hasbeen gradually changing from positioning capabil-ity to the unique ability to determine Earth’s orien-tation independently from any other space geode-tic techniques. Reflecting this fact, many pre-sentations given in the symposium were relatedwith the developments of the e-VLBI systems andPC based observation/correlation systems whichare expected to improve the current turn aroundtime of the geodetic VLBI data processing to de-termine Earth Orientation Parameters, especiallyUT1-UTC. There were also many presentations
about the application of the e-VLBI to determineprecise orbit of planetary space-crafts in near real-time.The symposium was coincidently held just when
the old symbolic antenna is closing its history (seepage 41 for details), but it certainly opened a newwindow for future directions of the geodetic VLBIresearch and developments.
Pictures taking on the second CRL Technology De-velopment Center symposium held on September20, 2002. The picture at the top is at the auralsession. At the middle, symposium participants,and the bottom, at the poster presentations.

2 IVS CRL-TDC News No.21
An Evaluation of Positioning
Error Estimated by theMesoscale Non-HydrostaticModel –Preliminarily report–
ICHIKAWA Ryuichi1 ([email protected]),SEKO Hiromu2, and Michael BEVIS3
1Kashima Space Research CenterCommunications Research Laboratory893-1 Hirai, Kashima, Ibaraki 314-8501, Japan
2Meteorological Research Institute3University of Hawaii
We are now evaluating atmospheric parameters(equivalent zenith wet delay and linear horizontaldelay gradients) derived from slant path delays ob-tained by ray-tracing through the non-hydrostaticnumerical weather prediction model (NHM) with1.5 km horizontal resolution. Our ultimate pur-pose is to establish a new method for reducing at-mospheric effects on geodetic positioning. We firstseek to establish the level of positioning error dueto intense mesoscale phenomena such as the pass-ing of cold fronts, heavy rainfall events, and severestorms. The NMH provides temperature, humidityand pressure values at the surface and at 38 heightlevels (which vary between several tens meters andabout 35 km), for each node in a 1.5 km by 1.5 kmgrid that covers Izu peninsula of the central Japanand surrounding ocean.We performed ray tracing experiments for the
entire grid of the NHM at one epoch of the 1200UT 3/7/1997. For each station we invert the sim-ulated data set, consisting of 52 slant delays, usingan isotropic and an anistropic delay model. Theisotropic model has only one parameter – the zenithwet delay (ZWD). The anisotropic delay model ofChen and Herring (1997) has two additional lateralgradient parameters. We compare the ‘true’ ZWD,computed by directly integrating the wet refrac-tivity field of NHM, with the ZWD estimated byleast squares inversion of the ‘observed’ slant de-lays obtained by ray tracing. We did this using theisotropic and the anistropic delay models.Figure 1 shows the zenith wet delays (ZWDs)
computed using ray tracing based on the verticalprofile of the NHM. Gradient vectors estimated us-ing least squares inversion of ray-traced slant delaysare also indicated (white allows). A characteristicZWD pattern caused by the mountain lee wavesis presented in this figure. At the east of the Izupeninsula ZWDs are lying in a north-south bandabout 10km in width and about 50km in length.This ZWD pattern is consistent with the observed
0.00.51.01.52.02.53.03.54.04.55.05.56.06.57.07.58.08.59.09.510.010.511.011.512.0cm
139°E
35°N
0 50km5cm
Zenith W
et Delay
Figure 1. Zenith wet delay retrieved by the 1.5kmNHM at the 1200UT of March 7, 1997. Arrowsindicate gradient vectors estimated by the best-fitanisotropic model to the slant delays using ray trac-ing through the NHM.
GMS cloud image [Shimada et al., 2002]. Largegradient vectors are perpendicular to the north-south ZWD band. In addition the biggest gradientsoccur at the northern part of the peninsula wheretopographic variations produce a much more com-plex distribution of water vapor.We are now numerically examining positioning
errors calculated from the slant delays through theNHM, assuming realistic GPS and VLBI position-ing. In the another paper we will present the be-havior of the positioning errors under the atmo-spheric disturbance in local scale, the relation be-tween the ZWD errors and the vertical position-ing errors, and the efficiency of the reduction ofthe azimuthal anisotropy of the atmosphere usingthe anisotropic mapping function [e.g. MacMillan,1995; Chen and Herring, 1997].
References
Chen, G. and T. A. Herring, Effects of atmospheric az-imuthal asymmetry on the analysis of space geodeticdata, Geophys, Res. Lett., 102, 20489-20502, 1997.
MacMillan, D.S., Atmospheric gradients from very longbaseline interferometry observations, Geophys, Res.Lett., 22, 1041-1044, 1995.
Shimada, S., H. Seko, H. Nakamura, K. Aonashi, andThomas A. Herring, The impact of atmosphericmountain lee waves on systematic geodetic errors ob-served using the Global Positioning System, EarthPlanets Space, 54, 425-430, 2002.

November 2002 3
Holographic measurement of
Kashima 34-m radio telescopesurface accuracy –Preliminaryreport–
Hiroshi Ohkubo1 ([email protected]),Tetsuro Kondo1, Ikuto Yonezawa2,and Hiro Osaki1
1Kashima Space Research CenterCommunications Research Laboratory893-1 Hirai, Kashima, Ibaraki 314-8501, Japan
2Ibaraki University2-1-1 Bunkyo, Mito, Ibaraki 310-8512, Japan
1. Introduction
We have planned to measure surface accuracyof Kashima 34-m antenna using a microwave holo-graphic technique. It had been difficult to carryout holographic measurement, because there wasno reference antenna exists near Kashima 34-m an-tenna site. To realize a holographic measurementwe adopted CARAVAN 0.65-m antenna [Yonezawaet al., 2002] as a reference antenna. A geostation-ary satellite, N-star b, was used as a reference radiosource in a far-field region.Only a few satellites are matched with a fre-
quency and AZ/EL position requirement of ourmeasurement system. We are working on dataanalysis and have not reached result yet. In thisreport, we will introduce a measurement systemand a result of experimental observation briefly.
2. Measurement
2.1 Theory
A microwave holography is technique to measurea far-field pattern of test antenna using a referenceantenna. Then applying the Fourier Transform tofar field pattern to get aperture distribution of am-plitude and phase of test antenna. Aperture dis-tribution of phase error is considered to representsurface error of reflector. Figure 1 shows relation-ship between near-field aperture phase distributionpattern and far-field phase pattern.
2.2 Measurement system
During measurements, the Kashima 34-m andthe CARAVAN 0.65-m antennas observe signalfrom the geostationary satellite N-star b (see Fig-ure 2). Elevation of satellite from Kashima site is48.02 deg.Figure 3 shows a diagram of holographic mea-
surement data acquisition system. RF signals atKashima 34-m and CARAVAN 0.65-m station arefed to down converters and each 0-2GHz IF sig-nal are fed to video converter. Outputs of videoconverters, 2 channel 2MHz video signals, are fi-nally fed to the VSSP (Versatile Scientific Sam-pling Processor) [Osaki et al., 2002], then sampled
Figure 1. Near-field(Left) and Far-field (Right)phase pattern.
Figure 2. Kashima 34-m antenna and CARAVAN0.65-m antenna are used to receive the geostation-ary sattelite N-star b.
Figure 3. Microwave holographic measurementdata acquisition system.
and stored on HDD. Sampling rate is 4MHz 4bit1ch for each station. Data are stored in HDD, thenprocessed by software correlator.
2.3 Antenna maneuver
On the first attempt of our measurement, we ac-quired data at each 1024 (32×32) points. After

4 IVS CRL-TDC News No.21
Figure 4. Antenna maneuver.
Figure 5. Phase fluctuation of measurement sys-tem.
data processed, we found that phase connectivitybetween each observation is not good. Thus in thesecond attempt, we changed antenna scan pattern.Using radial and raster scan (Figure 4), data wasacquired continuously during a scanning process.Radial scan is thought to be shorter observationtime because beam center is measured at each scan.Although raster scan consumes observation time,the data processing will be easier. At this momentwe took data of both scan pattern.
3. System error estimation
Figure 5 shows correlated phase during experi-mental observation. During this observation testantenna received signal from the satellite in cen-ter of beam. From this result, phase stability ofthe system is measured to 0.028 degree/sec. Thisantenna scanning process takes about 16 minutes.Hence phase fluctuation of measurement systemwill contribute measurement error of 1.1 mm. Pre-viously we estimated that local oscillator phase er-ror contributed as large as 0.85 mm.
4. Conclusion
The holographic measurement of the Kashima34-m antenna is in progress. Antenna scan pat-tern was improved but estimated phase error ofthe system is still large. Main reason comes fromdue to a local oscillator phase error of the referencetelescope. Now we are improving the system andwe will present the results of holographic measure-ments to improve system.
References
Osaki, H., T. Kondo, and M. Kimura, CRL IVS TDCnews No. 20, pp. 7-9, 2002.
Yonezawa, I., J. Nakajima, H. Ohkubo, M. Tsuboi, andT. Kasuga, CRL IVS TDC news No. 21 (this issue),pp. 29-30, 2002.

November 2002 5
Dependence of Correlation Di-
mension of QSO Radio WaveIntensity Time Series on RedShift
Md. M. R. Khan1
([email protected])and N. Tanizuka1,2
([email protected])1Graduate School of Science
Osaka Prefecture University1-1 Gakuen-cho, Sakai, 599-8531 Japan
2College of Integrated Arts and SciencesOsaka Prefecture University1-1 Gakuen-cho, Sakai, 599-8531 Japan
Summary: The variation of the radio wave inten-sity with time from the quasars (QSOs) at cosmo-logical distance are unpredictable because of un-known dynamical structures of the radio sourcesand the external factors effected on the path ofwave propagation. In this paper, the prelimi-nary analysis results of the time series data of thequasars of S band (2 GHz) and X band (8 GHz)are presented.The purpose of our study is to calculate the de-
gree to which the presumed dimension of the dy-namical system are limited from the Grassberger-Procaccia (GP) method by correlation integration.
1. Introduction
In our previous study, time series data of QSOradio wave flux density were analyzed on the standpoint of Higuchi’s fractal dimension, Hurst expo-nent, power spectrum etc. Khan et al. [1]. Thecalculated results were plotted and compared withrespect to red shift. In that results, we did notget any information about the effect of externalnoise. In the present analysis, a convolution timeseries has been calculated from the original radiowave time series. Then the correlation dimensionsfor both time series have been calculated and plot-ted with respect to red shift. In these results, anew notion has been probed that inevitable exter-nal noise may be accumulated on the original radiowave at the time of the wave passing through thespace from the cosmological distance.
2. Analysis Methods
2.1 Convolution Time Series
To calculate the convolution time series, we haveprocessed the convolution operation on the mi-crowave time series data with some kernel values.For example, let us consider, “list1” is the kernelvalues, “list2” is the time series data, then the re-sulted values of convolution operation is shown in
“result” list.
list1 = {A, B, C, D, E}list2 = {a, b, c, d, e, f, g, h, i, j, k, l, m, n}result = { (Aa + Bb + Cc + Dd + Ee), (Ab + Bc+ Cd + De + Ef), (Ac + Bd + Ce + Df + Eg),(Ad + Be + Cf + Dg + Eh), (Ae + Bf + Cg + Dh+ Ei), (Af + Bg + Ch + Di + Ej), (Ag + Bh + Ci+ Dj + Ek), (Ah + Bi + Cj + Dk + El), (Ai + Bj+ Ck + Dl + Em), (Aj + Bk + Cl + Dm + En) }
If the length of original data is x and the lengthof kernel is y, then the length of convolution datawill be (x - y + 1). For example, here the lengthsof “list2” is 14 and length of “list1” is 5. So, thelength of “result” is (14 - 5 + 1) = 10.
In our analysis, we have used the kernel values,Wolfarm [2] as follows
16.1
√2π
Exp(− n2
100) (1)
where n = - 10 to 10, which gives us the folloinglist of kernel values.kernel = {0.0240595, 0.0290939, 0.0344851, 0.040066,
0.0456283, 0.0509339, 0.0557305, 0.0597714, 0.062836,
0.0647496, 0.0654004, 0.0647496, 0.062836, 0.0597714,
0.0557305, 0.0509339, 0.0456283, 0.040066, 0.0344851,
0.0290939, 0.0240595}and
∑(kernel) = 1 (2)
2.2 Correlation Dimension and Multidi-mensional Embedding Spaces
We have used the Grassberger-Procaccia (GP)method to calculate correlation dimension formulti-dimensions, Hilborn [3]. We have calculatedthe correlation sum by
C(m)(r) =1N2
N∑
i,j=1&i �=j
θ(r− | �xi − �xj |) (3)
where θ(t) is the Heavicide step function and θ(t)= 0 if t < 0 and θ(t) = 1 if t ≥ 0, andm denotes thedimensions. m-dimensional vector is the collectionof m components
�xi = (xi, xi+τ , xi+2τ , ..., , xi+(m−1)τ ) (4)
here τ is the time lag and it represents the timeinterval between the successively data values thatwe have used to construct the vector �xi.The “length” of the difference between the two
vectors is usually taken to be the “Euclideanlength”
| �xi − �xj |= √(m−1∑
k=0
{xi+kτ − xj+kτ}2) (5)

6 IVS CRL-TDC News No.21
Finally, we have calculated the correlation di-mension from the following equation for some rangeof r values which is called the scaling region.
C(m)(r) = kr−Dc(m) (6)
2.3 Embedding Theorem
Given a dynamical system with a m-dimensionalsolution space is x(t) = fs(x(t)). Let, y(t) be someobservation and y(t) = g(x(t)), and v(x) = (g(x),g(fs(x)), ..., g(fm−1
s (x))) be the lag vector.The embedding theorem states that if the system
produces orbits in the original state space that lieon a geometric object of dimension Dc (which neednot be integer), then the object can be seen withoutany spurious intersections of the orbit in anotherspace of integer dimension m and
m > 2Dc (7)
that is also known as Fractal time delay embeddingprevalent theorem, Abarbanel [4].
3. Result and Discussion
The original time series, after primary noise elim-ination and compensating missing values, is shownin Fig. 1, Khan et al. [1] and the convolution timeseries is shown in Fig. 2 of source 0336-019 at 2GHz of GBI observation. Fig. 3 and 4 show thethree dimensional state space map for original andconvolution time series respectively at time lag 5days.Table 1 shows the list of sources observed by Key
Stone Project (KSP), Koyama et al. [5], [6]. Ta-ble 2 shows the list of sources observed by GreenBank Interferometer (GBI) [7]. Column 1 through4 show IAU source designation, red shift, correla-tion dimension (S & X band) and % of missingvalue (S & X band).Fig. 5 shows the relationship between correla-
tion exponents and phase space dimension for orig-inal and convolution time series. In this figure, thecorrelation dimensions (about 2.5) for convolutiontime series clearly satisfy the embedding theorem(equ. 7). But for original time series, the corre-lation dimension (about 5 - 6) do not satisfy theembedding theorem all time.Fig. 6 shows the relationship between redshift
and correlation exponents at 10th dimension, whichwe defined here the correlation dimensions of thesystems’ dynamics, of GBI observation. This figureshows us an important information that, for thecase of original data, the correlation dimensionshave apparent dependence on redshift except thesquired one1 ; in case of convolution data, it seemsthere is less dependence of correlation dimensionson red shift.
1Most of the sources, we have analyzed about 1000 daysdata. But for the squired source as shown in Fig. 6, we haveanalyzed only 300 days data which we can ignore.
Fig. 7 shows the relationship between red shiftand correlation dimension and Table 1 shows thevalues of correlation dimensions of KSP observa-tion. In this case, we have used about 1000 day’sdata on daily basis and for most of the sources wegot 50% or more missing values. On observation,some portions of data are observed on daily ba-sis and other portions are observed on every afterone day basis. If we take the data on every afterone day basis, the data range is about 500 or less,which is very few data to get effective result. In thisanalysis, about 50% data are compensated by theaverage of neighbour values. As a result, for mostof the sources we got the correlation dimensions liebetween 3 to 5.
4. Conclusion
The difference between the correlation di-mension of the original time series and the convo-lution time series increases as the red shift increases(as shown in Fig. 6). The difference of their de-pendence on the red shift might be concluded al-ternatively as follows:
1. The original time series data is superimposedby external noise on passing through the wavepropagation media. The result of the convo-lution may reflect the source dynamics in ahigher manner.
2. The original time series data reflects directlythe source dynamics, if there is negligible effecton the wave through its propagation.
References
[1] Md. M. R. Khan, N. Tanizuka, ”ComparativeTime Series Analysis of Radio Wave Intensity ofthe QSOs observed by VLBI (KSP) and GBI”,Proceedings of the First CRL TDC Symposium,(Kashima, Japan, Sept. 19, 2001) pp. 4-7, IVS CRL-TDC News No. 19. Technology Development Cen-ter News, Communication Research Laboratory, SerialNo. 19, November 2001. Web: http://www2. crl.go.jp/ka/radioastro/tdc/news 19/pdf/news19 index.pdf pp.4 ・7.
[2] Wolfarm, S., The Mathematica book, Mathematica Ver-sion 4, Cambridge University Press, 904 - 908.
[3] Hilborn, Robert C., Chaos and Nonlinear Dynamics,Oxford University Press, 367 - 485, New York, 1994.
[4] Abarbanel, Henry D. I., Analysis of Observed ChaoticData, Springer, 11 - 23 and 39 - 67, New York, 1996.
[5] Y.Koyama, T.Kondo: Microwave flux density variationsof compact radio sources monitored by real-time VeryLong Baseline Interferometry, Radio Science, Vol. 36,No.2, pp.223-235, Mar./Apr. 2001. (also in Web site [6])
[6] http://ksp.crl.go.jp/index-j.html
[7] http://www.gb.nrao.edu/fgdocs/gbi/gbint.html 2
2The Green Bank Interferometer is a facility of the Na-tional Science Foundation operated by the NRAO in supportof NASA High Energy Astrophysics programs.

November 2002 7
44000 44500 45000 45500 46000 46500 47000
Day
1.6
1.8
2
2.2
2.4
2.6
2.8
Jy
Figure 1. Original time series.
44000 44500 45000 45500 46000 46500 47000
Day
1.8
2
2.2
2.4
2.6
2.8
Jy
Figure 2. Convolution time series.
Figure 3. 3D phase space map for original timeseries.
Figure 4. 3D phase space map for convolutiontime series.
Table 1. KSP Observational DataSource Red Correlation dimensions % of Missing valuesName shift S Band X Band S Band X Band
0059+581 ... 2.741 2.843 53.12 59.180727-115 ... 2.603 3.915 51.27 52.730316+413 0.017 3.966 5.512 50.39 51.371226+023 0.16 3.970 4.965 50.78 51.861921-293 0.35 3.841 3.010 51.56 53.321253-055 0.54 3.230 4.848 51.56 52.641334-127 0.54 4.618 3.880 51.76 52.831641+399 0.59 3.736 3.508 50.68 51.170923+392 0.70 4.444 4.135 50.59 51.662251+158 0.86 3.365 3.057 50.29 51.071730-130 0.90 1.882 2.180 79.98 82.420420-014 0.92 3.963 5.311 50.78 52.052145+067 0.99 4.816 4.792 50.39 50.881308+326 1 4.780 5.483 50.78 52.252134+004 1.93 7.217 7.181 50.39 50.980552+398 2.37 4.531 3.657 60.74 62.01

8 IVS CRL-TDC News No.21
Table 2. GBI Observational DataSource Red Correlation dimensions % of Missing valuesName shift Origina Data Convolution Data
z 2 GHz 8 GHz 2 GHz 8 GHz 2 GHz 8 GHz0300+470 0.475 2.33 5.60 1.14 1.14 2.66 2.660133+476 0.86 3.50 4.15 2.20 2.15 21.96 17.380235+164 0.94 3.85 2.24 1.69 1.65 7.52 7.520333+321 1.26 3.87 2.62 2.69 1.40 18.33 17.700202+319 1.47 2.56 4.52 1.30 2.71 21.50 20.240215+015 1.715 4.85 6.82 2.55 2.04 13.90 14.360237-234 2.225 7.20 8.55 3.15 2.48 16.68 16.68
Figure 5. Correlation exponents vs phase spacedimension of 0336-019 at 2 GHz of GBI obser-vation.
Figure 6. Relationship between red shift andcorrelation dimensions for GBI observationalData, in legend, Org for original time seriesand Con for convolution time series.
Figure 7. Relationship between red shift and correlation dimensions for KSP observational Data

November 2002 9
S-band RFI problems at
Kashima 34-m antenna anda passive filter for mitigation
Eiji Kawai1 ([email protected]),Hiroshi Ohkubo1, Junichi Nakajima1,and Jun Amagai2
1Kashima Space Research CenterCommunications Research Laboratory893-1 Hirai, Kashima, Ibaraki 314-8501, Japan
2Yokosuka Radio Communications ResearchCenterCommunications Research Laboratory3-4, Hikarino-oka, Yokosuka-shi, Kanagawa239-0847, Japan
1. Introduction
Severe RFI at an S-band due to a third-generation mobile phone system (IMT-2000)1 oc-curred at Kashima 34-m antenna in December2001. KSP-VLBI observations had been interferedat Koganei since July, 2001 due to a nearby trans-mitting station [Amagai et al., 2001]. Fortunatelywe could mitigate RFI by inserting a passive filterto an LNA output in both Koganei and Kashimacases. However the third-generation system is theworldwide standard, so that geodetic VLBI receiv-ing dual S and X bands may be seriously affectedby this system in near future.
2. RFI due to IMT-2000
Figure 1 shows an example of spectra at the S-band IF signals of Kashima 34-m antenna after theIMT-2000 service started. An IF amplifier was sat-urated due to strong signals transmitted from anIMT-2000 base station located several kilometersapart from Kashima 34-m antenna. An example ofbase stations is shown in Figure 2. As a frequencyband assigned to the IMT-2000 is partly overlappedwith that of Kashima 34-m antenna (Figure 3), itwas essentially impossible to avoid severe interfer-ences. To investigate a way to mitigate RFI prob-lems, firstly we checked up whether an LNA wassaturated or not. The linearity of the LNA wasmeasured by switching a noise diode power on/offwith receiving maximum RFI signals (Figure 4).Results were compared with those measured fora cold load input, then it was confirmed that the
1IMT-2000 (International Mobile Telecommunications-2000) is the ITU (International Telecommunication Union)globally coordinated definition of the next generation ofmobile service covering key issues such as frequency spec-trum use and technical standards (see http://www.imt-2000.org/portal/index.asp for details).
Figure 1. An example of RFI spectrum at the S-band IF of Kashima 34-m antenna. Frequency ofO Hz corresponds to 2020 MHz in the sky.
Figure 2. A top portion of a typical base stationfor the mobile phone system.
LNA was not yet saturated. Followed by, necessaryattenuation to prevent an IF amplifier from a sat-uration was determined as follows. An IF outputwas monitored with changing the attenuation valueof the LNA output. When we inserted 42.7 dB at-tenuation in total to the LNA output, saturationof IF output disappeared (Figure 5). Necessary at-tenuation is, hence, estimated to be 60 dB takinginto account an 11 dB margin that is expected un-der more crowded traffic condition.

10 IVS CRL-TDC News No.21
New S-band
Old S-band
IMT-2000
2100 2200 2300 2400Frequency (MHz)
New S-band
Old S-band
IMT-2000
2100 2200 2300 2400Frequency (MHz)
Figure 3. Frequency allocation of IMT-2000.
Figure 4. A schematic block diagram of S-band re-ceiving system of Kashima 34-m antenna on a lin-earity measurement.
ATT=42.7dBATT=42.7dBATT=42.7dB
Figure 5. An S-band IF spectrum when the LNAoutput attenuation is 42.7 dB.
3. A passive band pass filter
We ordered a band pass filter (BPF) that hascharacteristics shown in Figure 6. The BPF has asufficient attenuation value at RFI frequencies. Weput the BPF between the LNA output and the IFinput (see Figure 7). Figure 8 shows an IF spec-trum after the BPF was installed. As a result thebandwidth of S-band has become narrow by 100MHz as compared with before, we can make anS-band observation again. Now frequency range
START 2 100 MHz
CH2 S21 log MAG 10 dB/ REF 0 dB
STOP 2 600 MHz
Figure 6. The characteristics of filter inserted toLNA output.
Figure 7. An Filter inserted to LNA output.
available to use for an S-band observation is 2250–2350MHz.
4. Concluding remarks
We experienced a severe RFI at the S-band ofKashima 34-m antenna. Fortunately we could mit-igate RFI by installing a passive band-pass fil-ter to an LNA output. However, it is expectedto increase the number of IMT-2000 user year byyear. Moreover it is also supposed that anothermobile phone company will start an IMT-2000 ser-vice at Kashima in the near future. If RFI becomesstronger than the present situation, it will result in

November 2002 11
Table 1. The characteristics of filters
Existing Filter HTS Filter(70K operation)
Passband 2250–2450 MHz 2200–2400 MHzAttenuation >60 dB at 2170 MHz >80 dB at 2170 MHzInsertion Loss <1 dB <0.5 dB
Tsys when setting 72K+62K(at 296K)=134K 72K+8K(at 70K)=80Kat LNA inputDimensions (mm) 260×42×27 φ60×14
Figure 8. An S-band IF spectrum after filter inser-tion.
the saturation of LNA. If it occurs, we have to in-sert any filter in front of the LNA, which causes asystem temperature increase. To reduce the systemtemperature as small as possible, we are investigat-
ing the feasibility of the use of a high-temperature-superconductor (HTS) filter that has a low loss andlow noise features. Table 1 summarizes the char-acteristics of conventional filter and those of HTSfilter. We are planning to test an HTS filter usingKashima 34-m antenna. If it shows a good perfor-mance, we will replace the current filter to the HTSone.
Acknowledgement: We wish to thank NTT Do-CoMo Inc. for their helpful cooperation to carryout RFI measurements before regular IMT-2000service started. We also would like to thankDENSO CORPORATION Research Laboratoriesfor their aggressive contribution to develop an HTSfilter worked at an S-band.
Reference
Amagai, J., H. Kiuchi, and K. Sebata, The sig-nal of a third-generation mobile system, IMT-2000,jams KSP VLBI observations, IVS CRL-TDC News,No.19, pp.10, 2001.

12 IVS CRL-TDC News No.21
Measurements of Harmful In-
terferences in the HF-UHFBands Caused by Extensionof Power Line Communication
Bandwidth
Fuminori Tsuchiya1
([email protected]),Hiroaki Misawa1, Tomoyuki Nakajo1,Ichiro Tomizawa2, Junichi Nakajima3,Masatoshi Ohishi4, Takayuki Ono1, andAkira Morioka1
1 Graduate School of Science, Tohoku Univ.Aramaki Aza Aoba, Aoba-ku, Sendai, 980-8578,Japan
2 Univ. of Electro-Communications1-5-1 Chofugaoka, Chofu-shi, Tokyo 182-8585,Japan
3 Kashima Space Research CenterCommunications Research Laboratory893-1 Hirai, Kashima, Ibaraki, 314-8501, Japan
4 National Astronomical Observatory2-21-1 Osawa, Mitaka, Tokyo, 181-8588, Japan
1. Extension of the PLC Bandwidth
Power line communication (PLC) has becomeavailable for a low bit rate network which is permit-ted to use the frequency range from 10 kHz to 450kHz. Due to the limited bandwidth for the cur-rent PLC system, maximum data rate is limited.Recently, the fast power line telecommunicationequipments to archive data rates of several Mbit/sare developed, and the broadband PLC system byextending the available frequency bandwidth up to30 MHz is proposed. However, because power linesare designed not for telecommunication line but 50Hz power distribution, high power transmission isrequired and the power lines emit substantial levelof electromagnetic noise in HF. In HF band, thereare a lot of radio stations for broadcasting, ama-teurs, air-traffic control, and so on. If the PLCusing HF band becomes operational, large portionof HF spectrum may become unusable for them.HF band is also worth for scientific observationsof earth’s ionosphere, planets in the solar system,and astronomical objects. These observations havesignificantly contributed to understand the envi-ronment of the earth and scientific truth. Becausethe received signal level is usually very weak in thecase of the scientific observations, it is feared thatinterferences from the power lines disable scientificobservations.
The electromagnetic interference (EMI) prob-lems described above had been investigated fromApril to July in 2002 by the PLC study grouporganized by the Ministry of Public Manage-ment, Home Affaires, Post and Telecommunica-tions (MPHPT) in Japan. The study group helda working group on the field experiments and ex-ecuted collaborated field experiments of the PLCfacility. In July 8-9 and 23-24, field experimentswere carried out at Mt. Akagi in Gunma Prefec-ture, Japan. In the experiments, we measured in-terferences leaked from the PLC facility in HF andUHF bands in order to evaluate influences of theexpansion of PLC bandwidth on the radio astro-nomical observations and examine the presence ofspurious emissions over higher frequency. In thispaper, we report the experimental results in thefield experiments, and compare the PLC noise withthe galaxy background level and the limit of harm-ful interference for radio astronomical observationwhich is given in Recommendation ITU-R RA769-1.
2. Field Experiment of the PLC Facility
Figure 1 shows the configuration of the field ex-periment of the PLC facility at July 24. Powerlines used for the experiment were extended be-tween electric poles (poles #1, #2, and #3 in Fig-ure 1) and a model house which was electromag-netically shielded by wire meshes. Table 1 showsa list of PLC modems tested in the experiment.The “in-house” PLC system was set up inside themodel house. Three pairs of laptop-type personalcomputers were connected into wall sockets by wayof the PLC modems (No. 5/6, 7/8, and 9/10 in Ta-ble 1). The “access” system was set up between themodel house and the electric poles. Two pairs ofmodems were tested as the access system (No. 1/2and 3/4). The modems and the computers con-nected at the outdoor side of power lines were seton the pole #2. All the experimental data shownin this paper are measured at July 24.
3. Interferences in HF Band
Purpose of the experiment in HF band is to mea-sure the interference level emitted from the PLCfacility and examine the propagation characteris-tics in order to evaluate safety distance betweenthe PLC facility and a radio astronomical observa-tory. Two sets of equivalent T2FD antennas wereset up at distances of 57 m and 180 m apart fromthe pole #2 (T2FD #1 and #2 in Figure 1, respec-tively). Height of each antenna from the groundwas about 5 m. Outputs from the T2FD antennaswere directly connected with spectrum analyzersand the radio spectra were measured in HF band.

November 2002 13
Figure 1. Map of the experiment site. Details aredescribed in the text.
For the quantitative measurements, we obtained 10spectral traces for one spectrum measurement thenevaluated the deviations of the measurements.Figure 2 shows one of the results of the spec-
tral measurements. When the PLC system wasnot in operation, a lot of broadcasting bands wereappeared over flat noise floor which representednoise level of the spectrum analyzer. After the mo-dem 3/4 which was tested as an access system wasturned on, significant increase of the noise floor wasobserved in the frequency range from 4 to 20 MHzwhich was just used by the operational modem (seeTable 1). There were some narrow drops in theincreased noise floor at frequencies of 7, 10, 14,and 18MHz, which were identical with frequenciesof notch filters in the modem unit. These char-acteristics indicated that increased noise level wascaused by the PLC facility. As shown in the fig-ure, many broadcasting signals were interfered andsome of them were completely masked by the PLCnoise. The increase of the noise floor was also iden-tified in the case of the modem 1/2, but about 5dB smaller than that of the modem 3/4. In thecase of the other modems tested as the in-housesystem, distinct increases of the noise floor werenot observed because the in-house system was setinside the shielding room.Distance dependence of the PLC noise level was
examined assuming that the leakage electric fieldE is proportional to the power low of distance r,
Figure 2. Typical HF spectrum measured by T2FD#1 when the PLC system was not in operation(top) and was running with the modem 3/4 (bot-tom). Error bars represent the standard deviationof signal intensity with the resolution bandwidth(RBW) of 10 kHz.
Table 1. PLC modems used for the field experi-ment.
Modulation Freq. Range SystemNo. Principal [MHz] Type1/2 OFDM 4.3–20.9 access3/4 SS 4.0–20.0 access5/6 Multi-Carrier 2.622–11.202 in-house7/8 OFDM 3.8–11.8 in-house9/10 OFDM 7.9–22.8/3.8–17 in-house
that is, E = E0r−α. From the measurements using
two T2FD antennas, the power index α distributedfrom 0.5 to 1.0 depending on frequency. The reasonwhy the calculated index was smaller than that ofthe far field electric wave of 1.0 may be because thesource of the PLC noise was distributed along thelong power line cable.In order to evaluate the interference level quan-
titatively, the T2FD antennas were calibrated. Astandard loop antenna (Antitsu MP414B) was setjust below the T2FD antenna, and we measuredelectric field intensity of some broadcasting fre-quencies simultaneously and calculated antenna

14 IVS CRL-TDC News No.21
Figure 3. Comparison plot for a HF spectrum mea-sured by T2FD #1 during all the PLC modemswere running (upper line) and estimated galacticlevel (lower line).
factors of T2FD in HF range. Figure 3 shows aresult of comparison between the PLC noise andgalactic level calculated by referring known galac-tic spectra (Alexander et al, 1969; Hartz, 1969) andthe calibrated antenna factors. The PLC noise ex-ceeded the level of galactic noise with more than30dB.
4. Spurious Emission in UHF Band
UHF band is an earth-based window for theradio astronomical observation and high sensitivemeasurements of weak radio sources are possible.Although the broadband PLC system dose not usesuch a higher frequency band, it is necessary to con-firm the level of spurious emissions from the PLCfacility because the system noise temperature inUHF band is very low in the radio astronomical ob-servations. A log-periodic antenna (Create Design,CLP-5130-1) and a receiver were set up at a dis-tance of 55 m apart from the pole #2 (UHF #2 inFigure 1), and sometimes moved at a distance of 35m (UHF #1). The receiver consisted of a high passfilter, low noise pre-amplifier, and wide band am-plifier. The pre-amplifier had a power gain of 40 dBat the center frequency of 327 MHz, the bandwidthof about 20 MHz, and the minimum noise figure of0.8 dB. The high pass filter whose cut off frequencywas 260 MHz prevented the saturation of the pre-amplifier by strong broadcasting signals in VHFrange. Spectra around 327 MHz were measured byspectrum analyzers, and automatically recorded bya personal computer via GPIB interface. In orderto check that the spurious emissions were actuallyoriginated from the PLC facility, we measured theHF spectra simultaneously and examined depen-dences of spurious emission on distance and direc-tion from the PLC facility.
Figure 4. Dynamic spectrum around the frequencyof 327 MHz. Corresponding to the turning off ofthe modem 3/4 at 15:04, the broadband noise andsome narrow band emissions were disappeared.
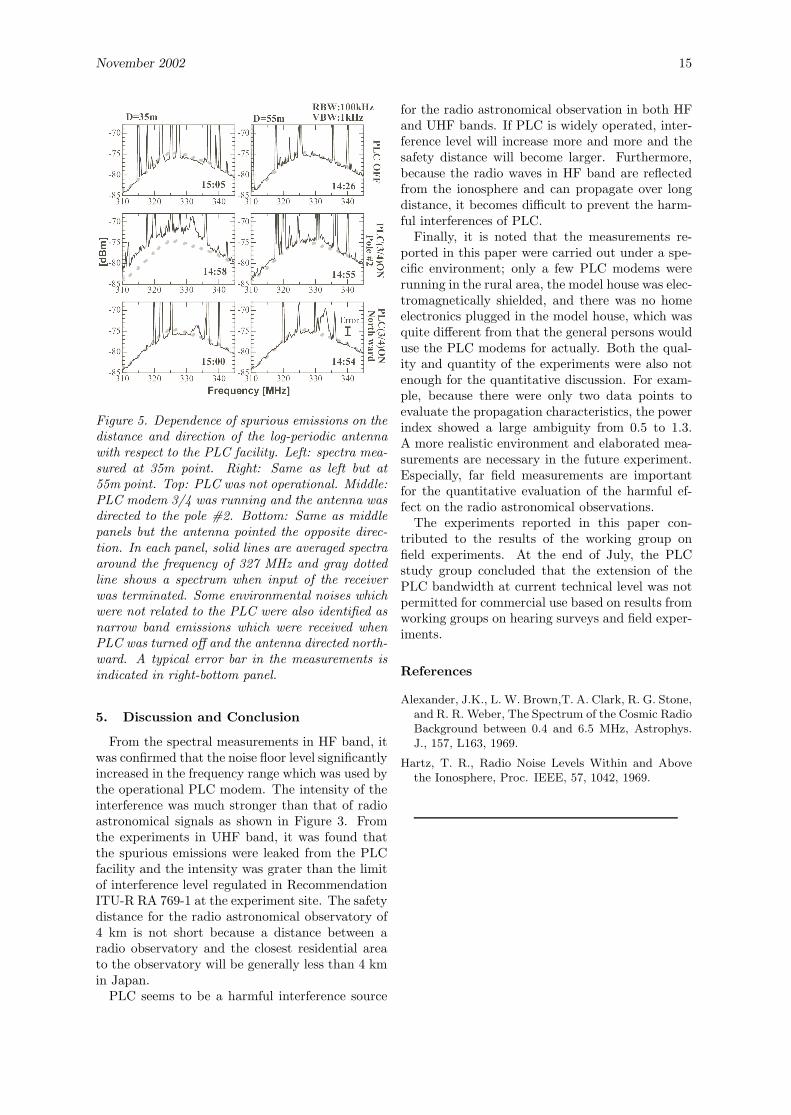
Figure 4 shows a dynamic spectrum in the fre-quency range from 297 to 357 MHz during an op-eration of the modem 3/4. When the modem wasturned off at 15:04, disappearance of broadbandnoise and some narrow band emissions were clearlyobserved, which indicate the presence of spuriousemissions in UHF band. Figure 5 shows depen-dence of the spurious level on the distance and di-rection of the antenna with respect to the PLC fa-cility. When the all modems were turned off or theantenna did not direct to the PLC facility, no spu-rious emission was detected. On the other hand,stronger spurious emission was received when theantenna directed and was closer to the facility. As-suming that electric field intensity of the spuriouswas proportional to power low of the distance fromthe pole #2, the power index was calculated to be1.3, which was close to but larger than the far fieldvalue of 1.0. We compared the intensity of spuriousemission at the frequency of 327 MHz with a limitof harmful interference level for radio astronomicalobservation which was regulated in Recommenda-tion ITU-R RA 769-1. Assuming a system noisetemperature of 150 K at 327 MHz and a receiverband width of 120 kHz, the recommendation levelwas calculated to be -247 dBW/m2/Hz. The de-tected intensity of the spurious emission at the po-sition of 35 m was -206 dBW/m2/Hz, which wasgreater than the recommendation level. The safetydistance for the radio astronomical observation wascalculated to be 4 km apart from the PLC facil-ity assuming that the intensity of spurious electricfield was anti-proportional to the distance from thesource.
November 2002 15
Figure 5. Dependence of spurious emissions on thedistance and direction of the log-periodic antennawith respect to the PLC facility. Left: spectra mea-sured at 35m point. Right: Same as left but at55m point. Top: PLC was not operational. Middle:PLC modem 3/4 was running and the antenna wasdirected to the pole #2. Bottom: Same as middlepanels but the antenna pointed the opposite direc-tion. In each panel, solid lines are averaged spectraaround the frequency of 327 MHz and gray dottedline shows a spectrum when input of the receiverwas terminated. Some environmental noises whichwere not related to the PLC were also identified asnarrow band emissions which were received whenPLC was turned off and the antenna directed north-ward. A typical error bar in the measurements isindicated in right-bottom panel.
5. Discussion and Conclusion
From the spectral measurements in HF band, itwas confirmed that the noise floor level significantlyincreased in the frequency range which was used bythe operational PLC modem. The intensity of theinterference was much stronger than that of radioastronomical signals as shown in Figure 3. Fromthe experiments in UHF band, it was found thatthe spurious emissions were leaked from the PLCfacility and the intensity was grater than the limitof interference level regulated in RecommendationITU-R RA 769-1 at the experiment site. The safetydistance for the radio astronomical observatory of4 km is not short because a distance between aradio observatory and the closest residential areato the observatory will be generally less than 4 kmin Japan.PLC seems to be a harmful interference source
for the radio astronomical observation in both HFand UHF bands. If PLC is widely operated, inter-ference level will increase more and more and thesafety distance will become larger. Furthermore,because the radio waves in HF band are reflectedfrom the ionosphere and can propagate over longdistance, it becomes difficult to prevent the harm-ful interferences of PLC.Finally, it is noted that the measurements re-
ported in this paper were carried out under a spe-cific environment; only a few PLC modems wererunning in the rural area, the model house was elec-tromagnetically shielded, and there was no homeelectronics plugged in the model house, which wasquite different from that the general persons woulduse the PLC modems for actually. Both the qual-ity and quantity of the experiments were also notenough for the quantitative discussion. For exam-ple, because there were only two data points toevaluate the propagation characteristics, the powerindex showed a large ambiguity from 0.5 to 1.3.A more realistic environment and elaborated mea-surements are necessary in the future experiment.Especially, far field measurements are importantfor the quantitative evaluation of the harmful ef-fect on the radio astronomical observations.The experiments reported in this paper con-
tributed to the results of the working group onfield experiments. At the end of July, the PLCstudy group concluded that the extension of thePLC bandwidth at current technical level was notpermitted for commercial use based on results fromworking groups on hearing surveys and field exper-iments.
References
Alexander, J.K., L. W. Brown,T. A. Clark, R. G. Stone,and R. R. Weber, The Spectrum of the Cosmic RadioBackground between 0.4 and 6.5 MHz, Astrophys.J., 157, L163, 1969.
Hartz, T. R., Radio Noise Levels Within and Abovethe Ionosphere, Proc. IEEE, 57, 1042, 1969.

16 IVS CRL-TDC News No.21
Advancement of Versatile
Scientific Sampling Processor(VSSP)
Hiro Osaki ([email protected])
Kashima Space Research CenterCommunications Research Laboratory893-1 Hirai, Kashima, Ibaraki 314-8501, Japan
1. Introduction
A personal computer (PC) based VLBI dataacquisition system was developed by Communi-cations Research Laboratory (CRL) and NihonTsushinki Co. Ltd. [Osaki et al., 2002]. The sys-tem was called versatile scientific sampling proces-sor (VSSP). This system adopted a PCI-bus VLBIdata sampler board and was capable of recording 4-channel 64 Mbps data (16 Mbps for each channel).Using four VSSP PCs, a 16-channel 256 Mbps datarecording/processing system was produced, whichwas called “K5”. This system is expected to replacepresent tape-based VLBI observation system, be-cause this system is less expensive and more con-venient than present tape-based system. In thispaper we will report the advancement of VSSP sofar and introduce briefly about some experimentalobservations recorded using this system.
2. Advancement of the VSSP
2.1 Software Environment of VSSP
At first VSSP and PC-VLBI sampler board wasdeveloped on FreeBSD andMicrosoft Windows, be-cause device driver software of the sampler boardwas developed only for these two operating sys-tems (OS) [Osaki et al., 2002]. Recently devicedriver for Linux was developed in order to fulfillthe users’ request. This driver was developed onRed Hat Linux 7.3/kernel 2.4.18. It is also testedon kernel 2.4.19 and works well. The developmentof the Linux driver must be good news for the VLBIsampler board users.Several VLBI application softwares have been
developed by CRL. They have been developed soas to be compliant with both FreeBSD and Linuxsystems. The applications may easily be compiledon some C compilers on Microsoft Windows sys-tem, but this compatibility is not tested yet. Thedevelopment of the Linux-based VSSP as well asFreeBSD-based system will accelerate the develop-ment of the PC-based VLBI software. Moreover,the chance of the OS selection will prevent the usersfrom being annoyed with some OS install troubles,such as compatibility problem between the OS’sboot loader and the PC’s BIOS, or some devicerecognition trouble used in one’s PC.
2.2 Examples of the VSSP PCs
As the VSSP is a flexible system developed onPC, it can be arranged according to the user’s
Figure 1. A prototype K5 data recording/processingterminal.
Figure 2. Inside of the VSSP PC used as one partof the K5 terminal.
requirement. For an example, CRL and NihonTsushinki Co. Ltd. develop a system that willreplace today’s tape-based geodetic VLBI recordersystem. This system, called “K5”, is composed offour VSSP PCs. Figure 1 shows a prototype K5system assembled by CRL. Each PC has 480 GBdata storage area with 4-channel PC-VLBI sam-pler board. Practically one-day geodetic observa-tion data can be stored on this system. Figure 2shows inside of a VSSP PC used as one unit ofthe K5 terminal. The observed data is stored fourHDDs seen on the upper-right part of the picture.The other HDD seen on the upper-left part is thesystem disk. For another example, a briefcase size4-channel data recording/processing system is as-sembled by CRL. This system can be used as a mo-bile VSSP recording/processing terminal. Two 120GB HDDs are installed on this system. 4 GB of oneof the HDD is used as system area. The remaining236 GB is used as data storage area. If a user has

November 2002 17
Table 1. Specification sheet of the VSSP PCs
K5: 16-channel VSSP for Mobile VSSP: Briefcase sizegeodetic observation 4-channel VSSP PC
(composed of 4 PCs, followings arespecs for each PC)
CPU Pentium III (1.2 GHz) Pentium IV (2.53 GHz)RAM 256 MB 512 MBHDD 120 GB × 4 for data strage 120 GB × 2; 4GB for system and
60 GB ×1 for system remaining 236GB for data storage(7200rpm, Ultra ATA/100) (7200rpm, Ultra ATA/100)
Ether port 10/100 Base-T on-board 10/100 Base-TPCI bus 6 2
to carry recorder/processor system and if 4 channelsampling and 236 GB data storage area is enoughfor the purpose, this system may be an attrac-tive selection. Another example shows that severaluniversities and institutes that have purchased theIP-VLBI sampler board have assembled their ownVSSP-like system in accordance with their needs.In order to exchange know-how to use the IP-VLBIsampler board and to support the users each other,a users’ mailing list has been started by CRL. Thespecifications of the VSSPs assembled by CRL areshown on Table 1.
3. Experimental Observations by VSSP
Several experimental observation have beenmade using VSSP. In this section some of the ex-periments are introduced briefly.CRL Kashima and Haystack observatory pro-
moted electric transmission of VLBI data (e-vlbi)observation experiments. At CRL site the datawas recorded using K5 system. On the contrary,the data was recorded using Mark-V system atHaystack site. Both systems recorded the data asfiles on HDDs. After the experiment the data wastransmitted via FTP over GEMnet and GALAXYnetwork. At Haystack K5 data was converted tobe correlated with Mark-V data. At Kashima, onthe other hand, Mark-V data was converted tobe correlated with K5 data. The latter case thedata was processed using a software correlator de-veloped by CRL. Eventually both institutes foundthe fringes of the observation. This shows thatPC-based VLBI data recording systems are flexi-ble enough to convert one data format to another,using software. The data conversion process mustbe easier compared with those of the present tape-based data recorder system.VSSP is also used for spacecraft observation ex-
periment [Ichikawa et al., 2002]. This system is ex-pected to play an important role in delta-VLBI ob-servation of the Nozomi spacecraft, especially po-sitioning before/after Earth swing-by [Sekido andYoshikawa, 2002]. In order to prepare for theswing-by, test observation experiment was made
using Kashima-34m, Kashima-11m, Koganei-11m,Usuda-64m, Gifu-11m, and Yamaguchi-32m anten-nas. These data were also processed with thesoftware correlator. The data was also recordedby K4 systtem at the same time at Kashima-34m, Kashima-11m, Koganei-11m, Gifu-11m, andTomakomai-11m antenna, to compare the resultwith VSSP. The fringes were successfully detectedby both systems. Those results are being examinednow.
4. Summary
Recently VSSP PC can be set up on Linux aswell as FreeBSD. A PC-based geodetic VLBI re-ording system is produced by CRL by assemblingfour VSSP PCs. This system is called K5. Applica-tion softwares like data recording scheduler, man-ual data sampler, a software correlator, and somemore are developed for VSSP. Several observationexperiments like e-vlbi between Haystack Mark-Vsystem and Kashima K5 system, and test observa-tion preparing for delta-VLBI spacecraft position-ing are made. These experiments showed the flex-ibility and effect of the PC-based VLBI system,especially in such process as data recording, datatransportation, data convertion, and data process-ing compared to those of the present tape-basedVLBI systems.
References
Osaki, H., T. Kondo, and M. Kimura, CRL IVS TDCnews No. 20, pp. 7-9, 2002.
Ichikawa, R., T. Kondo, Y. Koyama, H. Osaki, and H.Ohkubo, CRL IVS TDC news No. 20, pp. 10-11,2002.
Sekido M. and M. Yoshikawa, CRL IVS TDC newsNo. 20, pp. 12-17, 2002.for Nozomi spacecraft, IVSCRL Technology Development Center News, No. 19,pp.37-40, 2001.

18 IVS CRL-TDC News No.21
VLBI observations using IP-
VLBI system for orbit deter-mination of deep space space-craft – Group delay measure-
ments of GEOTAIL and NO-ZOMI telemetry signals –
Testuro Kondo ([email protected]), RyuichiIchikawa, Yasuhiro Koyama, MamoruSekido, and Hiro Osaki
Kashima Space Research CenterCommunications Research Laboratory893-1 Hirai, Kashima, Ibaraki 314-8501, Japan
1. Introduction
Communications Research Laboratory has pro-moted a research on the spacecraft positioningtechnology by using a delta VLBI technique. Ageneral-purpose VLBI system using the Internetand a personal computer has been developed asa part of this project and it is called an IP-VLBIsystem [Kondo et al., 2000; Kondo et al., 2002]or a VSSP system [Osaki et al., 2002]. The IP-VLBI system aims at a real-time VLBI system,and off-line observations and correlation process-ing are possible at present. Delta VLBI test ob-servations of “GEOTAIL”1 were carried out us-ing the IP-VLBI system in collaboration with theInstitute of Space and Astronautical Science ofJapan (ISAS) and the National Astronomical Ob-servatory of Japan (NAO) to check automatic ob-servation software and to evaluate the accuracyof observed delay obtained by the IP-VLBI sys-tem. We intend to utilize the delta VLBI obser-vation data for the orbit-determination of “NO-ZOMI” (PLANET-B), which is a Japanese space-craft launched in 1998 to explore Mars [Yamamotoand Tsuruda, 1998], during the period just beforethe last earth swing-by planned in June 2003 to-ward Mars. Recently we made test observationsfor “NOZOMI” to evaluate the feasibility of actualorbit determination.
1The GEOTAIL satellite was launched on July 24, 1992,from Cape Canaveral, Florida, U.S.A. by the Delta II launchvehicle, and it is a joint program of the Institute of Spaceand Astronautical Science (ISAS) of Japan and the NationalAeronautics and Space Administration (NASA) of U.S.A toinvestigate near-earth space. ISAS developed the spacecraftand provided about two thirds of the science instruments,while NASA provided the launch and about one third of thescience instruments. The spacecraft is operated from ISASbut the telemetry is received by both agencies [Nishida,1994].
1st Earth Swing-byDec. 2002
2nd Earth Swing-byJune 2003
Mars orbit insertionJan. 2004Leaving Earth
Dec. 1998
Orbit of NOZOMI
Orbit of MarsOrbit of Earth
Earth
Sun Mars
NOZOMI
1st Earth Swing-byDec. 2002
2nd Earth Swing-byJune 2003
Mars orbit insertionJan. 2004Leaving Earth
Dec. 1998
Orbit of NOZOMI
Orbit of MarsOrbit of Earth
Earth
Sun Mars
NOZOMI
Figure 1. Trajectory of NOZOMI (afterhttp://www.isas.ac.jp/e/enterp/missions/nozomi/traject.html).
Gifu
Usuda
KoganeiYamaguchi
Tomakomai
Mizusawa
Kashima
500km
Gifu
Usuda
KoganeiYamaguchi
Tomakomai
Mizusawa
KashimaGifu
Usuda
KoganeiYamaguchi
Tomakomai
Mizusawa
Kashima
500km
Figure 2. The location of staions participated inGEOTAIL and NOZOMI VLBI observations.
2. Why Delta-VLBI?
The NOZOMI is the first Japanese Mars orbiter,and was launched on July 4, 1998. It was plannedto arrive Mars in 1999 by using two-times lunarswing-bys and a powered earth swing-by. Howeverdue to malfunction of a thruster valve during thepowered earth swing-by and maneuvers to recoverthe right trajectory to Mars, enough fuel is not leftto inject NOZOMI into a Mars orbit. The NO-ZOMI team found a new trajectory to Mars avail-able to inject NOZOMI into a Mars orbit. Hencethe orbit insertion scheduled in 1999 was aban-doned, and it is now scheduled early in 2004 aftertwo more earth swing-bys (Figure 1). The deter-mination of spacecraft position is usually made onthe basis of range and range rate measurements us-ing a telemetry link. However range measurementis supposed to be difficult during several months

November 2002 19
Table 1. GEOTAIL test observation schedule
Date(YYYY/MM/DD) Time(UT) Stations (name with antenna diameter in meter)2002/06/04 06:49-14:00 Usuda64, Kashima34, Kashima11
Mizusawa10∗1, Yamaguchi32∗2
2002/06/25 08:30-14:38 Kashima34, Kashima11, Koganei112002/06/28 01:58-03:00 Kashima34, Kashima11, Koganei112002/07/20 01:05-04:16 Kashima11, Koganei11, Gifu11
*1: unable to observe due to a thunderbolt damage*2: undetect correlation due to a clock problem
Figure 3. The position of GEOTAIL on the equa-torial coordinates on June 4, 2002.
before the last earth swing-by planned on June 19,2003 to cruise to Mars, due to a bad geometricalrelation between spacecraft attitude and earth po-sition, i.e., the high-gain antenna of NOZOMI doesnot point the Earth during this period. Howeverit is very important to navigate the NOZOMI pre-cisely during this period to succeed in the last earthswing-by. CRL and ISAS started collaboration todetermine NOZOMI orbit using a delta VLBI tech-nique and to lead a NOZOMI mission to a success[Yoshikawa et al., 2001].A test VLBI observation was planned in June
2002 at first. Unfortunately NOZOMI had someproblems at that time caused by the large solarflare occurred on April 21, 2002. Thus we had car-ried out a series of test VLBI observations usingGEOTAIL instead of NOZOMI until it was recov-ered in August 2002.
3. “GEOTAIL” Observations
VLBI observations were carried out for GEO-TAIL to learn the characteristics of telemetry
Figure 4. The difference of delay rates between thatcalculated for the position of GEOATIL fixed at themiddle of each scan (i.e., only diurnal motion isconsidered) and that calculated taking the motionin the equatorial corrdinates into account.
down-link signals and to investigate the feasibil-ity of group delay measurements. We made obser-vations using the IP-VLBI system. Test observa-tions were conducted several times (see Table 1)and data reduction software was developed for apreliminary analysis. Two of four-channel inputsof the IP-VLBI system are used for S and X bandsignals of which base band signal frequencies are2258.90 MHz and 8473.60 MHz, respectively. Ob-servations were made with a sampling frequency of4 MHz and an A/D resolution of 4 bits. The loca-tion of stations participated in the observations isshown in Figure 2.The GEOTAIL moves so fast in the sky (see
Figure 3) that a priori values calculated by usingsoftware developed for geodetic processing have in-sufficient accuracy, in particular in delay rate thatis necessary for fringe stopping, so that we devel-oped new a-priori calculation software for corre-lation processing, in which the motion of GEO-TAIL is interpolated by using a spline interpolationmethod. Figure 4 shows the difference between de-lay rate calculated using the conventional a priori

20 IVS CRL-TDC News No.21
Figure 5. A spectrum of X-band telemetry signals from GEOTAIL observed at Kashima34 (left panel)and coarse delay search function calculated from correlated data on Kashima34-Usuda64 baseline (rightpanel). Observation date is June 4, 2002.
Figure 6. A spectrum of S-band telemetry signals from GEOTAIL in a range measurement mode observedat Kashima34 (left panel) and coarse delay search function calculated from correlated data on Kashima34-Usuda64 baseline (right panel) observed on June 4, 2002. Two micro sec ambiguities arising from 500kHz spacing between carrier and subcarrier frequencies can be seen in the coarse delay search plot.
calculation software and that using the newly de-veloped software. In a former calculation the posi-tion of GEOATIL in the equatorial coordinates isfixed at the middle point of each scan, while actualmotion in the celestial position is considered in alatter one. Maximum discrepancy reaches about3.5× 109 s/s in this case. It corresponds to 28 Hz
fringe frequency at 8 GHz, and this will result inloss of correlation amplitude for 1 sec integrationperiod, which is typical period for a conventionalcorrelator. Correlation processing is carried out bysoftware able to run at any PC without any dedi-cated hardware for correlation processing.A spectrum at X-band telemetry signals and

November 2002 21
Table 2. NOZOMI test observation schedule
Date(YYYY/MM/DD) Time(UT) Stations (name with antenna diameter in meter)2002/09/17 12:39-18:23 Kashima34, Koganei112002/10/17 17:54-19:33 Kashima34, Kashima11, Koganei112002/10/18 17:54-19:34 Kashima34, Kashima11, Koganei112002/10/21 16:54-20:04 Kashima34, Kashima11, Koganei11, Usuda64
Gifu11, Tomokomai11, Ymaguchi32, Mizusawa202002/10/21 16:54-20:03 Kashima34, Kashima11, Koganei11, Usuda64
Gifu11, Tomokomai11, Ymaguchi32, Mizusawa20
Figure 7. An example of X-band coarse searchfunctions for a quasor (3C273B) on Kashima34-Usuda64 baseline. Observation date is June 4,2002.
coarse delay search function calculated from cor-related data are shown in Figure 5. As shown inthe figure, group delay can be obtained withoutany ambiguities. Figure 6 shows an S-band powerspectrum and coarse delay search function whentelemetry mode is in a range measurement mode.In this case 2 µsec ambiguities appeared in the de-lay direction. Figure 7 is an example of coarse delaysearch function for a quasor (3C273B).A closure delay test was carried out to check the
accuracy of observed group delays. It is confirmedthat an rms error of a few nsec was attained withcoarse delay measurements (Figure 8).
4. “NOZOMI” Observations
As NOZOMI recovered from a trouble, a VLBIobservation became possible late August 2002.
Figure 8. An example of closure delay test forGEOTAIL observations. Observations were car-ried out on June 25, 2002 at three stations,Kashima34, Kashima11, and Koganei11. Datawith large error bars represent quasor observations.Although data are lagely scattered aroound 176.45days, standard deviation of total data is wel lessthan 10 nsec (∼5 nsec).
Since then we have carried out VLBI observa-tions using a NOZOMI telemetry signal siveraltimes (Table 2). Only X-band signals were ob-served because NOZOMI’s S-band telemetry wasalready malfunctioned on July 5, 1999 The set-upof IP-VLBI system is as same as that for GEO-TAIL except for a base band signal frequency(8410.00MHz). Examples of fringes observed forNOZOMI telemetry signals are shown in Figure 9.Figure 10 also shows fringes for NOZOMI but in avery weak telemetry signal case. It is thought tosimulate the case when actual delta VLBI is nec-essary. In any case, we succeeded in determininggroup delay without ambiguities.
5. Conclusions
We have carried out a series of delta-VLBI obser-vations of GEOTAIL and NOZOMI using IP-VLBIsystem for several months to learn characteristics

22 IVS CRL-TDC News No.21
Figure 9. NOZOMI fringes for two differentepochs. Telemetry mode changed slightly betweentwo epochs, however group delay without ambiguityis easily determined for both cases.
of satellite downlink signals and to investigate thefeasibility of delay measurements. Preliminary re-sults show that most of the cases we can determinegroup delays for telemetry signals without any se-vere ambiguities. Now an attempt to reflect VLBIdata to an orbit determination is carried out by anISAS team. Next VLBI observations will be per-formed several months before the last earth swing-by scheduled on June 19, 2003 to determine orbitand to lead a Mars exploring project to a success.
Acknowledgement: We would like to thank “NO-ZOMI” VLBI collaboration team members ofISAS, NAO, Yamaguchi University, Gifu Univer-sity, and Hokkaido University for their kind obser-vational supports. A part of NOZOMI VLBI data
Figure 10. NOZOMI fringes for very weak signalcase detected on Kashima34-Usuda 64 baseline.
are transferred through GALAXY network main-tained by the NTT in collaboration with CRL andNAO. We also would like to express our apprecia-tion to all GALAXY collaboration team membersfor their helpful technical assistance.
References
Osaki, H., T. Kondo, and M. Kimura, Development ofversatile scientific sampling processor (VSSP) – Apractical approach, IVS CRL Technology Develop-ment Center News, No.20, pp.7-9, 2000.
Kondo, T., Y. Koyama, M. Sekido, J. Nakajima, H.Okubo, H. Osaki, S. Nakagawa, and Y. Ichikawa,Development of the new real-time VLBI techniqueusing the Internet protocol, IVS CRL TechnologyDevelopment Center News, No.17, pp.22-24, 2000.
Kondo, T., Y. Koyama, J. Nakajima, M. Sekido, R.Ichikawa, E. Kawai, H. Okubo, H. Osaki, M. Kimura,Y. Ichikawa, and GALAXY team, Real-time GigabitVLBI System and Internet VLBI System, IVS 2002General Meeting Proceedings, pp.142-146, 2002.
Nishida, A., The GEOTAIL mission, Geopys. Res.Lett., 21, 2871-2873, 1994.
Yamamoto T. and K. Tsuruda, The PLANET-B mis-sion, Earth Planets Space, 50, 175-181, 1998.
Yoshikawa M., M. Sekido, N. Kawaguchi, K. Fujisawa,H. Hanada, Y. Kono, H. Hirabayashi, Y. Murata, S.Sawada-Satoh, K. Wajima, Y. Asaki, J. Kawaguchi,H. Yamakawa, T. Kato, T. Ichikawa, and T. Ohnishi,Present status and future problems of the orbit de-termination for Nozomi spacecraft, IVS CRL Tech-nology Development Center News, No. 19, pp.37-40,2001.

November 2002 23
International e-VLBI experi-
ments
Yasuhiro Koyama1 ([email protected]),Tetsuro Kondo1, Junichi Nakajima1,Moritaka Kimura1, Hisao Uose2, andSotetsu Iwamura2
1Kashima Space Research CenterCommunications Research Laboratory893-1 Hirai, Kashima, Ibaraki 314-8501, Japan
2NTT Laboratories3-9-11 Midori-cho, Musashino, Tokyo 180-8585,Japan
1. Introduction
Communications Research Laboratory and NTTLaboratories are collaborating together to develophardware and software systems for e-VLBI observa-tions using high speed IP based shared networks.A series of test experiments using the newly de-veloped systems were carried out in Septemberand October 2002. Two baselines were selectedfor these test experiments. One is the Kashima-Westford baseline. The 34m antenna station atKashima and 20m antenna station at Westford,Massachusetts, USA were used. The other is theKashima-Metsahovi baseline. The 34m antenna atKashima and 14m antenna at Metsahovi, Finlandwere used. The details of the test experiments areintroduced in the following sections.
2. Kashima-Westford Experiments
Three sessions were scheduled with the Kashima-Westford baseline. The dates and time of thesesessions are shown in Table 1. In evlbi1 and evlbi3sessions, K5 VLBI observation system was used atKashima and Mark-5 VLBI data recording systemwas used at Westford. Eight frequency channelswere assigned to X-band and six frequency chan-nels were assigned to S-band. Sampling rate ofeach channel was 4MHz and the total data ratewas 56Mbps. Frequency assignment was same withthe conventional geodetic VLBI experiments per-formed under the Crustal Dynamics Project in thepast. In the evlbi2 session, K5 VLBI observationsystem was used at Kashima and the 4 channelsconfiguration of the K5 VLBI observation systemwas used at Westford. The latter system is consistof a PC system running on the FreeBSD operat-ing system and an IP-VLBI board which can sam-ple 4 channels of video signals at various samplingspeed from 40kHz to 16MHz. Only the X-bandsignals were recorded with the observation systemboth at Kashima and at Westford. The full setand the subset of the K5 VLBI observation systemused for the Kashima-Westford e-VLBI test exper-iments are shown in Figure 1. The 4-channel setof the system was small enough to be stored in asuitcase and was transported in a check-in baggageof airline between Japan and the USA.Figure 2 illustrates the high speed network route
used in the test e-VLBI experiments. To pre-pare the international e-VLBI experiments, the
(a) (b)
Figure 1. K5 VLBI observation system. The full set of the system (a) can record 16 channelsof data while the subset of the system (b) can record 4 channels of data.

24 IVS CRL-TDC News No.21
Haystack Observatory(Westford Station)
Abilene Network
BOSSNET+GLOWNET(GigE)
GEMnet(20Mbps)
2.4Gbps(OC-48)
To Kashima Stationvia GALAXY network
Figure 2. High speed network which was used in the experiment between Kashima and Westford stations.
(a) (b)
Figure 3. Detected fringes at X-band (a) and S-band (b) observations towards 4C39.25. The PC softwarecorrelator was used to correlate Mark-5 data recorded at Westford station and K5 data recorded atKashima station.
Table 1. Three sessions done with the Kashima-Westford in October, 2002.
Exp. Code Date Timeevlbi1 October 8, 2002 17:30UT-19:30UTevlbi2 October 9, 2002 12:00UT-15:00UTevlbi3 October 15, 2002 17:30UT-18:40UT
GALAXY network was connected to the GEMnetnetwork which is the high speed research networkof the NTT Service Integration Laboratories. TheGEMnet has an international link between Japanand the USA at the data rate of 30Mbps. 20Mbpsof the bandwidth is assigned to the connection to
the Abilene network which are used by universitiesand institutions along the USA. Haystack Obser-vatory has been connected to the Abilene networkby using BOSSnet and GLOWnet. At the timeof the e-VLBI experiments, the BOSSnet was notavailable, and the alternative route was used. Thebackbone of the Abilene network has a capacity of2.4Gbps (OC-48). In total, the expected limit ofthe data rate was 20Mbps which was restricted atthe transpacific connection provided by GEMnet.After evlbi1 and evlbi3 sessions, the data
recorded by the Mark-5 system at Westford sta-tion were converted to transferable files and trans-fered to Kashima by using the high speed network

November 2002 25
(a) (b)
Figure 4. The observation system used at Kashima station for the Kashima-Metshahovi experiments.(a) The ADS1000 sampler unit (right) is connected to the PC-VSI2000-DIM board (front) installed inthe Linux PC system (behind). (b) The actual configuration during the experiments.
and FTP protocol. The data files were then con-verted to K5 compatible format and processed withthe data recorded with the K5 system at Kashimafor correlation processing. Software correlator pro-grams of the K5 system were used for the corre-lation processing. On the other hand, the datarecorded with the K5 system at Kashima weretransfered to Haystack Observatory by using thehigh speed network. The data files were then con-verted to Mark-5 disk system and processed withthe data recorded with the Mark-5 system at West-ford station. The Mark-4 hardware correlator sys-tem was used for the correlation processing. Al-though evlbi1 session was not successful, fringeswere successfully found from the evlbi3 session byboth of the correlators. Figure 3 shows the de-tected fringes at X-band and S-band for the radiosource 4C39.25.The evlbi2 session was performed to evaluate the
current performance of the realtime data transmis-sion between K5 VLBI observation systems overthe intercontinental distance. The K5 system iscapable of transmiting observed data in realtimeto the network by using IP protocol. The real-time transmission was tried at various data ratefrom 40kbps to 2Mbps from Westford station toKashima station. As the results, the transmis-sions were successful up to the data rate of 1Mbps,while the 2Mbps data transmission could not besucceeded.
3. Kashima-Metsahovi Experiments
A series of test e-VLBI experiments were per-formed with Kashima-Metsahovi baseline from theend of September. The 34m antenna at Kashimaand 14m antenna at Metsahovi Radio Observatoryin Finland were used for these experiments. The
RF frequency from 21.98GHz to 22.48GHz were re-ceived by both antennas and converted to the base-band. The baseband signals were then sampledwith ADS1000 sampler units. The ADS1000 sam-pler is capable of sampling analog signal at the rateof 1024Msps with one or two bits per each sample.In the test e-VLBI experiments, one bit samplingmode was used. The sampled digital data is gener-ated based on the VLBI Standard Interface Hard-ware (VSI-H) specifications. At Kashima station,the PC-VSI disk based recorder system equippedwith PC-VSI2000-DIM board was used to recordthe data. At Metsahovi station, two Linux PC sys-tems each equipped with VSIB VSI-H PCI dataacquisition board were used to record the data.Both systems are capable of recording digital datathrough VSI-H interface connectors. These sys-tems are shown in Figure 4.The data recorded at Metsahovi station were
transfered to Kashima by using FTP protocol af-ter observations and processed for correlation pro-cessing on a Linux PC system using software cor-relator programs. The first successful fringe wasdetected from the observation towards the W3OHmaser source made on October 16, 2002. Figure 5shows the cross power spectrum after 15 seconds ofintegration time.
4. Significance of the Test Experimentsand Future Prospects
The successes of the international e-VLBI exper-iments have many important meanings. The suc-cess of the Kashima-Westford experiments demon-strated that the PC disk based recording systemsare flexible enough and it is possible to achievecompatibility between one system and the other bysoftware programs. It also demonstrated that the

26 IVS CRL-TDC News No.21
Figure 5. The first fringe detected with the Kashima-Metsahovi baseline from the observation towardsW3OH.
international network connection has been drasti-cally improved recently and the e-VLBI observa-tions with intercontinental baselines are becomingrealistic. The success of the Kashima-Metsahovibaseline experiments have an additional meaning.Two different VSI recording systems have beendeveloped by two independent teams and thesetwo systems were used with the same samplerunit interfaced with the VSI-H specifications. Thesuccesses to exchange data recorded by differentrecording systems demonstrated the intended re-sults of the standardization of the interface by VSI-H.One of our purposes of the e-VLBI system de-
velopments are to achieve minimal turn aroundtime to process international geodetic VLBI ses-sions. The current speed of the network demon-strated with the test e-VLBI experiments are notyet satisfactory for this purpose. The speed ofthe transpacific network could be improved if wecan use a faster transpacific network route. Thereseems to be a few possibilities and we are currentlyinvestigating these possibilities to expand the net-
work capacity for the Kashima-Westford baselinee-VLBI experiments in the future.Meanwhile, we are planning to improve hard-
ware systems and develop software systems to makethe entire system robust and routine processing be-come possible. We are also planning to test a high-speed VLBI data transmission system which hasthe maximum speed of 256Mbps using multiple IPstreams. We would like to perform these test e-VLBI experiments in the future and continue ef-forts to realize routine e-VLBI experiments withinternational and intercontinental baselines.
Acknowledgement: The authors would like to ap-preciate many members of the Haystack Observa-tory and Metsahovi Radio Observatory who jointlyparticipated in the test experiments.

November 2002 27
Yamaguchi 32m Radio Tele-
scope and an On-line Observa-tion System
Kenta Fujisawa ([email protected])
Yamaguchi UniversityYoshida 1677-1, Yamaguchi city,Yamaguchi 753-8512, Japan
1. Introduction
National Astronomical Observatory of Japanwas given a 32m radio antenna from KDDI cor-poration in 2001, and has made use it as a radiotelescope (Yamaguchi 32m telescope) under collab-oration with Yamaguchi university and other insti-tutes. The telescope is planned to use as a powerfulelement of VLBI network as well as a large singledish telescope. In this article, we describe the cur-rent status and scientific targets of this telescope.A special feature of network-oriented observationis also mentioned.
2. The Telescope
The antenna (Figure 1) was constructed in 1979for tracking, telemetry and command to a telecom-munication satellite (INTELSAT) for the first time.The mount is Azimuth-Elevation type covering thefull sky. The diameter of the main reflector is32m and the cassegrain optics system with focused-beam reflector assembly is equipped. The antennafinished its role of telecommunication in 2001, thenwe have started to modify it to a radio telescope.The feed horn was changed from corrugate (4-
6 GHz) to straight horn with 8 GHz dual-channelcircular polarization feed for astronomical obser-vation. A cooled dual-channel 8 GHz HEMT re-ceiver is mounted. The system noise temperatureis about 50 K at 8 GHz. A 6.7 GHz feed and roomtemperature receiver is also available although it isexclusive use with the 8 GHz system.A simple tracking system (PC base) has been
developed by NAO and Yamaguchi university. En-coded angle values (Az and El) from the existingantenna control unit (ACU) was detected by thePC, then the PC output the error voltage to theACU in real-time. The error voltage is proportionalto the angle between the current angle and the tar-get one. The maximum speed is 0.25 deg/sec, andthe angular resolution is 0.01 degree that is enoughfor observation at 8 GHz. For 22 GHz observationin future, the upgrade of the angular resolution to0.001 degree is planned.
Figure 1. Yamaguchi 32m telescope at the KDDIYamaguchi Satellite Earth Station. The telescopeis on a building where the receiver and tracking sys-tems are installed.
A preliminary result of the aperture efficiencymeasurement is 65 % at 8 GHz, which is suffi-cient for astronomical observation, also suggest-ing a potential up to 22 GHz observation (surfaceaccuracy of lesser than 1.0 mm rms is inferred).Back-end systems, e.g. VLBI terminal, line obser-vation system, and observation system software arealso under development. Along with completion ofthese astronomical observation systems, test obser-vations including VLBI will be started by the endof this year.
3. Purposes
The Yamaguchi 32m telescope will be usedmainly for VLBI observation. We are planningto organize some 8 GHz telescopes in Japan andmake VLBI observation of variable active galacticnuclei and radio active stars. Frequent VLBI ob-servations by taking advantage of the much observ-ing time would give a chance to investigate thoseshort time-scale variables. We expect to expandthis 8 GHz VLBI network to other countries in fu-ture. Yamaguchi 32m is also expected to be a co-observing telescope with VERA and future spaceVLBI project (VSOP2).

28 IVS CRL-TDC News No.21
A technical study of spacecraft navigation byVLBI has been carried out in Japan under collab-oration of ISAS, CRL, NAO, NASDA and Yam-aguchi university. The Yamaguchi 32m telescopewould be used as an element of this navigation net-work. We have succeeded in a VLBI observation ofdownlink signal of a spacecraft NOZOMI in Octo-ber 2002.
4. On-line Observation
Yamaguchi 32m telescope is going to have a spe-cial feature of ‘network based observation’ system.According to the rapid expansion of informationnetwork and increasing potential of personal com-puter (PC), studies of new VLBI system based onthe network have been started in the world. Oneof them is the GALAXY project that is collabora-tion among NAO, CRL, ISAS, and NTT since 1998.Large telescopes (Usuda 64m, Kashima 34m, andsome other telescopes) around the Kanto area areconnected by high-speed dedicated network in theGALAXY project to achieve real-time VLBI obser-vation. The GALAXY project has been achieved1 Gbit/sec observation between Usuda 64m andKashima 34m telescopes resulting 2 mJy detectionsensitivity.Yamaguchi 32m telescope is being planned to
join such real-time VLBI network via Super-SINEToperated by the National Institute of Informatics(NII). The high sensitivity and the distant location(800 km west to Kanto) of the telescope would pro-vide not only the high sensitivity but also the highresolution for the real-time VLBI observation.
Figure 2. A small radio telescope mounted on anequatorial for amateur astronomer. Broadcastingsatellite system is used for the dish and receiver.
Not only the dedicated high-speed network, weare planning to connect the telescope to the Inter-net for a new way of VLBI observation fully basedon the PC and the internet. Process of VLBI ob-servation, e.g., observation, data archiving, datatranssion, and correlation are all done on PCs. Asmall radio telescope (Figure 2) for this internetVLBI system is being constructed in Yamaguchiuniversity.
Acknowledgement: We thank colleagues of KDDIfor supporting the Yamaguchi 32m project.
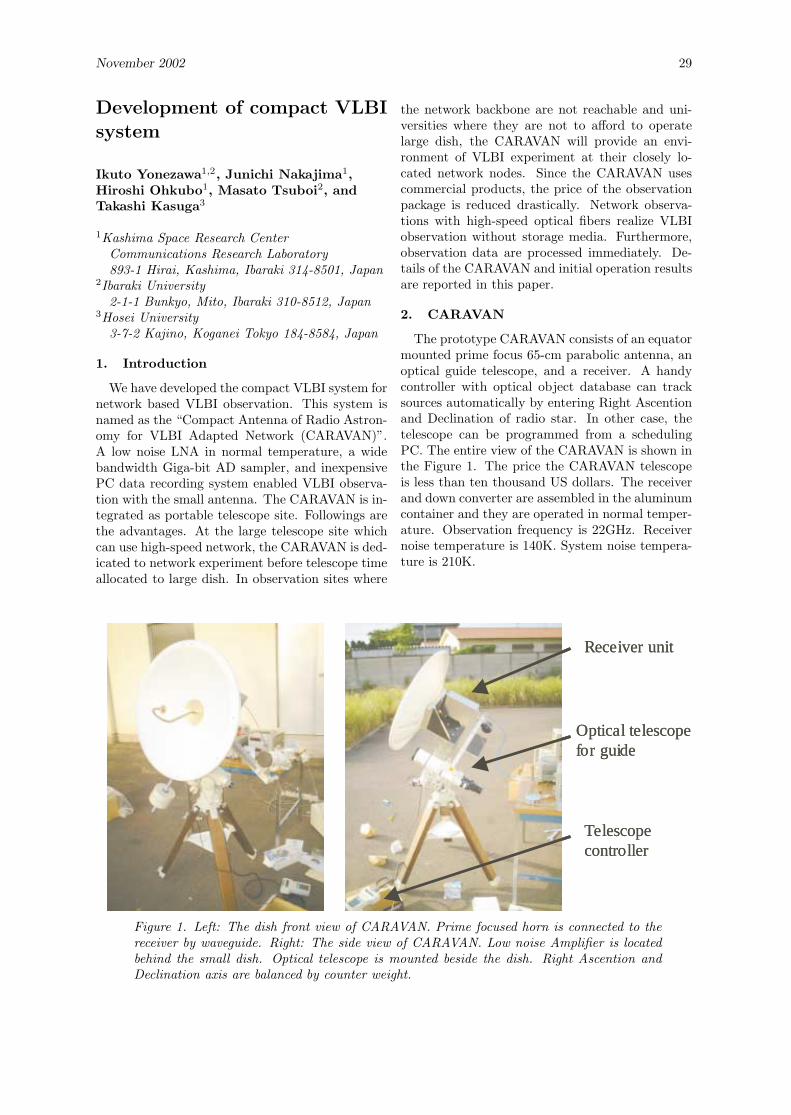
November 2002 29
Development of compact VLBI
system
Ikuto Yonezawa1,2, Junichi Nakajima1,Hiroshi Ohkubo1, Masato Tsuboi2, andTakashi Kasuga3
1Kashima Space Research CenterCommunications Research Laboratory893-1 Hirai, Kashima, Ibaraki 314-8501, Japan
2Ibaraki University2-1-1 Bunkyo, Mito, Ibaraki 310-8512, Japan
3Hosei University3-7-2 Kajino, Koganei Tokyo 184-8584, Japan
1. Introduction
We have developed the compact VLBI system fornetwork based VLBI observation. This system isnamed as the “Compact Antenna of Radio Astron-omy for VLBI Adapted Network (CARAVAN)”.A low noise LNA in normal temperature, a widebandwidth Giga-bit AD sampler, and inexpensivePC data recording system enabled VLBI observa-tion with the small antenna. The CARAVAN is in-tegrated as portable telescope site. Followings arethe advantages. At the large telescope site whichcan use high-speed network, the CARAVAN is ded-icated to network experiment before telescope timeallocated to large dish. In observation sites where
the network backbone are not reachable and uni-versities where they are not to afford to operatelarge dish, the CARAVAN will provide an envi-ronment of VLBI experiment at their closely lo-cated network nodes. Since the CARAVAN usescommercial products, the price of the observationpackage is reduced drastically. Network observa-tions with high-speed optical fibers realize VLBIobservation without storage media. Furthermore,observation data are processed immediately. De-tails of the CARAVAN and initial operation resultsare reported in this paper.
2. CARAVAN
The prototype CARAVAN consists of an equatormounted prime focus 65-cm parabolic antenna, anoptical guide telescope, and a receiver. A handycontroller with optical object database can tracksources automatically by entering Right Ascentionand Declination of radio star. In other case, thetelescope can be programmed from a schedulingPC. The entire view of the CARAVAN is shown inthe Figure 1. The price the CARAVAN telescopeis less than ten thousand US dollars. The receiverand down converter are assembled in the aluminumcontainer and they are operated in normal temper-ature. Observation frequency is 22GHz. Receivernoise temperature is 140K. System noise tempera-ture is 210K.
Receiver unit
Optical telescope for guide
Telescope controller
Receiver unit
Optical telescope for guide
Telescope controller
Figure 1. Left: The dish front view of CARAVAN. Prime focused horn is connected to thereceiver by waveguide. Right: The side view of CARAVAN. Low noise Amplifier is locatedbehind the small dish. Optical telescope is mounted beside the dish. Right Ascention andDeclination axis are balanced by counter weight.

30 IVS CRL-TDC News No.21
Figure 2. Cross-power spectrum of between CAR-AVAN and Kashima 34m. The feature of watermaser is visible at telescope IF baseband 430MHz.
3. Observation
Single dish observations were made for confir-mation of basic parameter. From the astronomi-cal measurement, HPBW of 1.5◦and aperture effi-ciency of 0.5 were obtained. Then an interferom-eteric observation was carried out. We observedNSTAR-B (geo-stationary satellite) with CARA-VAN as a reference antenna of holography obser-vation to measure Kashima 34m surface accuracy.On October 2nd, 2002, we observed water masersource W49N with CARAVAN and Kashima 34mantenna. We have detected W49N fringes (Figure2). This observation was performed with 1GbpsAD sampler and Gbps real time Correlator (GICO�). VLBI preparation is in progress (Figure 3). Itis expected that radio source stronger than 20Jy isdetectable by CARAVAN and the 34m antenna forintegration time of 1 second.
4. Operation scheme
The ubiquitous (anywhere, anytime) VLBI pack-age consists of 4 components, sampler, i.e., smalltelescope, Giga-bit AD portable reference, and PCbased observation system (PC-VSI). The systemis simple so that these units are carried by a car.Installation of the equator mount is straightfor-ward. Electric axis of 65cm parabolic antenna iscollimated by an optical guide scope. Then theantenna is set up using the polar star and majorbright stars. Even without optical stars in clearsky, the wide beam dish allows the set up usingthe sun.
Figure 3. View of the CARAVAN and Kashima34m antenna toward a same object.
5. Future plan
The CARAVAN will be moved to Ibaraki Univer-sity and VLBI observation is planned with 50kmbaseline. This observation is scheduled in Decem-ber 2002. We will carry the CARAVAN to high-speed network nodes and VLBI observation willbe performed for further study of small telescopeVLBI.

November 2002 31
The implementation of the PC
based Giga bit VLBI system
Moritaka Kimura ([email protected])and Junichi Nakajima
Kashima Space Research CenterCommunications Research Laboratory893-1 Hirai, Kashima, Ibaraki 314-8501, Japan
1. Introduction
We are developing new Giga bit VLBI systemintegrated around personal computer (PC). Theperformance of personal computers is increasingquickly every year, it can replace almost part of theVLBI back-end system. The PC based system hasseveral advantages. These advantages are flexibledata analysis, the low cost and the good compat-ibility to other PC-VLBI. The PC-VLBI utilizeshigh performance CPUs for software correlaton. Itcan be used for real-time fringe test via Internetdata transfer during observation[1]. The PC cor-relator can switch the algorithm XF and FX. Itprovides high frequency resolution for maser obser-vation by FX and high correlation speed for geode-tic or continuum observations by XF. The cost ofPC-VLBI is inexpensive, it is two order lower thanformer back-end systems. The low price will spreadVLBI research to many applications. Universitiesin Japan started VLBI study and PC-VLBI soft-ware development. Since, the sampling data ofPC-VLBI is written on hard disk as standard filesystem, any PC-VLBI systems employ the file sys-tem can read another PC-VLBI data and correlatebetween heterogenous systems[2]. The data com-patibility between PC-VLBI systems is no longersevere problem between systems. We report ourPC-VLBI system and performance of the softwarecorrelation toward future.
2. PC-VLBI System: Hardwares
Figure 1 shows the PC-VLBI system. This sys-tem is consist of the A/D sampler based on VSIstandardization[3] and a PC. We have two typesamplers named ADS1000 and ADS2000. Thespecification of the ADS1000 was introduced byNakajima et al.[4]. It has 1-channel of 1024Mspswith 2-bit quantization. Another A/D sam-pler ADS2000 has 16-channels of 64Msps with 2-bit quantization. The targets of ADS1000 andADS2000 are high sensitive astronomical VLBIand geodetic VLBI respectively. The VSI datagenerated from the sampler are introduced toPC through a PCI-bus by PC-VSI2000DIM board
shown in Figure 2. This interface board is full com-patible with VSI standardization and maximumperformance is 2048Mbps. The major specifica-tions of the PC is described in Table 1. This PC hastwo 64bit/66MHz PCI interfaces for the PC-VLBIcapture board and IDE-RAID board. The normalrecording rate is 1024Mbps using 4-IDE hard diskswith RAID-0 mode. The total recording time is96 minutes with four 180GB disks under 1Gbps. Itcan extend recording time with more capacity disksor using software data re-sampling. The recordingtime is shown in Table 2. This system has four re-moval IDE hard disk cases, the media is changedwhen the data reached maximum. Hot swap is pos-sible by the RAID card selection.
Figure 1. The PC-VLBI system: PC with PC-VSI board, display and a giga-bit A/D sampler(ADS1000). In PC-VLBI observation whole tele-scope IF sampling is accomplished by this combina-tion.
Figure 2. The PC-VSI data capture board. The1024/2048Mbps VLBI data is transferred to PCI-bus continuously.
3. PC-VLBI Software and Further Ability
The software correlation is utilized in PC-VLBI.It provides new ability at fringe test. The soft-ware correlator enables near real-time correlation
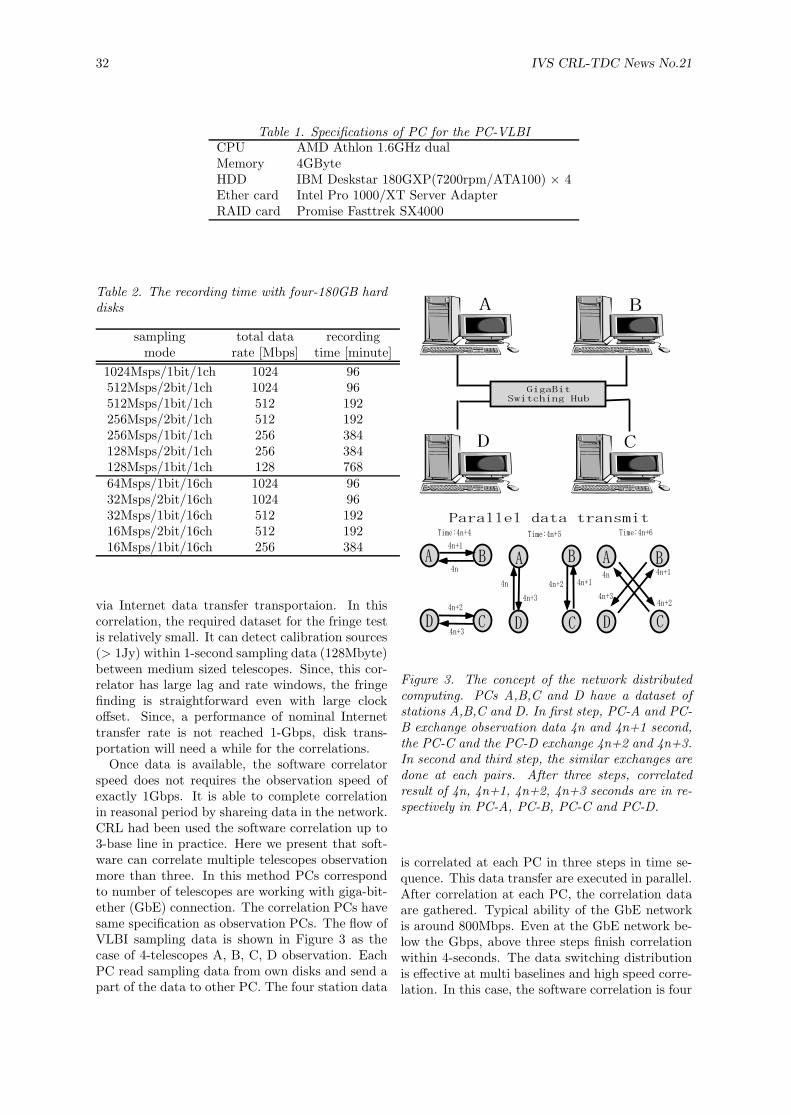
32 IVS CRL-TDC News No.21
Table 1. Specifications of PC for the PC-VLBICPU AMD Athlon 1.6GHz dualMemory 4GByteHDD IBM Deskstar 180GXP(7200rpm/ATA100) × 4Ether card Intel Pro 1000/XT Server AdapterRAID card Promise Fasttrek SX4000
Table 2. The recording time with four-180GB harddisks
sampling total data recordingmode rate [Mbps] time [minute]
1024Msps/1bit/1ch 1024 96512Msps/2bit/1ch 1024 96512Msps/1bit/1ch 512 192256Msps/2bit/1ch 512 192256Msps/1bit/1ch 256 384128Msps/2bit/1ch 256 384128Msps/1bit/1ch 128 76864Msps/1bit/16ch 1024 9632Msps/2bit/16ch 1024 9632Msps/1bit/16ch 512 19216Msps/2bit/16ch 512 19216Msps/1bit/16ch 256 384
via Internet data transfer transportaion. In thiscorrelation, the required dataset for the fringe testis relatively small. It can detect calibration sources(> 1Jy) within 1-second sampling data (128Mbyte)between medium sized telescopes. Since, this cor-relator has large lag and rate windows, the fringefinding is straightforward even with large clockoffset. Since, a performance of nominal Internettransfer rate is not reached 1-Gbps, disk trans-portation will need a while for the correlations.Once data is available, the software correlator
speed does not requires the observation speed ofexactly 1Gbps. It is able to complete correlationin reasonal period by shareing data in the network.CRL had been used the software correlation up to3-base line in practice. Here we present that soft-ware can correlate multiple telescopes observationmore than three. In this method PCs correspondto number of telescopes are working with giga-bit-ether (GbE) connection. The correlation PCs havesame specification as observation PCs. The flow ofVLBI sampling data is shown in Figure 3 as thecase of 4-telescopes A, B, C, D observation. EachPC read sampling data from own disks and send apart of the data to other PC. The four station data
Figure 3. The concept of the network distributedcomputing. PCs A,B,C and D have a dataset ofstations A,B,C and D. In first step, PC-A and PC-B exchange observation data 4n and 4n+1 second,the PC-C and the PC-D exchange 4n+2 and 4n+3.In second and third step, the similar exchanges aredone at each pairs. After three steps, correlatedresult of 4n, 4n+1, 4n+2, 4n+3 seconds are in re-spectively in PC-A, PC-B, PC-C and PC-D.
is correlated at each PC in three steps in time se-quence. This data transfer are executed in parallel.After correlation at each PC, the correlation dataare gathered. Typical ability of the GbE networkis around 800Mbps. Even at the GbE network be-low the Gbps, above three steps finish correlationwithin 4-seconds. The data switching distributionis effective at multi baselines and high speed corre-lation. In this case, the software correlation is four

November 2002 33
Lag Number
Thr
ough
put [
Msp
s]T
hrou
ghpu
t [M
sps]
1 10 100 1000 10000 100000 10000001
10
100
1000
10000
XF type correlation
FX type correlation
2-station (1-baseline)3-station (3-baseline)4-station (6-baseline)
Performance of software correlation
Lag Number
1 10 100 1000 10000 100000 10000001
10
100
1000
10000
XF type correlation
FX type correlation
2-station (1-baseline)3-station (3-baseline)4-station (6-baseline)
2-station (1-baseline)3-station (3-baseline)4-station (6-baseline)
Performance of software correlation
Figure 4. The XF and FX cross correlation performance evaluation using one PC. CPU cash memorysize affect the performance loss at large lag.
times faster than one PC, thus this will enable real-time correlation between high speed linked tele-scope even with software correlator of limited CPUperformance. This processing scheme is able to ap-ply to N-telescopes observation with N-port switch-ing hub.As for each PC programming, correlation speed
was considered as the first priority. Numericalcodes are written in Single Instruction MultipleData (SIMD) instructions and multi threading formulti-way proseccers are employed. The results ofperformance test of software correlation in XF andFX using one PC are shown in Figure 4. The PCspecification used for this evaluation is also an or-dinary one in Table 1. Three lines indicated inFigure 4 are requirement for 1Gbps real-time corre-lation with station number 2,3 and 4. Already theGbps performance is achieved at small lag num-ber by XF correlation. It is enough for geodeticVLBI which uses small lag window. The FX cor-relation dose not reach real-time processing speedat present, The correlation speed is expected to beachieved by simply using multi-way processors PCin near future, for example AMD hammer 8-wayprocessors[5].
References
[1] Nakajima, J. et al., IVS CRL-TDC News No.16,pp.15, June 2000.
[2] Jouko, R., IVS CRL-TDC News No.20, pp.2,June 2002.
[3] Whitney, A.R., http://ivscc.nasa.gov/.
[4] Nakajima, J. et al., IVS CRL-TDC News No.17,pp.18, November 2000.
[5] AMD home page, http://www.amd.com/.

34 IVS CRL-TDC News No.21
VLBI development merge into
to PC commodity
Junichi Nakajima ([email protected]),Moritaka Kimura, Yasuhiro Koyama,Hiro Osaki, and Tetsuro Kondo
Kashima Space Research CenterCommunications Research Laboratory893-1 Hirai, Kashima, Ibaraki 314-8501, Japan
1. Introduction
PCs on the market integrated around high per-formance CPU with high-speed bus have reachedability to carry out normal VLBI observation andcorrelation data rate up to 1Gbps. The VLBIdata rate had been categorized as extreme highspeed application which require specially inte-grated recorders. So far the sophisticated systemsdeveloped in laboratories are operated in telescopenetworks. But it caused incompatibility betweenthe different systems, especially in their media.Currently, a typical telescope data rate of 1-Gbps,corresponding to a bandwidth of 500MHz sampledat 2-bit level, is handled by ordinary PCs and thepart of the VLBI system formally called “back-end” are replaced to widely used PCs.The PC back-end is expected to dissolve the incompatibility byits file system. CRL have developed variety of theVLBI interface boards enable conjunction of thetape-VLBI and PC-VLBI. These are the PC-VSSPwhich substitute current moderate speed VLBI in-cluding AD and the PC-VSI which enables high-speed data acquisition beyond the Gbps.
2. PC-VSSP, PC Versatile Sampling Pro-cessor
PCs with 4-channel analog input boards, thename commonly known as the “IP-VLBI”, the sys-tem aim replacement of the VLBI system up to256Mbps. In the PC-VSSP, AD samplers are in-tegrated into the board. Analog inputs, referencesignal and 1-pps signals are connected to the boardthrough BNC receptacles and all VLBI componentsexcept BBC (baseband converter) are disappearedin observation site. The data rate of the PC-VSSPis variable to 1-Mbps to adapt available networkto put real-time VLBI into practice. Spectroscopyup to 16MHz bandwidth using 4-bit quantizationextend its application. VLBI softwares in observa-tion, correlation and bandwidth synthesis are puttogether in the PC. Software for this board are in-tensively developed by VLBI users and evaluatedthrough the mail reflector.
3. PC-VSI, PC VSI interface board
Aim the data acquisition over 1-Gbps, PC-VSI2000-DIM board had developed. Different fromthe PC-VSSP, the interface to outside PC is a digi-tal. Here, internationally agreed VSI-H interface isemployed and the connector is MDR-80. Using thisPC-VSI board, currently two samplers ADS1000and ADS2000 are connected. The ADS1000 is1Gsps (1024Msps) extremely low jitter high speed1-ch AD sampler. The sampler enables direct tele-scope IF sampling. This is used for high sensi-tivity observation. The other ADS2000 supports16-channels 64Msps for future geodetic VLBI. Aswell as the samplers, VSI connector enables theconnection of other VSI instruments. For example,a MMM converter released from Metsahovi obser-vatory, Helsinki University of Technology, will en-able the VLBA/Mk-V type data converted VSI.Another PC-VSI2000-DOM board can outputs theVSI data from PC side when the VSI raw data isneeded.
4. Conversion of VLBI Development
These two developments are related in their soft-ware development. Hardware controls usually doneby RS232 and GPIB are confined to device drivers.A simple scheduling software or a commonly usedFS/9 field system can control these boards usingVSI-S (software) protocols. The correlation soft-ware is not hardware dependent too. Hence, allVLBI researchers can participate the correlationprogramming for the desired purpose as well asthe successive analysis on the PC. Opportunitiesto touch radio telescopes raw data will enable in-terference removal technique and other interests tothe data.In Figure 1, we can perceive that the there are
development part and commodity part in the PC-VLBI. The PC related technologies are rapidly im-proving at huge commercial demand. We will makefull use of these available products. Bottleneck ofthe recent PC technology is the PCI-bus limita-tion of 64bit/66MHz. This will be increased severaltimes in its alternated generation.As for the removable media, we can expect opti-
cal RAID storage and holographic disc in near fu-ture. The kind of media does not have much impor-tance in the PC-VLBI system, and only separatedtelescopes in remote islands will need them. Froma engineering point of view, the VLBI researcherhad been captivated the hardware compatibility.The VSI-H standard established this compatibil-ity. The VLBI data rate is adapted to common PCand the file system handles them as data set. Fur-ther point, less difficult data file compatibility is re-

November 2002 35
Figure 1. PC-VLBI configuration keep up with emerging PC hardwares. Rationalized back-end by PCcommodity will decrease the load of back-end development work in VLBI. Conjunction to existing recordersystems are used as the data backup.
maining between researchers. In the developmentpart, AD converters are still important as study.In higher band we have to increase the sensitivityof telescope by the AD speed. With the higher sen-sitivity, small telescope can participate VLBI andthis will increase the range of VLBI users towardtemporal communication dishes to high skilled am-ateurs.
Communications Research Laboratory continuesthese development to expand the VLBI field. Weencourage universities and observatories partici-pate with their unique idea to activate the com-munity.

36 IVS CRL-TDC News No.21
Current Status of the VERA
Osamu Kameya ([email protected]),Hideyuki Kobayashi, and the VERA team
National Astronomical Observatory Japan
Abstract: VERA (VLBI Experiment of Radio As-trometry) has finished construction in 2002 March,and test observations of it are under going.
1. Introduction
The VERA system consists of four VLBI sta-tions at Mizusawa, Iriki, Ogasawara (Chichi-jima), and Ishigakijima. The maximum baseline(Mizusawa,Ishigaki-jima ) is 2300 km. Construc-tion of the former three stations of VERA startedin 2000, and finished in 2001. The construction ofthe fourth station at Ishigaki-jima started in 2001and finished in 2002 March.The VERA is a newly developed VLBI system,
which is dedicated to the differential VLBI. Wehave succeeded to obtain not only the first lights ofall stations but also first fringes between them (Fig-ure 1). We have also succeeded simultaneous VLBIobservations using the 2 beam systems(Figure 2).
Figure 1. VERA first fringe between Mizusawa andIriki stations.
2. Scientific goal
The scientific goal of theVERA is mainly mea-surements of the proper motion and parallax ofmasers in the Galaxy (Figure 3). 3D map andvelocity field of the Galaxy will be clear by us-ing the results. Additionally, there are some otherinteresting scientific goals: detailed velocity struc-ture of molecular gas around evolved stars and star
Figure 2. Resutls of 2beam simultaneous observa-tion between Mizusawa and Iriki stations.
forming regions; mass including dark matter dis-tribution in the Galaxy; and phase referencing toimprove sensitivity with long integration; precisemeasurements of moon satellites.
Figure 3. Expected circle of 10% errors in distancedetermination with VERA on the face on view ofthe Galaxy.
3. The VERA System
VERA antenna has dual-beam system withwhich we can observe two adjacent sources, simul-taneously. Minimum and Maximum angular sepa-ration is 0.3 deg and 2.2 deg, respectively (see Fig-ure 4). Amplified radio signals are digitalized andtransmitted to the observation building by using

November 2002 37
Figure 4. Concept of the dual beam receiving system.
optical fiber. The backend system, the frequencystandard, and operation computer system are inthe observation building of each VERA station. Wecan observe, S/X, 22GHz, 43GHz bands (Figure 5).
Figure 5. The real view of the receivers. S/X spiralhorn is seen.

38 IVS CRL-TDC News No.21
VSOP-2, a next generation
space-VLBI mission
Yasuhiro Murata1 ([email protected]),Hisashi Hirabayashi1, and members ofSpace VLBI WG1,2,3
1 Institute of Space and Astronautical ScienceYoshinodai 3-1-1, Sgamihara, Kanagawa229-8510, Japan
2National Astronomical Observatory of JapanOsawa 2-21-1, Mitaka, Tokyo 181-8588, Japan
3Other institutes
Abstract: Following the success of the VLBI SpaceObservatory Programme (VSOP), a next genera-tion space VLBI mission, dubbed VSOP-2, is be-ing plannned in Japan. Higher observing frequen-cies, cooled receivers, increased bandwidths, dual-polarization capability, and a largere telescope di-ameter will result in gains in resolution and sensi-tivity by factors of about 10 over the VSOP mis-sion. VSOP-2 science goals include studies of emis-sion mechanisms in conjunction with X-ray anclgamma-ray satellites, studies of magnetic field ori-entation and evolution in jets, and the highest res-olution studies of spcctral line masers and mega-masers. Here we describe the development of thespace antenna, high speed sampler, and the satel-lite system.
1. Introduction
The successes of the VLBI Space Observa-tory Programme (VSOP) are described elsewhere[Hirabayashi et al., 2000]. Planning for the nextgeneration space VLBI mission VSOP-2 is well un-derway. The VSOP-2 spacecraft will have a 10 mclass antenna with cryogenically cooled low- noisereceivers and a downlink data rate of at least 1Gbps, resulting in an improvement of an order ofmagnitude in sensitivity over the VSOP mission[Hirabayashi et al., 2001]. Observing frequenciesup to 43 GHz will allow high angular resolutionobservations of the optically thin emission in manyAGN cores. An apogee height of at least 30,000km will allow an angular resolution of 25 micro-arcseconds to be achieved at 43 GHz, correspndingto around 10 Schwarzchild radii at the distance ofM87.
2. VSOP-2 mission
2.1 The satellite
The VSOP-2 spacecraft will, like HALCA, bethree-axis stabilized. However, the VSOP-2 satel-
Figure 1. Possible appearance of the VSOP-2 satel-lite.
lite will probably employ an off-axis paraboloid an-tenna, in contrast to the on-axis design of HALCA.One of the technical challenges is be the require-ment placed on the surface accuracy of the meshantenna by the highest observing frequency of 43GHz (a wave length of 7 mm). A schematic viewof VSOP-2 satellite is shown in Figure 1.Due mainly to mass constraints, HALCA de-
tected only Left-hand Crcular Polarization (LCP)radiation, and its front-end radio-astronomy re-ceivers were not cooled. The VSOP-2 satellitewill detect both LCP and RCP, and will usecryogenic cooler to reduce the system tempera-ture of the receivers by a factor of around three.Sensitivity is ultimately limited by the coherencetime, which becomes increasingly affected by atmo-spheric fluctuations above the ground telescopes athigher frequencies. Several posibilities for ”phase-referencing” to improve sensitivity by extendingthe coherence time are under study.Observing requires a two-way link between the
satellite and a tracking station: a reference tone,derived from a hydrogen maser frequency standardis uplinked, and the science data down-linked fromthe satellite in real-time. HALCA used the 15GHz band for uplink and a 128 Mbps downlink,but VSOP-2 will probably require a shift to the37 GHz band for the 1-giga-bit-per-second track-ing link. Testing of potential high-speed samplersfor the on-board has been started.The comparison of the specifications of the
VSOP and VSOP-2 satellites is shown in Table 1.
2.2 Ground radio telescopes
Over 25 ground telescopes and arrays from 14countries have participated in VSOP observations.By the time of the launch of the VSOP-2 spacecrafta number of new arrays and telescopes will also beoperation. It is expected that upgrades of the sen-

November 2002 39
Table 1. Comparison of the specifications of theVSOP and VSOP-2 satellites. The options columngives possible extensions of the baseline specifica-tion for the VSOP-2 satellite which are currentlyunder discussion. In comparison, the VLBA has aresolution of 0.078 mas at 7 mm and a sensitivityof 4.9 mJy at 6 cm.
VSOP VSOP-2 (options)Ant. Diameter 8 m 10 m 10∼15 mApogee Height 21,500 km 30,000 km < 40,000 kmPeriod 6.3 hours 8.9 hoursPolarization LCP LCP/RCPDownlink rate 128 Mbps 1 Gbps 1∼2 GbpsBands (GHz) 1.6, 5, (22) 5/8, 22, 43 5 to 8, 86Resolution 0.3 mas 0.025 masSensitivity 140 mJy 12mJy ( 5 GHz, 25 m GRT)Launch 1997 Feb 2008
sitivity of ground radio telescopes will further im-prove the VSOP-2 space-ground baseline sensitiv-ity. The VERA array of the National AstronomicalObservatory of Japan gives the possibility of phasereferencing observations with the VSOP-2 space-craft.
2.3 Scientific targets
The VSOP mission has produced astronomicalresults on AGN jet structure and evolution, highbrightness temperature sources, and the plasmatorus around the AGN, and so on.The science goals of the VSOP-2 mission in-
clude: the stucly of emission mechanism in con-junction with the next generation of X-ray andgamma-ray satellites; full polarization studies ofmagnetic field orientation and evolution in jets, andmeasurements of Faraday rotation towards AGNcores; high linear resolution observations of nearbyAGN to probe the formation and collimation of jetsand the environment, around super-massive blackholes; and the highest resolution studies of spectralline masers and mega-masers, and circum-nucleardiskd. Other non-thermal objects such as X-ray bi-naries, SNR, the Galactic Center, and gravitationallenses will also be able to be observed.
3. The activities of the development
3.1 Antenna development
A 7-segment, offset, 10-m class antenna (Fig-ure 1) is under development. This antenna has alighter weight, and easier adjustment mechanism,than that of HALCA. The basic concept of thistype of antenna was developed by NASDA for theETS-VIII mission, which will be launched in 2004.However, the planned surface accuracy of ETS-VIII
Figure 2. A model of the central part of a singleantenna module to evaluate the adjustment of thesurface accuracy. The size of the radial bars is 1/2of the actual antenna module.
is lower than that required for the VSOP-2 mission.We made the model of the central part of 1 segment(Figure 2) to evaluate how accurately the antennasurface can be adjusted. We succeeded to get anaccuracy of less than 0.2 mm rms.
3.2 High speed sampler radiation test
One of the problems for VSOP-2 is how to sam-ple the data on-board, if we follow the same ap-proach as HALCA. We asume a giga-bit rate ofdata sampling to obtain the desired sensitivity.However, we can not find any A/D sampler LSIchips qualified for use in space. We tested a 10Gbps, 1 bit sampler and a 1:16 demultiplexer, todemonstrate a possible solution for the on-boardhigh speed sampler. We carried out a 1000 kradtotal dose test and a single event test. Figure 3shows the LSI’s on the test bench for the singleevent test. We confirmed we can use those LSI’son the VSOP-2 orbit.
3.3 On-board cooler and the LNA systemstudy
We are now designing the front-end of the VSOP-2 observing system including the cooling system.We made a simulation of a single band obrservingsystem with an existing cooler rated for space use,and found we could cool to 30 K. We know thatthe temperature depends strongly on the design

40 IVS CRL-TDC News No.21
Figure 3. Three sets of the 10 Gbps sampler andthe demultiplexer on the test bench for the singleevent test.
of the three-band observing system. Now we aredesigning the front-end feed. We are studying theuse of a MMIC HEMT amplifier using chips soldby a Japanese LSI company.
3.4 Giga-bit data link
A giga-bit data transmission requires more than1 GHz bandwidth frequency allocation. The onlypossible band based on frequency allocation regu-lations is 37–38 GHz. The uplink frequency will bemoved to 40 GHz, so that we can use the same cir-cuits for up- and down-link frequencies. We stud-ied the link budget including signal transmissionin bad weather. The detailed study of this issue isdescribed by Springett [2002]. We also need to de-velop the modulator and demodulator for the giga-bit data transmission.
3.5 Possibility of the phase-referencing
Phase referencing observations are a powerfulmethod to determine accurate relative positionsof radio sources, and longer integration times forweaker sources. High speed switching betweensources (or a multi-beam antenna like the VERAantenna) and a ∼ 1 cm orbit accuracy are required.Both are very difficult. We are now studying thepossibility of fast switching using the control mo-ment gyro (CMG), which is a higher torque actua-tor. We are also studying the possibility of obtain-ing a higher orbit accuracy using an on-board GPS
system and accelerometer.
3.6 System development
The total system design, including studies of thepower, mass and thermal budgets, and compati-bility with the rocket fairing is important. Thesedevelopments have not yet progressed far, as weare now mainly working with the development ofindividual componentd. We will move on to thetotal system development in the near future.
4. Submission
There has been considerable activity within theUSA recently, culminating in the submission of awhite paper to NASA’s Structure and Evolutionof the Universe (SEU) roadmap committee. Thewhite paper describes iARISE, an international fu-ture space VLBI mission involving two orbitingsatellites, with nominally one of these being theVSOP-2 satellite and the other a US-funded satel-lite. The advantage of a two spacecraft mission isthat by placing the two satellites in perpendicu-lar orbits, a better all-sky coverage and more two-dimensional (u, v)-coverages can be obtained. Thelikelihood of a two spacecraft mission eventuatingwill be better known later this year.The international cooperation and coordination
required for VSOP observations make it one of themost complex space science missions undertaken,and similar level of collaboration between all mis-sion elements — ground radio telescopes, trackingstation, orbit determination teams, correlators etc.— will be required for VSOP-2. Submission of theVSOP-2 proposal will take place within the nextyear. Launch on an ISAS M-V rocket could be asearly as 2008.
Acknowledgement: We gratefully acknowledge allcollaborators who have joined discussions aboutVSOP-2 mission. This mission is planned based ondiscussions with researchers from JPL, NRAO, CfA(US), DRAO, SGL (Canada.), ATNF (Australia),JIVE (Europe), Univ. of Ibaraki, Hosei Univ., Ya-maguchi Univ., NAOJ, and ISAS (Japan).
References
Hirabayashi, H. et al., The VLBI space observa-tory programme and the radio-astronomical satelliteHALCA, PASJ, 52, 955, 2002.
Hrabayashi, H. et al.,Current status of the VSOP-2mission, Galaxies and their Constituents at the High-est Angular Resolutions, ed. R.T. Schilizzi, S.N. Vo-gel, F. Paresce, and M.S. Elvis (lAU Symposium 205)pp.428–429, 2001.
Springett, J.C., Achieving Future SVLBI Gbit DataRate, menro for VSOP-2 mission, 2002.

November 2002 41
- News - News - News - News - News - News - News - News - News - News - News -
Farewell ceremony of the Kashima 26m antenna
Taizoh Yoshino ([email protected])
Kashima Space Research CenterCommunications Research Laboratory
893-1 Hirai, Kashima, Ibaraki 314-8501, Japan
On the day we had an IVS TDC symposium at Kashima, we had a small ceremony to say ourfarewell to the 26m antenna since it will be dismantled in the fiscal year of 2002. The 26m antennawas constructed in 1968 and has been used for the tests of satellite communications and pioneeringVLBI work in Japan. In 1992, it was donated to Geographical Survey Institute (GSI) to continue globaland domestic geodetic VLBI observations. It worked actively till the new 32m antenna constructionin Tsukuba by GSI. This informal ceremony was held by CRL and GSI jointly. At the ceremony, Dr.Yukiyasu Suguri, who was a former director of Kashima Branch at the time of antenna construction,and six guests who worked with the 26m antenna attended the ceremony from the CRL side. AndDr. Kazuo Komaki, Director of Geodetic Department and GSI staff attended. The participants of thesymposium also took part in the ceremony. On that day, we had a beautiful weather. After the finalantenna tour, we thanked again to the 34 year’s great activity of the 26m antenna.
Photo 1. The Kashima 26-m antenna and the participants of the farewell ceremony.

“IVS CRL Technology Development Center News” (IVS CRL-TDC News) published by theCommunications Research Laboratory (CRL) is the continuation of “International Earth Rota-tion Service - VLBI Technical Development Center News” (IERS TDC News) published by CRL.In accordance with the establishment of the International VLBI Service (IVS) for Geodesy andAstrometry on March 1, 1999, the function of the IERS VLBI technical development center wastaken over by that of the IVS technology development center, and the name of center was changedfrom “Technical Development Center” to “Technology Development Center”.
VLBI Technology Development Center (TDC) at CRL is supposed
1) to develop new observation techniques and new systems for advanced Earth’s rotation ob-servations by VLBI and other space techniques,
2) to promote research in Earth rotation using VLBI,3) to distribute new VLBI technology,4) to contribute the standardization of VLBI interface, and5) to deploy the real-time VLBI technique.
The CRL TDC newsletter (IVS CRL-TDC News) is published biannually by CRL.
This news was edited by Tetsuro Kondo and Yasuhiro Koyama, Kashima Space Research Center,who are editorial staff members of TDC at the Communications Research Laboratory, Japan.Inquires on this issue should be addressed to T. Kondo, Kashima Space Research Center, Com-munications Research Laboratory, 893-1 Hirai, Kashima, Ibaraki 314-8501, Japan, TEL : +81-299-84-7137, FAX : +81-299-84-7159, e-mail : [email protected].
Summaries of VLBI and related activities at the Communications Research Laboratory are on theWorld Wide Web (WWW). The URL to view the home page of the Radio Astronomy ApplicationsSection of the Kashima Space Research Center is : “http://www.crl.go.jp/ka/radioastro/”.
IVS CRL TECHNOLOGY DEVELOPMENT CENTER NEWS No.21, November 2002
International VLBI Service for Geodesy and AstrometryCRL Technology Development Center News
published byCommunications Research Laboratory, 4-2-1 Nukui-kita, Koganei, Tokyo 184-8795, Japan