i rOCUMENTATION PAGE No eM e~lllll!llI~ ,lI. ., Na .. /O · AD-A252 •r IDnRT 616 rOCUMENTATION...
140
i i form Approved •r IDnRT rOCUMENTATION PAGE oMB No OI--0188 AD-A252 616 eM Na /O e~lllll!llI~ lll lllll ll ............ . .e,....., ...... .. ..... b.;I ,lI. ... t& ....... .,.... .... ........ .. ... , a . T..... wo Hi P- .II Is R-.t-.I', t C -j 1. sc 2. REPORT DATE 13. REPORT TYPE AND DATES COVERED I Spring 1992 I THESIStI FUNNME 14. TILt ANU 5UO,,IL 5. FUNDING NUMBERS / Total Quality Management: Implications for Nursing Information Systems 6. AUTHOR(S) Annette Brownstein, Major 7. PERFORMING ORGANIZATION NAME(S) AND ADDRESS(ES) 8. PERFORMING ORGANIZATION REPORT NUMBER AFIT Student Attending: University of Maryland AFIT/CI/CIA- 92 -031 9. SPONSORING/MONITORING AGENCY NAME(S) AND ADDRESS(ES) 10. SPONSORING/MONITORING AGENCY REPORT NUMBER AFIT/CI Wright-Patterson AFB OH 45433-6583 11. SUPPLEMENTARY NOTES I 12a. D!STRI.UTION AVAILABILITY STATEMENT i 12b DISTRIBUTION CO¢DE • Approved for Public Release IAW 190-1 Distributed Unlimited ERNEST A. HAYGOOD, Captain, USAF I Executive Officer 13. AESTRACT (Mixirrum2&0'word5) DTIC J ha~nit ONbi#d7 JUL__IECT f U 92-18001 122 7. SECURiTY CLASSIFICATIUN i SECU;!!TY . C14: CITION ) 19 SECUNTY. : or REPORT F THs PA C OF I. : TF- IT
Transcript of i rOCUMENTATION PAGE No eM e~lllll!llI~ ,lI. ., Na .. /O · AD-A252 •r IDnRT 616 rOCUMENTATION...

i i form Approved
•r IDnRT rOCUMENTATION PAGE oMB No OI--0188AD-A252 616 eM Na /Oe~lllll!llI~ lll lllll ll ............ . .e,....., ...... .. ..... b.;I ,lI. ... t& ....... .,.... .... ........ .. ... , a . T.....wo Hi P- .II Is R-.t-.I', t C -j 1. sc
2. REPORT DATE 13. REPORT TYPE AND DATES COVERED
I Spring 1992 I THESIStI FUNNME
14. TILt ANU 5UO,,IL 5. FUNDING NUMBERS /
Total Quality Management: Implications for NursingInformation Systems
6. AUTHOR(S)
Annette Brownstein, Major
7. PERFORMING ORGANIZATION NAME(S) AND ADDRESS(ES) 8. PERFORMING ORGANIZATIONREPORT NUMBER
AFIT Student Attending: University of Maryland AFIT/CI/CIA-9 2-031
9. SPONSORING/MONITORING AGENCY NAME(S) AND ADDRESS(ES) 10. SPONSORING/MONITORINGAGENCY REPORT NUMBER
AFIT/CIWright-Patterson AFB OH 45433-6583
11. SUPPLEMENTARY NOTES
I 12a. D!STRI.UTION AVAILABILITY STATEMENT i 12b DISTRIBUTION CO¢DE •
Approved for Public Release IAW 190-1Distributed UnlimitedERNEST A. HAYGOOD, Captain, USAF I
Executive Officer
13. AESTRACT (Mixirrum2&0'word5)
DTIC J ha~nit ONbi#d7
JUL__IECT f
U 92-18001
122
7. SECURiTY CLASSIFICATIUN i SECU;!!TY .C14: CITION ) 19 SECUNTY. :or REPORT F THs PA C OF I. : TF- IT

Total Quality Management
1
Total Quality Management: Implications for
Nursing Information Systems
Annette Brownstein
University of Maryland at Baltimore
Running headi TOTAL QUALITY MANAGEMENT: IMPLICATIONSFOR NURSING INFORMATION SYSTEMS

Total Quality Management:
Implications for Nursing Information Systems
Seminar Paper
Submitted By: Annette Brownstein RN, BSN
Spring, 1992
First Reader:
Carole Gassert, RN, Ph.D., Assistant Professor
Department of Education, Administration, and Health
Policy
School of Nursing
University of Maryland at Baltimore
S i g n a t u r e : _ C _ -\. .C. .
Date: C-Q- - Ck ' , -
Second Reader:
Sharon O'Keefe, RN, MS
Vice President of Nursing
Universit of Maryland Medical Center
Signature: /
Date : / , '-/
LoceaS ioD For
NTIS GRA&IVDTIC TiB ElUna nounced
[]
Just I i c t on -
UnT
Distribut c / .....
Av&,abllXtY Codes!Avol and/or
Dist Special
.4 W

Total Quality Management
2
Table of Contents
CHAPTER 1 .......... ..................... 6
The Problem .......... .................... 6
Background Information ...... ............ 6
Overview of TQM ...... ............. 6
Relationship of TQM to
Nursing Information Systems .... 9
Problem Statement ...... ........... 10
Supportive Evidence ..... .......... 10
Approach ...... .................. . 13
Objective ..... ............... .. 14
CHAPTER 2 ....... ................... 15
Review of the Literature ... ............ 15
What is TQM? ..... ................ . 15
Key Concepts .... ............. 15
Key Tools ..... ............... .. 36
Key Contributors ... ........... 51
Use of TQM in Business . ........ 64
Use of TQM in Healthcare .. .......... . 67
Pros and Cons of TQM ... ............ 69

0 Total Quality Management
3
CHLAPTrER 3.......................72
0 Application......................72
Systems Life Cycle ................ 72
Definition Phase..............73
* Construction Phase.............88
Implementation Phase ........... 92
Operation Phase ............... 95
Potential Application of TQM to NIS's ... 99
CHAPTER 4.....................................101
Summary ....................... 101
Conclusions..................101
Need for MISS to Study TQM Principles . 101
Implications...................102
Potential for Improving NIS's .. ..... 103
Potential for Improving NIS Department
0Management. .......... . .. ..... 104
Potential for the NISS to Assist Agency
with TQM. .............. 106
0 Recommendations.................108
Training in TQM Principles and
Techniques. ............. 108

Total Quality Management
4
Establishment of a TQM Plan ....... .. 109
References ....... .................... ii

Total Quality Management
5
Abstract
Total quality management (TQM) is a management
philosophy gaining widespread use in American
production and service organizations. Though founded
by Americans, it was popularized by its successful use
in post war Japan. Top-level management commitment to
quality, collaborative work efforts, process
improvement, long-term commitment, measurement and
statistical process control, investment in knowledge,
and a customer focus are the core concepts. The
Nursing Information Systems Specialist (NISS) who is
well trained in TQM and implements a sound plan for its
implementation, can aid in development of high quality
information systems and support the quality improvement
endeavors of the parent organization.

Total Quality Management
6
CHAPTER 1
The Problem
BackQround Information
Overview of TOM
The Department of Defense mandates it (Hunt,
1992). The Joint Commission on Accreditation of
Healthcare Organizations (JCAHO) based their new
evaluation programs on it (Koska, 1991). Motorola and
Ford Motor company turned losses into profits when they
implemented it (Berwick, Godfrey, & Roessner, 1991).
The Japanese have been using it's techniques
successfully for years (Berwick et a!., 1991; Hunt,
1992; Walton, 1986). "It" goes by many names --
quality control, quality improvement, continuous
quality improvement (CQI), total quality management
(TQM), quality first, total quality improvement (TQI),
total quality leadership (TQL), etc. -- but the key
concepts are similar (Eskildson & Yates, 1991;
Holzemer, 1990; Oberle, 1990). Those key concepts of
quality in production and service organizations
include:
1. The need to look at the organization as one

Total Quality Management
7
interdependent system.
2. Adopting a new corporate culture and paradigm
putting quality first.
3. Top level leadership and commitment in
implementing quality management.
4. Constancy of purpose.
5. Customer focus, both internal and external.
6. Benchmarking.
7. A process orientation.
8. Continuous process improvement, with emphasis
on prevention and improvement rather than on
inspection.
9. Investment in knowledge.
10. Collaborative approach to process improvement.
11. Long-term commitment, rather than emphasis on
short-term gains.
12. Quality measurement and statistical reports at
all levels.
13. Total involvement (Arikian, 1991; Hume, 1990;
Hunt, 1992; Kaegi, 1990; Sahney & Warden, 1990).
Other key concepts frequently mentioned include the
need for sound customer-supplier relationships,

Total Quality Management
8
understanding the variability of processes as a key to
improving quality, and that poor quality is costly
(Berwick et al., 1991).
Actual definitions of this quality management
approach differ along with the numerous "gurus" who
have written extensively on the subject -- Deming,
Juran, Crosby, Feigenbaum, Ishikawa, etc. (see Chapter
2). One of the most concise definitions on TQM was
given in a speech by Blaine E. Hurst (1991) who said
TQM is "A prevention based management system for
identifying and meeting customer requirements at every
level of every operation through continuous improvement
in the processes through which products and services
are produced." Other definitions reflect similar
concepts, though the words may be different (Hume,
1990).
The recognized pioneer in the field is W. Edwards
Deming who first founG avid listeners for his message
in Japan in 1950. It took another 30 years before
American companies adopted quality improvement
techniques, and has taken even longer for the health
care industry to embrace and apply quality management

Total Quality Management
9
principles (Berwick et al., 1991; Dobyns, 1990; Hunt,
1992; Oberle, 1990; Sahney & Warden, 1990). Deming
speaks of the 14 points of quality and the seven deadly
diseases, which will be discussed in detail in Chapter
2, along with principles from the other recognized
"quality gurus."
What exactly is "quality" in production and
services -- the end goal of all TQM plans? It's been
described as a "fitness for use" or "conformance to
requirements," (Crawford-Mason, & Dobyns, 1991) but can
basically be thought of as meeting the process and
outcome demands of customers with reliability,
responsiveness, assurance, empathy, and needed
tangibles (Berry, Parasuraman, & Zeithaml, 1990; Berry,
Parasuraman, & Zeithaml, 1991). The JCAHO further
delineates quality in healthcare as how services assist
in meeting desired patient outcomes while reducing the
chance of unwanted consequences (West, 1990)
Relationship of TOM to Nursinq Information Systems
The study of TQM guidelines and practices is vital
to Nurse Information Systems Specialists (NISS) because
of the questionable quality of current nursing

Total Quality Management
10
information systems, and the need for these systems to
better support patient care quality and patient care
quality improvement efforts. (Berg, 1983; Simpson,
1991; Simpson, 1992; West, 1990). In addition, TQM
principles can help the NISS to manage and improve
systems to better meet customer requirements -- whether
internal (nursing and other hospital staff) or external
(patients, JCAHO, government agencies, vendors, etc.)
customers.
Problem Statement
The problem derives from this relationship between
TQM and nursing information systems. There is a need
for the NISS to study TQM principles and implement TQM
plans and techniques to improve the quality of nursing
information systems to better meet customer needs and
support quality improvement efforts.
Supportive Evidence
Evidence to support the need for utilizing TQM
practices in managing nursing information systems is
implied throughout the literature. Studies show that
850 of all quality problems in production and service
occur due to poor process management and that there are

Total Quality Management
11
many costs of poor quality -- most of which are hidden
(Hurst, 1991; Milakovich, 1991; President and Fellows
of Harvard College, 1987). Obvious costs can include
customer complaints, errors, excessive overtime,
unnecessary rework, and quality assurance department
expenses. Hidden costs can include staff frustration,
lack of teamwork, malfunctioning or outdated equipment,
lack of competitive knowledge, inaccurate or missing
information, bad reputation, dissatisfied patients, etc
(Milakovich, 1991). While few studies have been
published, I believe this same list could be applied to
many of the nursing information systems in use.
Industry has shown that taking a TQM approach to
quality prevents problems, improves processes, and
decreases the costs of poor quality (Albert, 1989;
Berwick, 1989; Milakovich, 1991).
Unfortunately, it is rare to see a TQM approach in
health care and health care industry, where the
"customers" and "suppliers" of care and services
function as partners (Berwick, 1989; Lehr & Strosberg,
1991). But that tendency is changing as the JCAHO and
others recognize the need for implementing CQI

Total Quality Management
12
practices throughout the healthcare industry (Albert,
1989; Arikian, 1991; Berwick, 1989; Berwick, 1991;
Berwick et al., 1991; Darr, 1990; Deming, 1987; Hoesing
& Kirk, 1990; Jeffer, 1991; Kaegi, 1990; Koska, 1991;
Matthews, 1992; O'Leary, 1991; Ruark-Hearst, 1990;
Sahney & Warden, 1990). Forces pushing for TQM/CQI
implementation in health care include the rising cost
of health care in America, the wide-spread belief that
the increased costs have not resulted in increased
quality of care, rising malpractice costs, increased
government regulation, and the need for a better way to
measure quality of health care (Arikian, 1991; Berwick
et al., 1991).
As noted above, authors have repeatedly questioned
the quality of current nursing information systems. It
stands to reason that the same practices that have
transformed and improved products and services in
companies and a handful of health care agencies, could
also help improve the quality of nursing information
systems. As part of its CQI emphasis, the JCAHO has
called for increased involvement of nursing management
in identifying hospital and nursing information system

Total Quality Management
13
needs, in making procurement decisions, and in
evaluating results of the decisions (Joint Commission
on Accreditation of Healthcare Organizations, 1991;
Patterson, 1991; Simpson, 1991). The JCAHO and others
have also identified the tremendous impact improved
hospital and nursing information systems can have in
assisting an agency to gather and present the
information needed to implement a good CQI/TQM program
(Hurley, 1991; Koska, 1990; Patterson, 1990; Shanahan,
1988). This eVidence further supports the need for the
NISS to study and utilize TQM techniques.
Approach
To assist the NISS in understanding TQM principles
and techniques, a thorough review of the literature is
presented in Chapter 2 of this paper. This review
further defines TQM/CQI and its key concepts, and
differentiates CQI from older Quality Assurance
practices. Major tools used in TQM are explained. In
addition, the history of the quality movement is
introduced, along with the contributions of key quality
authors, including Deming, Juran, Crosby, Costello, and
Ishikawa. The use of TQM in business and in healthcare

Total Quality Management
14
is then presented, with the emerging evidence of its
use in healthcare information systems. Finally, views
on both the pros and cons of TQM are addressed.
Chapter 3 applies the concepts learned by showing
the potential for implementing TQM in the systems life
cycle. TQM's possible use to improve the quality of
nursing information systems, improve the management of
NIS departments and agencies, and the NIS role in
facilitating TQM implementation in an agency is
discussed.
Chapter 4 summarizes the paper presenting the
conclusion, implications, and recommendations this
study suggested.
Objective
The universal objective of this paper is to
present a primer on TQM for potential use to improve
nursing information systems, systems management, and
use of information systems to support the TQM/CQI plans
of healthcare agencies.

Total Quality Management
15
CHAPTER 2
Review of the Literature
What is TOM?
A composite definition of TQM was presented in
Chapter 1, along with a list of concepts most
frequently used to describe principles and techniques
of quality management. Different quality authors
stress the precepts they see as having the most
relevance in instituting a quality program. This
author feels the particular organization,
organizational maturity, and situation may dictate
which approaches are best suited for a successful TQM
plan. However, a thorough understanding of the most
frequently useu TQM terms enables the quality
implementer to better plan for total improvement.
These terms are presented in detail below.
Key Concepts
Interdependence of system. To effectively look
for areas of organizational improvement, the quality
implementer must realize that the organization is one
interdependent system made up of work units, suppliers,
and customers (internal and external) (Hunt, 1992).

Total Quality Management
16
All must interact in a healthy way to create a quality
product or service. Rather than just focusing on the
end product to determine quality, emphasis on the
processes, components, and interactions that contribute
to the outcome are vital. As one author wrote, "most
service failures are not failures: they have been
designed into the system" (Heskett & Schlesinger, 1991,
p. 73). Understanding that system must be an early
step to quality improvement.
Commitment of top level leadership. Most quality
authors stress the importance of top level leadership
and commitment to quality improvement. A top-down
approach to initiating TQM helps provide the vision,
corporate philosophy, and planning needed for a TQM
program to be successful, along with stressing the
responsibility and accountability managers must take in
improving quality (Albert, 1989; Arikian, 1991; Berwick
et al., 1991; Garvin, 1987; Geber, 1990; Green, & Katz,
1992; Hunt, 1992; Leonard, 1989; Merry, 1991). Top
managers can show this commitment to QI by doing the
following:
1. Seek to improve the system, rather than

Total Quality Management
17
allocating blame.
2. See themselves as suppliers to internal
customers, whose needs and expectations they strive to
understand and exceed.
3. Teach quality improvement to their workers.
4. Continually expand their quality improvement
knowledge.
5. Ask for data from within, and outside, their
organization.
6. Expand the use of QI throughout the
organization, giving management guidance and assistance
with planning.
7. Eliminate barriers to total involvement and
commitment to quality.
8. Manage by walking around (MBA). True
understanding of the system cannot be gained by sitting
behind a desk.
9. Communicate -- including active listening.
10. Follow-up on suggestions.
11. Bridge the gap between the internal and
external customers.
12. Actively take part in QI projects and teams.

Total Quality Management
18
13. Create a corporate culture and strategies that
foster QI efforts (Hacquebord, & Scholtes, 1988; Merry,
1990; Sahney & Warden, 1990).
Emphasis on auality in corporate culture. As
mentioned above, top management must create a corporate
culture that emphasizes quality improvement efforts
throughout the organization (Berwick et al., 1991;
Hunt, 1992; Leonard, 1989). But it must be recognized
that establishing such a cultural change is a long-term
project, usually taking between three to ten years
(Arikian, 1991; Sahney & Warden, 1990). Ways to show
the significance of quality include:
1. Demonstrating executive commitment, and not
assigning all responsibility for quality to others.
2. Not making assumptions about the needs and
expectations of customers (internal and external), but
listening to them instead.
3. Encouraging doing the right thing right, the
first time.
4. Understanding the costs (overt and hidden) of
poor quality.
5. Prevention, not inspection.

Total Quality Management
19
6. Look for continuous, long-term improvements,
not the short-term, one-time fixes.
7. Fostering total involvement in quality
efforts.
8. Making quality a well-defined corporate
strategy.
9. Analytically understanding the present
culture.
10. Placing quality before profits.
11. Employee empowerment.
12. Trust in the employee.
13. Decentralization of authority.
14. Making middle managers leaders instead of
controllers.
15. Allocate necessary resources for TQM projects
(Albert, 1989; Arikian, 1991; Garvin, 1987; Heskett &
Schlesinger, 1991; Hume, 1990; Hunt, 1992; Hurst, 1991;
Miller, 1991; Sahney & Warden, 1990).
Constancy of purpose. Providing constancy of
purpose is another responsibility of top management.
Giving the organization clear and consistent vision,
goals, and objectives allows workers to plan their

Total Quality Management
20
actions accordingly (Hunt, 1992).
W. E. Deming also sees constancy of purpose as the
actions management takes and encourages to show
commitment to quality -- innovation, research and
education, continuous improvement, and maintenance of
equipment and facilities as well as new aids for
workers to use to improve quality (Deming, 1986;
Walton, 1886).
Focus on customer. Customer focus is a universal
concept of quality discussed in the literature. The
term "customer" refers to both internal customers --
those within the organization, as well as external
customers -- which can include users as well as
suppliers of products and services. An organization
that doesn't take internal and external customer needs
and expectations into consideration when producing a
product or service, is doomed to poor quality (Albert,
1989; berry et al., 1990; Berry et al., 1991; Berwick
et al., 1991; Geber, 1990; Leonard, 1989). Indeed,
most of the ideas for improving quality usually come
from customers (Berwick et al., 1991).
It must be acknowledged that customers are the

Total Quality Management
21
reason for being for the organization, and that their
involvement in process planning and improvement and
their satisfaction with outcomes are essential
(Clausing & Hauser, 1988; Headrick, Melnikow,
Neuhauser, & Vanek, 1991). Management must also
recognize that these expectations and needs are ever-
changing, and must be continually reassessed (Hunt,
1992). After internal and external customers are
identified, eliciting their needed input can be done
via questionnaires, surveys, interviews, customer focus
groups, feedback from competitors' customers, service
audits (selectively auditing customer interfaces with
the organization), listening to employees, feedback to
customers' recommendations, brainstorming and
responsive suggestion programs, (Albrecht, 1990;
Berwick et al., 1991; Hume, 1990; Sahney & Warden,
1990). Characteristics of customer interaction that
impact on quality include the complexity of the
interaction, the number of people involved, the number
of handoffs between departments, friendliness of
direct-contact people, speed in getting things done,
quality of information provided to the customer,
Total Quality Management
22
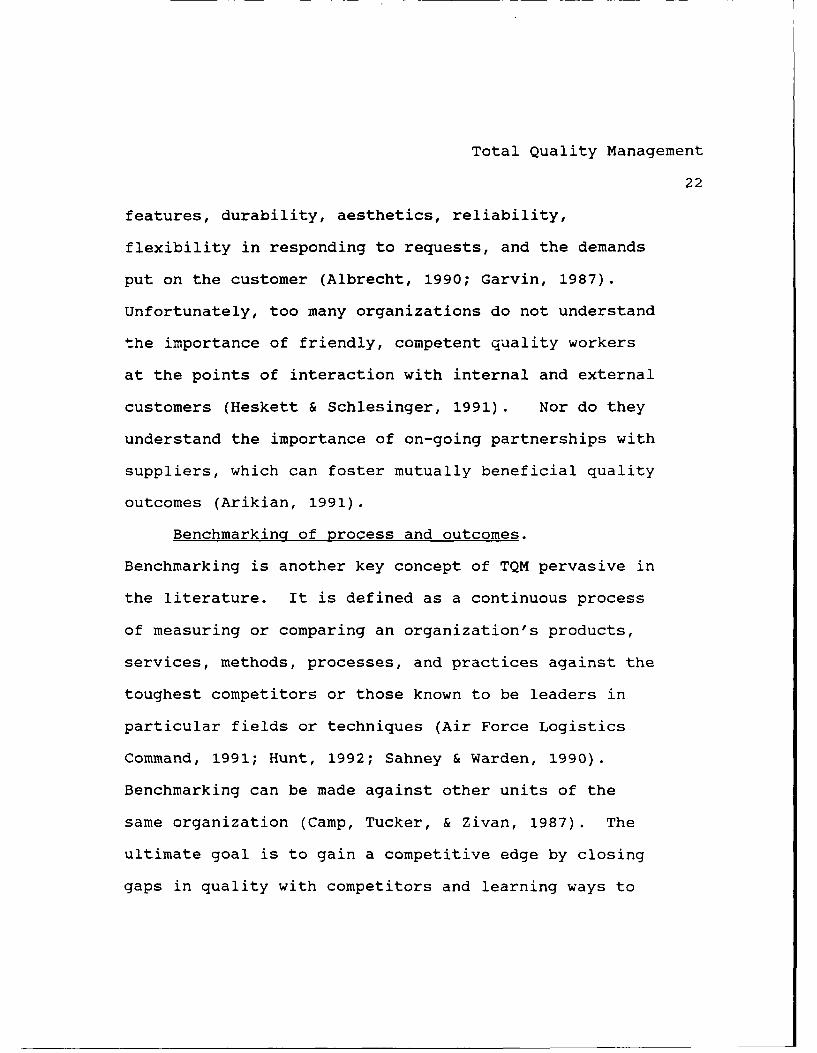
features, durability, aesthetics, reliability,
flexibility in responding to requests, and the demands
put on the customer (Albrecht, 1990; Garvin, 1987).
Unfortunately, too many organizations do not understand
the importance of friendly, competent quality workers
at the points of interaction with internal and external
customers (Heskett & Schlesinger, 1991). Nor do they
understand the importance of on-going partnerships with
suppliers, which can foster mutually beneficial quality
outcomes (Arikian, 1991).
Benchmarking of process and outcomes.
Benchmarking is another key concept of TQM pervasive in
the literature. It is defined as a continuous process
of measuring or comparing an organization's products,
services, methods, processes, and practices against the
toughest competitors or those known to be leaders in
particular fields or techniques (Air Force Logistics
Command, 1991; Hunt, 1992; Sahney & Warden, 1990).
Benchmarking can be made against other units of the
same organization (Camp, Tucker, & Zivan, 1987). The
ultimate goal is to gain a competitive edge by closing
gaps in quality with competitors and learning ways to

Total Quality Management
23
exceed their quality.
Finding your competitors or internal work units
who excel in practices is usually fairly easy. They're
the ones talked about most within your organization's
field. However, finding targets for bencnmarking among
non-competitors is more difficult, though often most
useful (Camp et al., 1987). Lack of knowledge of their
specialty contributes to the difficulty. Trade
journals, consultants, annual reports, conferences, and
professional meetings are all potential identification
aids (Camp et al., 1987). But while finding
organizations to benchmark among non-competitors is
laborious, it is usually easier to gain their
cooperation than gaining competitors' assistance.
The process of benchmarking involves four major
steps:
1. Figuring out what to benchmark.
2. Finding the object of benchmarking efforts.
3. Finding out how the organization achieves the
results.
4. Deciding to implement the changes needed in
your organization to meet or exceed the benchmark

Total Quality Management
24
(Hunt, 1992).
Focus on process improvement. Poorly planned and
implemented processes, not individuals, account for
more than 85% of all errors or delay problems (Coffey &
Marszalek-Gaucher, 1991; Deming, 1982; Hume, 1990;
Kaegi, 1990; Sahney & Warden, 1990). Most of these
processes involve more than one department and are a
result of management choices. As a result, quality
experts stress the need to spotlight process
improvements in organizations -- particularly where
work units interact (HesketL & Schlesinger, 1991; Hume,
1990). This changes the traditional way of "assuring"
quality -- by centering attention on the finished
product or service and inspection rather than
prevention (Berwick et al., 1991; Geber, 1990; Hunt,
1992).
Microanalysis is often employed, as staff members
continually examine work processes, defining problems
or areas for improvement, and implementing small
refinements at a time. Authors label the process
improvement activities as PDCA -- plan, do, check, and
act (Hume, 1990).

Total Quality Management
25
Planning involves defining measures of quality,
measuring performance, analyzing the process, and
identifying improvement actions by using statistical
quality control. Doing is the actual implementation of
improvement actions -- those that eliminate
redundancies, rework, and waste. Checking is measuring
the results of improvement efforts. Acting finally
makes the improvement part of the norm by reflecting it
in plans and procedures (Barth, 1989; Hume, 1990).
Process improvement is continuous, and the PDCA cycle
perpetually repeats.
Paramount in process improvement is the
understanding of common and special cause variation.
Common causes variation in processes (also called
random causes), permeate the process and are the focus
of most process improvement activities. Special cause
variation are usually the result of some intervening
event or breakdown (Hume, 1990). If important causes
in variation are not identified and controlled, quality
will suffer (Berwick et al., 1991).
Investment in knowledge. Educating workers
throughout the organization is a necessary quality

0
Total Quality Management
26
investment, according to TQM theory (Arikian, 1991;
Leonard, 1989; Sahney & Warden, 1990). They require
continuous training both in quality improvement
techniques as well as opportunities to improve job
knowledge and skills. Besides specific training
required for collaborative activities, described below,
employee education may be technical and related to job
skills, systems orientation training, new technical
skills, a basic overview of quality, quality technical
advisor training, and quality leadership training
(Hacquebord & Scholtes, 1988). Some believe any on-
going training will ultimately benefit the organization
(Dobyns, 1990; Heskett & Schlesinger, 1991; Walton,
1986). Investment in staff instruction helps assure a
motivated, talented work force equipped with up to date
information needed to maximize TQM efforts and deal
with new work methods -- perhaps even new assignments
within the organization (Heskett & Schlesinger, 1991;
Hunt, 1992; Walton, 1986).
Emphasis on teamwork/collaboration. Teamwork
(sometimes referred to as collaboration) is another
essential feature of TQM activities. It complements

Total Quality Management
27
the next concept, total involvement, with an aim of
fostering universal efforts in the TQM organization
(Hunt, 1992). Equally important benefits of
collaboration are an expanded knowledge base of quality
improvement workers, and shared goals among workers,
customers, functions, and/or departments, and improved
communication and cooperation between departments or
management and workers (Milakovich, 1991; Sahney &
Warden, 1990). In addition, by bringing together staff
from a cross-section of the organization (horizontally
and/or vertically), those processes needing improvement
that traverse work boundaries are best addressed
(Arikian, 1991; Berry et al., 1990; Berwick et al.,
1991; Hunt, 1992; Walton, 1986).
Management could form their own quality council
that tackles an issue and charges another team among
line workers to do the same. Or management can sit
directly on teams with workers, which can assist in the
upward flow of information and speed decision making
(Berwick et al., 1991). Team membership between six to
ten (some even say up to twelve, fifteen or twenty) can
ease communication, yet still benefit from differing

Total Quality Management
28
views and knowledge bases (Albert, 1989; Berry et al.,
1990; Milakovich, 1991; Sahney & Warden, 1990).
Regular meetings, adequate time for meetings, and
leadership support can all add to success (Berwick et
al., 1991).
Unlike teams often thrown haphazardly together in
some organizations (including academia), management
must insure quality teams are first trained in quality
improvement techniques. Training must include use of
statistical tools (discussed below) and structured
problem-solving (Miller, 1991). Other potential
educational areas are team leadership training,
communication, nominal group method, multivoting,
brainstorming, conflict resolution, the PDCA cycle,
quality circles, and meeting planning (Milakovich,
1991).
Once trained, the group examines an improvement
activity appropriate for its area of responsibility
(Hunt, 1992). Such activities could include functional
requirements definition, performance measurement and
assessment, policy setting, decisions on new
directions, a particular process improvement endeavor,

Total Quality Management
29
or customer recognition (Hunt, 1992; Walton, 1986).
Individual team members may communicate, help identify
improvement opportunities, gather data, problem or
opportunity select, analyze causes, recommend
solutions, and analyze solutions (Leonard, 1989). TQM
statistical tools are a form of standardizing
information presentation so all members can understand
group efforts (Hunt, 1992). Working together on such
ventures increases the base of ownership for the
project, helping to secure success (Berwick et al.,
1991; Walton, 1986).
Involvement of everyone. Along with the concept
of teamwork, is the requirement that the entire
organization (from the chief executive down)becomes
personally involved in quality improvement. This is
important because of the wide-spread interaction of
departments and people that affect processes needing
improvement (Berwick et al., 1991). Total involvement
calls for participation of all, as well as empowerment
of all employees to authorize them to make quality
decisions and take needed actions (Geber, 1990; Heskett
& Schlesinger, 1991; Hume, 1990; Hunt, 1992; Merry,

p
Total Quality Management
30
1990; Milakovich, 1991). Managements's own quality
commitment, trust in the worth of their staff, clear
objectives, and open communication fosters universal
TQM efforts (Hunt, 1992).
Recognition and reward. Though an often mentioned
concept of quality, authors conflict on how to reward
quality endeavors. W. E. Deming is adamant about not
setting performance targets (Walton, 1986), yet others
stress the need to recognize and reward for exceeding
targets via quality efforts (Heskett & Schlesinger,
1991). There is general agreement, however, that staff
should never be punished for their quality work and
that quality means an investment in workers --
including not firing at the first sign of economic loss
(Hunt, 1992; Walton, 1986).
Deming states that performance evaluations, as
most are i4ritten, breed fear; encourage short-term
performance rather than long-term planning; discourage
risk-taking; and undermine teamwork by fostering
individual competition (Walton, 1986). Individual
performance is rated, yet how can one take into
consideration work done as a team? And when team

Total Quality Management
31
members compete for evaluation ratings and promotions,
teamwork can suffer. An effective evaluation and
reward system must do away with such obstacles to
promoting TQM activities (Geber, 1990).
Authors such as Berry et al. (1990) and Miller
(1991) see measuring employee performance against
standards as motivating and a useful management tool.
They also recommend observations and customer feedback
as valuable ways to rate and reward staff. Recognition
and reward for exceeding standards can include
compensation or financial incentives. Team awards are
also encouraged, though Deming might argue this still
fosters competition in the organization. Others
suggest a Quality Day 'in the organization where teams
present projects, with top management present (Sahney &
Warden, 1990).
In this author's view, some award and recognition
is probably necessary to motivate and encourage quality
efforts and innovation, though most award and
recognition systems need their own quality improvement
initiatives.
Commitment for long-term. The need to make a

Total Quality Management
32
long-term commitment to quality improvement is another
cornerstone of TQM -- it is not a one-time effort.
Implementing a TQM plan can take from three to ten
years (Hunt, 1992). But the commitment must be long-
term for a variety of reasons, including the need to
plan for long-term benefits in the face of immediate
pressures, restructuring the corporate climate to
support quality throughout the organization, the need
to eventually get everyone trained and involved in
quality endeavors, and the recognition that there must
be on-going continuous efforts to improve (Hunt, 1992;
Miller, 1991; Walton, 1986). Research has shown that
despite the time it takes to have TQM permeate an
organization, return on investment is almost immediate,
with many reporting efforts paying for themselves
within the first year of implementation (Hunt, 1992).
Success of this long-term dedication can be seen
once top management spends more time and effort on
quality improvement than on solving financial problems
or "putting out fires"; when quality issues are
discussed at all organizational meetings, and when
everyone applies TQM techniques regularly (Sahney &

Total Quality Management
33
Warden, 1990; Walton, 1986). Then it can be said that
the organization has transformed, yet TQM practices
must be perpetuated (Sahney & Warden ,1990).
Cost of poor quality. The need for a long-term
and continuous commitment to TQM is the basic fact that
poor quality increases costs to both the organization
and its customers (Berwick et al., 1991). If processes
are poorly designed, they will not meet customer
expectations and needs. Costs are incurred via waste,
rework, loss of market share, and possibly liability
suits (Berwick et al., 1991). It is estimated that
between 25 to 30 percent -- some even claim 50
percent -- of total costs of products and services are
due to process failures (Berwick et al., 1991; Hunt,
1992). This holds true for the healthcare industry as
well as other production and services industries
(Milakovich, 1991).
The cost of quality is measured by understanding
both the hidden (or indirect) and visible (or direct)
costs. Hidden costs can include a bad reputation with
customers, a frustrated staff, or missing charts in a
hospital. Visible costs can include customer
Total Quality Management
34
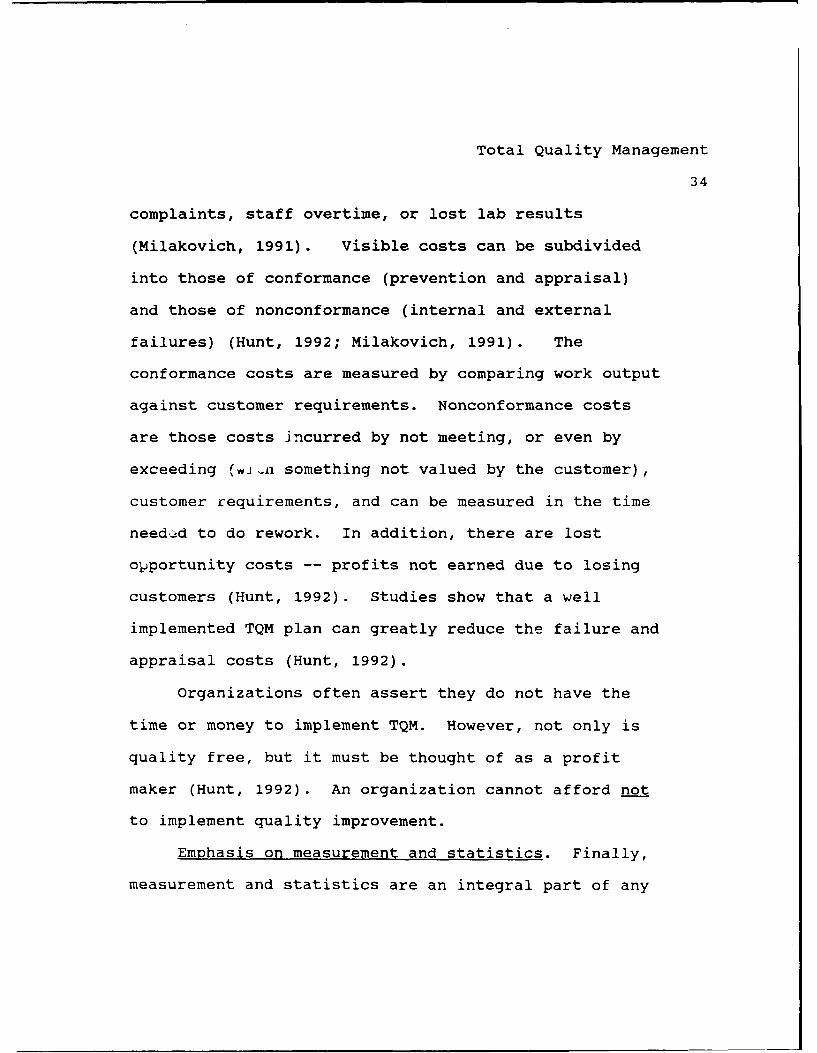
complaints, staff overtime, or lost lab results
(Milakovich, 1991). Visible costs can be subdivided
into those of conformance (prevention and appraisal)
and those of nonconformance (internal and external
failures) (Hunt, 1992; Milakovich, 1991). The
conformance costs are measured by comparing work output
against customer requirements. Nonconformance costs
are those costs incurred by not meeting, or even by
exceeding (w:..n something not valued by the customer),
customer requirements, and can be measured in the time
needed to do rework. In addition, there are lost
opportunity costs -- profits not earned due to losing
customers (Hunt, 1992). Studies show that a well
implemented TQM plan can greatly reduce the failure and
appraisal costs (Hunt, 1992).
Organizations often assert they do not have the
time or money to implement TQM. However, not only is
quality free, but it must be thought of as a profit
maker (Hunt, 1992). An organization cannot afford not
to implement quality improvement.
Emphasis on measurement and statistics. Finally,
measurement and statistics are an integral part of any

Total Quality Management
35
successful TQM program. All employees must become
familiar and comfortable with their use in
understanding and improving processes.
Statistics and measurement help recognize special
and common causes of variation (see Focus on process
improvement above). Special causes are easier to
identify. Once they are brought under control, it will
be easier to understand the common causes on which to
focus improvement efforts (Walton, 1986). These same
measurements can then measure the results of the
improvement attempts (Geber, 1991). Decisions in the
improvement process are therefore based on fact, rather
than opinion (Hume, 1990). In short, they assist one
to organize, analyze, visualize, and understand quality
information (Hunt, 1992).
The math abilities needed to learn TQM statistics
is at a seventh or eighth grade level and fairly easy
to use after training (Hume, 1990; Walton, 1986). They
should not inhibit the total involvement needed for TQM
plans. The basic tools for process improvement -- cause
and effect diagram, bar chart, checksheet, flow chart,
Pareto chart, run chart, histogram, control chart, and

Total Quality Management
36
scattergram -- are discussed in the next section
(Barth, 1989; Walton, 1986).
Key Tools
The most important tool in implementing a TQM
program is a solid plan to incorporate all of the above
concepts of quality management into the organization.
In this section, the key statistical and measurement
tools needed for process improvement are discussed.
Readers are referred to Guide to Quality Control
(Ishikawa, 1976) or The DeminQ Management Method
(Walton, 1986) for more in-depth information. The
decision on which tool to use is based on the purpose
of the study and the experience and partiality of the
users (Hunt, 1992).
Cause-and-effect diaQram. This tool is also known
as the fishbone or the Ishikawa (its inventor) diagram.
It helps show the characteristics of a problem or
process and the factors or causes that contribute to
them (Barth, 1989; Hume, 1990; Hunt, 1992). It is most
useful during brainstorming, to help understand a
process, or in planning improvement activities. The
problem or effect is placed to the right (head of the

Total Quality Management
37
fish) while to the left are the causes (or bones),
arranged by categories (see Appendix A).
The steps to construct this diagram are:
1. Define the effect (problem) as best possible
and place it to right.
2. Brainstorm causes (the whys).
3. Categorize causes, and place their labels as
"big bones."
4. Place causes as "small bones."
5. Continue asking for "whys" and add.
6. Highlight most likely causes.
7. Use other tools to verify causes (Hunt, 1992).
The benefits of this tool include the ability to:
1. Stimulate thinking about the process.
2. Focus discussion.
3. Lead to verifying actual causes.
4. Be used for any problem (Walton, 1986).
Checksheet. A checksheet (see Appendix B) is a
simple count of frequency of number of times particular
events happen (Barth, 1989; Hume, 1990; Hunt, 1992).
The user is not interested in "why" but in what, who,
where, when, or how. A grid is made of the categories

Total Quality Management
38
of information and the count of occurrences.
Brainstorming and/or multivoting can determine what to
count (Hunt, 1992).
Bar chart. Bar charts allow comparisons of
quantities of variables measured (Hunt, 1992). The
height of the columns (or bars) (or length of the rows
for horizontal bar charts) show the relative frequency
of the occurrence (see Appendix C). The steps involved
include:
1. Collect raw data (possibly using a
checksheet).
2. List and label the categories (nominal data)
across the horizontal scale.
3. Write the vertical scale insuring the largest
and smallest values can be included.
4. Draw bars to represent the quantities of each
category measured, insuring the bars do not touch.
5. Multiple bars can be draw for each category,
possibly showing measurements at different time
periods.
6. Title the chart and include legends (Hunt,
1992). Advantages include its wide potential and ease

Total Quality Management
39
of use.
Flow chart. Flow charts are used to understand
steps involved in a process, via a pictorial
representation, so subsequent measures can be taken to
improve the process (Hume, 1990; Hunt, 1992; Walton,
1986). Relationships become clearer, as often steps in
a process aren't readily known until a flow chart is
developed (Walton, 1986).
Three types of flow charts are commonly used in
TQM -- the top-down flow chart, detailed flow chart,
and the work-flow diagram (Hunt, 1992). The first
variety outlines the most important steps in a process
and is fairly easy to construct and understand. This
type can also form the basis for the more detailed flow
chart, which shows all process steps, decision points,
and feedback loops. This detailed chart is usually
only used if the other types do not show sufficient
technicalities (Hunt, 1992). Finally, the work-flow
diagram gives a picture of how work flows through the
organization (Hunt, 1992) (see Appendix D).
Pareto chart. The Pareto chart assists the user
to isolate the importance of certain data (problems or

Total Quality Management
40
causes) compared to other. As often explained, it
helps to sort out the "vital few" from the "trivial
many" (Hume, 1990; Hunt, 1992; Walton, 1986). The
Pareto principle (named after an Italian economist)
identified by quality expert Joseph Juran, states that
only a few variables (20 percent) explain the bulk (80
percent) of the problems (Hunt, 1992). Therefore the
diagram can show which problems to tackle and in what
order (Barth, 1989).
The Pareto looks very much like a bar chart,
except that the bars are lined up in descending order
of importance (according to frequency, cost, time, or
another important criterium). The steps of creating a
Pareto chart include:
1. Select the primary causes of a problem
(usually from a cause-and-effect diagram).
2. Collect observation data on these causes (via
a checksheet type tally).
3. Calculate the percentage of each cause.
4. Set the right vertical scale from 0-100
percent.
5. Set the left vertical scale, matching the top

Total Quality Management
41
to the total number of observations.
6. Draw the bars for each category of
observation.
7. Plot the first point of the pie-like
connecting line at the upper right corner of the first
bar.
8. Add the percentages for causes one and two.
Plot the result above bar two. Continue doing a
cumulative addition of percentages and plotting results
above the corresponding bars. The last point should
equal 100 percent.
9. Join the dots with a line (Hunt, 1992; Larson,
1990) (see Appendix E).
Run chart. The run chart is also referred to as a
time line chart in the literature. It allows a
graphical display of the change in data results over
time, to track trends (Barth, 1989; Hunt, 1992; Walton,
1986) (Appendix F). The horizontal scale is divided
into some measure of time -- such as days of the week,
months, years, etc.). The vertical scale represents
the quantity of occurrences, either in frequency or
percentage (Hunt, 1992). The chart is made by:

Total Quality Management
42
1. Collect the raw data.
2. Place evenly spaced time intervals along the
horizontal axis.
3. Place evenly spaced intervals for the vertical
axis.
4. Plot the quantities observed and connect via a
line.
5. Add grid lines to clarify the results if
needed.
6. Add title and legends to clarify (Hunt, 1992).
Histogram. The histogram is another means of
graphically displaying how frequently something occurs
(Hume, 1990; Walton, 1986). It shows the distribution
of the variable data by using connecting bars
proportional in height to the frequency of the group
counted (Hunt, 1992). It is particularly useful in
setting standards from which to compare future results
against expected variation (Barth, 1989).
Prepare a histogram by:
1. Collect the data and count the total number of
observations counted.
2. Determine the range of the results (largest

Total Quality Management
43
result minus smallest).
3. Divide the range by the number of desired data
bars (from six to twelve).
4. Place class intervals along the horizontal
axis.
5. Place vertical frequency scale.
6. Arrange data points in ascending order.
7. Draw the height of each bar to correspond with
appropriate frequency (Hunt, 1992) (see Appendix G).
Scatter diaQram. The scattergram (or scatter
diagram) is a means to show the relationship between
two variables -- such as between light levels and
computer errors (Barth, 1989; Hume, 1990; Hunt, 1992;
Walton, 1986). The distribution of the data points on
the diagram show the strength of that correlation
(Hunt, 1992). Even if strong, this does not prove
causes. If there is such a correlation, however, the
user expects the measure of one variable to change when
the other variable changes. It can change positively
(as one increases, the other increases), or the
measures can change negatively (as one increases, the
other decreases (Hunt, 1992). The steps involved in

Total Quality Management
44
constructing the diagram include:
1. Collect data on the two variables being
measured.
2. Draw equal horizontal and vertical scales.
3. The dependent variable data points are plotted
along the horizontal axis.
4. The independent data points are plotted along
the vertical axis.
5. The results give a visual check of the
correlation. However more indepth statistics (such as
a Pearson r) can quantify the relationship (Hunt, 1992)
(see Appendix H).
Control chart. The control chart is another tool
for analyzing processes that is relatively easy to use
(Walton, 1986). It is an aid in monitoring process
performance that has recurrent outputs (Hunt, 1992).
There are many types of control charts, the use of
which is called Statistical Quality Control (SQC) or
Statistical Process Control (SPC) (Walton, 1986). Some
types are used when the data can be quantified. Others
are for nominal level data (Walton, 1986). They are
based on four principles:

Total Quality Management
45
1. Processes change with time.
2. Points are variable.
3. Groups of points tend to fall within a
predictable range if the process is stable.
4. If the process is unstable, fluctuations are
more often out of normal operating ranges (special
causes of variation) (Hunt, 1992).
First an upper and lower control limit must be
obtained by observing a process's outputs over a time
period, and using a formula to set the expected limits,
based on variability. Then:
1. Collect data.
2. Plot the data on the chart which outlines the
upper and lower control limits.
3. Determine causes of the points outside the
limits.
4. Determine ways to eliminate the special
causes, decrease common cause variation, and improve
the overall mean. Constant use of the chart can show
results of the changes made in the process (Hunt,
1992). See Appendix I for an example of a control
chart.

Total Quality Management
46
Differences Between Quality Assurance (QA) and TOM/C0I
Now that the key concepts and tools of TQM have
been explained, it is important to summarize the
differences between TQM and quality assurance. This is
needed to emphasize the fact that QA, as currently
practiced in most healthcare settings, does not
"assure" quality -- and, indeed, often does not even
measure quality in healthcare (Berwick et al., 1991).
The Joint Commission for Accreditation of
Healthcare Organizations (JCAHO) defines quality in
healthcare as "the degree to which patient care
services increase the probability of desired outcomes
and reduce the probability of undesired outcomes given
the current state of knowledge " (Green & Katz, 1992).
That organization, through their Agenda for Change, as
well as other agencies, have examined the current QA
processes in healthcare and called for changes in the
way quality is managed and improved by encouraging the
implementation of TQM /CQI practices (Green & Katz,
1992; Williams, 1991). Traditional QA calls for
inspection-oriented detection of problems (Darr, 1991;
Schmitt, 1991). This is most frequently done by

Total Quality Management
47
reviewing the patient chart as the source of data, and
has a reactive, random approach. CQI calls for
prevention via good process planning and a proactive
approach to problem solving and quality improvement
(Appel & Weaver, 1991; Berwick et al., 1991; Eskildson
& Yates, 1991; Green & Katz, 1992; O'Leary, 1991). QA
also focuses most efforts on correcting special causes
of variation, while CQI takes correction further by
controlling the common causes of variation, as well,
and continually improving processes (Appel & Weaver,
1991; Sahney & Warden, 1990).
QA is also viewed in most organizations as the
responsibility of a few, with problems solved by
authority. In a CQI organization, quality is the
responsibility of all, with problem-solving done by all
employees, at any level in the chain of command (Appel
& Weaver, 1991; Sahney & Warden, 1990). Leadership
also takes a much more active role in quality
improvement organizations.
Another major difference between the two
approaches to quality is that QA focuses efforts on
finding the poor performers in the organization by

Total Quality Management
48
taking the view that individuals cause problems, while
CQI focuses on poorly planned processes (Berwick, 1989;
Darr, 1991; Hunt, 1992; O'Leary, 1991; Sahney &
Warden, 1990). Management often projects a negative
view of employees, rather than recognizing the
individual desire to do a good job (Merry, 1990). QA
personnel also view tasks such as insuring staff are
certified and licensed "assures" quality (Merry, 1991).
The QA approach also looks at quality and
productivity as being conflicting goals, rather than
recognizing that quality improvement brings
productivity gains (Hunt, 1992). In conjunction with
this thought, supplier relationships are usually short-
term and cost-oriented in the QA organization, rather
that long-term, quality-oriented in the TQM mold (Hunt,
1992).
Still another contrast between QA and CQI is that
QA time is usually spent attempting to meet external,
minimally set, requirements and regulations, rather
than setting and improving upon the organization's own
high quality expectations (while still taking external
customers' needed into account) (Hunt, 1992; Merry,

Total Quality Management
49
1991; O'Leary, 1991; Sahney & Warden, 1990). In
summary, current QA practices can be viewed more as an
attempt to appease regulators, rather than to improve
the patient experience in the healthcare system.
History of TOM
A brief history of TQM/CQI is presented to assist
the reader to understand that quality improvement is
not a new philosophy or fad that will be quickly
abandoned once an organization makes the commitment to
adopt its beliefs. Instead, its ideas and practice
have been developing for over 60 years (Hunt, 1992).
Its roots were in the 1930's when W. E. Deming and W.
A. Shewhart (a statistician) worked together at Bell
Telephone Laboratories and became convinced that old
management methods were not promoting good quality
products. They implemented statistical control
techniques and Deming advocated other quality
improvement practices. Some of these were used in war
production plants in America during WWII, but after the
conflict, few companies in America saw the need for
such efforts, as productivity and consumer spending
were high (Hunt, 1992).
Total Quality Management
50
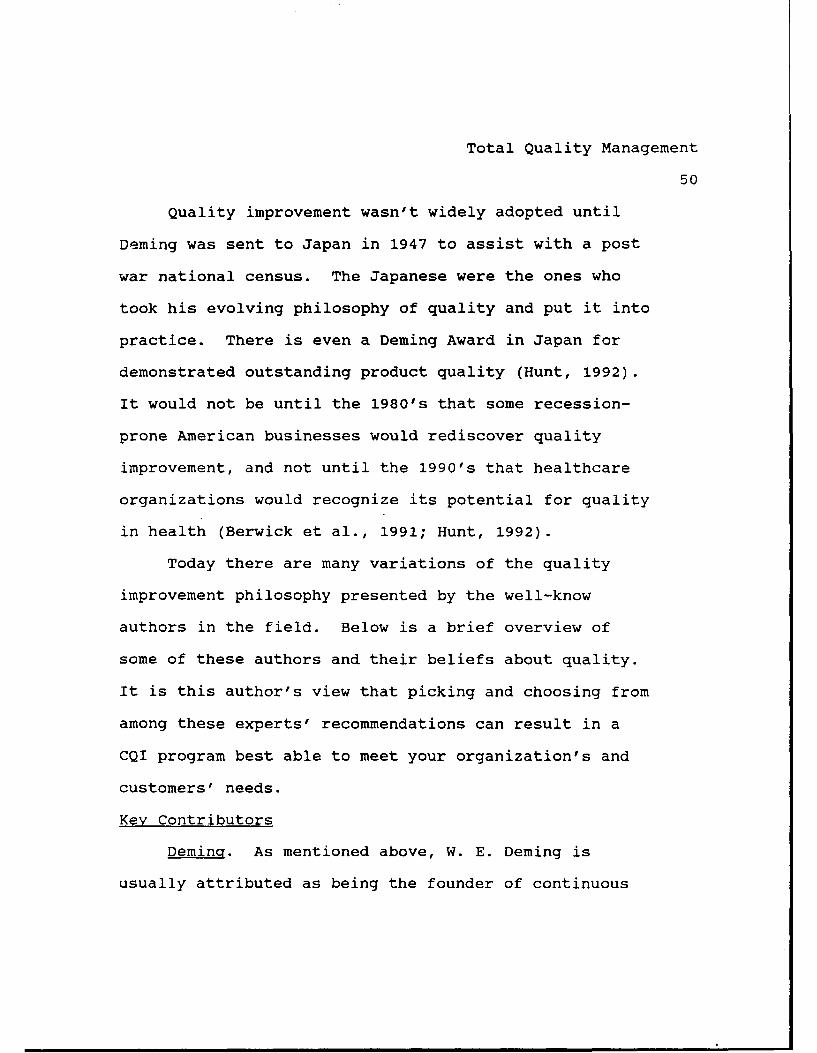
Quality improvement wasn't widely adopted until
Deming was sent to Japan in 1947 to assist with a post
war national census. The Japanese were the ones who
took his evolving philosophy of quality and put it into
practice. There is even a Deming Award in Japan for
demonstrated outstanding product quality (Hunt, 1992).
It would not be until the 1980's that some recession-
prone American businesses would rediscover quality
improvement, and not until the 1990's that healthcare
organizations would recognize its potential for quality
in health (Berwick et al., 1991; Hunt, 1992).
Today there are many variations of the quality
improvement philosophy presented by the well-know
authors in the field. Below is a brief overview of
some of these authors and their beliefs about quality.
It is this author's view that picking and choosing from
among these experts' recommendations can result in a
CQI program best able to meet your organization's and
customers' needs.
Key Contributors
Deming. As mentioned above, W. E. Deming is
usually attributed as being the founder of continuous

Total Quality M-nagement
51
quality management, and his views are cited most
frequently among quality authors. He was born in 1900
and received a masters in mathematics and physics from
the University of Colorado and a doctorate in physics
from Yale (Hunt, 1992; Walton, 1986). Working in the
summer at Western Electric's Hawthorne plant where the
Hawthorne studies on human relations were done, he
questioned traditional management techniques' ability
to motivate workers and produce quality products (Hunt,
1992). But it was at the US Department of Agriculture
and at Bell Laboratories that he began refining his
quality management philosophy. Shewhart, whom he later
worked with, was developing statistical control
processes at Bell, establishing upper and lower limits
of variability (see control chart above) and control
techniques for workers. Deming studied with Shewart
and used his theories of quality control as a basis of
his work (March & Garvin, 1987; Oberle, 1990; Walton,
1986).
Deming's main philosophy consists of the seven
deadly diseases of management and his fourteen points
for solving them. The deadly diseases are:

Total Quality Management
52
1. Lack of constancy of purpose.
2. Emphasis on short-term profits.
3. Evaluation by performance, merit rating, or
annual review of performance.
4. Mobility of management (therefore lack of
long-term commitment).
5. Use of visible figures alone. (He believes
tiis does not take customers' happiness into account).
6. Excessive medical costs for employee health
care.
7. Excessive costs of warranty, fueled by
litigation (Hunt, 1992; Walton, 1986).
Deming also sees other obstacles that inhibit
productivity and quality, including lack of long-range
planning, overreliance on technology to solve problems,
seeking examples to follow instead of finding
solutions, and excuses (Walton, 1986). Deming does
believe in using computers in the work place, however
he has observed there is often a poor plan for its use
and poor training for its users, resulting in underuse
(Walton, 1986).
His fourteen points for quality management contain

Total Quality Management
53
many of the basic concepts outlined at the beginning of
this chapter. They include:
1. Create a constancy of purpose for the
improvement of product and service. He sees the need
for innovation, research and education, continuous
improvement of product and service, maintenance of
equipment, furniture and fixtures, and new aids for
workers as being part of this management purpose.
2. Adopt the new philosophy. This is analogous
to the creation of a quality corporate culture,
mentioned under key concepts, above.
3. Cease dependence on mass inspection. He
believes inspection is really only needed to check on
the affects of the process improvement methods, such as
with the use of control charts.
4. End the practice of awarding business on price
tag alone. He sees this a6 leading to three major
problems -- a proliferation of suppliers makes it more
difficult to eliminate variation in processes, there is
a jump from vendor to vendor, and it causes an
overreliance on specifications which he sees as being a
barrier to improvement. This point holds tremendous

Total Quality Management
54
implications for the NISS, which will be discussed in
Chapter 4.
5. Improve constantly and forever the system of
production and service. This equates to continuous
improvement.
6. Institute training and retraining.
7. Institute leadership.
8. Drive out fear. He believes there is a high
cost if workers are afraid to ask questions or offer
ways to improve the system.
9. Break down barriers between staff areas. This
equates to teamwork or collaboration, discussed above.
10. Eliminate slogans, exhortations, and targets
for the workforce. Too often, he claims, management
does not provide workers with the means to carry out
these schemes. It implies workers can always do better
and it builds resentment since current processes won't
allow them to do better.
11. Eliminate numerical quotas. Though seen more
in production, quotas are frequent in service industry,
and even healthcare.
12. Remove barriers to pride of workmanship. One

Total Quality Management
55
of the biggest barriers is poor communication between
management and workers.
13. Institute a vigorous program of education and
retraining. This is to ready and prepare workers for
the future of the organization, as opposed to the other
point which helps better prepare workers for the
current systems.
14. Take action to accomplish the transformation.
This action is the PDCA Cycle -- plan, do, check, act
(also known as the Shewhart Cycle or Deming Cycle).
Plan by studying a process and deciding what might
improve it, organize a team, and decide what data is
needed and where to get it. Do involves collecting the
data via statistical control techniques and
implementing a small scale change. Check involves
observing the effects. And act involves deciding what
was learned and repeating tests as needed (Green &
Katz, 1992; Hunt, 1992; March & Garvin, 1987; Sahney &
Warden, 1990; Walton, 1986).
As can be seen with this overview of his ideas,
Deming's philosophy encompasses most of the key quality
concepts and tools. While Deming was famous in Japan

Total Quality Management
56
for several decades, his ideas did not attract an
American following until he appeared on a television
program called "If Japan Can, Why Can't We" in June,
1980 (Dobyns, 1990). Since then, his, and others'
quality improvement techniques have gained an ever-
widening acceptance among US businesses.
Crosby. Philip Crosby's philosophy of quality
resulted from a long corporate career, including
inspector and later a vice president position at
International Telephone and Telegraph (ITT) for 14
years. He believes most organizations are problem
organizations, characterized by:
1. A product or service deviating from published
or agreed standards.
2. Extensive field service skilled in rework or
corrective action to try and keep the customer
satisfied.
3. Management not providing clear performance
standards or definitions of quality, so employees can
accept them.
4. Management not understanding the price of
nonconformance. Products spend 20 percent of sales

Total Quality Management
57
dollars reworking mistakes. Service companies spend 35
percent of costs doing things wrong.
5. Management denying it causes the problems
(Crosby, 1979; Hunt, 1992). He calls for top level
leadership and a major corporate culture change to
institute quality, which he sees as conforming to
requirements (Hunt, 1992).
For an organization to improve quality, Crosby
says the first step is knowing the current "management
maturity" in the organization (Crosby, 1979; Hunt,
1992). To assist this effort, he developed the Quality
Management Maturity Grid (see Appendix J). The left
margin of the grid show six measures of quality
management maturity. Across the top are the five
levels or stages of maturity -- Uncertainty, awakening,
enlightenment, wisdom, and certainty. Once a firm
knows its level of maturity, they can incorporate
Crosby's fourteen-step program, building and/or
reinforcing quality management into the organization
(Hunt, 1992). The steps of his program are:
1. Management commitment. This should include a
written quality policy.

Total Quality Management
58
2. Quality improvement team. He calls tor a team
consisting of department heads (or immediate
representatives) to oversee quality efforts.
3. Quality measurement appropriate for activities
performed. His stress on measurement and statistics is
not as great as Deming and Juran, however (Oberle,
1990).
4. Cost of quality evaluation. This calls for s
financial estimate of costs of quality so areas of
improvement can be targeted. He is a big advocate for
removing the hidden costs of poor quality and claims
that "quality is free" (Oberle, 1990).
5. Quality awareness. Echoes the total
involvement concept.
6. Corrective action. Previous steps and
employee feedback generate areas and ways for
improvement.
7. Zero-defects planning. Unlike other authors,
the zero-defect concept is a hallmark of Crosby.
8. Supervisory training so all managers are
trained in quality improvement techniques.
9. Zero-defects day. He says such a day should

Total Quality Management
59
be planned to let the employees know this is a company
performance standard. This would definitely not be a
concept of Deming.
10. Goal setting. Again, this is not part of a
Deming plan, but Crosby believes each worker should
have measurable specific quality goals.
11. Error cause removal. This encourages open
communication up the chain of command so employees can
notify management of areas needing improvement, without
fear.
12. Recognition. Crosby believes nonfinancial
recognition should be given to workers who meet quality
goals or are outstanding performers. Some would argue
this does not encourage exceeding those goals.
13. Quality councils. These are means for quality
professionals and team leaders to meet and compare
experiences and ideas.
14. Do it all over again. Which is equal to
continuous improvement outlined under key concepts
(Crosby, 1979; Hunt, 1992; Sahney & Warden, 1990).
To teach his concepts, the Crosby Quality College
was founded to train managers on his techniques. In

Total Quality Management
60
addition, he formed his own consulting company in 1979
and, like Deming, has written extensively on his ideas,
including two books, Quality is Free (1979) and Quality
Without Tears: The Art of Hassle-Free Management
(1984) (Sahney & Warden, 1990). In addition, he is
probably the most successful of the quality writers at
motivating an audience with his speeches (Oberle,
1990).
Juran. Dr. Joseph Juran is another major
proponent of TQM in America. His education during the
first quarter of the twentieth century, was in
engineering and law. He worked in government and
private organizations, and, like Deming, assisted in
the rebuilding of Japan after WWII (Hunt, 1992). Also
published extensively, he has done consulting work via
his Juran Quality Institute, established in 1979 (the
same year as the Crosby Institute) (Oberle, 1990;
Sahney & Warden, 1990). Like the authors discussed
previously, Juran feels American business has undergone
a quality crisis. He sees two main reasons for the
problem -- managers do not accept responsibility for
the functioning of the organizations, and that they do

Total Quality Management
61
not realize the cost of continued poor quality (Juran,
1986; Juran, 1988). Basically, these assumptions do
not differ from Deming and Crosby. But his 1951 book,
Quality Control Handbook helped show the great costs --
especially hidden costs -- of poor quality (Garvin,
1987). These costs are outlined in Appendix K). And
he defines quality as "fitness for use", stressing the
need for the end product or service to meet customer
expectations (Garvin & March, 1987; Oberle, 1990).
This fitness for use has five measures -- quality of
design, quality of conformance, availability, safety,
and field use (Garvin & March, 1987). This emphasis
differs somewhat from Deming who defines quality more
in terms of the process, than the final outcome. He
also doesn't see anything wrong with adding a little
fear into employees' lives since it might bring out
good results (Oberle, 1990).
The basis of his quality program is the Juran
Trilogy -- quality planning, quality control, and
quality improvement (Hunt, 1992; Oberle, 1990).
Planning involves the steps he outlines in his quality
planning road map (see Appendix L). An organization

Total Quality Management
62
prepares to meet quality goals and establishes a
process that can best meet those goals. Quality
control involves insuring that the goals devised in the
first step are actually being met by the product or
service. Quality improvement, unlike the other two
steps, focuses on making changes to parts of the
process, rather than focusing on the whole outcome.
When An organization first installs the Juran Trilogy,
he advocates the following breakthrough sequence:
1. Breakthrough in attitudes.
2. identify the vital few projects (the eighty-
twenty rule described in the key concepts section
above).
3. Organize for breakthrough in knowledge. This
involves a steering group to define problems and
possible causes and a diagnostic group to analyze
specific problems.
4. Conduct needed analysis.
5. Determine how to overcome resistance to
change.
6. Institute the change.
7. Institute controls (to monitor and follow-up

Total Quality Management
63
on solutions).
The above three authors -- Deming, Crosby, and
Juran are the best known of the quality "gurus",
however there have been other major contributors to
quality thinking. Several are presented below.
Costello. Robert Costello's role in TQM was as
its implementor and molder of the program with the
Department of Defense. Building on the work of Deming,
Juran, and Crosby, he helped construct the Defense
Department's TQM model (see Appendix M) and TQM master
plan (see Appendix N) (Hunt, 1992).
Ishikawa. Kaoru Ishikawa was the best known of
the Japanese quality authors (he died in 1989)
(Crawford-Mason & Dobyns, 1991). His father worked
with Deming when he came to Japan after the war, and he
himself urged statistical methods of quality control
starting in 1949. He is attributed with the concept of
quality circles, which are widely used in Japan
(Crawford-Mason & Dobyns, 1991). His book, What Is
Total Quality Control ? (1985) outlines the history of
quality control in Japan and Japan's belief that top
management must be an active facilitator and

Total Quality Management
64
participant, and that quality implementation takes a
very long-term commitment.
Others. There are many other authors of quality
management principles. Readers are referred to Hunt
(1992), Crawford-Mason & Dobyns (1991), or Backaitis &
Rosen (1990) for excellent bibliographies and
resources.
Use of TOM in Business
As mentioned, WWII war production plants were the
first to utilize Deming's quality management
principles. However, use of TQM among American
businesses took a hiatus until the 1980's. The post
WWII American business boom gave little incentive for
American companies to make the long-term effort to
commit to quality improvement. During those
intervening three decades, post WWII Japanese
businesses were reaping the benefits of the quality
experts such as Deming, Juran, and Ishikawa (Crawford-
Mason & Dobyns, 1991). There were pockets of quality
improvement efforts in America during this time, such
as the change in corporate culture and zero-defect
initiatives at Martin Company, makers of Pershing

Total Quality Management
65
missiles (Garvin, 1987). These pockets were few and
far between, however.
Between 1970 - 1980, American business
competitiveness was taking a turn for the worse and
companies were more ready to listen to Deming's message
(Sahney & Warden , 1990). A 1981 survey found that
almost 50 percent of American consumers felt the
quality of US products declined during the preceding
five years (Garvin, 1987). Executives saw that
Japanese product and service quality ratings were above
their own in many areas (Berwick et al., 1991).
Deming's television appearance in 1980 was timely and
very well received, and he and other quality experts
became involved in instituting quality improvement in
American organizations (Garvin & March, 1987). Ford
Motor Company began to adopt the Deming method in 1981
(Oberle, 1990). Semiconductor companies, after
studying the lack of defects in Japanese products, also
changed to quality improvement strategies (Garvin,
1987). The decade of 1980-1990 saw ever-increasing
adoption of quality improvement in manufacturing
companies (Sahney & Warden, 1990).

Total Quality Management
66
Initially, production companies adopted TQM --
especially those with successful overseas competitors
(Geber, 1990). However, in the last several years,
service companies have finally acknowledged the
potential from implementing TQM in their firms (Albert,
1989). There is an abundance of success stories in the
literature where adoption of TQM techniques have meant
increased productivity and success in the market
place -- AT&T, Burroughs, Campbell Soup, the DOD, Ford,
Johnson & Johnson, Mobil Oil, and Xerox are just a few
(Berwick et al., 1991; Clausing & Hauser, 1988; Davidow
& Uttal, 1989; Heskett & Schlesinger, 1991; Hunt, 1992;
Sahney & Warden, 1990). A report by the General
Accounting Office (GAO) found that organizations that
adopted TQM techniques did, indeed, improve overall
corporate performance whatever the size of the
corporation (Koska, 1991). And national quality
awards, such as the prestigious Baldrige Award are
becoming more highly prized (Crawford-Mason & Dobyns,
1991).
Use of TOM in Healthcare
Healthcare organizations are facing a crisis, much
Total Quality Management
67
like that manufacturing companies began to face in the
1970's. Increased competition and "for-profit"
medicine, rising malpractice costs and defensive
medicine costs, consumer complaints about the rising
costs of healthcare, and outside regulatory pressures
are all leading to a need to adopt quality improvement
practices (Berwick et al., 1991; Lehmann, 1987;
O'Leary, 1991). While quality improvement is being
used, it is still rare to find great breakthroughs in
the field (Eskildson & Yates, 1991).
The National Demonstration Project on Quality in
Health Care (Berwick et al., 1991) and several papers
and articles provic excellent examples of how quality
improvement techniques can and are being implemented in
healthcare organizations in America (Anderson, 1992;
Bradley, Brett, & Tonges, 1990;. And as was mentioned,
the JCAHO, through its Agenda for Change (first
initiated in 1985), is promoting quality improvement
efforts throughout the industry (Green & Katz, 1992;
Koska, 1991; Lehmann, 1987; O'Leary, 1991).
Some believe implementing TQM in healthcare may be
very difficult because every patient is different --

Total Quality Management
68
there is no "standard" product. There are also beliefs
that the doctor's decisions still determine quality,
that our society is still too individualistic,
physicians are not "team" players, healthcare quality
is too obscure to be measured, and that quality costs
(Berwick et al., 1991). Fortunately hospitals are
slowly showing these assumptions are not necessarily
true.
A 1991 survey of 351 hospital quality assurance
personnel found that 95.2 % were aware of TQM concepts
and that 70.7 % stated there was at least some quality
improvement activity, separate from QA, within their
organization (Koska, 1991). But only 15 % had been
involved in TQM for over two years (Koska, 1991). And
it is still rare to tind both the customer and supplier
of healthcare working together on quality improvement
(Berwick, 1989). Hopefully, more wide-spread use of
TQM in healthcare will soon become the norm.
Pros and Cons of TOM
To this point the good points of TQM have been
expounded. The success stories, as mentioned, are
becoming increasingly easy to find in the literature.

Total Quality Management
69
But are there drawbacks to TQM implementation? Some
authors think there are.
One author feels that professionals, perhaps
including physicians, researchers, and lawyers will
reject the concepts of error-free, zero-defects
performance (Geber, 1990). However, not all TQM
authors share this philosophy. A Deming-like approach
might work best in such organizations. Such
professionals also might feel their code of ethics is
in direct conflict with some customer expectations, or
that their work simply cannot be thought of as
"processes", thus rejecting TQM (Geber, 1990).
Organizations can also run into problems when they
use TQM measurements to reward individuals. Lying
and/or breakdown of collaborative efforts can occur
(Geber, 1990). And some aspects of quality may simply
be very difficult to measure. In addition, some still
are looking at TQM as a quick-fix to problems (Koska,
1991).
P. McLagan (1991) wrote of the "dark side" of
quality and describes three potential problems. The
first, she calls process rigor mortis, in which every

Total Quality Management
70
minute work process is routinized and measured.
Closed-loop thinking is another identified possible
problem. McLagan feels innovative breakthroughs may be
hampered while efforts to measure and improve current
processes are fostered. Finally, she sees a real
potential for team overkill that results in individual
worker needs going unmet. She feels that until areas
such as performance appraisal management, management
information systems, job training, reward systems, and
job design are changed to reflect and better integrate
with quality management, TQM efforts may not be
productive. Other authors have also written of the
problems that can be encountered with TQM (Newman,
1991; Zemke, 1992).
The biggest problems this author sees are when
only some of the necessary concepts are implemented in
a TQM program. For instance, if workers are encouraged
to partake in teamwork, yet the old individualistic,
line manager performance rating system is in place,
confusion and apprehension may occur.
Summary
In this chapter, the key concepts, tools, and the

Total Quality Management
71
history of TQM have been presented. These topics must
be understood so the NISS can adapt and apply them to
enhance the quality of nursing information systems.

Total Quality Management
72
CHAPTER 3
Application
Systems Life Cycle
Information system specialists work in a variety
of roles, performing a plethora of functions.
Inevitably, those roles and functions correspond to, or
interact with, one or all of the stages of the Systems
Life Cycle (SLC). The SLC is a set of developmental
phases through which all information systems advance.
Depending on the system, the phases may flow one after
the other, or some phases may run in parallel. There
may also be occurrences when the SLC reverts to a
previous phase when problems are encountered. The life
cycle outlines the activities involved in all phases
and is used by information systems specialists to
insure all necessary tasks are addressed in system
design and development (Ahituv & Neumann, 1990). The
SLC is used here to structure the potential application
of TQM by information systems specialists -- including
Nursing Information Systems Specialists (NISS).
There are as many descriptions of the life cycle
as there are authors on the subject. Most agree on the

Total Quality Management
73
general processes, though there is disagreement in
terminology. This paper uses the terms, phases, and
activities delineated by Ahituv and Neumann (1990).
They give the following outline of the SLC:
1. Definition phase.
(a) Preliminary analysis.
(b) Feasibility study.
(c) Information analysis.
(d) System design.
2. Construction phase.
(a) Programming.
(b) Development of procedures.
3. Implementation phase.
(a) Conversion.
4. Operation phase.
(a) Operation and maintenance.
(b) Postaudit.
(c) Termination.
A brief description of each of these phases follows, as
well as how TQM concepts can be applied.
Definition Phase
During the definition phase, the information

Total Quality Management
74
problem is defined and solution specifications
identified. There are four main processes involved.
Preliminary analysis. The life cycle usually
begins when an end-user and/or management (who may also
be end-users), or a vendor see a need to improve
information processing (Priest, 1989). Perhaps the
need was envisioned in a master plan for information
systems development, or because users perceived an
information problem (Ahituv & Neumann, 1990). The
preliminary analysis helps clearly define the problem
statement and assists in planning a thorough
examination of the problem.
To help clarify the problem and information needs,
data collection can be done via interviews, surveys,
observations, and studies of the current system
(Priest, 1989). Use of TQM principles can be extremely
beneficial in insuring the true problem and needs are
identified. Top level management should already have a
commitment and strategic plan for quality improvement
throughout the organization, including mission, vision,
and long-term goals. An interdepartmental quality team
could be organized as an information problem/need is

Total Quality Management
75
first noted. All too often, an information system is
planned for a particular department with little input
from outside that department, or end users are not
consulted during the early needs assessment (Simpson,
1991). A collaborative team should include not only
end users, but other customers of the system output.
If a vendor is initiating the SLC, they should consult
end users, as well. When forming the team, it should
be asked "who might be affected by this process
improvement" and "who might use the output of the
improved system." The understanding that a hospital is
an interdependent system is imperative (Priest, 1989).
Almost everything that nursing or any other department
does to change its information processes will impact
other departments in some way. The team members must
then begin training, if not already done, on TQM and
group techniques. Training might also be needed to
familiarize members with each other's work. For
instance, nursing members may need an introduction into
information system technology and information systems
specialists may need some familiarization on
information handling techniques used by nurses. For

Total Quality Management
76
nursing systems, an NISS can help bridge this gap in
knowledge.
As the problem is then studied by the information
quality improvement team, quality improvement tools can
help assure the true nature of the system and problem
is understood. Data collection tools such as process
flow diagrams, checksheets, bar charts, histograms,
brainstorming, cause and effect diagrams, Pareto
charts, and run charts can all help structure the
problem definition done during preliminary analysis.
For instance, data can be collected on frequency of use
of a particular information item, or who uses the
information. Data can also be collected on how the
current system impacts quality of care, so it can later
be compared with post implementation data to help
define system benefits and costs. Data collection from
customers is also essential -- both. internal and
external customers. Are customer needs being met by
the current information system? What is the
information need from their vantage point? Surveyed
customers may include patients, end users, and other
hospital department personnel. The TQM concept of

Total Quality Management
77
total involvement is important in this activity to
insure the team focuses on the real information problem
and need. Equally important is the need to focus on
long-term quality improvement. Is the need being
addressed a temporary one that will vanish with the
next set of government or JCAHO regulation changes?
Information system changes usually take time to develop
and implement. Or is the need one of the "trivial
many" that will not really affect the overall quality
of patient care? What are the quality costs of
improving or not improving the system? Focusing on
true quality process improvement in information systems
is essential during this preliminary analysis.
TQM principles recommend a strong partnership
between vendors (suppliers) and customers. Though seen
infrequently at the current time, a medical
organization m-y establish this on-going relationship
with a particular information systems software and/or
hardware vendor (and vice versa) (Simpson, 1992). If
done, the process improvement team can take advantage
of the outside knowledge base, and they can assist each
other in improving information systems efforts.

Total Quality Management
78
The end result of this SLC phase is a preliminary
conceptual report for management, in the user's and
customer's language. This report should include a
definition of the problem; a brief summary of
information requirements resulting from the problem;
information recipients; frequency of the required
information; inputs to the system; and the scope,
boundaries, and objectives of the information system
(Ahituv & Neumann, 1990).
Feasibility study. Once the decision is made to
proceed with information process improvement, a
feasibility study is done to determine whether a
particular project should be done, and if so, how, and
is it feasible (Ahituv & Neumann, 1990)? Who, what,
when, where, how, and why should be guiding the
feasibility study (Priest, 1990). Specific questions
asked and answered during this activity are outlined by
Ahituv & Neumann (1990), but are modified below to
include quality issues. They are:
1. What problems or process improvement needs are
addressed by the new information system?
2. Is there available technology and know-how to

Total Quality Management
79
improve the information process?
3. How will the system be accepted by
users/customers? What are potential acceptance
problems?
4. Do the potential quality and financial
benefits outweigh the quality and financial costs?
5. Does the system support the organization's
quality improvement master plan, vision, and goals?
6. How should the development proceed?
The feasibility study is essential because few
organizational resources are consumed up to this point
in the SLC. If the study results in progressing with
the project, human and financial resource commitment
becomes much greater. Too often in system development,
departments decide what they want to do first, and
write a document justifying their approach (Ahituv &
Neumann, 1990). Employing TQM principles during this
study can insure proper resource utilization.
Once again, TQM's measurement and statistical
tools can help find potential causes of the information
problem and possible information solutions. A process
flow diagram helps show what steps can be eliminated,

Total Quality Management
80
combined, changed, or simplified (Priest, 1989).
Brainstorming, data collection and display, cause and
effect diagrams, run charts, Pareto charts, etc can all
help recognize problems, causes, and potential
solutions. Again, acknowledging the interdependence of
hospital systems, including all people potentially
affected by the processes under study, and focusing on
the customers is vital. This may be an excellent
opportunity for management to show their comnitment to
quality by actively participating in the studies and
giving staff additional training needed to carry out
TQM principles. This is also the time when a team may
decide to engage in benchmarking activities to see how
other departments, hospitals, vendors, or non-hospital
organizations tackled similar information process
problems with excellent quality results.
The end result of the feasibility study is the
feasibility report presented to management to aid in
determining whether to proceed with the recomended
project. The report should include all alternatives
considered, the reasons and data supporting the
recommendation of one alternative, and how

Total Quality Management
81
implementation of the process improvement plan will be
achieved (Ahituv & Neumann, 1990). Solutions must be
consistent with meeting customer needs and supporting
management goals. If management has been involved in
the process improvement activities, the decision will
be easier to communicate.
Information analysis. The information analysis
(sometimes called systems analysis) is the next
definition phase in the SLC (Ahituv & Neumann, 1990;
Priest, 1989). This is when functional specifications
needed to meet requirements of the above activities are
determined. There are four major areas of this
analysis: (a) in-depth examination of the current
information system, including what happens; (b)
information requirements, including why the present
system needs improvement; (c) conceptual design for
the new information system; and (d) the project plan
(Ahituv & Neumann, 1990). The project plan usually
contains the following elements:
1. Overview of the project, including the
objectives.
2. A-ftivity plan.

Total Quality Management
82
3. Organization plan.
4. Resource allocation plan.
5. Staffing plan, including a work breakdown
structure.
6. Budget.
7. Monitoring and control techniques.
8. Training plan.
9. Documentation plan.
10. Test plan.
11. Installation plan.
12. System change plan.
13. Project schedule (such as Gantt and PERT
charts).
14. Project termination plans (Ahituv & Neumann,
1990; Mantel & Meredith, 1989). Project management
textbooks, such as Project Management: A Managerial
Approach (Mantel & Meredith, 1989) are recommended for
f~rther information on project planning techniques.
TQM techniques can continue to be applied during
this phase of the life cycle. The team approach should
continue, with extensive user, customer, and vendor
involvement (if feasible). Use of TQM tools, such as

Total-Quality Management
83
surveys and the Pareto diagram, can help gather data on
what are the essential information requirements, as
opposed to the "nice to have" elements. The team must
remember that their goal is process improvement -- not
just automating an existing manual information system,
as frequently happens. There is always room for
improvement, and innovative thinking should be
encouraged. Again, reviewing the process flow diagram
and identifying steps in the system for change is
encouraged. Top management should also show their
trust in the staff's ability to work hard at finding
the true user and customer needs. They must show their
commitment by giving the necessary resources, including
time, to take part in process improvement efforts. If
additional team training is needed, this, too, should
be supplied. Benchmarking may also be productive
during this phase.
The outputs of this SLC phase are the systems
analysis report, containing the proposed solution in
detail, and the project plan. Both are presented for
management's approval to determine whether to proceed.
System design. Actual system design may also take

Total Quality Management
84
place in a medical setting, by the vendor, or a
combination of the two. This is the most challenging
and creative part of the SLC (Priest, 1989). It
involves developing the programming specifications to
guide the programmers with system development; and
planning for user training, system and acceptance
testing, and conversion to the new system. The system
designer(s) receive the systems analysis report and use
it to plan how best to fulfill its requirements. The
main activities performed include:
1. Design of system inputs.
2. Design of system outputs.
3. Design of system files and databases.
4. Design of system processing methods.
5. Preparation for programmers and procedure
writers.
6. Presentation of the system design to
management and users for approval (Ahituv & Neumann,
1990).
A prototype (model) of the proposed system is
often made during this phase to assist users and
designers in further evaluating system needs. This

Total Quality Management
85
stage involves more technical specification writing
than the previous phases. The design may have already
taken place in a vendor setting. Often a medical
facility will buy an existing system and have it
tailored to meet their needs or use it as is (a turn-
key system). Either way, the proposed system is
divided into modules and programs within modules. Then
the following specifications for each program is
detailed:
1. Raw data sources.
2. Inputs.
3. Files; their organization, storage,
processing, size, and access methods.
4. Processing.
5. Outputs.
6. Testing and conversion.
7. Information flow (Ahituv & Neumann, 1990).
Once more, TQM principles can help improve the
quality of the efforts. A team approach draws on
expanded knowledge sources, with a partnership approach
between users, customers, and vendors doing likewise.
Top management involvement and support help the team

Total Quality Management
86
recognize the importance and value of their work.
Surveys, observation, and data collection tools may
still be of use in identifying important inputs and
outputs for the programs. And benchmarking can
continue to be of use to the team, to see how
successful information systems handled similar
problems. System controls should be designed into the
system to help automate future data collection on
system quality performance.
Equipment needs are also identified during this
stage to see if current hardware is sufficient or in
need of change. If the medical facility is the
principle initiator of information system change (as
opposed to a vendor developing a system through a
perceived need), the Request for Proposal (RFP) is
completed during this phase of the SLC to elicit bids
from vendors, identifying functional and system
specifications and hardware, training, and conversion
needs. A vendor is then chosen which best meets the
needs, while staying in the proposed budget. In a TQM
environment it must be emphasized that the contract
does not merely go to the lowest bidder. A poor

Total Quality Management
87
quality product or one not meeting customer desires and
expectations may cost much more in the long-term than a
more expensive, but effective product. The costs of
poor quality -- often hidden -- must be on the mind of
the team selecting a vendor.
Also written during this stage, often by the
vendor or in conjunction with them, is the system
design report. It includes:
1. Flow charts of the system and programs.
2. Data dictionary.
3. Matrices describing interrelations between
inputs, files, and outputs.
4. Documents, forms, records, outputs, and
screens.
5. Data validation tests.
6. Program narratives.
7. Specifications for writing procedures for use
of the system.
8. System test plans.
9. File construction and maintenance plan.
10. System installation plan.
11. System change plans (Ahituv & Neumann, 1990).

Total Quality Management
88
Again, management and users must concur with these
plans and whether to proceed with the construction
phase.
Construction Phase
The construction phase involves the development of
the new system. There are two main processes involved.
ProgramminQ. Once the system design phase is
complete, construction of the actual information system
can begin. Programming entails the coding and testing
of computer programs to meet the system requirements
(Ahituv & Neumann, 1990). While the programmer is the
main person involved in this activity, those who
designed the system and/or will be its customers should
have continuous communication feedback to help insure
successful development. This may be more difficult for
systems constructed by vendors rather than in-house,
but is essential. Medical software vendors are hiring
an increasing number of experienced medical
professionals who can assist with the design and
programmer feedback. Some vendors are also beginning
to invite potential user-customers to comment on system
prototypes and give feedback to designers and

Total Quality Management
89
programmers (M. Douglas, personal communication, March
3, 1992). Once written, each program of the system is
tested individually and needed corrections made before
system testing is done. Thorough documentation is done
to assist future use, understanding, and changes to the
system (Ahituv & Neumann, 1990; Priest, 1989). The
documentation often includes z narrative description of
the purpose and solutions, a logic display (often a
flow chart), the source program listing, input and
output layouts, test data, and operator instructions
(Ahituv & Neumann, 1990).
TQM concepts continue to have importance. By
focusing on customer needs and eliciting customer
feedback, the programmer can help assure a quality
product. Use of prototypes or structured walk-through
between programmers and users, where the system is
explained and users critique the system, can be
extremely beneficial (Priest, 1989). Measurement and
statistics can also gather data on the system and
insure it functions within expected limits. Some
programs (laboratory machine interface programs are
noted for this) can have built-in control mechanisms

Total Quality Management
90
which will alert users when outputs fall outside an
expected range. This is equivalent to having a control
chart built into the system. Any changes to the system
should be thoroughly tested, and data gathered, to
insure the entire system continues to meet
expectations. The concept of the interdependence of
the system should keep programmers and users alert to
the possibility that a change in one place of the
system can have unexpected results to total system
performance. Benchmarking can continue to assist those
involved in the construction phase, though copyright
infringement laws must be adhered to.
The outputs of this phase of the SLC are the
programs, with accompanying documentation; and
operators and input entry manuals (Ahituv & Neumann,
1990). If good project planning techniques were
employed, users can monitor the progress of development
at this and other phases, by comparing the original
project schedule with timing of reports and completion
of tasks. Data collection and display via TQM tools
can help show this progress and alert the process
improvement team of real or potential problems.

Total Quality Management
91
Development of procedures. The programming phase
above results in computer instructions, while the
procedure phase of construction results in human
instructions for system interaction (Ahituv & Neumann,
1990). Users and information analysts (possibly an
NISS) usually work with a system designer on this phase
of the SLC.
The procedures (including user manuals) must be
written in the user's language, so this process
requires a strong customer focus. Benchmarking can
also assist in quality procedure development. Perhaps
certain manual approaches elicit praise among other
systems' users. Those styles could be duplicated to
produce high quality written guides. A team approach,
with brainstorming and other collaborative techniques
can also assist in improving the quality of procedures.
Acknowledging the importance of sound training
approaches in writing training manuals is imperative.
All too often, user training needs are not met because
of the low emphasis placed on this customer need.
Another problem often encountered are unresponsive
procedures for processing users' system change

Total Quality Management
92
requests. TQM implies procedure writers will institute
plans for effectively processing these requests by
streamlining user-vendor communication and soundly
documenting and responding to such requests in a timely
manner.
User guides, operator guides, training manuals,
system change request procedures, and other needed
manuals, all result from this phase of the SLC.
Implementation Phase
Implementation involves installment and use of the
new system. Conversion is the term used for this.
Conversion. Conversion consists of three main
processes: (a) training new users and operators, (b)
installing the new system, and (c) acceptance testing
by users (Ahituv & Neumann, 1990). This phase is
complicated when the system is replacing current
information handling, as opposed to implementing
totally new processes. This is due to the parallel
operation that usually must ensue. Often facility
changes must be made, in addition to building new files
and tables or converting old ones to the new system.
T-aining of new users must occur before activation, yet

Total Quality Management
93
not be to soon before use commences. If there is a
long lag time between training and activation,
knowledge may be lost. Juggling needs of the work
schedule with system training needs also poses special
challenges. Acceptance testing should also be done by
users to insure the system is ready for active use and
any last minute changes are communicated to developers.
TQM concepts of importance include customer focus,
collaborative efforts, benchmarking, and measurement
tools. Maintaining a customer focus means soliciting
their input and assessing their needs before conversion
plans are finalized and carried out. Who will be
affected by training and activation? How can negative
effects be minimized? Perhaps user classes need to be
given after routine duty hours to accommodate shift
workers. Do services need to be scheduled differently
to give staff time for training? Are training
facilities conducive to adult learning? Who will
supply work center staff support during activation? Is
adequate time being given for new users to learn and
become familiar with the system before a decision is
made on its effectiveness? How are patients and other

Total Quality Management
94
organizational staff affected during conversion? Are
their needs being met? Is security, privacy, and
confidentiality of information sufficient? Is there
adequate back-up and storage of information?
Experience has shown this phase is not always well
planned to meet user and customer needs. A
collaborative approach can continue to help by drawing
on an expanded knowledge source. Perhaps certain team
members are more experienced in conversion than others,
even if they are not primary users of the new system.
Benchmarking to learn how others have successfully
converted to similar systems can also be helpful.
Measurement tools can greatly assist in beginning to
collect post implementation data to analyze system
benefits and costs. They can also gather data on the
actual conversion efforts to help staff and vendors
assess conversion strategies employed. For instance,
was it best to implement one unit of a department at a
time, or should all units be activated at once? Did
trainers meet the needs of trainees? There are
numerous areas for possible data collection and display
to learn from the conversion process.

Total Quality Management
95
While no particular documentation output is
required from the conversion efforts, Ahituv & Neumann
(1990) suggest keeping a conversion log for future
reference. In addition, a project report may be given
by the process improvement team to management,
including statistics on adherence to the project plan
(was the project on time, on schedule, and did the
system meet performance objectives).
Operation Phase
The operation phase is the last phase of the'SLC.
It involves not only actual operation of the new
system, but on-going evaluation and eventual change.
There are three distinct processes involved.
Operation and maintenance. Once the system is
converted, it operates at processing information and
requires continuous maintenance. Maintenance involves
correcting errors not previously encountered; adapting
when other interrelated systems change; and continuous
improvement, utilizing new technology advances and
implementing new system change requests by users or
system upgrades by developers (Ahituv & Neumann, 1990).
Built-in system controls can help detect the

Total Quality Management
96
reasonableness of outputs (Priest, 1989). Maintenance
to procedures is also needed. Future users and
operators must know their manuals continue to be
applicable.
A customer focus and emphasis on continuous
quality improvement means responsive maintenance and
upgrading of the system. Developers should not rest on
the laurels of a successful conversion, or point blame
at an unsuccessful conversion. Conversion and
operation are processes, like other facets of the SLC,
and improvements can always be made. Therefore on-
going user groups (or process improvement teams) and
data collection is essential to assist with quality
operation and maintenance. Operators and developers
must be responsive to appropriate change requests.
Before implementing such requests, how the change
affects other processes must be understood, perhaps via
new process flow diagrams, brainstorming, cause and
effect diagrams, and other data collection tools. On-
going training will be needed, and management must
allocate resources and support these continuous
training needs. Involving all users, not just user

Total Quality Management
97
groups, in collecting data and looking for improvement
areas can also aid in maintaining a quality process.
Maintenance logs are the primary output of this
phase of the SLC. The logs are an account of all
problems and changes made to the system. System change
requests log, updated manuals and procedures, and new
program codes are also produced during this phase.
Postaudit. Postaudits are recommended at periodic
intervals, starting at three to six months after
activation (Ahituv & Neumann, 1990; Priest, 1989). The
main purpose is to determine if planned objectives,
scope, costs, and benefits were realized.
TQM principles imply this should be a continuous
process. It also implies that not only should
postaudits be done to compare the system against
planned performance, but on-going analysis of ways to
improve the system must be done. Benchmarking can
assist in finding ways of system improvement, as well
as attendance at information system meetings, class
attendance by personnel, literature searches, on-going
user and customer surveys, and on-going data collection
of system performance. When benchmarking, it is

Total Quality Management
98
important to observe not only other users of the same
or similar systems, but users of different systems who
tackled similar information problems. TQM measurement
tools can help accomplish and analyze data collection
efforts. Successful conversion does not mean a process
improvement team is no longer needed, though team
members may change at this point.
Postaudits can take the focus on direct and
indirect benefits produced by the system, direct and
indirect quality and financial costs, evaluation of
system outputs, evaluation of system personnel, and
evaluation of top-management involvement (Ahituv &
Neumann, 1990). A one-time postaudit report containing
the above is usually recommended, but in a TQM
environment, this report should contain provisions for
on-going quality improvement efforts.
Termination. When errors, data, and change
requests imply the system is no longer feasible, tne
system is slated for termination while a new system
life cycle is begun (Ahituv & Neumann, 1990).
Termination is usually not completed until the new
system is activated. Management must use user and

Total Quality Management
99
customer feedback, as well as objective quality data
when making the decision to terminate.
Potential Application of TOM in NIS's
There is tremendous potential for using TQM to
improve the quality of nursing information systems.
Nurse information specialists and system users can
become involved in all stages of the system life cycle,
as outlined above, and utilize the TQM techniques
appropriate for that phase. The NISS may work for the
vendor, be an outside consultant hired by a medical
organization, be a member of academia, or be a direct
employee of a medical organization. Working for a
vendor may involve research and development,
installation, training, sales and marketing, or
management. Outside consultants may be hired for any
stage of the SLC -- from preliminary analysis to
postaudit benefits analysis. NISS's may teach and
develop other NISS's or do research in academia.
NISS's working for medical organizations can become
involved at all stages of the SLC as well. Wherever
the NISS is employed, TQM principles should be known
and employed by the NISS for three main reasons:
Sm m m r

Total Quality Management
100
1. To improve the quality of nursing information
systems.
2. To improve the management of NIS departments
and NIS's.
3. To assist with TQM implementation and use
throughout the agency.

Total Quality Management
101
CHAPTER 4
Summary
Conclusions
Total quality management (TQM) and continuous
quality improvement (CQI) techniques have shown
enormous potential for improving the quality of
products and services. Most healthcare organizations
are still using the old quality assurance approaches to
quality -- reactive inspection, rather than proactive
prevention. Increasing healthcare costs and questions
about the quality of services have led many, including
the JCAHO, to look for ways to improve health care in
America. TQM/CQI is finding an increasing following in
the medical community and has helped improve services
at several facilities (Anderson, 1992; Berwick et al.,
1991; Blacharski, Hagstrom, and Stratton, 1991; Darr,
1989; Jeffer, 1991). The information systems
literature is also beginning to expound on the positive
impact on quality that TQM can make in information
systems, including healthcare information systems
(Kolence, 1991; Margolis, 1991; Perry, 1991; Spitzer,
1991; Ummel, 1991).

Total Quality Management
102
Need for Nursing Information Systems Specialist (NISS)
to Study Total Quality Management Principles
After reading about the potential for TQM in
healthcare and information systems; its infrequency of
use; the current questionable quality of nursing
information systems; and the lack of nursing
involvement in NISS selection and development (Dunbar,
1992); it is concluded that NISS's can begin to improve
the quality of information systems by studying TQM
principles and techniques. They can begin by reviewing
the literature, attending one of the numerous classes
and conferences offered on TQM, attending quality
institutes, or participating in quality improvement
teams. Once trained, NISS's are encouraged to actively
put TQM into practice.
Implications
The implications for NISS use of TQM falls into
three main categories: (a) potential to improve the
quality of nursing information systems, (b) potential
for improving management of NIS's and management of NIS
departments and agencies, and (c) to assist their
healthcare agency in implementing TQM throughout the

Total Quality Management
103
organization. These implications are addressed below.
Potential for ImprovinQ NIS's
Experience and the literature show unmet
promises of effective nursing information systems
improving the quality of patient care. The NISS must
utilize TQM to improve the quality of systems
throughout the systems life cycle.
Focusing on the users' and customers' needs and
expectations, rather than those of the information
systems department, is an imperative. Sound objective
measurement and statistics, as promoted by TQM, can
assist in assuring the important requirements are
identified and the best solution is found. A
collaborative approach must be utilized, with
productive group techniques to collect data, identify
possible solutions, and put the solution into practice.
This team must include end users and staff from other
functional areas which may be impacted by a new NIS.
Understanding the interdependence of systems is vital
for recognizing all who may be affected. Benchmarking
of quality NIS's, as well as other organizations
utilizing useful systems to meet similar information

Total Quality Management
104
problems, can assist the team to find more effective
systems. Insuring adequate training of all system
users and actively soliciting their feedback for system
improvements can greatly enhance system quality. It
must be remembered that customers and end-users account
for the most productive process improvement suggestions
(Hunt, 1992). Total involvement is encouraged and no
suggestions should be bypassed without thorough
investigation. TQM also calls for constancy of
purpose. The NISS can help enforce this concept by
always keeping the system's goals and objectives in
mind, and insuring they support that of the
organization. They also must insure top-level
commitment to the information process improvement
efforts. At the same time, as noted by Deming (Walton,
1986), new technology is not always the answer to a
need for process improvement. The NISS must be open to
recognizing when information systems can be a cost
effective (financial and quality) means of improvement,
and when they are not.
Potential for ImprovinQ NIS Department Management
As mentioned above, the NISS may be employed in

Total Quality Management
105
various settings. Because of the specialized nature of
the job, management responsibilities for a department
or work unit are often assigned. If the NISS adapts
TQM principles in managing their work area, improved
quality of their services will hopefully result.
First, the NISS must insure top-level management
will support quality improvement efforts. Then a TQM
plan should be written, including a commitment to
quality and a sourd vision for the work unit. That
vision must be shared with all workers and their total
involvement in quality improvement encouraged.
Training must be given to workers in TQM techniques,
with a reward and recognition program that acknowledges
team quality improvement efforts. Trust in workers
ability to want to improve quality is another tenet to
follow in managing the department. Open communication
and managing by "walking around" is a must. The
customers and their needs and expectations must be the
center of quality improvement efforts, with the
department having a responsive plan for addressing
customer requests. The results of a better managed
unit should be improved systems and system user

Total Quality Management
106
support.
Potential for the NISS to Assist Agency with TOM
Implementation
Another major implication of NISS's knowing and
utilizing sound TQM skills is their potential to then
assist their organization to implement TQM throughout
the organization. Information systems can benefit in
the vast data collection endeavors TQM requires (Fifer,
1987; Patterson, 1990). Systems should be designed and
implemented that will support such efforts. Built in
controls and exception reporting can assist users in
knowing when outcomes fall outside an expected range.
An integrated system or a standards-based open
architecture system will support the information
sharing needed between departments for collaborative
process improvement ventures. Systems can also be
implemented that are specifically tailored to
supporting TQM activities. They may support
brainstorming and group activities (like Groupware), or
statistical process control. In addition, the JCAHO
has been developing standards for information systems
to support hospital CQI (Patterson, 1990; Shanahan,

Total Quality Management
107
1988; Skjei, 1989; Spitzer, 1991; West, 1990).
Spitzer (1991) outlined the specific needs of a
hospital information system to enable it to support
quality efforts. Nursing systems must support the
capture of such data, including orders and results,
alerts to results outside normal limits, patient care
documentation, schedules and scheduling ability (for
staff and patients), policies and protocols, service
performance norms, reference information (including
access to outside sources), tracking performance
results from the customer's perception, reliability of
processes compared to standards, service and task-level
audit information, information for visitors, offsite
communication capability by physicians and others,
knowledge-based support for clinical decisions,
trending and tracking across cases and encounters, good
statistical and presentation tools, capture of patient
outcome indicator results, automated support for
patient notifications and education, providing views of
above across normal hospital boundaries, support
monitoring of supplier performance, access to
population demographics and health statistics, and the

Total Quality Management
108
ability to compare organization's performance on
different levels with competitors. Obviously a nursing
information system alone cannot meet all of the above
recommendations, but the NISS can work across normal
functional boundaries to support automating data needed
to improve quality throughout the organization.
Recommendations
Traininq in TOM Principles and Techniques
As mentioned above, the NISS must become trained
in TQM principles and techniques, support training of
other workers in TQM, and should also actively train
staff in TQM, once proficient. As an adult learner and
a professional, it is the responsibility for the NISS
to seek opportunities for such training rather than
wait until it is offered. As mentioned above, there
are numerous sources for training. Before training is
sought, the NISS should know the organization's stance
on TQM/CQI. Hopefully management will support such
training and may already have plans to do so. If not,
the NISS can become an educator for management and set
an example for others to follow. Just as quality
improvement is a continuous process, so is training in

Total Quality Management
109
TQM. The NISS should keep abreast of literature
findings and utilize proven techniques.
Establishment of a TOM Plan
A framework, in the form of a TQM plan is
recommended to guide implementation of TQM. If the
organization has such a plan, the NISS should write one
for the NIS department that supports corporate visions
and directions. The plan should include the vision and
goals of the program (that all actions are guided by
TQM principles), plans for staff (including self)
training in TQM, participation of staff in TQM
planning, strategic issues selected for beginning
improvement efforts (agreed on by staff and customers),
plans for tracking improvement efforts, plans to break
down all barriers of open communication (horizontal and
vertical), team guidelines (and how to support
interdepartmental teams) and recognition for team
efforts, resources for implementing TQM, how to foster
total involvement, basing more decisions on facts and
statistical data, definition of quality, and proposed
measures of quality from the customer perspective.

Total Quality Management
110
Summary
Total quality improvement is a management strategy
with great potential for the NISS. Through training in
TQM and implementation of a thorough TQM plan; the
quality of nursing information systems, NIS department
management, and the organization's total quality
improvement endeavors can all be improved.

Total Quality Management
111
References
Ahituv, N. & Neumann, S. (1990). Principles of
information systems for manaqement (3rd ed.).
Dubuque, Iowa: Wm. C. Brown Publishers.
Air Force Logistics Command (AFLC). (1991).
Application for the President's award for quality
and productivity improvement 1991. Wright-
Patterson Air Force Base, OH: AFLC.
Appel, F. & Weaver, C. G. (1991). Inteqrating quality
assurance and quality improvement. Unpublished
manuscript, First Consulting Group and University
of Maryland Medical System, Baltimore.
Albert, M. (1989). Developing a service-oriented
health care culture. Hospital and Health Services
Administration, 34(2), 167-183.
Albrecht, K. (1990). Service within. Homewood, ILL:
Business One Irwin.
Anderson, K. (1992, April 10). Dramatic turnaround:
X-ray processing time cut 81%. USA Today, p. 5B.
Arikian, V. (1991). Total quality management --
Applications to nursing service. Journal of
Nursing Administration, 21(6), 46-50.

Total Quality Management
112
Backaitis, N. & Rosen, H. H. (1990, June). Managing
for organizational quality-theory and
implementation: An annotated bibliography. (NPRDC
Publication No. TN-90-25). San Diego: Navy
Personnel Research and Development Center.
Barth, D. (1989, June). A four-step plan: Reaching
total quality commitment. Computers in Healthcare,
pp. 45-54.
Berg, C. M. (1983). The importance of nurses' input
for the selection of computerized systems. In B.
Barber, Y. Bryant, & M. Scholes (Eds.), The impact
of computers on nursing (pp. 42-58). North Holland:
Elsevier Science Publishers B.V.
Berry, L.L., Parasuraman, A., & Zeithaml, V. (1990,
Summer). Five imperatives for improving service
quality. Sloan Management Review, pp. 29-38.
Berry, L.L., Parasuraman, A., & Zeithaml, V. (1990).
Delivering quality service: Balancing customer
perceptions and expectations. New York: The Free
Press.
Berry, L.L., Parasuraman, A., & Zeithaml, V. (1991,
Spring). Understanding customer expectations of

Total Quality Management
113
service. Sloan Management Review, pp. 39-48.
Berwick, D.M. (1989). Continuous improvement as an
ideal in health care. New England Journal of
Medicine, January 5, pp. 53-56.
Berwick, D.M. (1991). Blazing the trail of quality:
The HFHS quality management process. Frontiers of
Health Services Management, 7(4), 47-50.
Berwick, D.M., Godfrey, A.B., & Roessner, J. (1991).
Curing health care: New strategies for quality
improvement. San Francisco: Jossey-Bass
Publishers.
Blacharski, C.S., Hagstrom, C., & Stratton, M. (1991).
Quality improvement in nursing: Implementation of a
comprehensive program using cost-effective
automation. Military Medicine, 156(12), 666-670.
Bradley, M. J., Brett, J. L., & Tonges, M. C. (1990,
July). Implementing the ten-step monitoring and
evaluation process in nursing practice. Quality
Review Bulletin, pp. 264-269.
Camp, R.C., Tucker, F.G., & Zivan, S.M. (1987,
January-February). How to measure yourself against
the best. Harvard Business Review, pp. 2-4.

Total Quality Management
114
Clausing, D. & Hauser, J.R. (1988, May-June). The
house of quality. Harvard Business Review, pp.
63-73.
Coffey, R. & Marszalek-Gaucher, E. (1991). Improving
cost effectiveness. Chapter 10 in Transforming
Healthcare Organizations -- How to Achieve & Sustain
Organizational Excellence. San Francisco: Jossey-
Bass Publishers.
Crawford-Mason, C. & Dobyns, L. (1991). Quality or
else: The revolution in world business. Boston:
Houghton Mifflin Company.
Crosby, P. B. (1979). Quality is free. New York:
McGraw -Hill.
Darr, K. (1990, Winter). Applying the Deming method
in hospitals: Part 2. Hospital Topics, pp. 4-6.
Darr, K. (1991, Summer). Quality improvement and
quality assurance compared. Hospital Topics, pp.
4-5.
Davidow, W. H. & Uttal, B. (1989, July-August).
Service companies: Focus or falter. Harvard
Business Review, pp. 77-85.
Deming, W.E. (1982). Quality productivity and

Total Quality Management
115
competitive positioninQ. Cambridge, MA:
Massachusetts Institute of Technology, Center for
Advanced Engineering Study.
Deming, W.E. (1986). Out of crisis. Cambridge,
MA: Massachusetts Institute of Technology.
Deming, W.E. (1987). Notes on management in a
hospital. Private letter, September 20.
Dobyns, L. (1990). Ed Deming wants big changes, and
he wants them fast. Smithsonian, 21(5), 74-81.
Dunbar, C. (March, 1992). Nurses want I/S selection
power, but do they have it? Computers in
Healthcare, pp. 20-26.
Eskildson, L. & Yates, G.R. (1991, February). Lessons
from industry: Revising organizational structure
to improve health care quality assurance. Quality
Review Bulletin, pp. 38-41.
Fifer, W.R. (1987, August). Quality assurance in the
computer era. Quality Review Bulletin, pp. 266-
270.
Garvin, D. (1987). Competing on the eight dimensions
of quality. Harvard Business Review, November-
December, pp. 101-109.

Total Quality Management
116
Geber, B. (1990). Improving the quality of white-
collar work. Training, 27(9). 29-34.
Green, E. & Katz, J. (1992). Managing quality: A
guide to monitoring and evaluating nursing services.
St. Louis: Mosby-Year Book, Inc.
Hacquebord, H. & Scholtes, P.R. (1988, August). Six
strategies for beginning the quality transformation,
Part II. Quality Progress, pp. 44-48.
Headrick, L., Melnikow, J., Neuhauser, D, & Vanek, E.
(1991, August). Introducing quality improvement
thinking to medical students: The Cleveland asthma
project. Quality Review Bulletin, pp. 254-260.
Heskett, J.L. & Schlesinger, L.A. (1991, September-
October). The service-driven service company.
Harvard Business Review. pp. 71-81.
Hoesing, H. & Kirk, R. (1990). Common sense quality
management. Journal of Nursing Administration,
20(10), 10-15.
Holzemer, W. (1990). Quality & cost of nursing care -
- Is anybody out there listening? Nursing & Health
Care, 11(8), 412-415.
Hume, S. (1990, October). Total quality management.

Total Quality Management
117
Health Progress.
Hunt, V.D. (1992). Quality in America: How to
implement a competitive quality program. Homewood,
Illinois: Business One Irwin.
Hurley, M. L. (1991, June). What do the new JCAHO
standards mean for you? RN, pp. 42-46.
Hurst, B.E. (1991, May 7). Quality. (address by
Blaine E. Hurst) (coverage of the AppliCASE
conference, held in San Francisco, CA., May 1-3).
The Computer Conference Analysis Newsletter, pp 6-
7.
Ishikawa, K. (1976). Guide to quality control.
Tokyo: Asian Productivity Organization.
Jeffer, E.K. (1991). Total quality management and the
Army health care system. Military Medicine,
156(10), 546-550.
Joint Commission on Accreditation of Healthcare
Organizations. (1991). Accreditation manual for
hospitals. Oakbrook Terrace, Ill.: Author.
Juran, J.M. (1986). The quality trilogy. Quality
Progress, 19(8), 19-24.
Juran, J. M. (1988). Planning for quality. New York:

Total Quality Management
118
The Free Press.
Kaegi, L. (1990, November). Rethinking quality --
nationally and regionally. Quality Review Bulletin,
pp. 409-413.
Kolence, K.W. (1991, March). Quality MIS post-and-
beam. Software Magazine, pp. 112-113.
Koska, M. T. (1990, January 5). JCAHO: Pilot
hospitals' input updates Agenda for Change.
Hcspitals, pp. 50-54.
Koska, M.T. (1991, August 5). New JCAHO standards
emphasize continuous quality improvement.
Hospitals, 65(15), 41-46.
Larson, K. (1990, April). Pareto delivers. Quality
Progress. p. 33.
Lehmann, R. D. (1987, April). Joint Commission sets
agenda for change. Quality Review Bulletin, pp.
148-150.
Lehr, H. & Strosberg, M. (1991, October). Quality
improvement in health care: Is the patient still
left out? Quality Review Bulletin, pp. 326-329.
Leonard, E.P. (1989). Quality assurance in military
medicine is not unique. Military Medicine, pp.

Total Quality Management
119
159-160.
Mantel, , Jr., S.J. & Meredith, J.R. (1989). Project
management: A managerial approach. Toronto: John
Wiley & Sons.
March, A. & Garvin, D.A. (1987, June). A note on
quality: The views of Deming, Juran, and Crosby.
Harvard Business Review, pp. 1-19.
Margolis, N. (1991, July 15). Black and Decker revs
quality tool: IS department uses "total quality
management" as bridge to users. Computerworld, p.
18.
Matthews, B.L. (1992). Case study: The
implementation of total quality management at the
Charleston VA Medical Center's dental service.
Military Medicine, 157(1), 21-24.
McLagan, P. (1991, November). The dark side of
quality. Training, pp. 31-33.
Merry, M. D. (1991). Quality assurance vs. quality
improvement. Furst Impressions, 4(6).
Milakovich, M.E. (1991). Creating a total quality
health care environment. Health Care Management
Review, 16(2), 9-20.

Total Quality Management
120
Miller, D. (1991). Total quality management at
Alliant Health System. Furst Impressions, 4(6).
Newman, G. (1991, June). The case against quality.
Across the Board, pp. 57-56.
Oberle, J. (1990). Quality gurus: The men and their
messages. Training, 27(7), 47-52.
O'Leary, D.S. (1991, January). CQI--A step beyond QA.
Quality Review Bulletin, pp. 4-5.
O'Leary, D.S. (1991, March,. Accreditation in the
quality improvement mold -- a vision for tomorrow.
Quality Review Bulletin, pp. 72-77.
Patterson, C. H. (1990). Quality assurance, control,
and monitoring: 2. The future role of information
technology from the Joint Commission's perspective.
Computers in Nursing, 8(3), 105-110.
Patterson, C. H. (1991). New Joint Commission
standards for 1991 require R.N. decision making.
Nursing Administration Quarterly, 15(4), 65-68.
Perry, W.E. (1991, July 22). Why downsizing makes
sense in the '90's. Government Computer News,
p. 66.
President and Fellows of Harvard College. (1987,

Total Quality Management
121
June). A note on quality: The views of Deming,
Juran, & Crosby. Harvard Business Review, pp. 1-
19.
Priest, S.L. (1989). Understanding computer
resources: A healthcare perspective. Owings Mills,
MD: National Health Publishing.
Ruark-Hearst, M. (1991, February). Cornerstones of
health care in the nineties: Key constituencies
debate propositions for collaborating in the quality
revolution. Quality Review Bulletin, pp. 60-65.
Sahney, V.K., & Warden, G.L. (1990). The quest for
quality and productivity in health services.
Frontiers of Health Services Management, 7(4), 2-
40.
Schmitt, W. A. (1991, May). Quality assurance: A
shift in focus. Hospitals, pp. 16-17.
Shanahan, M. (1988, November). Confronting the
software dilemma: Specifications for a QA/RM
information management system. Quality Review
Bulletin, pp. 345-347.
Simpson, R.L. (1991). The Joint Commission did what
you wouldn't. Nursing Management, 22(1), 26-27.

Total Quality Management
122
Simpson, R.L. (1992). How to bring nursing and system
vendors closer together. Nursing Management, 23(1),
22-23.
Skjei, E. (1989, April). JCAHO begins development of
clinical QA system. Computers in Healthcare, p. 6.
Spitzer, P.G. (1991, September). Information systems
support for healthcare quality: A comprehensive
framework. (Part 1). Computers in Healthcare, pp.
24-26.
Ummel, S.L. (1991, September). Quality management:
fad or future? Computers in Healthcare, pp. 18-21.
Walton, M. (1986). The Deming management method. New
York: The Putnam Publishing Group.
West, E. (1990, September). Designing information
systems to increase quality care. Computers in
Healthcare, pp. 59-60.
Williams, A.D. (1991). Development and application of
clinical indicators for nursing. Journal of Nursing
Care Quality, k(l), 1-5.
Zemke, R. (1992, January). Faith, hope, and TQM.
Training, p. 8.

~~t)
Q) L 0
FR
pO
0t
03
IC4-
I lEtl
tF
pc 0

Appendix B
Checksheet
Reasons for Calls to NIS Office
Product: Hospital Information System
Dates: January 1, 1992
Total Calls: 19
Reason for Call Call Count Subtotal
How to: Enter Orders 1111111111 10
Print Reports I 1
Chart IV's 1111 4
Chart I&O II 2
Chart Medications 0
Printer Problems II 2
Grand Total 19

700
- 4I0
7C3~
z 0c
0 0C~j 70)

Appendix D
LAB TEST PROCESS OVERVIEW FLOWCHARTPHYSICIAN
DETERMINES NEEDFOR TESTI}PHYSICIAN
COMPLETES LAB
REQUEST FORMI
FLOOR SECRETARYSTAMPS NAME& PT NUMBER
STAT TYPE ROUTINE
OF TE>ST7?
URGENT
FLOAR LOOR SECRETARY-CALLS LAB CALLS LAB
LOOR SECRETARY :LOOR SECRETARY FLOOR SECRETARY,PLACES REQUEST PLACES REQUEST PLACES REQUEST I
lIN OUTBOX IN OUTBOX IN OUTBOXI tIN
LAB RECEPTIONIS PHLEBOTOMISTNOTIF7ES " |BTAINS SPECIMEN
TOMIST" DURING ROUTINEPHLEBOTOMIST ROUNDS
TRAVELS DIRECTLY!
TO FLOOR
PHLEBOTOMIST ISPICKS UP LAB PHLEBOTOMIST MESSENGER
EQUEST & DRAWS ELIVERS SPECIME14 :DELIVERS RESULT&TO LAB & TEST TO FLOORPERFORMED

couIL-.
(1)
CC)
4-j
C) I- u700
C)C)
0~ 0
CD*~~ I-
L.C CD)CQnC CD)
_ _ 0 a ... C) n (u
C) 0
cu CD D*-C(D) C.CW CD
C LL
.) ..... ....
mD CD)-0
(tS-D
U-M(

E 0La%)C CD~
42 a)
W COLCL Cl)
a)
0- -cI a
.. ......
a) 0
a C
o CC
0 (
Z CCUch
05C

.........
C/)
al)
Cc 0
a) .- <-
o LO 0 LO 0 LO 0 i0V C\j C\j
0 >= wa

w)E
ci)
0 c
17 ao (Z
E cn
cr0
0~ 0
0 (- cn
a) 0-..........).
ci) ~ 0). CA)
co 0 n
........................ z- -CL ...... Mo
0 0)LOC RtCE ~
a)C, W-

Appendix H
Interpreting ScatterDiagrams
-0~ Strong CorrelationY Suggests that control of one
results in control of other@0@
X
": :-: Weak Correlation" • " * Suggests control of one
• .does not necessarilyresult in control of other
x
i.1. :*:!. *No Correlation
* :Suggests no relationship
X
* " .Complex Correlation
Y. - . ". Suggests non-linear0•"relationship
X C. -ea,

C)
CC/
C-))-~4-0
-0 0 C
C))
E. -, CDC)
8 2 E~~-cn
.. .... ... .
Ul) C cnEcn 0. CD>
a))
... .. ... .. ... ..
...... .. ..... .. U -_ ...... ...........
U-C
CDQ

- C..
C.C- - - - -
- ~J ' - --
- .1. -
.4A.*~*: *:~- - ~ '-L-'
- -~ r i
-:~~1 -:f -z
Cs
>s 'o - -a.a*C C
-v ,- CA
- I-
-Z Cs r.- ,
-- M L4 4
t- = >Z.ZS Cc
Cs - ' - I .
z s - = u CL '
-l C-Z-Ul

Appendix K
Juran's Categories of Quality Costs
1. Internal failure costs: Costs from product defects
prior to shipment to the customer. They include:
- Scrap
- Rework
- Retest
- Downtime
- Yield losses
- Disposition
2. External failure costs: Costs associated with
defect found after shipment to the customer. They
include:
- Complaint adjustment
- Returned material
- Warranty charges
- Allowances
3. Appraisal costs: Costs associated with discovering
the condition of products and raw materials. They
include:
- Incoming materials inspection
- Inspection and test
- Maintaining accuracy of test equipment
- Materials and services consumed

Appendix K
Juran's Categories of Quality Costs
- Evaluation of stocks
4. Prevention costs: Costs associated with preventing
defects and limiting failure and appraisal costs. They
include:
- Quality planning
- New products review
- Training
- Process control
- Quality data acquisition and analysis
- Quality reporting
- Improvement projects (Juran, 1988).

Appendix L
Existing product Juran's Quality Planning Road Map
and process
I Identify Customers' needscustomers (in units of measure)
List of customers I Developproduct
Discover *
customers' needs Product features
nCustomers' needs Optimize(in their language) product design
Translate Product goals
Customers' needs Develop(in our language) process
0 Establish Process features
units of measure +( Optimize: prove]
Units of measure process capability
E i Process readyEstablish to transfer
measurement
Customers' needs Transfer to(in units of measure) operations
Process readyto produce
Source: J. M. Juran, Planning for Quality (New York: The Free Press, 1988).

Append:ix MStep 1 - Establish the DOD' s TQM ModelTQM management andcultural environment
• Vision• Long-term
commitment* People involvement* Disciplined
methodology• Support systems• Training
T Step 2 - Define mission ofeach component of theorganization
_ Step 3 - Set performance
improvement opportunities,goals and priorities
Step 4 - Establishimprovement projectsand action plans
Step 7- Review andrecycle. Step 5 -Implement
projects using improvementmethodologies
Step 6 - Evaluate
Improved performance- Reduced cycle time• Lower cost* Innovation
Source: Department of Defense, Quality and Productivity Self-Assesslnent Guide for Defense 0,',ani-zations. (Washington, D.C.: Department of Defense, 19q0).

Appendix N
DOD Total Quality Management Master Plan
Mid-Range (Three-Year) Goals:
- Harmonize DoD regulations with TQM goals.
- Eliminate attitudinal and policy barriers to
TQM.
- Cultivate TQM champions in Congress
- Promote TQM programs in top defense contracting
firms.
Long-Range (Seven-Year) Goals:
- Establish TQM as a way of life.
- Have all DoD personnel directly participating in
continuous process improvement.
- Gain Congressional understanding and support for
TQM.