I R A M P ISSN: 2229-3159 © International Science Press 4(1), … · 2020-01-02 · standard lamp,...
5
International Review of Atomic and Molecular Physics, 4 (1), January-June 2013 63 © International Science Press ISSN: 2229-3159 I R A M P 4(1), June 2013, pp. 63-67 Measurement and Analysis of Carbon Swan Spectra Following Laser-induced Optical Breakdown in Air MICHAEL J. WITTE 1 AND CHRISTIAN G. PARIGGER 1,a 1 University of Tennessee Space Institute, Center for Laser Applications, Tullahoma, TN 37388, USA a Corresponding author: [email protected] ABSTRACT: In this work, we report on measurements of time-resolved Carbon Swan spectra following laser ablation of carbon material. Diatomic molecular C 2 line-strengths are utilized to compute the fitting of the measured data. The C 2 molecule shows that its lowest rotational levels are sensitive to temperature variation. However, we record spectra for time delays for which Local Thermodynamic Equilibrium is expected to be established. In this respect, a single temperature fitting will be viable. For laser ablation of graphene with 190 milliJoule, 13 nanosecond Nd:YAG pulses at a wavelength of 1064 and 532 nanometers, our results show temperatures in the range of 4000 to 6500 K for delays in the range of 70 to 20 microseconds after optical breakdown. PACS numbers: 52.50.Jm, 33.20.-t, 78.47.dc, 82.80.-d, 95.55Qf, 95.75.Fg. Keywords: laser-induced breakdown spectroscopy; molecular spectroscopy, time- resolved spectroscopy, laser-induced breakdown, spectroscopy in astronomy. I. INTRODUCTION Laser-induced breakdown spectroscopy (LIBS) can be applied for accurate determination of unknown materials. When faced with an unknown material, direct handling of the material may not be desired, usually due to concerns of the material being radioactive, unstably explosive, or other such hazards. Most of these substances contain carbon compounds. LIBS offers a mostly non-invasive way in looking at the materials’ spectrum to analyze its composition. In order for this procedure to be effective, a reasonable set of precise and accurate “calibration spectra” is preferably available or must be acquired. In other words, precision and accuracy are required. Thus, for applications of LIBS with carbon compounds, experiments that address C 2 molecular spectra are desirable together with an accurate analysis. Spectral predictions for diatomic molecules require at least a temperature to determine Boltzmann factors and line-strengths that represent the allowed spectral transitions for the molecule 1 . Atomic and molecular spectroscopy techniques 2 allow us to analyze recorded spectra. However, accurate spectral predictions may also include spectral resolution, electron density, reaction rates, collision rates, and pressure. These parameters are adjusted to determine the best fitting model for each spectral measurement. In this investigation, we infer the temperature of C 2 Swan bands for laser ablation events by comparing measured with computed spectra. II. EXPERIMENTAL ARRANGEMENT Frequency doubled laser radiation on the order of 75 mJ/pulse is used to generate laser-induced breakdown. The pulse width of the laser radiation amounted to 13 ns, and measurements utilized varying gate widths corresponding to varying time delays ranging from 20 µs to 70 µs, with gate width times increased as needed. The time-resolved spectra were recorded with a EG&G PARC linear diode array to record spectra dispersed with a 1800 grooves/mm grating in a HR640 Jobin-Yvon 0.6 m spectrometer. Sensitivity calibration was accomplished by use of a tungsten
Transcript of I R A M P ISSN: 2229-3159 © International Science Press 4(1), … · 2020-01-02 · standard lamp,...
Measurement and Analysis of Carbon Swan Spectra Following Laser-induced Optical Breakdown in Air
International Review of Atomic and Molecular Physics, 4 (1), January-June 2013 63
© International Science PressISSN: 2229-3159I R A M P
4(1), June 2013, pp. 63-67
Measurement and Analysis of Carbon Swan Spectra FollowingLaser-induced Optical Breakdown in Air
MICHAEL J. WITTE1 AND CHRISTIAN G. PARIGGER1,a
1University of Tennessee Space Institute, Center for Laser Applications, Tullahoma, TN 37388, USAaCorresponding author: [email protected]
ABSTRACT: In this work, we report on measurements of time-resolved Carbon Swan spectra following laser ablationof carbon material. Diatomic molecular C
2 line-strengths are utilized to compute the fitting of the measured data. The C
2
molecule shows that its lowest rotational levels are sensitive to temperature variation. However, we record spectra fortime delays for which Local Thermodynamic Equilibrium is expected to be established. In this respect, a single temperaturefitting will be viable. For laser ablation of graphene with 190 milliJoule, 13 nanosecond Nd:YAG pulses at a wavelengthof 1064 and 532 nanometers, our results show temperatures in the range of 4000 to 6500 K for delays in the range of 70to 20 microseconds after optical breakdown.
PACS numbers: 52.50.Jm, 33.20.-t, 78.47.dc, 82.80.-d, 95.55Qf, 95.75.Fg.
Keywords: laser-induced breakdown spectroscopy; molecular spectroscopy, time- resolved spectroscopy, laser-inducedbreakdown, spectroscopy in astronomy.
I. INTRODUCTION
Laser-induced breakdown spectroscopy (LIBS) can be applied for accurate determination of unknown materials.When faced with an unknown material, direct handling of the material may not be desired, usually due to concernsof the material being radioactive, unstably explosive, or other such hazards. Most of these substances containcarbon compounds. LIBS offers a mostly non-invasive way in looking at the materials’ spectrum to analyze itscomposition. In order for this procedure to be effective, a reasonable set of precise and accurate “calibration spectra”is preferably available or must be acquired. In other words, precision and accuracy are required. Thus, for applicationsof LIBS with carbon compounds, experiments that address C
2 molecular spectra are desirable together with an
accurate analysis.
Spectral predictions for diatomic molecules require at least a temperature to determine Boltzmann factors andline-strengths that represent the allowed spectral transitions for the molecule1. Atomic and molecular spectroscopytechniques2 allow us to analyze recorded spectra. However, accurate spectral predictions may also include spectralresolution, electron density, reaction rates, collision rates, and pressure. These parameters are adjusted to determinethe best fitting model for each spectral measurement. In this investigation, we infer the temperature of C
2 Swan
bands for laser ablation events by comparing measured with computed spectra.
II. EXPERIMENTAL ARRANGEMENT
Frequency doubled laser radiation on the order of 75 mJ/pulse is used to generate laser-induced breakdown. Thepulse width of the laser radiation amounted to 13 ns, and measurements utilized varying gate widths correspondingto varying time delays ranging from 20 µs to 70 µs, with gate width times increased as needed. The time-resolvedspectra were recorded with a EG&G PARC linear diode array to record spectra dispersed with a 1800 grooves/mmgrating in a HR640 Jobin-Yvon 0.6 m spectrometer. Sensitivity calibration was accomplished by use of a tungsten
Michael J. Witte and Christian G. Parigger
64 International Review of Atomic and Molecular Physics, 4 (1), January-June 2013
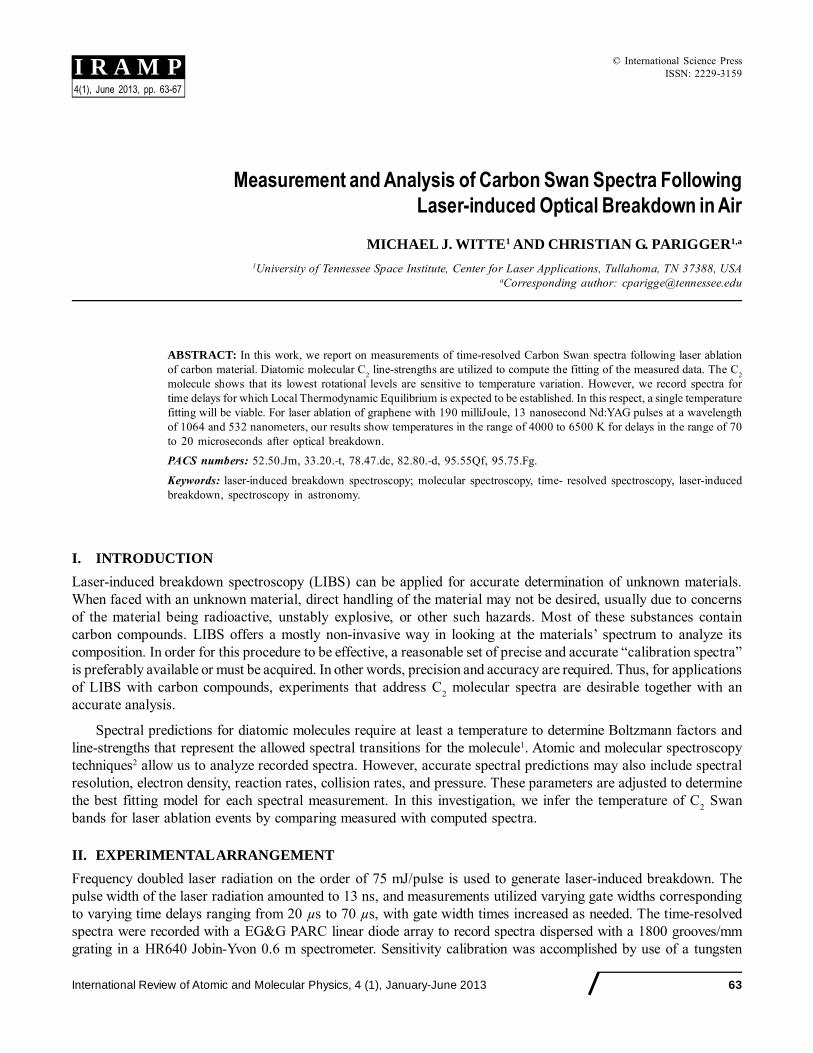
Figure 1: Photographs of experimental arrangement. Top part shows the Nd:YAG laser (bottom left). Bottompart shows the spectrograph (middle left).
standard lamp, measured at an operating temperature of 2910 K. Wavelength calibration was accomplished with amercury lamp.
Figure 1 shows a photograph of the experimental setup. The carbon sample is either manually held or placed onan angled surface, depending on which allowed the best collection of data. The 532-nm laser radiation is focusedonto the sample, ablating it, and the plasma emission is imaged onto the spectrometer entrance slit on the right.
III. RESULTS
The experimental procedures included capture of time-resolved spectra for various time delays, followed by intensityand wavelength calibration. The intensity calibration uses a standard black-body curve calculated for the spectralwavelength band and the recorded intensity profile emitted by a tungsten lamp. The calibration is accomplishedusing a least-squares algorithm.
Analysis of the experimental records is accomplished by sequentially increasing the accuracy of thecomparisons of experimentally recorded and computed molecular spectra. The Calibrated spectra are fit with thepredicted C
2 spectra using a Nelder-Mead algorithm, which allows multi-variable fitting. Intensity- and wavelength-
calibrated data are run through the so-called Nelder-Mead-Temperature (NMT) program with, first, a fixed FWHMof 0.08 nm. A spectral fit is generated, which is used to linearly wavelength calibrate the data. This generates anew spectrum, allowing a repeat of the process, though with quadratic wavelength fitting this time. Subsequently,the FWHM is set to variable and a new fit is computed. This is followed by generating a cubic wavelength fit.The NMT program is then utilized three times to compute the temperature that generates the best fit between theexperimental and theory spectra. This procedure is applied for both the 504-517 nm and the 550-564 nm wavelengthbands.
Measurement and Analysis of Carbon Swan Spectra Following Laser-induced Optical Breakdown in Air
International Review of Atomic and Molecular Physics, 4 (1), January-June 2013 65
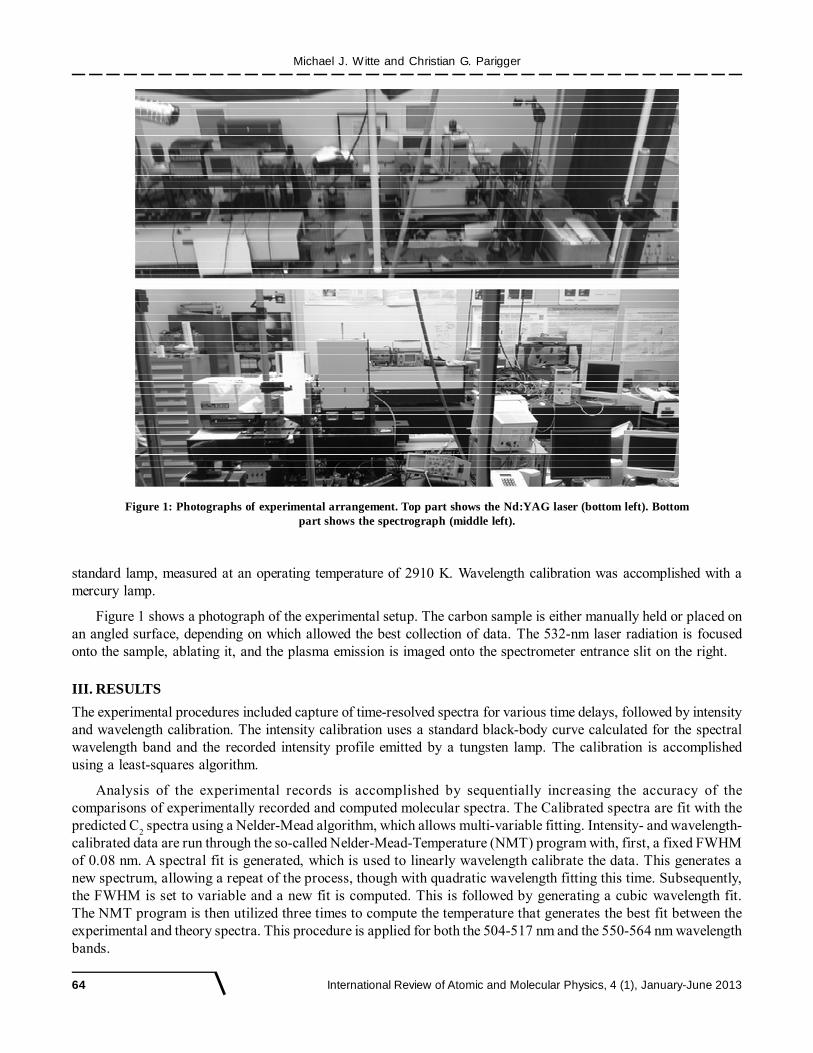
Figure 2: C2 spectra, with a delay of 30 µs and a gate-width of 1 µs. Calculated temperature amounts to 4300 K, with a
spectral resolution FWHM of 0.086 nm. This graph shows the experimental and the superposed computed spectrum.The curved line indicates the background. The bottom spectrum illustrates the difference between theexperimental and fitted data. The difference data shows a standard deviation of 175, the background
curve average amounts to 448.
Figure 2 is a representative display of recorded and fitted C2 spectra for the C
2 550-564 nm wavelength band. As
discussed in Refs.1,8, carbon shows four band transitions between 550 and 564 nm: (0-1), (1-2), (2-3), and (3-4)bands. The four expected C
2 peaks, the C
2 �� = 1 Swan band sequences, are visible : two prominent (558.5 nm,
563.5 nm), two not so prominent (550.1 nm, 554.0 nm). The experimental data shows nice agreement with the fittedspectra as they nearly overlap. The difference graphs show an average near zero, with standard deviations below thebackground averages. The spikes coincide around the C
2 peaks.
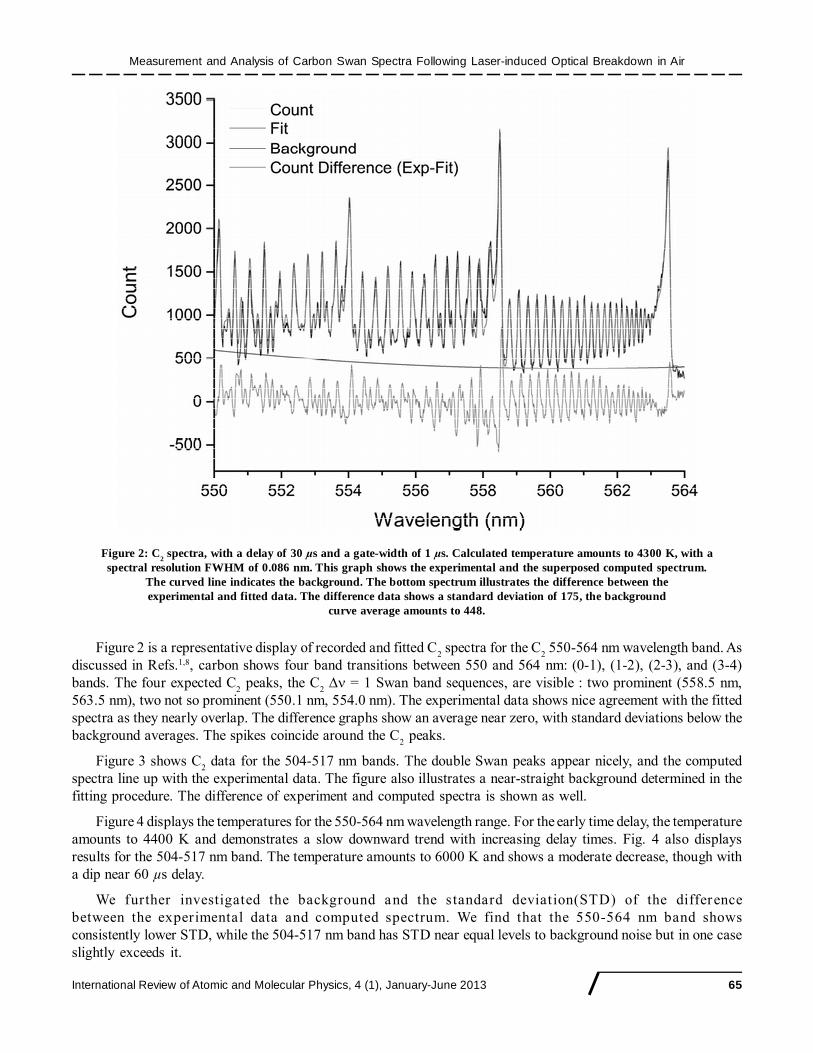
Figure 3 shows C2 data for the 504-517 nm bands. The double Swan peaks appear nicely, and the computed
spectra line up with the experimental data. The figure also illustrates a near-straight background determined in thefitting procedure. The difference of experiment and computed spectra is shown as well.
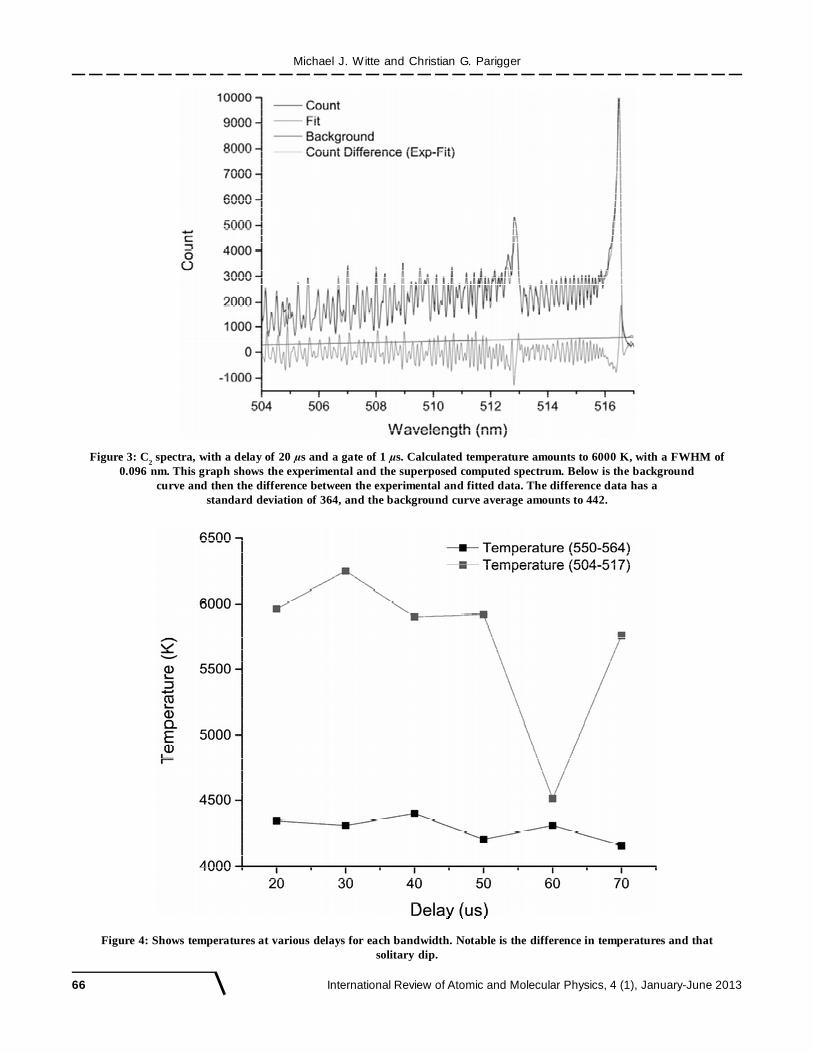
Figure 4 displays the temperatures for the 550-564 nm wavelength range. For the early time delay, the temperatureamounts to 4400 K and demonstrates a slow downward trend with increasing delay times. Fig. 4 also displaysresults for the 504-517 nm band. The temperature amounts to 6000 K and shows a moderate decrease, though witha dip near 60 µs delay.
We further investigated the background and the standard deviation(STD) of the differencebetween the experimental data and computed spectrum. We find that the 550-564 nm band showsconsistently lower STD, while the 504-517 nm band has STD near equal levels to background noise but in one caseslightly exceeds it.
Michael J. Witte and Christian G. Parigger
66 International Review of Atomic and Molecular Physics, 4 (1), January-June 2013
Figure 3: C2 spectra, with a delay of 20 µs and a gate of 1 µs. Calculated temperature amounts to 6000 K, with a FWHM of
0.096 nm. This graph shows the experimental and the superposed computed spectrum. Below is the backgroundcurve and then the difference between the experimental and fitted data. The difference data has a
standard deviation of 364, and the background curve average amounts to 442.
Figure 4: Shows temperatures at various delays for each bandwidth. Notable is the difference in temperatures and thatsolitary dip.
Measurement and Analysis of Carbon Swan Spectra Following Laser-induced Optical Breakdown in Air
International Review of Atomic and Molecular Physics, 4 (1), January-June 2013 67
IV. CONCLUSIONS
Throughout most of the measurements, results have been within expected parameter ranges for temperature,background, and spectral resolution. However, there have been some discrepancies. As seen in figure 4, two majorones are the differences in temperatures between the two bands, and the dip at 60 µs for the 504-517 band. Therecan be several reasons for the differences. For example, differences can be due to volume-averaging over time, asthe laser-induced plasma is recorded over a range of 20 to 70 microseconds time delays after micro-plasma generationduring laser ablation with gate widths on the order of 1-10 µs. In addition, the plasma is volume-averaged overspace as the linear diode array only allows for a one-dimensional spectrum. This is partially mitigated by thedifference graph which can help reinforce the agreement between experiment and theory, and indicate a lowerbounds for significant results.
Future experimental studies show two main interests. One, increase in spectral resolution by employing ahigher grooves/mm grating to possibly address some of the differences in inferred temperature. Two, recording ofspatially resolved data will be of interest possibly followed by application of Abel and Radon inverse transformationsin order to better study the discrepancies that are indicated.
Acknowledgements
MJW and CGP thank for support of this work by the Center for Laser Applications at the University of Tennessee Space Institute.
References
[1] J. O. Hornkohl, L. Nemes, and C.G. Parigger, “Spectroscopy of Carbon Containing Diatomic Molecules,” in Spectroscopy, Dynamicsand Molecular Theory of Carbon Plasmas and Va- pors, Advances in the Understanding of the Most Complex High-TemperatureElemental System, L. Nemes and S. Irle, Eds. (World Scientific), 113-169 (2011).
[2] C.G. Parigger, and J.O. Hornkohl, Int. Rev. At. Mol. Phys. 1, 25, (2010).
[3] C. G. Parigger, Spectrochim. Acta B 79-80, 4, (2013).
[4] V. Motto-Ros, Q.L. Ma, S. Gregoire, W.Q. Lei, X.C. Wang, F. Pelascini, F. Surma, V. Detalle, J. Yu, Spectrochim. Acta B 74-75, 11(2012).
[5] V. K. Unnikrishnan, Kamlesh Alti, Ra jesh Nayak, Rodney Bernard, V. B. Kartha, C. Santhosh, G. P. Gupta, and B. M. Suri, Pramana- J. Phys. 75, 1145, (2010).
[6] S. S. Harilal, R. C. Issac, C. V. Bindhu, V. P N. Nampoori, C. P. G. Vallabhan, J. Phys. D: Appl. Phys. 30, 1703, (1997).
[7] E. Rohlfing, J. Chem. 89, 6103, (1988).
[8] Abhilasha and R.K. Thareja, Phys. Lett. A 184, 99, (1993).