I of a Distinct Wing-Body I- onfiguration at Mach · of a Distinct Wing-Body onfiguration at Mach 6...
35
i 1 NASA ‘I. 1 1 Technical i! Paper 1 - I I - I August 1985 I I I 1 - I 1 ’ , < -, Aerodynamic Characteristics of a Distinct Wing-Body onfiguration at Mach 6 TECHNICAL RE?ORm, FILE COPY \I https://ntrs.nasa.gov/search.jsp?R=19850024794 2018-08-31T22:16:24+00:00Z
Transcript of I of a Distinct Wing-Body I- onfiguration at Mach · of a Distinct Wing-Body onfiguration at Mach 6...

i 1 NASA ‘I.
1 1 Technical i ! Paper 1 -
I
I -
I August 1985
I I I
1 -
I 1 ’ , < -,
Aerodynamic Characteristics of a Distinct Wing-Body
onfiguration at Mach 6
TECHNICAL RE?ORm, FILE COPY \I
https://ntrs.nasa.gov/search.jsp?R=19850024794 2018-08-31T22:16:24+00:00Z
NASA Technical Paper 2467
1985
NASA N at io na I Ae rona u t ic s and Space Administration
Scientific and Technical Information Branch
Aerodynamic Characteris tics of a Distinct Wing-Body Configuration at Mach 6
Experiment, Theory, and the Hype rs o n ic Is o la t i o n Principle
Jim A. Penland and James L. Pittman Langley Research Center Hampton, Virginia
Summary An experimental wind-tunnel investigation has
been conducted to determine the effect of wing leading-edge sweep and wing translation on the aero- dynamic characteristics of a wing-body configuration at a free-stream Mach number of about 6 and a free- stream Reynolds number (based on body length) of 17.9 x lo6. Seven wings with leading-edge sweep angles from -30’ to 60’ were tested on a common body in a blowdown tunnel over an angle-of-attack range from -12’ to 10’ at angles of sideslip of 0’ and 2’. All wings had a common span, aspect ra- tio, taper ratio, planform area, and thickness ratio. The wings were translated longitudinally on the body to make tests possible with the total and exposed mean aerodynamic chords located at a fixed body station. Aerodynamic forces were found to be inde- pendent of wing sweep and translation, and pitch- ing moments were constant when the exposed wing mean aerodynamic chord was located at a fixed body station. Thus, the “Hypersonic Isolation Principle” was verified. Impact theory applied with tangent- wedge pressures on the wing and tangent-cone pres- sures on the body provided excellent predictions of aerodynamic force coefficients but poor estimates of moment coefficients.
Introduction The design of an efficient hypersonic cruise air-
craft requires a detailed knowledge of how various geometrical parameters affect the longitudinal and lateral aerodynamic characteristics of the complete aircraft. One important geometrical parameter is wing leading-edge sweep. Many wind-tunnel test programs have previously been performed to study the effect of wing sweep on performance, stability, and control, particularly in the speed range from high subsonic to !cw supersooic Mach numbers (ref. 1). Studies at hypersonic speeds have dealt primarily with iiit: aerodyiiamics of specific configurations of various geometries with emphasis on delta wings, aerodynamic heating, particularly of blunt leading edges, and comparisons of experiment with theory. Few studies at hypersonic speeds have tested configu- rations having variations in wing leading-edge sweep while holding other geometric parameters constant. References 2 to 9 represent some exceptions at Mach numbers of about 3 to 7.
One objective of the study reported herein was to determine for Mach 6 a procedure for systemati- cally varying the wing leading-edge sweep angle of a distinct wing-body configuration so that the longitu- dinal force and moment characteristics would remain constant. Seven wings with different leading-edge
sweep angles but with constant span, aspect ratio, taper ratio, planform area, and thickness ratio were investigated. The mean aerodynamic chord C was constant and the location of relative to the longi- tudinal body station was constant for all tests.
Another objective was to determine whether to base ? on the exposed or wetted wing area or on the total wing area, including that wing area which falls inside the fuselage. The mean aerodynamic chord based on the exposed wing area is supported by what we propose to call the “Hypersonic Isolation Princi- ple,” that is, that aerodynamic forces are generated only by those components exposed to the hypersonic flow, that aerodynamic forces act at the centroid of the planform of the components, and that compo- nent interference is virtually negligible. These prin- ciple assumptions are made in most impact theory aerodynamic computer codes.
Tests were conducted in the Langley 20-Inch Mach 6 Tunnel at a free-stream Reynolds number of 17.9 x lo6 based on body length for an angle-of- attack range of approximately -12’ to 10’. Seven different wings with leading-edge sweep angles that varied from -30’ (forward sweep) to 60’ (rearward sweep) in 15’ increments were tested. The test con- figuration was constructed so that each wing could be tested with the exposed mean aerodynamic chord and the total mean aerodynamic chord at separate but h e d body stations. A theoretical study using hypersonic impact methods was also conducted and reported herein.
Symbols The longitudinal characteristics are presented
about the stability axes, and the lateral-directional characteristics are presented about the body axes. The moment reference point was at the design center- of-gravity location, which was at a longitudinal sta- tion 62.2 percent of the fuselage length and at a ver- tical station 1.12 percent of the fuseiage iength below the vehicle reference line.
A reference area (total area of all wings, including body intercept), 76.3812 in2 (see fig. 1)
AR aspect ratio
b wing span, 12.60 in.
C A axial-force coefficient, 5 drag coefficient, a D
C D
C F average skin-friction coeffi- cient, compressible
lift coefficient,
rolling-moment coefficient,
2% rate of change of Cl with angle of sideslip, per degree
pitching-moment coefficient,
normal-force coefficient, P m
yawing-moment coefficient,
2% rate of change of C, with angle of sideslip, per degree
70 percent vacuum condition
side-force coefficient, 3 rate of change of C y with angle of sideslip, per degree
local chord
mean aerodynamic chord
mean aerodynamic chord based on exposed wing outside of body
mean aerodynamic chord based on total wing area, including body intercept
drag, FN sin CY + FA cos CY
diameter
axial force along X-axis (positive direction is -X) normal force along Z-axis (positive direction is -2)
side force along Y-axis (posi- tive direction is -Y)
height of body (see fig. 1)
lift, FN cos CY - FA sin (I
leading edge
lift-drag ratio
length of model fuselage, 28.03 in.
PCO
900
R
Rl
A 2
CY
A
A
local Mach number
free-stream Mach number
moments about X - , Y - , and Z-axes
free-stream static pressure
free-stream dynamic pressure
local Reynolds number
Reynolds number based on fuselage length
top body radius
bottom body edge radius
trailing edge
total or stagnation temperature
wall temperature
airfoil thickness
reference axes
distance from leading edge of E to center of pressure
droop of body nose (see fig. 1)
angle of attack, deg
angle of leading-edge sweep, deg
taper ratio, Tip chord/Root chord
Models, Apparatus, and Tests
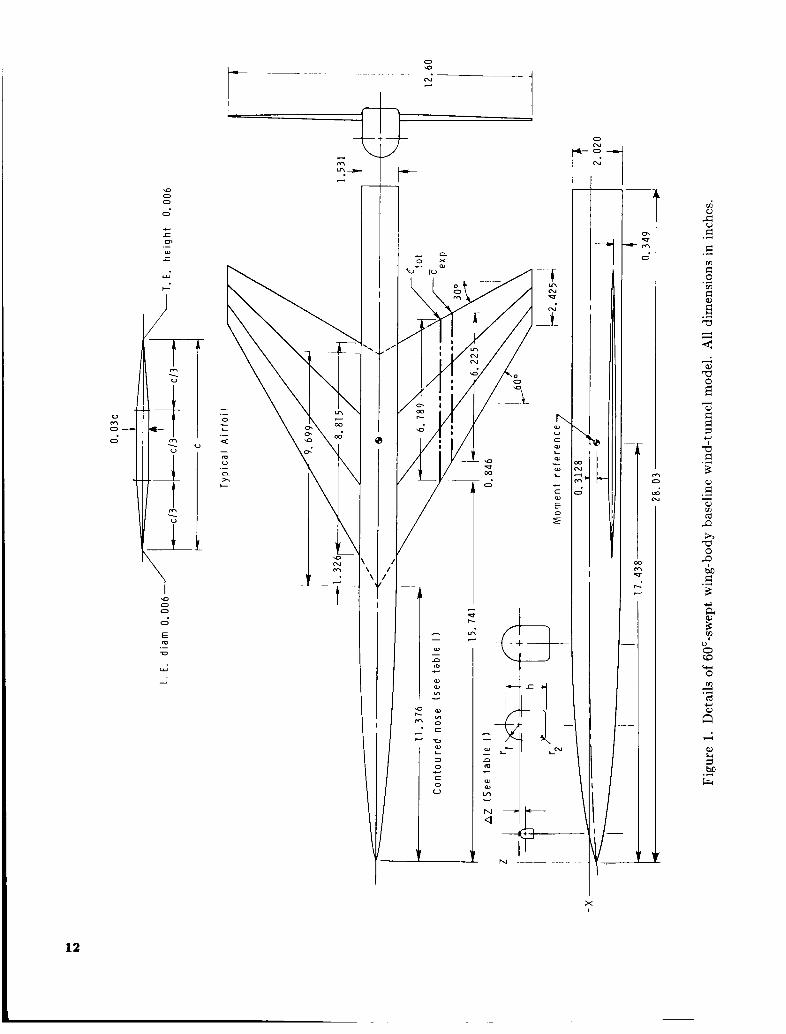
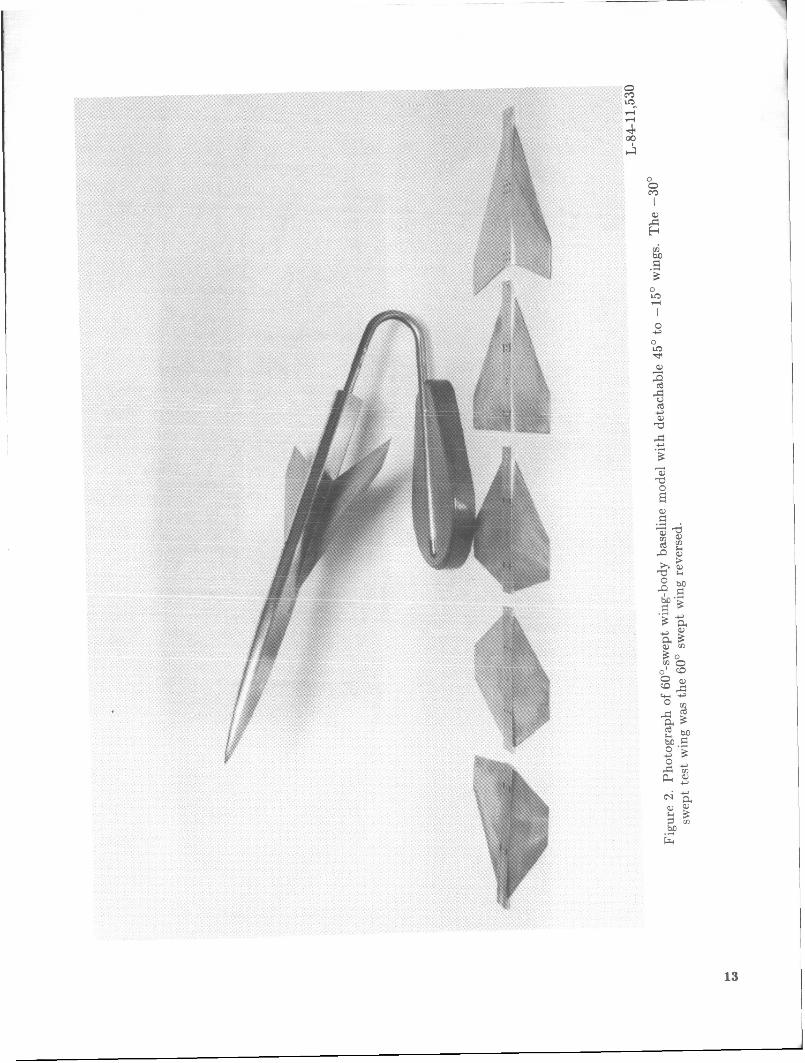
Test Configurations The geometric details and photograph of the test
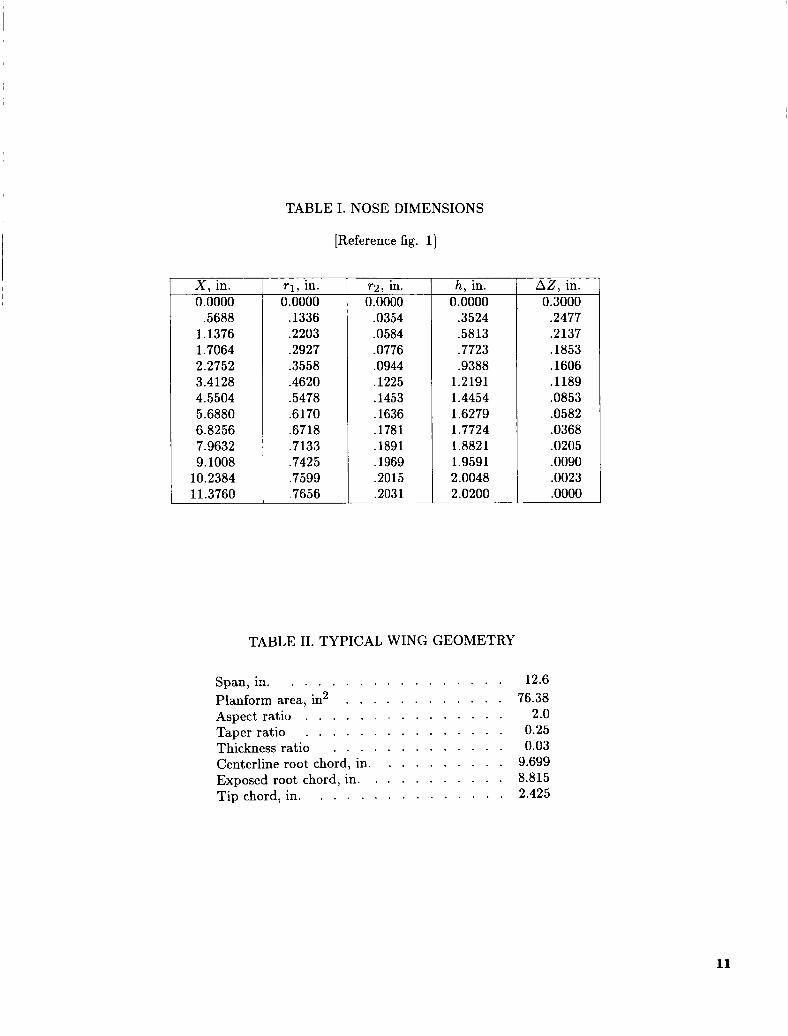
configurations are shown in figures 1, 2, and 3; body nose dimensions are listed in table I. The basic con- figuration consisted of a body and a series of seven interchangeable wings with constant span, planform area, aspect ratio, taper ratio, thickness ratio, and streamwise root and tip chords. (See table 11.) All wings had 3-percent-thick symmetrical wedge-slab- wedge airfoil sections with 0.006-in. leading and trail- ing edges (fig. 1). The leading-edge sweep angles were varied from -30' (forward sweep) to 60" (rearward sweep) in 15' increments. In the interest of econ- omy, the 60" swept wing was designed to be reversed on the body and was thus tested as the -30' swept wing. Also, the body was designed to allow the wings to be tested at two different longitudinal locations. The exact longitudinal location of each test wing was determined by two factors. The first was the location
of the exposed mean aerodynamic chord of the 60'- swept-wing baseline configuration based on that por- tion of the exposed wing extending from the fuselage side to the wing tip The second factor was the location of the total wing mean aerodynamic chord of the 60' swept wing based on the total wing area, in- cluding that area covered by the body intercept a,t. The moment reference was located longitudinally at 25 percent of Ctot and vertically at the centroid of the fuselage cross section.
The nose contour was designed by using tangent cone theory such that C, = 0 at a = 0'. Thus, the listing of nose droop A 2 is included in table I (fig. 1).
Apparatus and Tests This investigation was conducted in the Langley
20-Inch Mach 6 Tunnel. The tunnel operates on a blowdown cycle through a two-dimensional nozzle with a test section 20.5 in. high and 20 in. wide. Dry air was used for all tests to avoid water con- densation effects, and the air was heated to avoid air liquefaction. Tests were conducted at an average free-stream Mach number of 5.98, a stagnation pres- sure of about 440 psia, and a stagnation temperature of about 870'R. These conditions result in an aver- age free-stream Reynolds number based on fuselage lcngth of about 17.9 x lo6 (7.66 x lo6 per foot, or 4.34 x lo6 based on ?tot) .
A six-component water-cooled strain-gage bal- ance was installed inside the model body and was attached to the tunnel variable-angle sting support system. Forces and moments were measured through an angle-of-attack range of -12' to 10' and at an- gles of sideslip of 0' and 2'. All screw and dowel holes and joints were filled with dental plaster be- fore each test run. Base pressures were measured, and the axial-force component was adjusted to cor- respond to a base pressure equal to the free-stream static pressure. All tests were conducted with natu- ral boundary-layer transition.
Theoretical Methods Theoretical estimates for this study were made
primarily through the use of the Mark I11 Gentry Hypersonic Arbitrary-Body Aerodynamic Program (GHABAP) presented in reference 10. Input to the GHABAP was facilitated by use of the configuration geometry program (GEMPAK) of reference 11. The paneling scheme is presented in figure 4.
All configurations tested and reported herein were input in the GHABAP, and the longitudinal, lat- eral, and directional force and stability characteris- tics were calculated utilizing the tangent-cone pres- sure distribution option on the body and the tangent-
wedge option on the wings (method 1). Other op- tions, such as tangent cone only on the fuselage fore- body and tangent wedge on the wing and body aft of the wing-fuselage junction, were tried (method 2). The Spalding-Chi turbulent-skin-friction method was incorporated into all calculations using an estimated model wall temperature of about 760'R. (See ap- pendix A.) A limiting expansion pressure coefficient of 70 percent vacuum condition (i.e., Cp,limit = -l/M&) was utilized for all calculations. (See ref. 12.) The pressure p , was assumed on body base. The effects of wing leading and trailing edges and body nose bluntness were not included in the general drag-coefficient estimates but are estimated to be only about 0.00049 for the 60' swept wing and 0.00126 for the 0' swept wing.
Results and Discussion Presented in this section are the experimental re-
sults of 14 tests of model configurations, including wing-body tests with seven leading-edge sweep an- gles, six tests with longitudinal wing translation on the body, and one body-alone test. These data are compared for variations with sweep, wing shift, and with hypersonic theory. The effects of wing airfoil geometry on pitching moments are examined, the isolated wing is studied by examining "secondary wing data," and the Hypersonic Isoiation Principle is discussed.
Wing Sweep The complete static longitudinal force and mo-
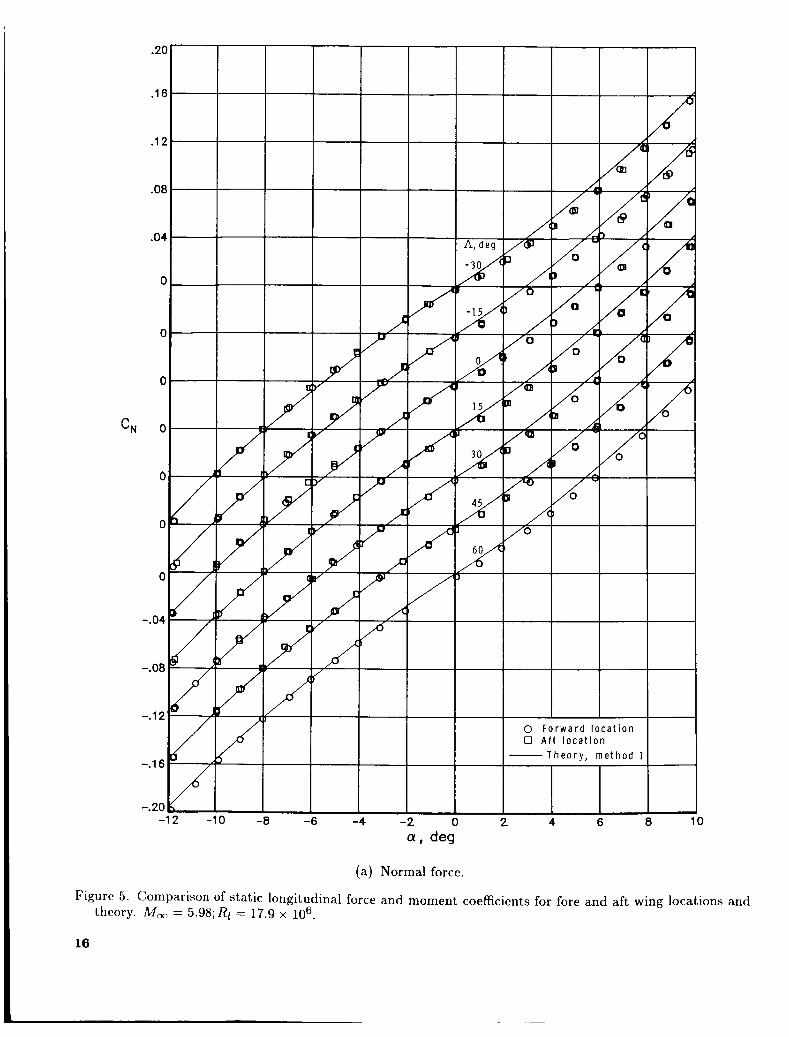
ment data for the wing-body configurations are pre- sented in figure 5 for various leading-edge sweep an- gles (-30' forward sweep to 60' aft sweep). The body was common to all tests and the wings had a common airfoil, aspect ratio, taper ratio, thickness ratio, span, and planform area. (See fig. 1 and ta- ble ii.j Because of the nearly ibeiitica! values of the coefficients, the force data were plotted using slid- ing vertical scales. The pitching-moment data were plotted in customary fashion and are discussed subse- quently. An examination of figures 5(a) to 5(e) shows that the variation of force coefficients with sweep angle was small, considering the range of leading- edge sweep angles investigated, and the theoretical estimates were good to excellent for all configura- tions throughout the angle-of-attack range. The esti- mates of normal and lift forces and the lift-drag ratio showed better agreement with experiment a t nega- tive angles of attack and with higher sweep angles.
Wing leading-edge sweep angle had negligible ef- fects on the longitudinal forces of the wing-body configurations through an angle-of-attack range from
3

- 12" to 10". Excellent correlation between experi- ment and theory was possible for all wing leading- edge sweep angles from -30" to 60" from estimates made by the GHABAP utilizing the tangent-cone and tangent-wedge pressure options on the body and wing, respectively, and a limiting expansion pressure coefficient of cp,lirnit = - I/M&.
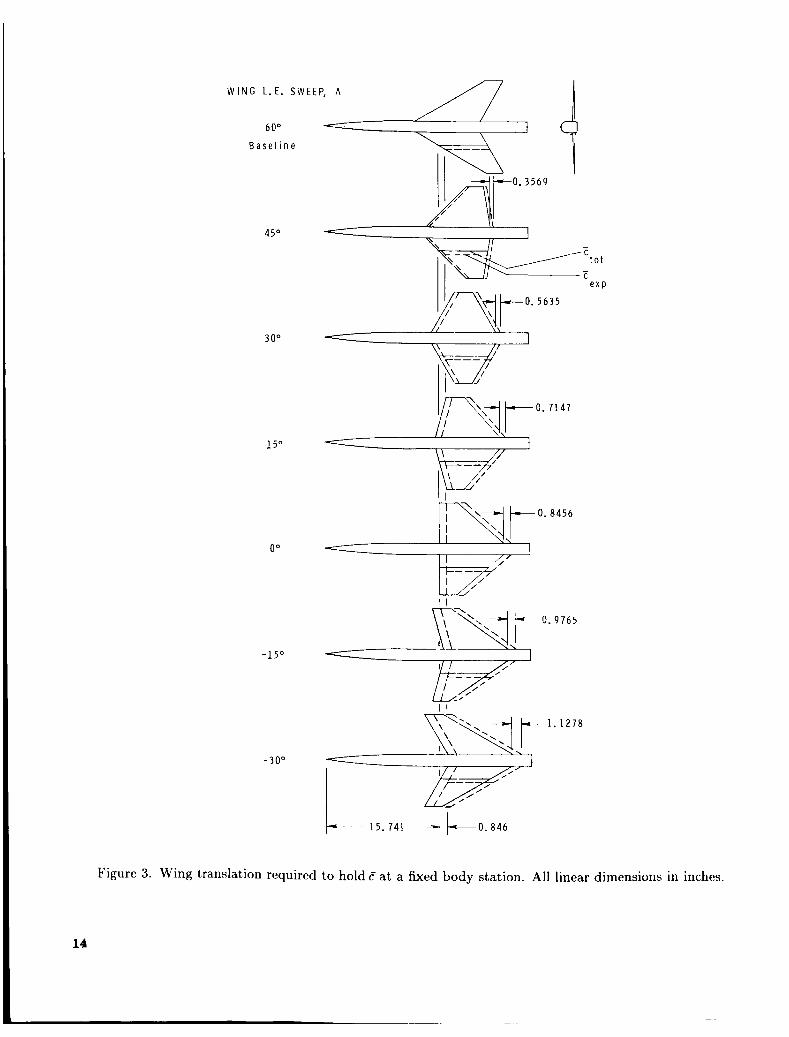
Wing Shift The present paper includes a study of systematic
longitudinal wing translation for each leading-edge sweep angle to first keep the location of the total wing mean aerodynamic chord ?tot and the exposed mean aerodynamic chord Fexp at a common body station. (See fig. 3.) These particular reference body stations or wing locations were selected based on the ?tot and CeXp of the 60°-swept-wing baseline configuration and are designated in figure 5 by symbols. An aft shift of all wings having leading-edge sweep angles less than 60" was required to keep the ?tot and ?exp at the common baseline body stations. (See fig. 3.) An examination of all force coefficients, experimental and calculated, in figures 5(a) to 5(e) shows that there was no effect of the rearward longitudinal shift of the wing. The maximum shift amounted to almost 17 percent &,t for the test with the -30' swept wing. This longitudinal shift of the wing of up to 17 percent ?tot had no effect on the measured or calculated forces of the present wing-body test configurations.
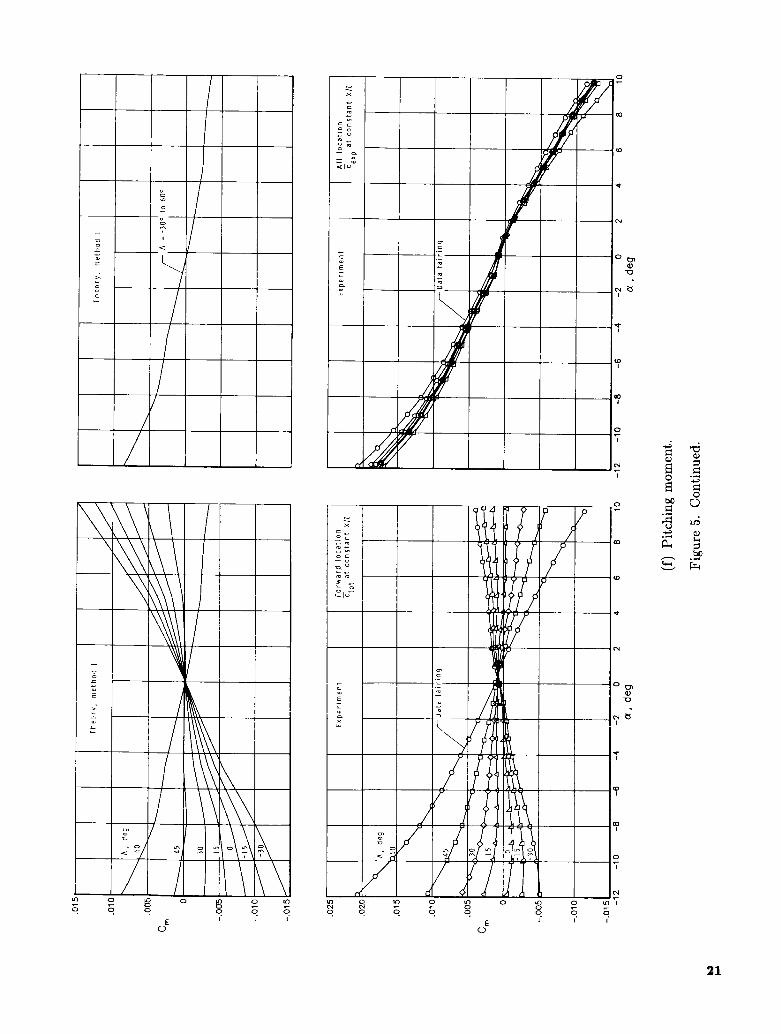
Pitching Moments The pitching-moment coefficients for the vari-
ous wing-body configurations investigated are plot- ted against angle of attack and lift coefficient, re- spectively, in figures 5(f) and 5(g). Experimental data and theory, presented separately for clarity, are shown for the wings in the forward position (i.e., with ?tot at a constant body station) in the left-hand plots of figures 5(f) and 5(g) and for the aft position (Le., with Cexp at a constant body station) in the right- hand plots of figures 5(f) and 5(g). It is particularly important to the present investigation that the ex- perimental and theoretical pitching-moment curves varied with each change in wing sweep angle only when the wing was located longitudinally on the body with ctot at a constant body station. When the wings were located on the body with Cexp at a constant body station, there was little variation of the pitching-moment curves with wing leading-edge sweep. Although thr theory GHABAP underprc- dicted thr pitching moments for all wing swrc'p anglcs trstrd, it correctly predicted the variations of p i t h wi th swwp for the clot tests and verifies the constaiit pitching-morrierit curve with wing sweep for thc ctBxI)
tests. This is illustrative experimentally and theo- retically of the Hypersonic Isolation Principle pro- posed in the Introduction and shows that regardless of sweep angle the exposed wing areas are equally effective in producing pitch. A study of these data shows that the experimental center of pressure on the exposed wing areas was essentially fixed for each angle of attack for the various sweep angles tested at about 0.495CeXp as determined from wing-alone data (the difference between wing-body tests and body-alone tests, referred to herein as LLsecondary experimental wing data"). Theory on the isolated wing predicts the center-of-pressure location to be at about 0.432?,,. This difference between theory and secondary experimental data amounts to about O.O6E,, and is probably caused by a variety of rea- sons, including wing-body interference, inaccuracy in the prediction, distribution of local pressures, unac- counted for tip losses, location of the wing behind the bow shock, and possibly the lack of considera- tion of boundary-layer-induced pressures. Boundary- layer buildup effectively alters the geometry of the aerodynamic surface and therefore the surface pres- sure distribution. This geometry change has not been estimated on the present wings but a study of air- foil thickness ratio is given in appendix B. Isolated wing tests would be necessary to adequately address this difference between theory and experiment. The scatter of the experimental data with sweep angle in the right-hand plots of figures 5(f) and 5(g) was at- tributed to either small changes in pitching moment due to wing sweep or mutual wing-body interference that may also vary with sweep or both. Such scatter was not shown in the longitudinal force coefficients, as discussed previously, but was evident in the direc- tional stability data that is discussed subsequently. The GHABAP estimates therefore provide low and inadequate estimates of the magnitude of the pitch- ing moments of the wing-body test configurations for all wing sweeps and wing locations.
6O0-Swept-Wing Baseline Configuration A comparison of GHABAP methods 1 and 2
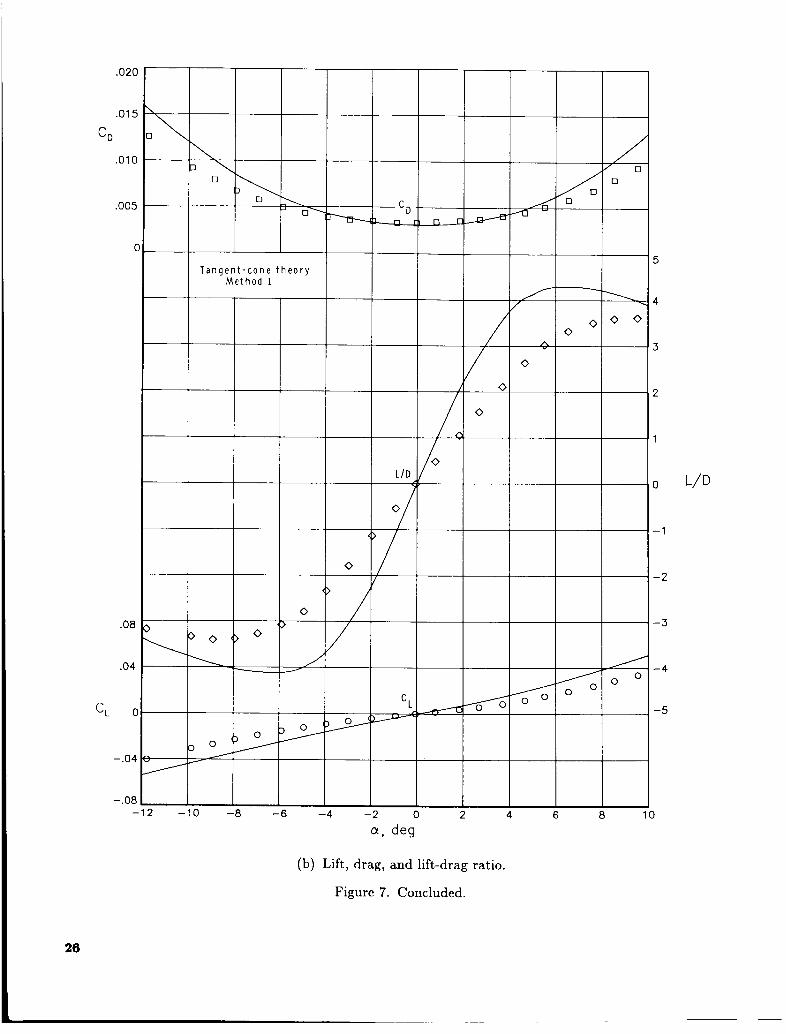
of predicting the static longitudinal aerodynamics of the 60°-swept-wing baseline configuration is pre- sented in figure 6. Using method 1 (tangent-cone pressure distribution option on the fuselage and tangent,-wedge option on the wings), good to ex- cellent predictions of normal, axial, lift, and drag forces and lift-drag ratio were obtained throughout the angle-of-attack range. Slightly better predictions were observed at negative angles of attack, particu- larly for the lift and the lift-drag ratio. Predictions of forces and of the lift-drag ratio for the body alone (fig. 7) are only fair and show the Same trends as
4
1 1
I 1 ' i
those for the complete model. (See fig. 6.) That is, normal force, lift, and lift-drag ratio were overpre- dicted. Satisfactory predictions of pitching moments were, however, realized for the body alone. The body nose contour was designed using tangent-cone the- ory to provide zero normal force at a = O', and this was realized experimentally on the body alone. I t is not understood why, for the wing-body configura- tion (complete model, fig. 6), the normal force was not zero at a = O', as the symmetrical sectioned wing was installed parallel to the longitudinal refer- ence axis. Without wing-alone data, there can be no certainty, but the differences between the complete- model data and the theory were probably due in part to wing-body interference and poor fuselage predic- tions rather than the predicted wing increments.
Predictions of the 60' body-wing pitching mo- ments left much to be desired. Underestimations for the complete model (fig. 6) amounted to a center- of-pressure shift of almost 0.0s. To investigate this variation, a somewhat unrealistic pressure distribu- tion scheme was programmed. This scheme con- sisted of applying the tangent-cone option only on the body forward of the wing-fuselage junction and the
(method 2). The results of this calculation are shown in figure 6 by dashed lines. There is a marked im- provement in the predictions of the pitching IIicmeOt,
forces. It may be inferred from this comparison that the selection of the computer program pressure dis- tribution option was a partial cause of the pitching- moment underprediction and that the selection of the model component on which to apply a particular pressure option is of equal importance. Although the
provide satisfactory pitching-moment predictions for the 60°-swept-wing wing-body baseline configuration (fig. 6): satisfactory predictions were obtained for the body-alone configuration (fig. 7).
'
I
1
,
l
I tangent-wedge option on the aft fuselage and wing
~
I but there is an accompanying overprediction of all
I
1 I present methods of analysis by the GHABAP do not
Wing-Body Interference Deduced From Sec- I ondary Wing Data
As previously mentioned, the determination of mutual wing-body aerodynamic interference would ideally be made through the use of at least three sets of experimental data, the wing-body combina- tion tests, and the wing and body tested separately. The present study included the wing-body and body- alone tests, but no wing-alone tests; therefore, the secondary wing data (difference between the wing- body experimental data and the body-alone data) were used in place of the ideal wing-alone data. These secondary wing data contain, in addition to
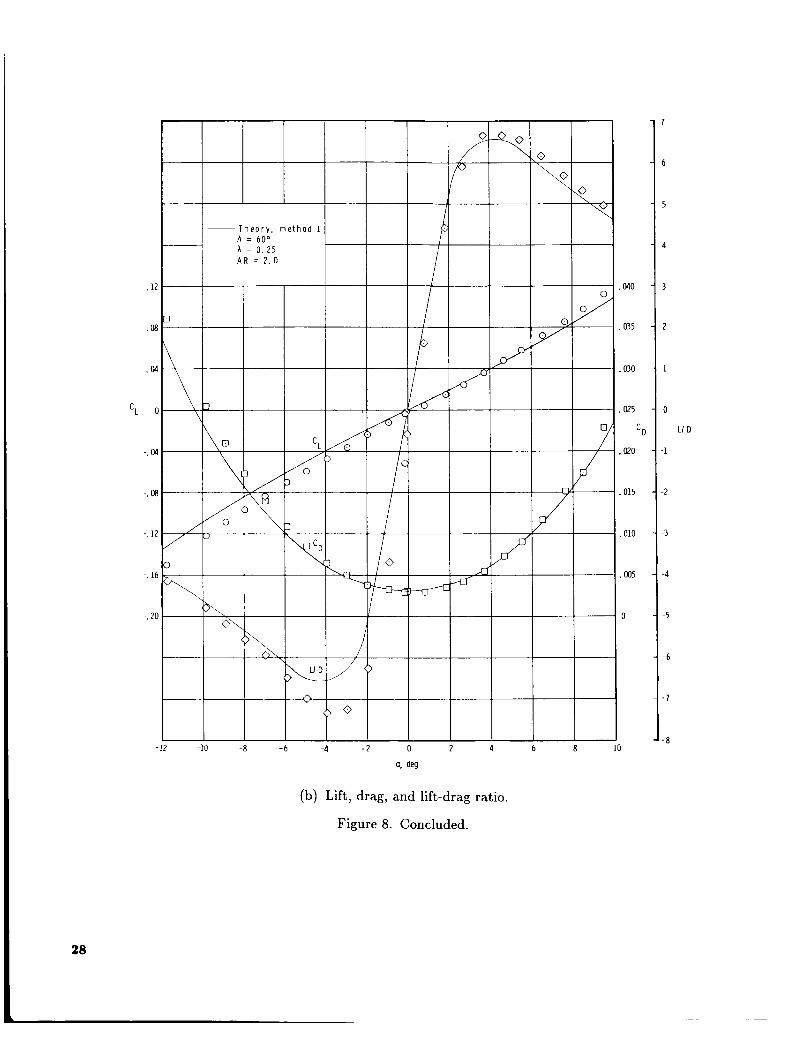
the basic desired wing forces and moments, an un- known degree of mutual wing-body interference and a variation in magnitude due to the location of the wings. It was determined from schlieren photographs that 72 to 86 percent of exposed wing (A = -30° and 60') was located behind the body nose shock, where variations in local dynamic pressure and flow angularity from the free-stream conditions would be expected to exist, particularly at angle of attack. With these known possible limitations, the results of subtracting the body-alone data from the wing- body data are presented in figure 8 and are com- pared with tangent-wedge calculations made using the GHABAP. Figure 8(a) shows that, at a posi- tive value of a, the secondary wing axial-force co- efficients were overestimated and that the normal- force and pitching-moment coefficients were underes- timated at all angles of attack. It has been previously pointed out that the wing-body (fig. 6) and body- alone (fig. 7) normal-force coefficients were overesti- mated, and, inasmuch as the present wing calcula- tions did not account for tip losses, it was to be ex- pected that the normal force would be overpredicted (refs. 7 and 13). However, figure 8 shows the normal- force coefficient to be underpredicted. It is therefore reasonable to assume that the secondary data of fig- ure 8 were probably altered by mutual wing-body interference, which includes the effects of the region of variable dynamic pressure downstream of the nose shock.
In all instances, the normal-force coefficients were overestimated for a variety of wings at Mm = 6.9, particularly without tip correction. (See ref. 13.) Wing-alone data at Moo = 4.6 (ref. 7) made pos- sible the comparison that is shown in the inset of figure 8(a). Shown in the inset are the center-of- pressure locations and the normal-force coefficients for a series of AR = 2 wings of varying taper ra- tio A. These wings did not have the constant thick- ness ratio of the prescnt test wings, but the range of taper ratios tested straddled the present taper ra- tio ot U.25. As expected, taiigent wedge ca!cu!ations of these isolated wings show an overestimation of the normal-force coefficients. Interpolation of these Mm = 4.6 data for X = 0.25 indicated a differ- ence between the measured and calculated center-of- pressure locations of < 0.01c. The difference between the secondary wing data and the calculated values of Moo = 6.0 were of the order of 0.04. The cen- troid of the wing is located downstream of the con- figuration moment center, and any increase in local wing pressures, whether due to body interference or wing location behind the semiconical nose shock, in- creases the nose-down or negative pitching moment. The present theory does not take these factors into
5
account. It may be concluded that the low predictions of normal-force and pitching-moment coefficients for the secondary wing data were due in part to mutual wing-body interference and in part to the wing loca- tion in the variable dynamic pressure region down- stream of the body nose shock.
Static Lateral-Directional Stability The variations of the lateral-directional stability
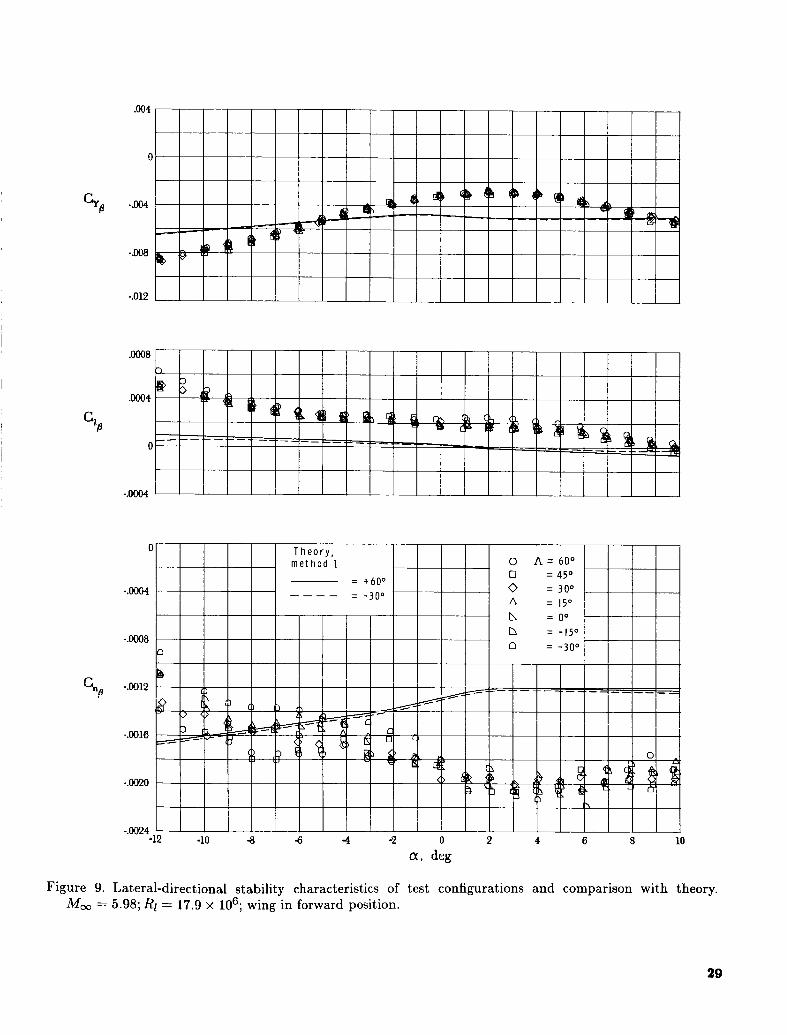
of the wing-body configuration with wing leading- edge sweep are presented in figure 9, along with theoretical estimates made using the GHABAP. The experimental data were derived from the difference between measurements at 0” and 2’ sideslip divided by 2’ to obtain the slope of each component per degree. Tests were made only with the wing in the forward position.
It is shown in figure 9 that the side forces and the rolling moments were relatively insensitive to wing sweep when compared with the directional stability, which shows considerable sensitivity. All configura- tions are shown to be directionally unstable (-Cna), as might be expected for a configuration with no ver- tical surfaces, and to have negative dihedral effect (+Cl,) throughout the angle-of-attack range. The variation of experimental directional stability with angle of attack was greatest for the -30°-swept-wing model and smallest for the 60°-swept-wing model. The theoretical estimates of the lateral-directional characteristics left much to be desired. The trends with angle of attack were approximated for the side force and rolling moments, but the methods pre- dicted an opposite trend for the directional stability. The difference between theory and experiment was so great that the use of the theory, for any but the most preliminary of estimates, could not be recommended. The addition of vertical stabilizing surfaces would be expected to not only increase the directional stabil- ity but also decrease the negative dihedral effects. It may be concluded that the GHABAP is not satisfac- tory for estimating lateral-directional stability.
Hypersonic Isolation Principle As stated in the Introduction, an assessment of
the Hypersonic Isolation Principle was one of the ob- jectives of the present study. This objective was ac- complished when the theory and experimental data showed negligible changes of longitudinal and lateral forces with wide variations of wing sweep and mod- erate wing translation. (See sections entitled “Wing Sweep” and “Wing Shift”.) Further realization of the validity of the Hypersonic Isolation Principle was ap- parent when nearly constant pitching-moment curves wcre observcd with wing sweep angle when the c , , ~
and, hence the exposed-wing centroid of area, was held fixed at a constant body station. This constant pitching moment with wing sweep was predicted by the hypersonic impact type theory of the GHABAP, but the magnitudes of the pitching moments were underpredicted, as previously discussed. A more rig- orous assessment was not possible because of the body nose shock interference effects on all test wings at all angles of attack. The area of the wing en- closed behind the shock varied for each sweep angle, and this difference contributed to the scatter in the pitching-moment data shown on the right-hand side of figures 5(f) and 5(g), as discussed in the pitching- moment and wing-body interference sections. Al- though the body nose shock effects on the wing pres- sure distributions may be considered an interference effect, the interactions of body flow field and the wing flow field are yet to be sorted out experimentally. A proper assessment must await isolated wing tests and wing-body tests with the wing entirely downstream of the body nose shock.
Conclusions An analysis of experimental data for a wing-body
configuration and components with interchangeable variable sweep and longitudinally translatable wings at a free-stream Mach number of about 6 and a free- stream Reynolds number (based on body length) of 17.9 x lo6 leads to the following conclusions:
1. Good to excellent predictions of longitudinal forces (normal, axial, lift, and drag) and lift-drag ratio were obtained throughout the angle-of-attack range on all wing-body configurations tested by uti- lizing the tangent-cone theory on the body and the tangent-wedge theory on the wings, and by limiting the expansion pressure coefficient to 70 percent vac- uum conditions.
2. Unsatisfactory predictions of the magnitude of the pitching-moment coefficients were obtained on all the wing-body configurations tested with the simpli- fied tangent-coneltangent-wedge analysis procedure provided by the Gentry Hypersonic Arbitrary-Body Aerodynamic Program (GHABAP). This is the re- sult of the program not accounting for mutual wing- body interference, for wing tip losses, for the par- tial location of the wings in the region behind the bow shock where variations in local dynamic pres- sure may be expected, and for the lack of consider- ation of turbulent-boundary-layer induced pressures. For these reasons, higher than expected values of ex- perimental normal force and pitching moment were exhibited by the secondary wing data (the differ- ence between wing-body and body-alone experimen- tal data).
6
3. Fair predictions of aerodynamic forces and lift- drag ratio and good predictions of pitching moments were obtained on the body alone by utilizing the tangent-cone theory and limited expansion pressure coefficients in the GHABAP.
4. Analytic studies showed that for Mach num- bers above about 2, the center of pressure of a soli- tary wing is primarily a function of thickness ratio and secondarily a function of airfoil section, sweep, taper ratio, Mach number, and angle of attack. Any increase in thickness ratio of the present wedge-slab- wedge wing airfoil would have had a destabilizing ef- fect on the complete configuration.
5. The hypersonic impact methods, as utilized by the GHABAP, are not satisfactory for estimating lateral-directional stability.
6. The variations of the experimental longitudi- nal force coefficients with leading-edge sweep or wing shift were small, and there were no variations of
the calculated force coefficients with either geometric change.
7. Only the exposed wing (wetted area) was ef- fective in producing aerodynamic forces and pitching moments at hypersonic speeds, and the mean aero- dynamic chord of the exposed wing should be used as the design reference.
8. The “Hypersonic Isolation Principle” was ver- ified experimentally by showing the independence of the longitudinal and lateral forces and pitching mo- ments from wing leading-edge sweep variations when the exposed wing mean aerodynamic chords, hence the exposed wing centroids of area, were located at a fixed body station.
NASA Langley Research Center Hampton, VA 23665 April 23, 1985
7
Appendix A Spalding-Chi Turbulent Skin Friction
The semiempirical procedure for the calculation of turbulent skin friction by Spalding and Chi has been shown to provide very good agreement with experiment for adiabatic wall conditions (ref. 14). The model wall temperatures of the present tests were estimated to be about 760"R, and the tun- nel stagnation temperature was about 870"R. These conditions resulted in a wall-to-stagnation tempera- ture ratio of 0.874; this ratio is not greatly differ- ent from the generally accepted adiabatic value of 0.89. The Spalding-Chi method was therefore not only the method of choice but was also available as an option in the GHABAP. A plot of the variations of the average Spalding-Chi turbulent-skin-friction co- efficients with wall-to-stagnation temperature ratio and Reynolds number are presented in the upper part of figure 10 for M = 6. The variations with Mach number and Reynolds number for the adiabatic wall-
to-stagnation temperature ratio of 0.89 are shown in the lower part of figure 10. Plotted on these fig- ures are the Reynolds numbers, based on various di- mensions of the test model, which vary from about 1.55 x IO6 for the wing tip to 17.9 x lo6 for the body. This wide range of Reynolds numbers may well have encompassed laminar flow at the lower val- ues and a high percentage of turbulent flow at the higher values of Reynolds number and an unknown percentage of transitional flow on both wings and body. Although the assumption of all turbulent skin friction gave good estimates of drag and lift-drag ra- tio on the present wing-body configuration, it is more likely that there were regions of laminar, transitional, and turbulent skin friction on the model and that the experimental average was approximately equal to the estimated turbulent values. Reference 15 is suggested for additional charted values of Spalding- Chi skin friction for other Mach numbers and wall- to-stagnation temperature ratios.
8
Appendix B Effects of Wing Airfoil Geometry on Pitching Moments
To gain a better understanding of the effects of component geometry on lift and pitching moments a study was instigated to determine the effects of varia- tions of wing airfoil thickness ratio on the estimated pitching moments. This study consisted of making two-dimensional inviscid calculations on a series of wedge-slab-wedge airfoils having thickness ratios of 0 percent to 10 percent chord at cr = 3' at M = 6. The results of the study are presented in figure 11 and show a destabilizing shift of the center of pres- sure with thickness ratio from the 50 percent chord location for the 0 percent thick airfoil to about the 31 percent chord location for the 10 percent thick wing. These estimates were verified at Mach num- bers up to 5 by charts in reference 1, which also showed a stabilizing effect of angle of attack. This forward destabilizing shift in center of pressure with increasing thickness ratio is readily understood when consideration is given to the increased pressures on
the forward-wedge compression surface of the airfoil and the decreased pressures on the rear-wedge expan- sion surface. The stabilizing effect of angle of attack is due to an increase in pressure on the rear-wedge surface with angle of attack. At very high angles of attack (a x 90') this increase in pressure results in a center-of-pressure shift rearward to the 50 percent chord location. In addition to the center-of-pressure shift, increased increments of normal and axial force were obtained which also contribute to the longitudi- nal stability of the present wing-body configuration. This increased stability is the result of the moment reference location being ahead of the wing center of pressure and above the wing chordline. For Mach numbers above about 2, it may be concluded that hypersonic theory predicts that the center of pres- sure of a solitary wing with a sharp leading edge is primarily a function of the thickness ratio and sec- ondarily a function of angle of attack, airfoil section, sweep, Mach number, and taper ratio. Also, any in- crease in wing thickness ratio of a wedge-slab-wedge airfoil would have a destabilizing effect on the overall configuration longitudinal stability.
9

References 1. USAF Stability and Control Datcom. Contracts
AF33(616)-6460 and F33615-76-C-3061, McDonnell Douglas Corp., Oct. 1960. (Rev. Apr. 1978.) Hill, William A , , Jr.: Ezperimental Lift of Low-Aspect- Ratio Triangular Wings at Large Angles of Attack and Supersonic Speeds. NACA RM A57117, 1957. Falunin, M. P.; Ul’Yanov, G. S.; Makshin, A. A,; and Mosin, A. F.: Supersonic Aerodynamic Characteristics of Delta Wings at High Angles of Attack. Fluid Dyn., vol. 3, no. 5, Sept.-Oct. 1968, pp. 105-108.
4. Baker, William B., Jr.: Static Aerodynamic Characteris- tics of a Series of Generalized Slender Bodies With and Without Fins at Mach Numbers From 0.6 to 3.0 and A n - gles of Attack From 0 to 180 Deg., Volume I . AEDC-TR- 75-124 (Revised), U.S. Air Force, May 1976.
5. Kaattari, George E.: Pressure Distributions on Trian- gular and Rectangular Wings to High Angles of Attack - Mach Numbers 2.46 and 3.36. NACA RM A54J12, 1955. Dunning, Robert W.; and Ulmann, Edward F.: Eflects of Sweep and Angle of Attack on Boundary-Layer Dansit ion o n Wings at Mach Number 4.04. NACA TN 3473, 1955. Stallings, Robert L., J r . ; and Lamb, Milton: Wing-Alone Aerodynamic Characteristics f o r High Angles of Attack at Supersonic Speeds. NASA TP-1889, 1981. Ulmann, Edward F.; and Bertram, Mitchel H.: Aerody- namic Characteristics of Low-Aspect-Ratio Wings at High Supersonic Mach Numbers. NACA RM L53123, 1953.
2.
3.
6.
7.
8.
9. Bertram, Mitchel H.; and McCauley, William D.: An Investigation of the Aerodynamic Characteristics of Thin Delta Wings Wi th a Symmetrical Double- Wedge Section at a Mach Number of 6.9. NACA RM L55B14, 1955.
Hypersonic Arbitrary-Body Aerody- namic Computer Program (Mark III Version). Vol- ume I-User’s Manual. Rep. DAG 61552, Vol. I (Air Force Contract Nos. F33615 67 C 1008 and F33615 67 C 1602), McDonnell Douglas Corp., Apr. 1968. (Available from DTIC as AD 851 811.)
11. Stack, Sharon H.; Edwards, Clyde L. W.; and Small, William J.: GEMPAK: A n Arbitrary Aircraft Geometry Generator. NASA TP-1022, 1977.
12. Mayer, John P.: A Limit Pressure Coeficient and a n Es- timation of Limit Forces on Airfoils at Supersonic Speeds. NACA RM L8F23, 1948.
13. Penland, Jim A,: Mazimum Lift-Drag-Ratio Characteris- tics of Rectangular and Delta Wings at Mach 6.9. NASA TN D-2925, 1965.
14. Komar, J . J.: Improved Turbulent Skin-Friction Coefi- cient Predictions Utilizing the Spalding-Chi Method. Rep. DAC-59801, Missile & Space Syst. Div., Douglas Air- craft Go., Inc., Nov. 1966.
15. Neal, Luther, Jr.; and Bertram, Mitchel H.: Tbrbulent- Skin-Friction and Heat- Transfer Charts Adapted From the Spalding and Chi Method. NASA TN D-3969, 1967.
10. Gentry, Arvel E.:
10
X, in. 0.0000
.5688 1.1376 1.7064 2.2752 3.4128 4.5504 5.6880 6.8256 7.9632 9.1008
10.2384 11.3760
h, in. 0.0000
.3524
.5813
.7723
.9388 1.2191 1.4454 1.6279 1.7724 1.8821 1.9591 2.0048 2.0200
TABLE I. NOSE DIMENSIONS
[Reference fig. 11
AZ, in. 0.3000
.2477
.2137
.1a53
.1606
.1189
.0853
.0582
.0368
.0205
.0090
.0023
.oooo
r l , in. 0.0000
.1336
.2203
.2927
.3558
.4620
.5478
.6170
.6718
.7133
.7425
.7599
.7656
r2, in. 0.0000
.0354
.0584
.0776
.0944
.1225
.1453
.1636
.1781
.1891
.1969
.2015
.203 1
TABLE 11. TYPICAL WING GEOMETRY
Span, in. . . . . . . . . . . . . . . . . Planform area, in2 . . . . . . . . . . . . Aspect ratio . . . . . . . . . . . . . . . Taper ratio . . . . . . . . . . . . . . . Thickness ratio . . . . . . . . . . . . . Centerline root chord, in. . . . . . . . . . Exposed root chord, in. . . . . . . . . . . Tip chord, in. . . . . . . . . . . . . . .
12.6 76.38
2.0 0.25 0.03
9.699 8.815 2.425
11
\o 0 0
0
c L m ._ W .K
m .
N v3 a M
+
f --t
m 0
I
N 19-- --
I
0 Q
--yr
c
t I , m
4
c
X I
12
1
0 0 m I
E-l d M d 5
2
.A
0 m rl
I 0 U
0 m *
13
W I N G L.E. S W E
60°
B a s e l i n e
450
3 Oo
1 5 "
00
-15'
- 3 O O
Ii
0 . 9 7 6 5
1 2 7 8
I- 15. 741-4 L O . 8 4 6
Figure 3. Wing translation required to hold C a t a fixed body station. All linear dimensions in inches.
14

15
3
Q L , deg
(a) Normal force.
Figure 5. Comparison of static longitudinal force and moment coefficients for fore and aft wing locations and thcory. M , = 5.98;Rl = 17.9 x lo6.
16
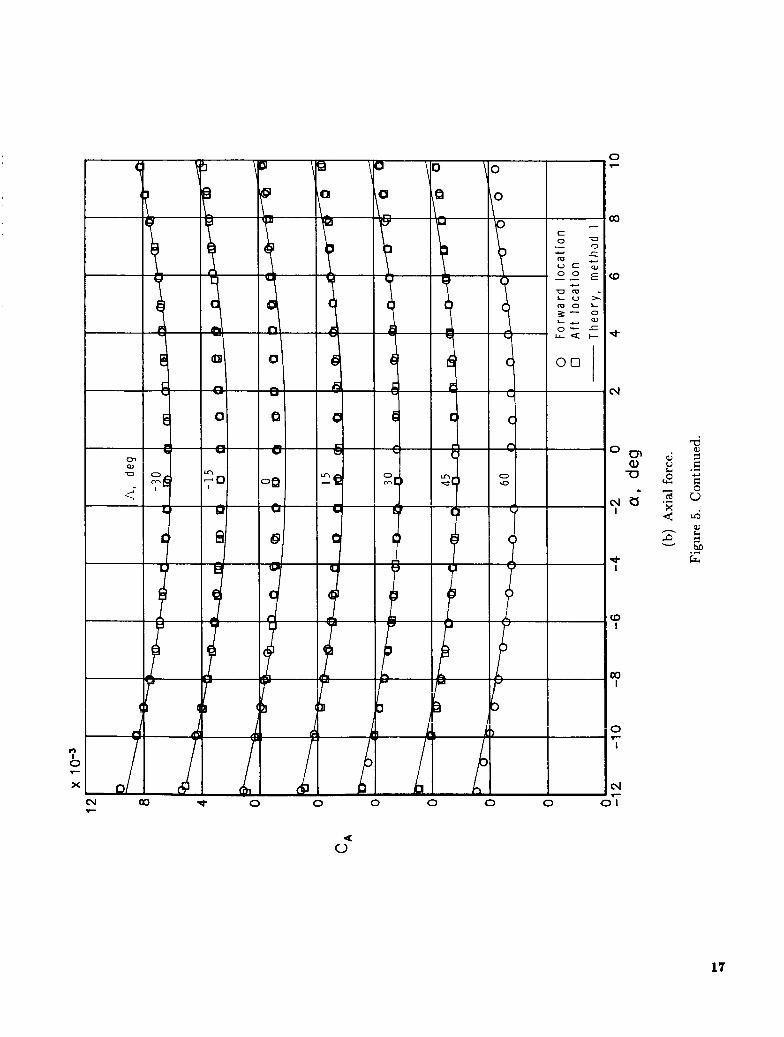
c\1 0 0 0 0 0 0 0 1 .-
17

18
a, deg
(c) Lift.
Figure 5. Continued.
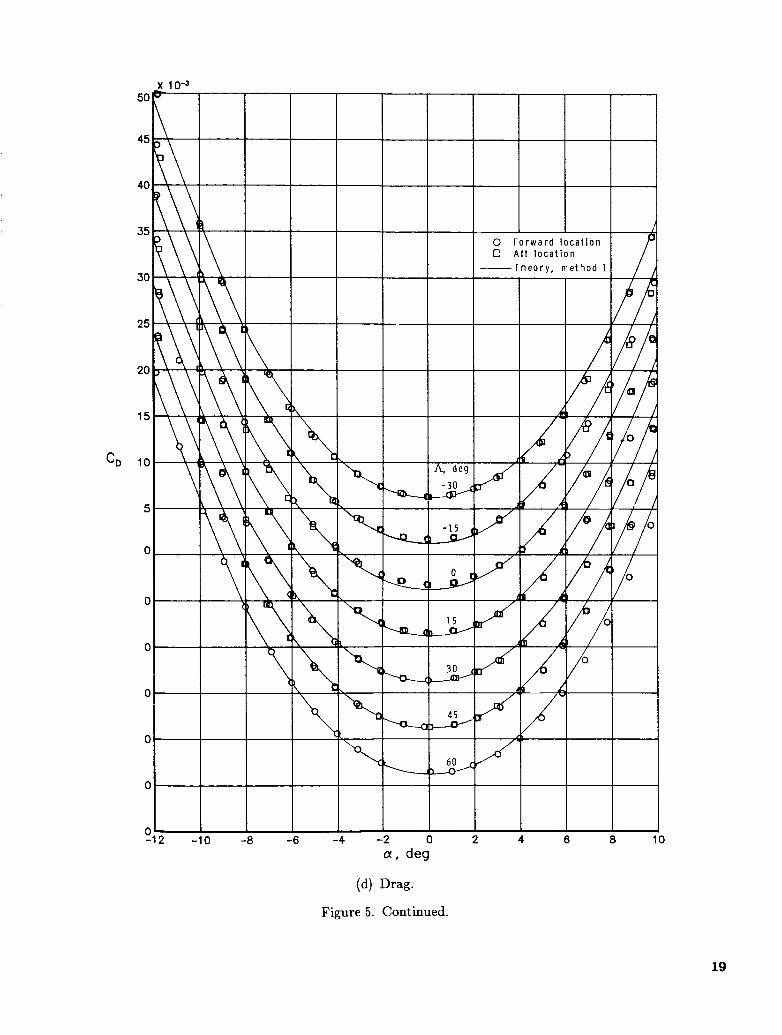
(d) Drag.
Figure 5. Continued.
0
19

20
0 -8 -6 -4 -2 0 2 4 6 a a. deg
(e) Lift-drag ratio.
Figure 5. Continued.
21

G

.012
.008
c A
,004
0
.20
.16
.12
.08
.04
C
CN -.04
-.oa
-.12
.,. - . I C
-.2c
-.24
M e t h o d 1 t a n c o n e b o d y , t a n w e d g e w i n g
M e t h o d 2 t a n c o n e f o r e b o d y , t a n w e d g e a f t e r b o d y a n d w i n g
I I I
-12 -10 -8 -6 -4 -2 0 2 4 6 8 10
a , deg
(a) Normal force, axial force, and pitching moment.
Figure 6. Comparison of methods of predicting static longitudinal aerodynamics of 60"swept-wing bzseline configuration. Moo = 5.98; Rl = 17.9 x lo6.
23

.20
.16
.12
.08
.04
CL c
-.04
-.08
-.12
-.16
-.20 -
24
Method 1
Method 2 _ _ _ _ _
(b) Lift, drag, and lift-drag ratio.
Figure 6. Concluded.
2
1
0 L/D
-1
-2
-3
-4
-5
-6

.008
c, .004
C
.08
.04
CN (
-.Oi
-.Of
(a) Normal force, axial force, and pitching moment.
Figure 7. Comparison of static longitudinal force and moment coefficients of the body alone with theory. M , = 5.98; R1 = 17.9 x IO6.
25
.020
.015
,010
.005
C
.08
.04
CL 0
-.04
-.08 -1
4 d 0
-5
- 0
0
/ o o
6 8
4 0
L 0 '
1
3 L/D
-1
-2
-3
- 4
-5
(b) Lift, drag, and lift-drag ratio.
Figure 7. Concluded.
26

.ox
CA ,001
I
. 1;
. o
. D
‘N 1
-. 0
-. 0
-. 1
-. 1
-. 2
0
0 n -. 020 0
3 0 , o
0 ,’ I ) 0 I I o:\v:: : 3
0
-. 035 0
MO
Figure 8. Comparison of static longitudinal force and pitching-moment coefficients of secondary wing-alone data and theory. Moo = 5.98; R1 = 17.9 x lo6.
27
MO
03 5
030
025
c D
020
015
010
w5
0
7
6
5
4
3
2
1
0
LI D
-1
-2
-3
-4
-5
-6
-1
-8
28
(b) Lift, drag, and lift-drag ratio.
Figure 8. Concluded.
.004
0
-.w
-.m
-.012
Figure 9. Lateral-directional stability characteristics of test configurations and comparison with theory. Ma = 5.98; Ri = 17.9 x lo6; wing in forward position.
29

,0015 A- / : -
t t
. 0 0 1 t
. o o o 9 r
C F I , 0 0 0 8 j
I I
T
- - - - -,
R P y n o l d r n u r n b p r x 10.'
Figure 10. Spalding-Chi average turbulent skin friction on one side of flat plate.
so

xcp
. 0 5
CN -04-
. 0 3
C
I I I 1 I I I I
/--
I I I I I I I I
. 5 0
. 3 0 -
2 0 1 . I I I I 1 I I
. 2 . 4 . 6 t l c
. 8 1.0
Figure 11. Two-dimensional inviscid aerodynamics on wedge-slab-wedge airfoils of varying thickness ratios. CY = 3'; M , = 6.
31
Standard Bibliographic Page
1. Report No. NASA TP-2467
2. Government Accession No. 3. Recipient’s Catalog No.
4. Title and Subtitle Aerodynamic Characteristics of a Distinct Wing-Body Configuration at Mach 6 - Experiment, Theory, and the Hypersonic Isolation Principle
Jim A. Penland and James L. Pittman 7. Author(s)
9. Performing Organization Name and Address NASA Langley Research Center Hampton, VA 23665
5. Report Date
August 1985 6. Performing Organization Code
- 505-43-83-01 8. Performing Organization Report No.
L- 15951 -
10. Work Unit No.
11. Contract or Grant No.
13. Type of Report and Period Covered 12. Sponsoring Agency Name and Address National Aeronautics and Space Administration Technical Paper Washington, DC 20546 14. Sponsoring Agency Code
15. Supplementary Notes
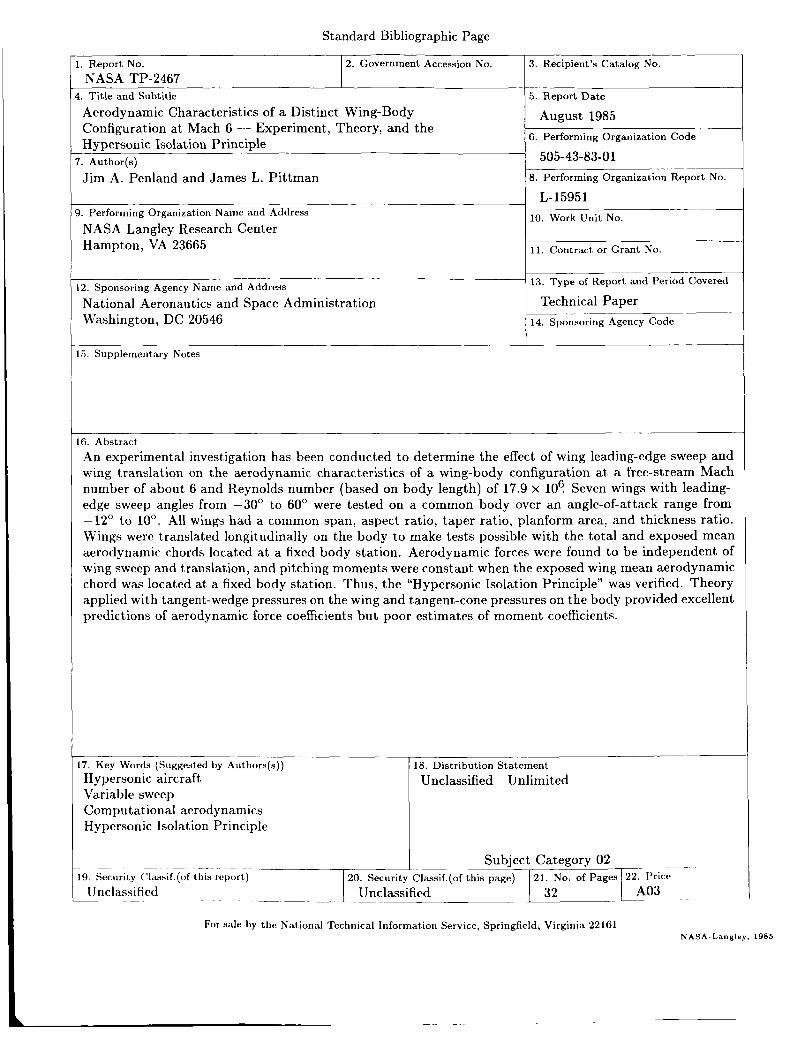
16. Abstract An experimental investigation has been conducted to determine the effect of wing leading-edge sweep and wing translation on the aerodynamic characteristics of a wing-body configuration at a free-stream Mach number of about 6 and Reynolds number (based on body length) of 17.9 x 10⁶ Seven wings with leading- edge sweep angles from -30’ to 60’ were tested on a common body over an angle-of-attack range from - 1 2 O to 10’. All wings had a common span, aspect ratio, taper ratio, planform area, and thickness ratio. Wings were translated longitudinally on the body to make tests possible with the total and exposed mean aerodynamic chords located at a fixed body station. Aerodynamic forces were found to be independent of wing sweep and translation, and pitching moments were constant when the exposed wing mean aerodynamic chord was located at a fixed body station. Thus, the “Hypersonic Isolation Principle” was verified. Theory applied with tangent-wedge pressures on the wing and tangent-cone pressures on the body provided excellent predictions of aerodynamic force coefficients but poor estimates of moment coefficients.
17. Key Words (Suggested by Authors(s)) Hypersonic aircraft Variable sweep Computational aerodynamics Hypersonic Isolation Principle
18. Distribution Statement Unclassified-lj-nlimited
Subject Category 02 -~ ~
20. Security Classif.(of this page) 21. No. of Pages 22. Price A03 -~ U nc lass ifird - Unclassified 32
For sale t)y thc National Technical Information Service, Springfield, Virginia 22161 NASA-Langley . 1985