i o m e trics Journal of Biometrics & Biostatistics
13
Volume 8 • Issue 2 • 1000344 J Biom Biostat, an open access journal ISSN: 2155-6180 Research Article Kaewbumrung et al., J Biom Biostat 2017, 8:2 DOI: 10.4172/2155-6180.1000344 Research Article Open Access Journal of Biometrics & Biostatistics J o u r n a l o f B i o m e t r i c s & B i o s t a t i s t i c s ISSN: 2155-6180 Keywords: Mathematical model; Numerical simulation; Finite element method; Cardiovascular disease; Coronary arteries Introduction Coronary artery disease (CAD), one of the major causes of death worldwide, is characterized by atherosclerosis in the leſt and right coronary arteries in which atherosclerotic plaques reduce the space of the lumen of the coronary arteries. It is believed that the notable elements at the early states of coronary heart diseases are associated with critical flow conditions resulting from arterial stenosis. ese flow conditions are flow segregation, high wall shear stress and wall densification. Over the last few decades, development of surgical treatments for cardiovascular diseases has been done constantly. e best treatment for an individual patient is usually determined based on the underlying problems, where and how severe the patient’s blockages are, and the future risks. For instance, medications such as calcium channel blockers, beta blockers, nitrates, aspirin, or cholesterol-lowering drugs (statins), when atherosclerosis is identified at an early stage, may be prescribed to ease its symptoms. For patients with severe stenosis, a common treatment for the blocked arteries is by the use of a coronary artery bypass graſting (CABG) where a new path for blood to flow around (bypass) the blockage in the artery is created. For some patients, minimal invasive coronary artery surgery such as coronary balloon angioplasty and stenting is an alternative to the CABG surgery. Although a substantial number of saphenous-vein bypass graſts are implanted globally annually, 25% of the bypass graſts collapse within a year and up to 50% fail within a decade aſter surgery. ese indicate that existing treatments are still inappropriate for the cardiovascular disease. Currently, it has been confessed that one of the most significant detection in a successful bypass operation is the information of the rheological manner of human blood, the pressure distribution, the flow rate and the wall shear stress in the stenosis artery which is deformed in a cardiac cycles of a heart pump. A significant number of in-vivo and vitro experimental models have been conducted in order to comprehend the pathogenesis of coronary artery diseases. In the work of Pijlss team [1], a theoretical model for the coronary circulation was developed, a set of equations to determine relative maximum flow of both the myocardium and the epicardial coronary artery was derived, and the animal model in which five dogs were thoroughly instrumented with an epicardial coronary Doppler transducer. e results showed that the method had potential applications for making a difference in the functional severity or degree of coronary artery stenoses and for evaluating collateral flow that is feasible during coronary occlusion. Jie et al. [2] developed a vitro experiment using a curved stenosis hydrogel model to approximate the coronary disease situation. e flow experiment was performed to inspect the relationship between the fluid flow and the malformation of stenosis in the coronary arteries. Tiari et al. [3] proposed an experimental model to measure the pressure drop in an elastic tube with mechanical characteristics comparable to a coronary artery with single and double stenosis. e degree of stenosis was elevated in seven steps. e results indicated that an increase of stenosis severity led to moderate increase in pressure drop. Zafar et al. [4] measured the blood flow rate and velocity in coronary artery stenosis using intracoronary frequency domain optical coherence tomography (FDOCT), and validated against the fractional flow reverse (FFR). ey found that the FD-OCT is a helpful tool in the assessment of CAD. Due to difficulties in establishing the conditions of the critical flow for the in-vivo and vitro experimental models, the dynamical mechanism underlying is not as well understood accurately. On the other side, mathematical models and numerical simulations can conduct to better understanding of the circumstance involved in the pathogenesis of the CAD. us, over the last few decades, a great number of mathematical models and numerical techniques have been proposed to analyze the rheological manner of blood in the small vessels subjected to the assumption that blood behaves as an incompressible Newtonian fluid. *Corresponding author: Wiwatanapataphee B, Department of Mathematics & Statistics, Curtin University of Technology, Perth, WA 6845, Australia, Tel: 618 9266 2405; E-mail: [email protected] Received April 20, 2017; Accepted April 25, 2017; Published April 28, 2017 Citation: Kaewbumrung M, Wiwatanapataphee B, Orankitjaroen S, Siriapisith T (2017) Numerical Simulation of Turbulent Blood Flow in the System of Coronary Arteries with Stenosis. J Biom Biostat 8: 344. doi: 10.4172/2155-6180.1000344 Copyright: © 2017 Kaewbumrung M, et al. This is an open-access article distributed under the terms of the Creative Commons Attribution License, which permits unrestricted use, distribution, and reproduction in any medium, provided the original author and source are credited. Numerical Simulation of Turbulent Blood Flow in the System of Coronary Arteries with Stenosis Mongkol Kaewbumrung 1 , Benchawan Wiwatanapataphee 2 *, Somsak Orankitjaroen 1 and Thanongchai Siriapisith 3 1 Department of Mathematics, Faculty of Science, Mahidol University Bangkok 10400, Thailand 2 Department of Mathematics and Statistics, Curtin University of Technology, Perth, WA 6845, Australia 3 Department of Radiology, Faculty of Medicine Siriraj Hospital, Mahidol University, Bangkoknoi, Bangkok, 10700, Thailand Abstract In this paper, we propose a mathematical model of turbulence flow of fluid through a deformable channel to study the pulsatile blood flow in the coronary system with arterial stenosis. Blood is assumed to be an incompressible non- Newtonian fluid and its motion is considered as turbulent and modelled by the mass and momentum conservations with turbulent mixing energy and specific dissipation rate. The mechanical deformation of the arterial wall is modelled by a hyperelastic differential equation. The pulsatile behaviour during each heartbeat is assigned on the entrance and exit boundaries. Numerical simulation based on the Finite Element method for the solution of arterial wall deformation, and the Arbitrary Lagrangian Eulerian Finite Volume method for the turbulence fluid-flow solution is used to investigate the effect of stenosis severity at the proximal part of the left anterior descending artery on the blood velocity, the pressure distribution and the wall shear stresses along the flow direction.
Transcript of i o m e trics Journal of Biometrics & Biostatistics
Volume 8 • Issue 2 • 1000344J Biom Biostat, an open access journalISSN: 2155-6180
Research Article
Kaewbumrung et al., J Biom Biostat 2017, 8:2DOI: 10.4172/2155-6180.1000344
Research Article Open Access
Journal of Biometrics & BiostatisticsJour
nal o
f Biometrics & Biostatistics
ISSN: 2155-6180
Keywords: Mathematical model; Numerical simulation; Finiteelement method; Cardiovascular disease; Coronary arteries
IntroductionCoronary artery disease (CAD), one of the major causes of death
worldwide, is characterized by atherosclerosis in the left and right coronary arteries in which atherosclerotic plaques reduce the space of the lumen of the coronary arteries. It is believed that the notable elements at the early states of coronary heart diseases are associated with critical flow conditions resulting from arterial stenosis. These flow conditions are flow segregation, high wall shear stress and wall densification. Over the last few decades, development of surgical treatments for cardiovascular diseases has been done constantly. The best treatment for an individual patient is usually determined based on the underlying problems, where and how severe the patient’s blockages are, and the future risks. For instance, medications such as calcium channel blockers, beta blockers, nitrates, aspirin, or cholesterol-lowering drugs (statins), when atherosclerosis is identified at an early stage, may be prescribed to ease its symptoms. For patients with severe stenosis, a common treatment for the blocked arteries is by the use of a coronary artery bypass grafting (CABG) where a new path for blood to flow around (bypass) the blockage in the artery is created. For some patients, minimal invasive coronary artery surgery such as coronary balloon angioplasty and stenting is an alternative to the CABG surgery. Although a substantial number of saphenous-vein bypass grafts are implanted globally annually, 25% of the bypass grafts collapse within a year and up to 50% fail within a decade after surgery. These indicate that existing treatments are still inappropriate for the cardiovascular disease. Currently, it has been confessed that one of the most significant detection in a successful bypass operation is the information of the rheological manner of human blood, the pressure distribution, the flow rate and the wall shear stress in the stenosis artery which is deformed in a cardiac cycles of a heart pump. A significant number of in-vivo and vitro experimental models have been conducted in order to comprehend the pathogenesis of coronary artery diseases.
In the work of Pijlss team [1], a theoretical model for the coronary circulation was developed, a set of equations to determine relative maximum flow of both the myocardium and the epicardial coronary artery was derived, and the animal model in which five
dogs were thoroughly instrumented with an epicardial coronary Doppler transducer. The results showed that the method had potential applications for making a difference in the functional severity or degree of coronary artery stenoses and for evaluating collateral flow that is feasible during coronary occlusion. Jie et al. [2] developed a vitro experiment using a curved stenosis hydrogel model to approximate the coronary disease situation. The flow experiment was performed to inspect the relationship between the fluid flow and the malformation of stenosis in the coronary arteries. Tiari et al. [3] proposed an experimental model to measure the pressure drop in an elastic tube with mechanical characteristics comparable to a coronary artery with single and double stenosis. The degree of stenosis was elevated in seven steps. The results indicated that an increase of stenosis severity led to moderate increase in pressure drop. Zafar et al. [4] measured the blood flow rate and velocity in coronary artery stenosis using intracoronary frequency domain optical coherence tomography (FDOCT), and validated against the fractional flow reverse (FFR). They found that the FD-OCT is a helpful tool in the assessment of CAD. Due to difficulties in establishing the conditions of the critical flow for the in-vivo and vitro experimental models, the dynamical mechanism underlying is not as well understood accurately. On the other side, mathematical models and numerical simulations can conduct to better understanding of the circumstance involved in the pathogenesis of the CAD. Thus, over the last few decades, a great number of mathematical models and numerical techniques have been proposed to analyze the rheological manner of blood in the small vessels subjected to the assumption that blood behaves as an incompressible Newtonian fluid.
*Corresponding author: Wiwatanapataphee B, Department of Mathematics &Statistics, Curtin University of Technology, Perth, WA 6845, Australia, Tel: 618 9266 2405; E-mail: [email protected]
Received April 20, 2017; Accepted April 25, 2017; Published April 28, 2017
Citation: Kaewbumrung M, Wiwatanapataphee B, Orankitjaroen S, Siriapisith T (2017) Numerical Simulation of Turbulent Blood Flow in the System of Coronary Arteries with Stenosis. J Biom Biostat 8: 344. doi: 10.4172/2155-6180.1000344
Copyright: © 2017 Kaewbumrung M, et al. This is an open-access article distributed under the terms of the Creative Commons Attribution License, which permits unrestricted use, distribution, and reproduction in any medium, provided the original author and source are credited.
Numerical Simulation of Turbulent Blood Flow in the System of Coronary Arteries with StenosisMongkol Kaewbumrung1, Benchawan Wiwatanapataphee2*, Somsak Orankitjaroen1 and Thanongchai Siriapisith3
1Department of Mathematics, Faculty of Science, Mahidol University Bangkok 10400, Thailand2Department of Mathematics and Statistics, Curtin University of Technology, Perth, WA 6845, Australia3Department of Radiology, Faculty of Medicine Siriraj Hospital, Mahidol University, Bangkoknoi, Bangkok, 10700, Thailand
AbstractIn this paper, we propose a mathematical model of turbulence flow of fluid through a deformable channel to study
the pulsatile blood flow in the coronary system with arterial stenosis. Blood is assumed to be an incompressible non-Newtonian fluid and its motion is considered as turbulent and modelled by the mass and momentum conservations with turbulent mixing energy and specific dissipation rate. The mechanical deformation of the arterial wall is modelled by a hyperelastic differential equation. The pulsatile behaviour during each heartbeat is assigned on the entrance and exit boundaries. Numerical simulation based on the Finite Element method for the solution of arterial wall deformation, and the Arbitrary Lagrangian Eulerian Finite Volume method for the turbulence fluid-flow solution is used to investigate the effect of stenosis severity at the proximal part of the left anterior descending artery on the blood velocity, the pressure distribution and the wall shear stresses along the flow direction.

Citation: Kaewbumrung M, Wiwatanapataphee B, Orankitjaroen S, Siriapisith T (2017) Numerical Simulation of Turbulent Blood Flow in the System of Coronary Arteries with Stenosis. J Biom Biostat 8: 344. doi: 10.4172/2155-6180.1000344
Page 2 of 13
Volume 8 • Issue 2 • 1000344J Biom Biostat, an open access journalISSN: 2155-6180
In the human systemic circulatory system, heart is one of the most important parts. The blood circulatory process starts with pushing pulsatile blood through the thousands of arteries and veins by the heart which normally contracts and relaxes about 70 times per minute. It is widely recognized that pulsatile condition in the coronary system and the arterial wall deformation have an important impact on the flow field of blood. Thus, the study of pulsatile blood flow in the deformable arteries has challenged research in this area. However, some studies illustrate the fluid flow without taking into consideration of the displacement of the arterial wall, while some others focus only on the behaviour of the structure [5-10]. Several studies have concentrated on the coupled fluid flow- wall deformation problem [11,12]. Chahboune and Crolet [11] proposed a 2D mathematical model, and J-F Gerbeau [12] developed a 3D mathematical model of the fluid-structure interaction flow in an artery with wall movement in the cardiac cycle. Numerical simulation based on Finite Element method was carried out. Bertolotti et al. [13] studied three-dimensional transient flows of fluid through coronary arterial bypass grafting using the inflow rates obtained from in vivo measurements in patients who had gone through coronary bypass surgery a few days before. The interplay between the fluid flows and the graft has been investigated. The results showed the phase inflow difference that can partly be responsible for specific flow phenomena: jet membrane deflection or feedback effect that seeds the undulating of the post-stenotic jet during the cardiac cycle. In 2005, Gerbeau, Vidrascu and Frey presented a mathematical model and a numerical algorithm to investigate the fluid-structure interaction in large-deformable compliant vessels. However, the biological effect and interpretation of the results were not given [12]. In general, there is a common agreement between experimental model and mathematical model on the patterns of pressure and flow waves in the coronary arteries under normal conditions and in severity of stenosis. This agreement is in a linear fashion with respect to pulsatile pressure-flow relationship. High pressure gradient leading to the compression of altheroscerotic plaque plays an essential role in the development of atheroscrerotic plaque rupture and subsequent thrombosis or distal embolization. Blood may flow with high speed through the narrowed area of artery stenosis. The presence of a stenosis in the artery greatly increases the possibility of turbulence in the blood flow [14,15]. Since moderate and severe arterial stenoses can produce highly disturbed flow regions with transitional and or turbulent flow characteristics, many turbulence models tackling the turbulent case in the transition domain of the fluid flow have been proposed. However, only two standard turbulent models which are the two-equation k-ε turbulence model and the k-ω model are widely used to analyse the turbulent blood flow. Compared to the k-ε model, the k- model has better quality and quantity in corresponding to experiment because it can predict the turbulence length scale near the walls in which there is the presence of adverse pressure gradient. For example, Ghalichi et al. analyzed the turbulent flow distal to an arterial stenosis with 50%, 75% and 86% reductions in cross-sectional area [16] using the Wilcox low-Re turbulence model [17]. The results of velocity profile, vortex length, wall shear stress, wall static pressure, and turbulence intensity were compared with experimental measurements. Recently, the fluid-structure interaction (FSI) approach has been adopted to depict the flow of blood in a hyper-elastic vessel [12,18,19]. However, none of the existing models seems to be completely satisfactory for all kinds of flow regimens, and the turbulent effect on non-Newtonian behaviour of blood flow have still not been investigated in combination with the deformable vessel structure.
In this study, we developed a mathematical model of the turbulent
blood flow in the coronary system of elastic arteries with stenosis. Blood is assumed as an incompressible non-Newtonian fluid and the arterial wall is modelled as a hyper-elastic material. Three different severity of arterial stenosis 25%, 50%, and 75% are set up at the proximal part of the left anterior descending artery (LAD). Numerical simulations based on the Finite Element method, and Arbitrary Lagrangian Eulerian (ALE) Finite Volume method are carried out to study the blood flow behaviour in the deformable coronary arteries with a proximal LAD stenosis with various degree severity. The rest of this paper is organized as follows. In the following sections, we present a boundary value problem to describe the turbulence blood flow, the arterial wall deformation and the movement of the fluid mesh. In section 2, the governing equations of the turbulent blood flow in the deformable system of coronary arteries with stenosis are presented. In section 3, the underlying boundary value problem in two coordinate systems, i.e., the fixed mesh system (Eulerian frame) and the moving mesh system (Lagrangian frame) are formulated. The arterial wall deformation is computed on the Eulerian system whereas the turbulence fluid flow is obtained on the Lagrangian system. Sections 4 and 5 concern numerical algorithm and the validation study for evaluating the suitability of the proposed mathematical model. Section 6 concerns numerical investigations to study the velocity, the pressure and wall shear stress in the deformable system of coronary arteries having LAD with various stenosis. Finally, a conclusion is given in section 7.
Mathematical ModelIn this paper, the fluid-structure interaction in the system of
coronary arteries is modelled by using two coordinate systems, a fixed mesh system or the Eulerian frame Ω(X,Y,Z) and a moving mesh system or the Lagrangian frame ΩL(x,y,z). The arterial wall displacement d(x,t) is computed in the Eulerian frame while the velocity field u(x,t), the pressure p(x,t) of blood, and the mesh velocity Ψ(x,t) due to the movement of coordinate system are approximated numerically in a fully coupled manner through the use of the fluid-structure interface conditions.
Governing equations for turbulence blood flow
In this study, we assume that blood behaves as a non-Newtonian incompressible fluid, and its flow pattern is considered as the turbulence flow which is governed by the continuity equation, the Navier-Stokes equations, and the low Reynolds number K - ω turbulence model [20].
= 0,u∇ ⋅ (1)
( ) ( ( ) ) = ,ptρ ρ σ∂
+∇⋅ − ⊗ −∇ +∇⋅∂
u u uΨ (2)
*1
( ) ( ( ) ) = ( )kt
K
K K f K Kt
P ηρ ρ β ρ ω ησ
∂+∇⋅ − − +∇⋅ + ∇
∂u Ψ (3)
22
( ) ( ( ) ) = ( ) ,tkP f
t K ω
ηρω αωρ ω βρ ω η ωσ
∂+∇⋅ − − +∇⋅ + ∇
∂u Ψ (4)
where u,p,K and ω denote respectively the velocity, the pressure, the turbulence kinetic energy and the specific dissipation rate, is the
blood density, ηt is the turbulence viscosity given by *=tKρη αω
, and ( )= ( )( ( ) )T
tσ η η+ ∇ + ∇u u .
For the viscosity of the non-Newtonian fluid, Carreau model is adopted to ascertain the value of the viscosity η which depends on the value of the local stain-rate, i.e.,
1
0= ( )[1 ( ) ] = ( ( ) )n
a Ta withη η η η λγ γ−
∞ ∞+ − + ∇ + ∇u u
Citation: Kaewbumrung M, Wiwatanapataphee B, Orankitjaroen S, Siriapisith T (2017) Numerical Simulation of Turbulent Blood Flow in the System of Coronary Arteries with Stenosis. J Biom Biostat 8: 344. doi: 10.4172/2155-6180.1000344
Page 3 of 13
Volume 8 • Issue 2 • 1000344J Biom Biostat, an open access journalISSN: 2155-6180
where η0, η∞, λ, n and a denote respectively the zero-shear viscosity, the infinite-shear viscosity, the relaxation time, the power-law index, and the shape parameter, and γ represents the rate of deformation tensor. In this study we set η0=0.056 Pa⋅s, η∞=0.00345 Pa⋅s, n=0.3568, a=2 and λ=3.313 s. The other quantities in eqns. (3) and (4) are determined as follows [21]:
** 0 0/ 5 /= , = ,
1 / 9 1 /T k T
T k T
Re R Rr RRe R Re R
ω
ω
α αα α+ ++ +
* 40*
4
( / )9= , = .100 1 ( / )
TT
T
Re R KReRe R
β
β
β ρβωη
+
+
with the following constant parameters:
* *0 0 0
1 1 3 5= , = , = , = ,40 10 40 18
α α β β
1= = , = 6, = 2.7, = 8.2K kR R Rω ω βσ σ
The first terms on the right hand side (RHS) of eqns. (3) and (4) represent productions of the turbulence kinetic energy and the specific
dissipation rate ,i
k i jj
uPx
τ ∂=
∂ depending on τi,j which is determined by
, , , ,1 223 3
ki j t i j i j i j
k
uS Kx
τ η δ ρ δ ∂
= − − ∂
where ,1 .2
jii j
j i
uuSx x
∂∂= + ∂ ∂
The second terms on the RHS of eqns. (3) and (4) represent dissipations of K and ω depending on f1 and f2 which are calculated by [15]:
21 3
2
1 01 with ,1 680 0
1 400KK
j jK
Kfx x
χωχχ χ ω
χ
≤∂ ∂= =+ > ∂ ∂ +
2 * * 3
1 70= = ,1 80 ( )
ij jk kiSf withω
ωω
χ χχ β α
Ω Ω++
where 1=2
jiij
j i
uux x
∂∂Ω − ∂ ∂
.
Governing equations for the arterial wall deformation
In the arterial wall, about 70% to 80% intracellular and extracellular water is occupied, the arterial wall is then assumed to be an elastic body. During a cardiac cycle, shear rate varies in time and can be large near the wall. This leads to the deformation of the arterial wall whose dynamic can be modelled by the following equation:
2
2 = ,ss st
ρ σ∂∇⋅
∂d (5)
where ds denotes vector of wall displacement, ρs is the density of arterial wall tissue. The wall of coronary artery is considered to be a nonlinear hyper-elastic body, the term σs in (5) is then set as
1 ,2s
Wσ ∂=
∂where is the Green-Lagrange strain and W is a strain energy density potential. Here, a five-parameter hyper-elastic Mooney-Rivlin model is used [22]:
2 210 1 01 2 11 1 2 20 1 02 2= ( 3) ( 3) ( 3)( 3) ( 3) ( 3) ,W C C C C C− + − + − − + − + −
Where l1 and l2 are the first and second strain invariants of the
Cauchy-Green deformation tensor with 11 itri
= and 1ii −∂=
∂
with five Mooney Rivlin parameters are C10=0.3848, C01=-0.0891, C11=0.5118, C20=0.5109 and C02=0.4912.
Movement of the fluid mesh
Effective computation with deformable object can be achieved through the use of dynamic meshes. The mesh motion governing the fluid mesh position is based on the coordinate velocity, Ψ = (ψx,ψy,ψz) of the point xL of the system ΩLwhich varies in time. To ensure a pleasantly varying distribution of the nodes, we assume that the nodes on the internal arterial wall move with blood (no slip) and that the mesh velocity in the fluid channel is governed by a Laplaces equation:
2 = 0,∇ Ψ (6)
which gives the differential coordinates xL=(x,y,z) in the space time t for the fluid channel as
0 0 0= , = , = .
t t t
x y zx X d y Y d z Z dψ τ ψ τ ψ τ+ + +∫ ∫ ∫or
= ( , ),fx X d X t+
where df is the displacement of fluid region at any time t.
Boundary and interface conditions
Since the heart beats periodically, the output of the heart has a characteristics of waves. To identify the boundary conditions for the turbulence fluid flow in the deformable vessel, we apply Fourier analysis to dissect the wave pattern in periodic cycles known as systole and diastole into sinusoidal component. The pulsatile characteristics of pressure and flow rate wave forms varying in different parts of the arterial system are given by
4
=1( ) = cos( ) sin( ),Q Q
n nn
Q t Q a nwt b nwt+ +∑4
=1( ) = cos( ) sin( ),p p
n nn
p t p a nwt b nwt+ +∑ (7)
where Q and p represent respectively the average flow rate and average pressure of blood, the angular frequency w is defined by w=2π/T with a cardiac period T=0.8 s, and all values of the parameters are given by B. Wiwatanapataphee et al. [23].
On the entry of the aorta (the inflow boundary), the pulsatile axial velocity is assumed to be
( )( ) = ,Q tU tA
(8)
where A denotes area of the inflow surface where turbulent kinetic energy and turbulent dissipation rate ω are specified as
( )1.5
23 0.1643, ,2
KK UL
ω= = (9)
for the mean flow speed = /U Q A at the inflow surface with area A, the percentage of the turbulence intensity and turbulence length scale L which are given by [24]:
1/8
= 0.16 , = 0.07 = 1.13 .UD and L D for D Aρη
−
The outlet boundaries include ΓRCA and ΓLAD, and the boundary

Citation: Kaewbumrung M, Wiwatanapataphee B, Orankitjaroen S, Siriapisith T (2017) Numerical Simulation of Turbulent Blood Flow in the System of Coronary Arteries with Stenosis. J Biom Biostat 8: 344. doi: 10.4172/2155-6180.1000344
Page 4 of 13
Volume 8 • Issue 2 • 1000344J Biom Biostat, an open access journalISSN: 2155-6180
condition is set to:
σ⋅n=-p(t)n (10)
The normal gradient of pressure field p is set to zero at the wall
boundaries, i.e., = 0p∂∂n
, the normal gradient of the fluid mesh velocity
is set to be the same as the normal inlet velocity at the aorta inlet,
=∂⋅
∂u n
nΨ and zero potential, Ψ=0, is applied at all outlet boundaries.
Another condition needs to be stated is that the fluid and mesh move with the same velocity on the interface between fluid channel and elastic body, i.e. displacement of the flow channel and solid must be compatible [11], traction must be at equilibrium [12], and fluid obeys the no-slip condition [13]:
= ,f sd d (11)
= ,f f s sσ σ⋅ ⋅n n (12)
= .f s
t t∂ ∂∂ ∂
d d (13)
A simplified model (typically a one-equation ω-based model) for the near wall is used in this study:
2
= ,wUρω ωη
+ (14)
and
( )2
*
6 for the laminar sublayer
1 for the logarithmix reqion,
i
turb
i
y
ddy
βω
β
+
++
+
=
u
where y+denotes the distance of the first point to wall, and βi=0.072 and * = 0.09.iβ
In summary, the turbulence blood flow in the deformable coronary arteries is governed by the following initial boundary value problem (IBVP).
IBVP: Find ds and u,p,K,ω and Ψ such that the above governing equations with associated boundary conditions are satisfied.
Numerical FormulationThe finite element formulation for arterial wall deformation
The weak formulation of system (5) is to find 1 3[ ( )]s H∈ Ωd in the fixed mesh system such that the essential boundary condition is satisfied and that for the test function 1 3 1 3
0[ ( )] [ ( )] | = 0 on arterial wallv H v H v∈ Ω ≡ ∈ Ω it holds that
2
2 = ( ) .ss s sv d v d v d
tρ σ σ
Ω Ω Ω
∂Ω ∇⋅ Ω− ∇ ⋅ Ω
∂∫ ∫ ∫d (15)
We discretise the computational domain of arterial wall into a finite number of elements with M nodes. The problem (15) is posed into M -dimensional subspace.
Let 1 1=1( ) = | ( )M
h k kH span HζΩ ⊂ Ω and 1 10 =1 0( ) = | ( )M
h k kH span HςΩ ⊂ Ω . The unknown function ds and the test functions v are determined by the interpolating functions as follows:
=1 =1= ( ) ( ) = ( ).
M M
s h ih i h jh ji j
t x v v v xζ ς≡ ≡∑ ∑d d d
By using the Bunov-Galerkin Finite Element method ( = )ζ ς , we obtain a system of M equations as follows:
=1 =1 =1 = ( ) ,
M M M
s i j s i s i si j i
d ds dρ ζ ζ ζ σ ζ σΩ Γ Ω
Ω ⋅ − ∇ ⋅ Ω∑∑ ∑∫ ∫ ∫d n (16)
which can be expressed in matrix form as
dM =D F (17)
where D=(d1, d2,…, dM)T with di=(dx dy dz)T being the displacement
vector at the i th node. The coefficient matrix Md and the load vector F are derived in the Galerkin Finite Element formulation (16).
The ALE finite volume formulation for the turbulence fluid flow
The weak formulation of the turbulence blood flow is to find 1 3 1 1 1 1 3( , , , , ) [ ( )] ( ) ( ) ( ) [ ( )]L L L L Lp K H H H H Hω ∈ℑ ≡ Ω × Ω × Ω × Ω × Ωu Ψ in
the moving mesh system at instant time t such that all the essential boundary conditions are satisfied and
( ) = 0;L
dφ φΩ∇ ⋅ −∇ ⋅ Ω∫ u u (18)
( ( ) ) (( ) )L L L
d d dt
φ φ φΩ Ω Ω
∂Ω+ ∇⋅ − ⊗ Ω− ∇ ⋅ − ⊗ Ω
∂∫ ∫ ∫u u u u uΨ Ψ (19)
( )1 1= ,L L
pd dφ φσ φ σρ ρΩ Ω
− ∇ Ω + ∇ ⋅ −∇ ⋅ Ω∫ ∫
( ( ) ) (( ) )t t tL L L
K d K d K dt
φ φ φΩ Ω Ω
∂Ω+ ∇⋅ − Ω− ∇ ⋅ − Ω
∂∫ ∫ ∫u uΨ Ψ (20)
1 1= ( ) ( )t tt t
L LK K
K d Kdη ηφ η φ ηρ σ ρ σΩ Ω
∇ ⋅ + ∇ Ω − ∇ ⋅ + ∇ Ω
∫ ∫
*1
1 ,t t kL L
f Kd P dφ β ω φρΩ Ω
− Ω+ Ω∫ ∫
( ( ) ) (( ) )t t tL L L
d d dtωφ φ ω φ ω
Ω Ω Ω
∂Ω+ ∇⋅ − Ω− ∇ ⋅ − Ω
∂∫ ∫ ∫u uΨ Ψ (21)
1 1= ( ) ( )t tt t
L Ld d
ω ω
η ηφ η ω φ η ωρ σ ρ σΩ Ω
∇ ⋅ + ∇ Ω − ∇ ⋅ + ∇ Ω
∫ ∫
22
1 ,t t kL L
f d P dKαωφ βω φ
ρΩ Ω− Ω+ Ω∫ ∫
( ) = 0,L L
d dψ ψφ φΩ Ω∇ ⋅ ∇ Ω− ∇ ⋅∇ Ω∫ ∫Ψ Ψ (22)
where , , , ,tt ψφ φ φ φ φ are test functions.
The ALE technique is employed for the solution of the weak formula (18-22) which are constructed on the Lagrangian frame, but are solved on the Eulerian frame or spatially fixed system. Thus, computation is conducted by a transformation between two coordinate systems.
( , , , ),: ( , , , ),
( , , , ),
x x X Y Z tLet T y y X Y Z t
z z X Y Z t
===
(23)

Citation: Kaewbumrung M, Wiwatanapataphee B, Orankitjaroen S, Siriapisith T (2017) Numerical Simulation of Turbulent Blood Flow in the System of Coronary Arteries with Stenosis. J Biom Biostat 8: 344. doi: 10.4172/2155-6180.1000344
Page 5 of 13
Volume 8 • Issue 2 • 1000344J Biom Biostat, an open access journalISSN: 2155-6180
be the transformation mapping the deformed coordinates to the fixed coordinates. The spatial relationship between two coordinate systems is determined by
= ,
x x xX Y Zdx dX dXy y ydy dY dYX Y Z
dz dZ dZz z zX Y Z
∂ ∂ ∂ ∂ ∂ ∂ ∂ ∂ ∂ = ∂ ∂ ∂
∂ ∂ ∂ ∂ ∂ ∂
J (24)
where an 3 ×3 matrix of partial derivatives is called the Jacobian matrix J of the transformation which is invertible if | J | ≠ 0 at each time t i.e.,
1
= ( , , , ),: = ( , , , ),
= ( , , , ),
X X x y z tT Y Y x y z t
Z Z x y z t
− (25)
Multiplying equation (24) by the inverse of the Jacobian matrix yields
1= ,d d−X J x (26)
where J-1 is the inverse of the Jacobian matrix whose components are determined by
1 1 111 12 13= , = , = ,
| | | | | |
y z y z x z x z x y x yY Z Z Y Z Y Y Z Y Z Z YJ J J− − −
∂ ∂ ∂ ∂ ∂ ∂ ∂ ∂ ∂ ∂ ∂ ∂− − −
∂ ∂ ∂ ∂ ∂ ∂ ∂ ∂ ∂ ∂ ∂ ∂J J J
1 1 121 22 23= , = , = ,
| | | | | |
y z y z x z x z x y x yZ X X Z X Z Z X Z X X ZJ J J− − −
∂ ∂ ∂ ∂ ∂ ∂ ∂ ∂ ∂ ∂ ∂ ∂− − −
∂ ∂ ∂ ∂ ∂ ∂ ∂ ∂ ∂ ∂ ∂ ∂J J J
(27)
1 1 131 32 33= , = , = ,
| | | | | |
y z y z x z x z x y x yX Y Y X Y X X Y X Y Y XJ J J− − −
∂ ∂ ∂ ∂ ∂ ∂ ∂ ∂ ∂ ∂ ∂ ∂− − −
∂ ∂ ∂ ∂ ∂ ∂ ∂ ∂ ∂ ∂ ∂ ∂J J J
Using the relation (26) in transforming the calculation results from the deformed coordinates in ΩL to the fixed coordinates Ω and use the divergence theorem, the system of eqns. (18)-(22) become
( ) | | ( ) | | = 0;ds dφ φ∂Ω Ω
⋅ − ∇ ⋅ Ω∫ ∫u n J u J (28)
| | ( ( ) ) | | (( ) ) | |d ds dt
φ φ φΩ ∂Ω Ω
∂Ω+ − ⊗ ⋅ − ∇ ⋅ − ⊗ Ω
∂∫ ∫ ∫u J u u n J u u JΨ Ψ
1 1 1= | | ( ) | | | | ,p ds ds dφ φσ φ σρ ρ ρΩ ∂Ω Ω
− ∇ + ⋅ − ∇ ⋅ Ω∫ ∫ ∫J n J J (29)
| | ( ( ) ) | | (( ) ) | |t t tK d K ds K dt
φ φ φΩ ∂Ω Ω
∂Ω+ − ⋅ − ∇ ⋅ − Ω
∂∫ ∫ ∫J u n J u JΨ Ψ
1 1= ( ) | | ( ) | |t tt t
K K
K ds K dη ηφ η φ ηρ σ ρ σ∂Ω Ω
+ ∇ ⋅ − ∇ ⋅ + ∇ Ω
∫ ∫n J J
*1
1| | | | ,t t kf K d P dφ β ω φρΩ Ω
− Ω+ Ω∫ ∫J J (30)
| | ( ( ) ) | | (( ) ) | |t t td ds dtωφ φ ω φ ω
Ω ∂Ω Ω
∂Ω+ − ⋅ − ∇ ⋅ − Ω
∂∫ ∫ ∫J u n J u JΨ Ψ
1 1= ( ) | | ( ) | |t tt tds d
ω ω
η ηφ η ω φ η ωρ σ ρ σ∂Ω Ω
+ ∇ ⋅ − ∇ ⋅ + ∇ Ω
∫ ∫n J J
2 1| | | | ,t t kd P dKαωφ βω φ
ρΩ Ω− Ω+ Ω∫ ∫J J (31)
( ) | | | | = 0,ds dψ ψφ φ∂Ω Ω
∇ ⋅ − ∇ ⋅∇ Ω∫ ∫n J JΨ Ψ (32)
All partial derivative terms in eqns. (29)-(32) are determined by by the following expressions:
31
=1= .ij
jj j
f f Jx X
−∂ ∂∂ ∂∑ (33)
We discretise the computational domain of blood-flow channel into a finite number N of tetradedral elements Ωi and construct a control volume i procedure. We then define all test functions as follows:
1 on = = = = =
0 otherwise,i
tt ψφ φ φ φ φΩ
(34)
and let ui=u(Xi), Ki=K(Xi), ωi=ω (Xi), Ψi=Ψ (Xi) the system of equation (28)-(32) becomes
=1( | | = 0;
N
iii
ds∂Ω
⋅ ∑ ∫ u n J (35)
=1
1| | | | (( ) ) | | | | | |N
ii i i i i i
iids p
t ρ∂Ω
∂ Ω + − ⊗ ⋅ + Ω ∇ ∂
∑ ∫u J u u n J JΨ
=1
1= | | ,N
iii
dsσρ ∂Ω
⋅∑ ∫ n J (36)
=1
1| | | | (( ) ) ( ) | |N
i ti i i i i
ii K
K K K dst
ηηρ σ∂Ω
∂Ω + − ⋅ + + ∇ ⋅ ∂
∑ ∫J u n n JΨ
*1
=1
1= | | | |,N
i k i ii
P f Kβ ωρ
Ω −
∑ J (37)
=1
1| | | | (( ) ) ( ) | |N
i ti i i i i
iids
t ω
ω ηω η ωρ σ∂Ω
∂Ω + − ⋅ + + ∇ ⋅ ∂
∑ ∫J u n n JΨ
22
=1
1= | | | |,N
i ii k i
i i
P fKα ω βω
ρ
Ω −
∑ J (38)
=1| | = 0,
N
iii
ds∂Ω∇ ⋅∑∫ n JΨ (39)
which can be expressed in matrix form as
= 0,TC Uˆ( , ) = ,uM A u CPψ+ +U U F
( , ) = ,k KM A u ψ+K K F (40)
( , ) = ,M A uω ωψ+W W F
= 0,AψΨ
where 1 2=< , ,..., >T
Nu u uU with = ( , , )Tx y ziu u u u being the velocity
at the ith node; 1 2
= ( , ,..., )TN
ψ ψ ψΨ with = ( , , )Tx y zi
ψ ψ ψ ψ being
the mesh velocity at the ith node; P=< P1, P2,… PN>T, K=< K 1, K2,… K N>T and W=< W 1, W 2,… W N>T being the nodal pressure, the nodal turbulent kinetic energy and nodal dissipation rate; the coefficient matrices C,Ĉ,M,A,Ak, Aω and Aψ are derived in the Galerkin finite volume formulation (35)-(39).
Numerical AlgorithmThe system (17) and (40) are solved by an implicit time integration
scheme. For a typical time step (tr→tr+1), we obtain

Citation: Kaewbumrung M, Wiwatanapataphee B, Orankitjaroen S, Siriapisith T (2017) Numerical Simulation of Turbulent Blood Flow in the System of Coronary Arteries with Stenosis. J Biom Biostat 8: 344. doi: 10.4172/2155-6180.1000344
Page 6 of 13
Volume 8 • Issue 2 • 1000344J Biom Biostat, an open access journalISSN: 2155-6180
1 12 2= (2 )( ) ( )
d dr r r d
r r
M Mt t+ −− +
∆ ∆D D D F (41)
and
1 = 0,TrC +U
1 1ˆ( ( , )) = ,r r r
r r
M MA u CPt t
ψ + ++ +∆ ∆
U U
1( ( , )) = ,k r r kr r
M MA ut t
ψ ++ +∆ ∆
K K F (42)
1( ( , )) = ,r rr r
M MA ut tω ωψ ++ +
∆ ∆W W F
1 = 0.rAψ +Ψ
The system (42) is nonlinear because A,Ak, Aω depends on Ur+1 and Ψr+1. To deal with this nonlinearity for an iterative solution of (42), we use the iterative updating (43):
11 = 0,T n
rC ++U
1 11 1 1
ˆ( ) = ,n n n nr r r r
r r
M MA CPt t
+ ++ + ++ +
∆ ∆U U
11 1( ( ) ) = ,n n n
k r r r kr r
M MAt t
++ ++ +
∆ ∆K K F (43)
11 1( ( ) ) = ,n n n
r r rr r
M MAt tω ω
++ ++ +
∆ ∆W W F
1 11 1( ) = 0,n n
r rAψ+ ++ +Ψ
The subscript n in (43) denotes evaluation at the n th iteration step. Therefore, in a typical time step (tr→tr+1), we start with
0 0 0 0 01 1 1 1 1= ; = , = , = , = ,r r r r r r r r r rand+ + + + +D D U U K K W W Ψ Ψ (44)
all nodal unknown functions of Dr+1, and 1 1 1 11 1 1 1, , ,n n n n
r r r r+ + + ++ + + +U P K W and
11
nr++Ψ are then determined by respectively solving the systems (41) and
(43) repeatedly until the norms ||Dr+1-Dr||, and ||Ur+1-Ur||, ||Pr+1-Pr||, ||Kr+1-Kr||,||Wr+1-Wr||, and ||Ψr+1-Ψr|| are sufficiently small, then the systems approaches the so called steady state.
Validation StudySetup
Studying the fluid flow in the deformable channel requires a reliable model that can fully describe the flow pattern in the arteries with nonlinear hyper- elastic response (Figures 1 and 2).
The first task undertaken for evaluating the suitability of the mathematical model using ANSYS 17. The flow simulations in the curved tube and the back-step tube with stenosis were setup using the dynamic equations of nonlinear hyper-elastic model coupled with the Navier-Stokes equations for a turbulent viscous incompressible non-Newtonian fluid. The computational domains of both tubes
Figure 1: Computational domains of the back-step tube and the curved tube with 75% stenosis.
Figure 2: Cross-section view of domain mesh.
(a) Inlet velocity
(b) Outlet pressureFigure 3: Inlet and outlet boundary behaviours of aorta: (a) Inlet velocity; (b) Outlet pressure.

Citation: Kaewbumrung M, Wiwatanapataphee B, Orankitjaroen S, Siriapisith T (2017) Numerical Simulation of Turbulent Blood Flow in the System of Coronary Arteries with Stenosis. J Biom Biostat 8: 344. doi: 10.4172/2155-6180.1000344
Page 7 of 13
Volume 8 • Issue 2 • 1000344J Biom Biostat, an open access journalISSN: 2155-6180
are displayed in Figure 1 and a cross-section view with 20 boundary layers of the flow channel is shown in Figure 2. Domain mesh of the 75% stenosed curved tube consists of 1,124,325 tetrahedral elements with 507,184 nodes in the flow channel, and 200,521 hexahedral elements with 241,056 nodes in the wall region, and for the domain mesh of the the 75% stenosed back-step tube, there are 1,113,965 tetrahedral elements with 502,510 nodes in the flow channel, and 192,321 hexahedral elements with 229,790 elements in the wall region. Five complete pulses of pressure and flow velocity were used in each simulation (Figure 3). The simulations were taken at each of the fifth cycle as highlighted in Figure 1. Influence of inflow boundary condition with different turbulence intensity including 4.2%, 7.2% and 10.2% on the flow pattern at four cross sections L1=1 mm, L2=3 mm, L3=5 mm and L4=10 mm (Figure 1) was investigated. The effect of elastic property of the arterial tissue on the deformation of the curved tube and the back-step tube was also investigated at point P0 (Figure 1).
Result and DiscussionThe flow chart of the fluid structure interaction (FSI) simulation
algorithm as shown in Figure 3 are used in this study (Figure 4). For the validation study of the incompressible non-Newtonian turbulence model, we set the fluid density ρ=1000 kgm-3, the mean velocity of the inflow profile U=0.81 ms-1 and the turbulence length L=0.00021 m.
We compare the axial velocity against the turbulence intensity. Figure 2 shows the profiles of axial velocity at the peak of systole at four cross sections L1=1 mm, L2=3 mm, L3=5 mm and L4=10 mm. The results demonstrate that the mean flow field responds strongly to the turbulence intensity. In the region very close to wall where the turbulence intensity is diminished and reaches zero at the wall, the
velocity profile is laminar, whereas above this region, the velocity profile is logarithmic. The maximum turbulence level seems at the positions of core of the axial velocity. The intensity value gives a sufficiently affects the transport of momentum. The downstream flow becomes laminar when the inlet turbulent intensity <7.2%.
To investigate the effect of elasticity of the material, we used the dynamic blood viscosity of 0.00408 Pa⋅s-1, the turbulence intensity of 7.2%, the turbulence length of 0.00021 m and assumed that the wall is an isotropic material with density, ρs, of 1200 kgm-3. The effects of elastic property on the wall deformation of the curved tube and the back-step tube are investigated. We compare the wall displacement at the point P0 as shown in Figure 1 by using the equation (5) with the
stress tensor 1=2s
Wσ ∂∂ [22] for the hyperelastic model, and for the
linear elastic model,
= 2 ( )(1 )(1 2 )s
E tr Iνσ µε εν ν
++ −
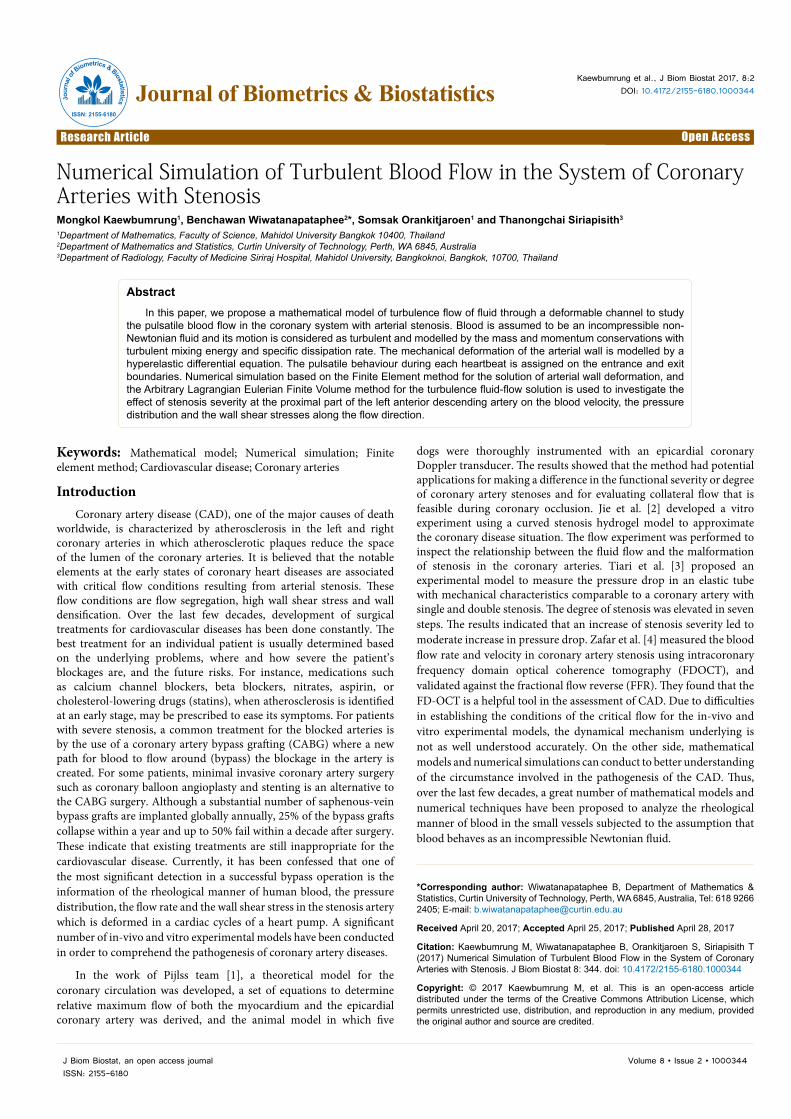
with Young’s modulus, E, of 4.23 MPa, Poisson’s ratio, v, of 0.38 [25], and the strain tensor ε and the Lam e′ constant µ related to the physical material properties,i.e., µ=E/[2(1+v)] [26]. The results show a small but detectable dissimilarity of the wall displacement as shown in Figure 3. The wall displacement obtained from the hyperelastic model is larger than the one provided from the linear elastic model, particulary in the curved tube. Our results show good agreement with the findings from the literature [7,15,18,21]. We thus conclude that the mathematical model presented in section 2 is suitable to study the blood flow in the system of coronary arteries with stenosis (Figure 5).
Figure 4: Flow chart of FSI algorithm.

Citation: Kaewbumrung M, Wiwatanapataphee B, Orankitjaroen S, Siriapisith T (2017) Numerical Simulation of Turbulent Blood Flow in the System of Coronary Arteries with Stenosis. J Biom Biostat 8: 344. doi: 10.4172/2155-6180.1000344
Page 8 of 13
Volume 8 • Issue 2 • 1000344J Biom Biostat, an open access journalISSN: 2155-6180
(a) ϱ = 4 .2%
(b) ϱ = 7 .2%
(c) ϱ = 10 .2%Figure 5: The systolic velocity profile at four cross sections including L1 (dashed line), L2 (dotted line), L3 (Dash-Dot Line) and L4 (solid line) obtained from the 75% stenosed models of the back-step tube (left column) and the curved tube (right column) with three different values of turbulent intensity: (a) 4.2%; (b) 7.2%; (c) 10.2%.
Three-Dimensional Flow Study A tubular network of blood vessels allows the blood to travels from
the heart to various regions of the body and returns the venous blood to the heart again [27,28]. Blood that leaves the heart passes into arteries whose walls also contain a protein fiber called elastin that has elastic qualities. In the arteries, pressure fluctuates during the cardiac cycle. During the systolic period, large arteries are distended with blood as their elastic walls stretch. During the diastolic period the walls rebound, and thus the blood is pushing along.
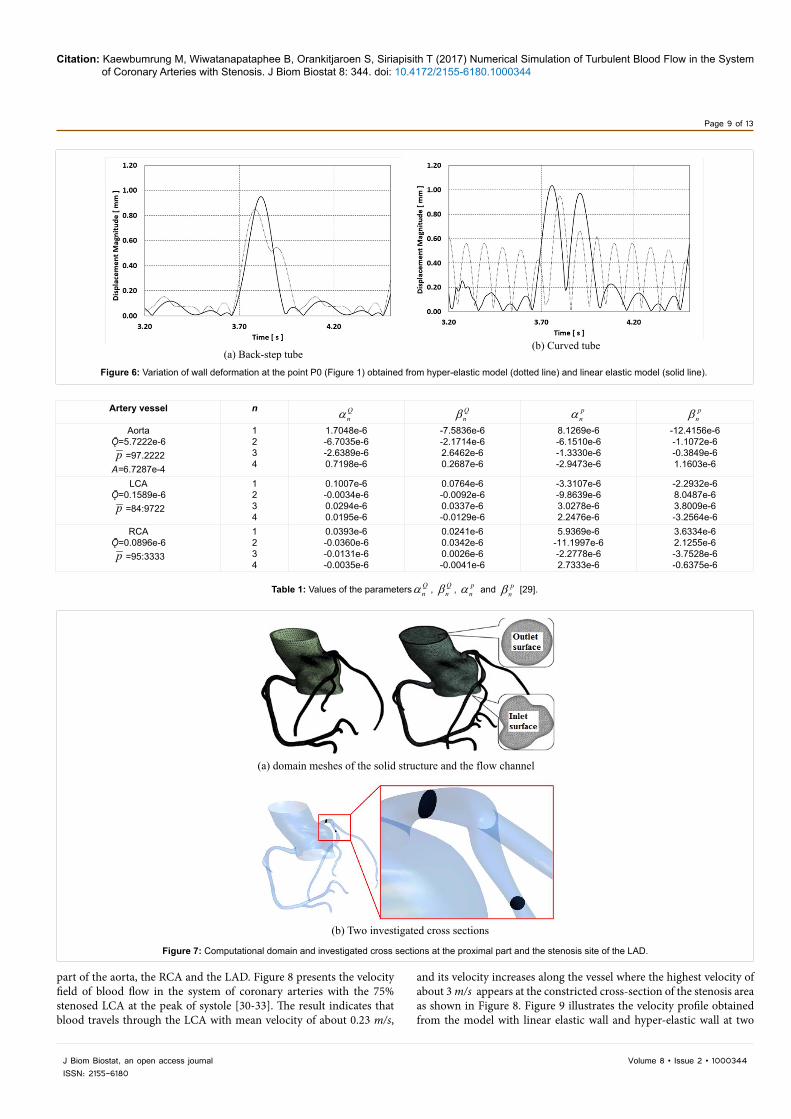
In this study, the three-dimensional blood flow through the system of human arteries with hyperelastic arterial layer, consisting of the base of the aorta connecting with the normal right coronary artery (RCA) and the left coronary artery (LCA) with appearance of LAD stenosis located at 5 mm from the aorta-LCA connection, was simulated under typical physiological conditions (Figure 6). Using 1000 images of computed tomography scans of the human coronary system, computational domains of flow channel with their associated arterial
walls were constructed as shown in Figure 7. Figure 7a shows the meshes of the structural wall (left column) with 1,888,270 tetrahedral elements and 851,800 nodes, and the flow channel (right column) with 2,336,212 tetrahedral elements and 1,053,867 nodes. To investigate the effect of arterial stenosis severity on the flow pattern, we choose four severity degrees of 25%, 50% and 75% to analyze the flow speed and wall displacement on two cross-sections at the proximal part of the LCA and the stenosis region as shown in Figure 7b. To ensure reproducibility of the pulsatile characteristic flow, we simulate the results for 5 cardiac cycles (t=0.0 to 4.5 second) based on a fluid structure interaction (FSI)scheme as shown in Figure 3. Due to the fluctuation behaviour of blood flow during the cardiac cycle, the parameters listed in Table 1 [6,12] are used to determine the inlet pulsatile flow rate and outlet pulsatile pressure of large arteries [29].
Blood flows from the inlet aorta surface with the pulsatile velocity having mean speed of 0.85 m/s to the base of aorta connecting with the RCA and the LAD. Blood that leaves the aorta flows into the top
Citation: Kaewbumrung M, Wiwatanapataphee B, Orankitjaroen S, Siriapisith T (2017) Numerical Simulation of Turbulent Blood Flow in the System of Coronary Arteries with Stenosis. J Biom Biostat 8: 344. doi: 10.4172/2155-6180.1000344
Page 9 of 13
Volume 8 • Issue 2 • 1000344J Biom Biostat, an open access journalISSN: 2155-6180
Artery vessel n Qnα
Qnβ
pnα
pnβ
AortaǬ=5.7222e-6p =97.2222
A=6.7287e-4
1234
1.7048e-6-6.7035e-6-2.6389e-60.7198e-6
-7.5836e-6-2.1714e-62.6462e-60.2687e-6
8.1269e-6-6.1510e-6-1.3330e-6-2.9473e-6
-12.4156e-6-1.1072e-6-0.3849e-61.1603e-6
LCAǬ=0.1589e-6p =84:9722
1234
0.1007e-6-0.0034e-60.0294e-60.0195e-6
0.0764e-6-0.0092e-60.0337e-6-0.0129e-6
-3.3107e-6-9.8639e-63.0278e-62.2476e-6
-2.2932e-68.0487e-63.8009e-6-3.2564e-6
RCAǬ=0.0896e-6p =95:3333
1234
0.0393e-6-0.0360e-6-0.0131e-6-0.0035e-6
0.0241e-60.0342e-60.0026e-6-0.0041e-6
5.9369e-6-11.1997e-6-2.2778e-62.7333e-6
3.6334e-62.1255e-6-3.7528e-6-0.6375e-6
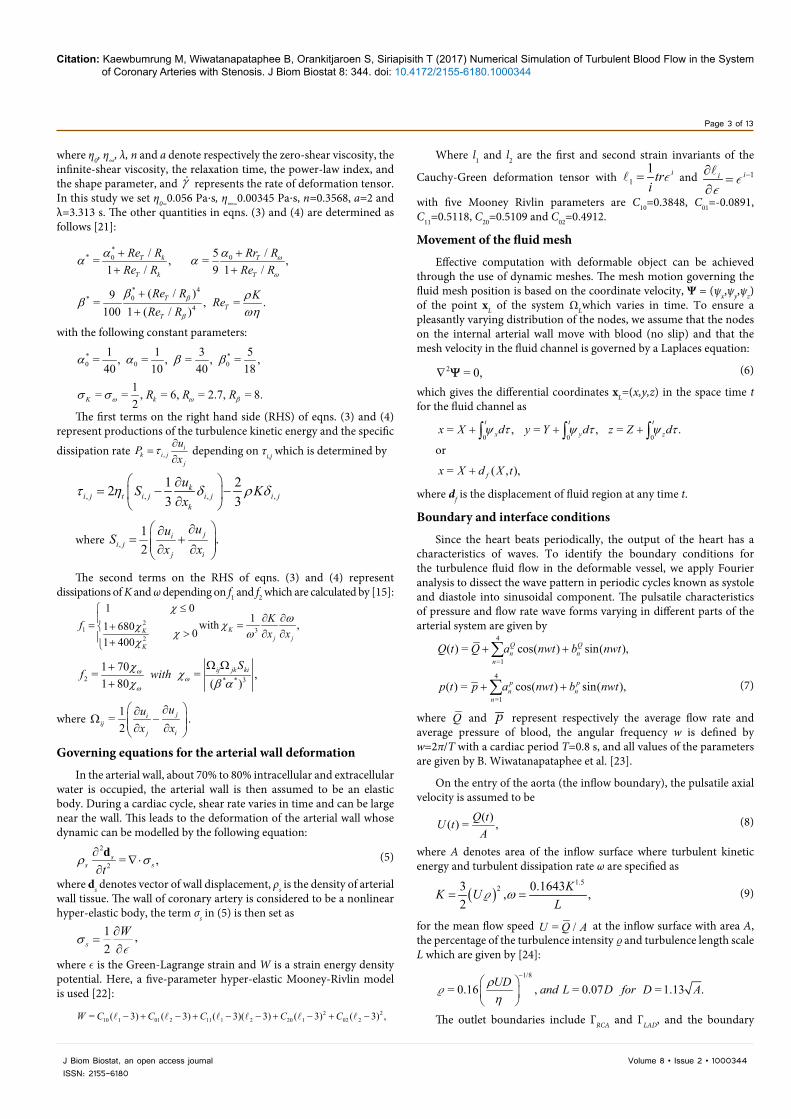
Table 1: Values of the parameters Qnα , Q
nβ , pnα and p
nβ [29].
(a) Back-step tube(b) Curved tube
Figure 6: Variation of wall deformation at the point P0 (Figure 1) obtained from hyper-elastic model (dotted line) and linear elastic model (solid line).
(a) domain meshes of the solid structure and the flow channel
(b) Two investigated cross sections
Figure 7: Computational domain and investigated cross sections at the proximal part and the stenosis site of the LAD.
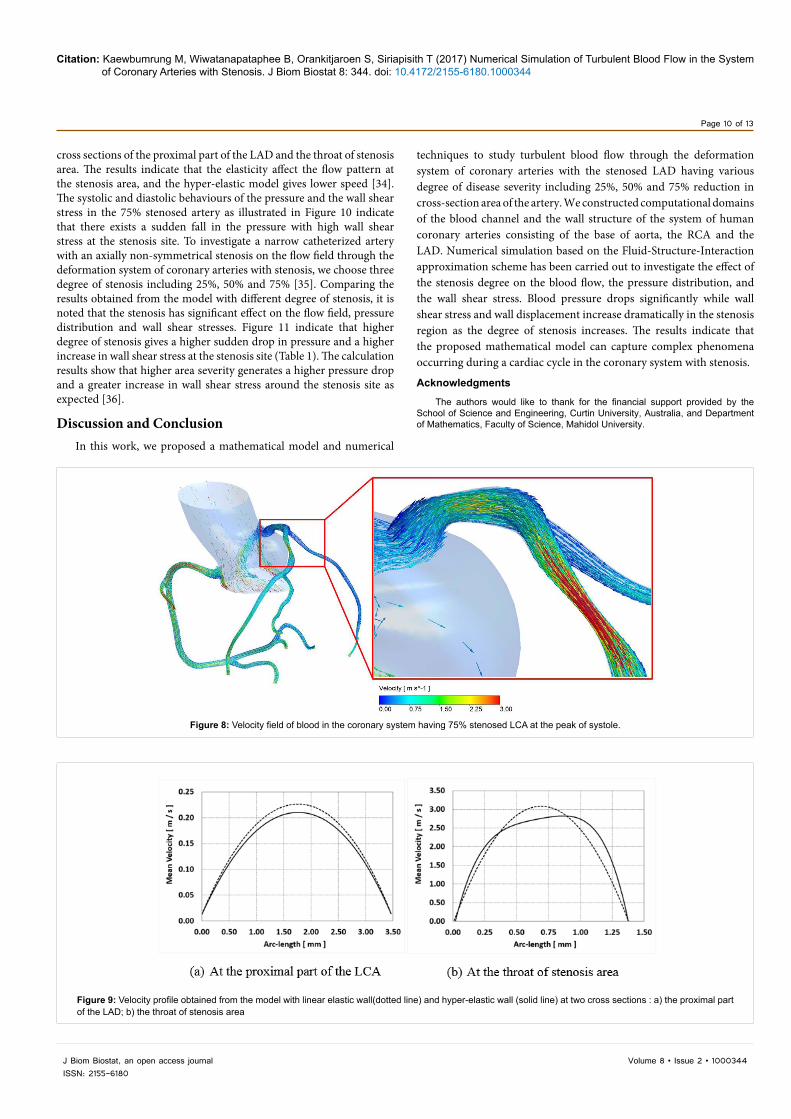
part of the aorta, the RCA and the LAD. Figure 8 presents the velocity field of blood flow in the system of coronary arteries with the 75% stenosed LCA at the peak of systole [30-33]. The result indicates that blood travels through the LCA with mean velocity of about 0.23 m/s,
and its velocity increases along the vessel where the highest velocity of about 3 m/s appears at the constricted cross-section of the stenosis area as shown in Figure 8. Figure 9 illustrates the velocity profile obtained from the model with linear elastic wall and hyper-elastic wall at two
Citation: Kaewbumrung M, Wiwatanapataphee B, Orankitjaroen S, Siriapisith T (2017) Numerical Simulation of Turbulent Blood Flow in the System of Coronary Arteries with Stenosis. J Biom Biostat 8: 344. doi: 10.4172/2155-6180.1000344
Page 10 of 13
Volume 8 • Issue 2 • 1000344J Biom Biostat, an open access journalISSN: 2155-6180
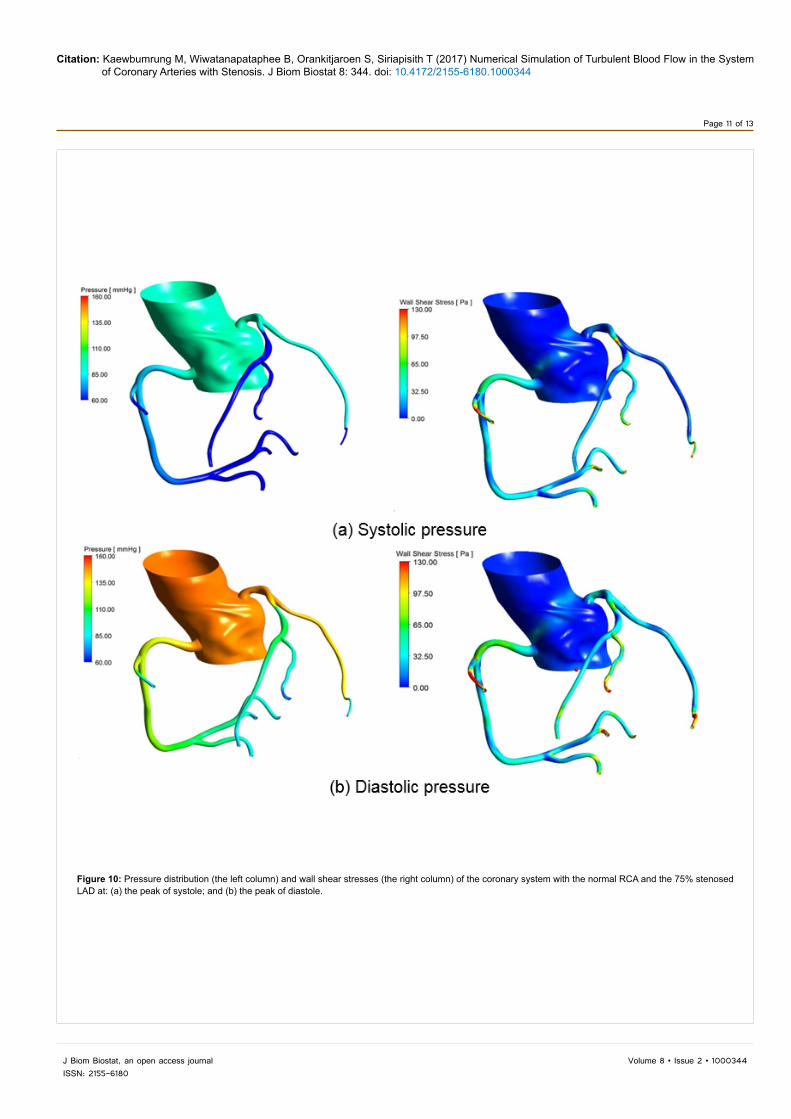
cross sections of the proximal part of the LAD and the throat of stenosis area. The results indicate that the elasticity affect the flow pattern at the stenosis area, and the hyper-elastic model gives lower speed [34]. The systolic and diastolic behaviours of the pressure and the wall shear stress in the 75% stenosed artery as illustrated in Figure 10 indicate that there exists a sudden fall in the pressure with high wall shear stress at the stenosis site. To investigate a narrow catheterized artery with an axially non-symmetrical stenosis on the flow field through the deformation system of coronary arteries with stenosis, we choose three degree of stenosis including 25%, 50% and 75% [35]. Comparing the results obtained from the model with different degree of stenosis, it is noted that the stenosis has significant effect on the flow field, pressure distribution and wall shear stresses. Figure 11 indicate that higher degree of stenosis gives a higher sudden drop in pressure and a higher increase in wall shear stress at the stenosis site (Table 1). The calculation results show that higher area severity generates a higher pressure drop and a greater increase in wall shear stress around the stenosis site as expected [36].
Discussion and ConclusionIn this work, we proposed a mathematical model and numerical
Figure 8: Velocity field of blood in the coronary system having 75% stenosed LCA at the peak of systole.
Figure 9: Velocity profile obtained from the model with linear elastic wall(dotted line) and hyper-elastic wall (solid line) at two cross sections : a) the proximal part of the LAD; b) the throat of stenosis area
techniques to study turbulent blood flow through the deformation system of coronary arteries with the stenosed LAD having various degree of disease severity including 25%, 50% and 75% reduction in cross-section area of the artery. We constructed computational domains of the blood channel and the wall structure of the system of human coronary arteries consisting of the base of aorta, the RCA and the LAD. Numerical simulation based on the Fluid-Structure-Interaction approximation scheme has been carried out to investigate the effect of the stenosis degree on the blood flow, the pressure distribution, and the wall shear stress. Blood pressure drops significantly while wall shear stress and wall displacement increase dramatically in the stenosis region as the degree of stenosis increases. The results indicate that the proposed mathematical model can capture complex phenomena occurring during a cardiac cycle in the coronary system with stenosis.
Acknowledgments
The authors would like to thank for the financial support provided by the School of Science and Engineering, Curtin University, Australia, and Department of Mathematics, Faculty of Science, Mahidol University.
Citation: Kaewbumrung M, Wiwatanapataphee B, Orankitjaroen S, Siriapisith T (2017) Numerical Simulation of Turbulent Blood Flow in the System of Coronary Arteries with Stenosis. J Biom Biostat 8: 344. doi: 10.4172/2155-6180.1000344
Page 11 of 13
Volume 8 • Issue 2 • 1000344J Biom Biostat, an open access journalISSN: 2155-6180
Figure 10: Pressure distribution (the left column) and wall shear stresses (the right column) of the coronary system with the normal RCA and the 75% stenosed LAD at: (a) the peak of systole; and (b) the peak of diastole.

Citation: Kaewbumrung M, Wiwatanapataphee B, Orankitjaroen S, Siriapisith T (2017) Numerical Simulation of Turbulent Blood Flow in the System of Coronary Arteries with Stenosis. J Biom Biostat 8: 344. doi: 10.4172/2155-6180.1000344
Page 12 of 13
Volume 8 • Issue 2 • 1000344J Biom Biostat, an open access journalISSN: 2155-6180
Figure 11: Pressure profile (the left column) and wall shear stresses (the right column) at the peak of systole (dash-dotted line), and the peak of diastole (dashed line) along a LAD axial line with different degree of stenosis: (a)25%; (b) 50%; (c) 75%.
Citation: Kaewbumrung M, Wiwatanapataphee B, Orankitjaroen S, Siriapisith T (2017) Numerical Simulation of Turbulent Blood Flow in the System of Coronary Arteries with Stenosis. J Biom Biostat 8: 344. doi: 10.4172/2155-6180.1000344
Page 13 of 13
Volume 8 • Issue 2 • 1000344J Biom Biostat, an open access journalISSN: 2155-6180
References
1. Pijls NH, van Son JA, Kirkeeide RL, De Bruyne B, Gould KL (1993) Experimental basis of determining maximum coronary, myocardial, and collateral blood flow by pressure measurements for assessing functional stenosis severity beforeand after percutaneous transluminal coronary angioplasty. Circulation, 87:1354-1367.
2. Jie J, Kobayashi S, Morikawa H, Tang D, Ku DN (2008) Influence of cycle change of distal resistance on flow and deformation in arterial stenosis model. IFMBE Proceedings 23: 1572-1575.
3. Tiari S, Ahmadpour BM, Tafazzoli-Shadpour M, Sadeghi MR (2011) Anexperimental study of blood flow in a model of coronary artery with single and double stenosis. 18th Iranian Conference on BioMedical Engineering.
4. Zafar H, Sharif F, Leahy MJ (2014) Measurement of the blood flow rate and velocity in coronary artery stenosis using intracoronary frequency domainoptical coherence tomography: Validation against fractional flow reserve. IJC Heart & Vasculature 5: 68-71.
5. Simon BR, Kaufmann MV, McAfee MA, Baldwin AL (1993) Finite elementmodels for arterial wall mechanics. J Biomech Eng 115: 489-496.
6. Stangeby DK, Ethier CR (2002) Computational analysis of coupled blood-wallarterial LDL transport. J Biomech Eng 124: 1-8.
7. Holzapfel GA, Gasser TC, Stadler M (2002) A structural model for theviscoelastic behaviour of arterial walls: Continuum formulation and Finiteelement analysis. European Journal of Mechanics - A/Solids 21: 441-463.
8. Karner G, Perktold K (2000) Effect of endothelial injury and increased bloodpressure on albumin accumulation in the arterial wall: a numerical study. JBiomechanics 33: 709-715.
9. Jung H, Choi JW, Park CG (2004) Asymmetric flows of non-Newtonian fluids in symmetric stenosed artery. Korea-Australia Rheology Journal 16: 101-108.
10. Chandran KB, Mun JH, Choi KK, Chen JS, Hamilton A, et al. (2003) A methodfor in-vivo analysis for regional arterial wall material property alterations withatheroclerosis: preliminary results. Medical Engineering and Physics 25: 289-298.
11. Chahboune, Crolet JM (1998) Numerical simulation of the blood-wall interaction in the human left ventricle. The European Physical Journal Applied Physics 2:291-297.
12. Gerbeau JF, Vidrascu M, Frey P (2005) Fluid-structure interaction in bloodflows on geometries based on medical imaging. Computers and structures 83: 155-165.
13. Bertolotti C, Deplano V, Fuseri J, Dupouy P (2001) Numerical and experimental models of post-operative realistic flows in stenosed coronary bypasses. J Biomech 34: 1049-1064.
14. Kagadis GC, Skouras ED, Bourantas GC, Paraskeva CA, Katsanos K, et al.(2008) Computational representation and hemodynamic characterizationof in vivo acquired severe stenotic renal artery geometries using turbulencemodeling. Medical Engineering & Physics 30: 647-660.
15. Banks J, Bressloff NW (2007) Turbulence modeling in three-dimensionalstenosed arterial bifurcations. J Biomechanical Engineering 129: 40-50.
16. Ghalichi F, Deng X, De Champlain A, Douville Y, King M, et al. (1998) LowReynolds number turbulence modeling of blood flow in arterial stenoses. Biorheology 35: 281-294.
17. Wilcox DC (2008) Formulation of the k-wTurbulence Model Revisited. AIAAJournal 46: 2823-2838.
18. Janelaa JA, Mouraa A, Sequeiraa A (2010) 3D non-Newtonian fluid -structure interaction model for blood flow in arteries. Journal of Computational and Applied Mathematics 234: 2783-2791.
19. Crosettoa P, Reymondb P, Deparisa S, Kontaxakisb D, Stergiopulosb N, et al.(2011) Fluid structure interaction simulation of aortic blood flow. Computers & Fluids, 43: 46-57.
20. Dick E, Steelant J (1997) Modeling of bypass transition with conditioned Navier-Stokes equations and the k-omega turbulence equations with a multigridmethod. Applied numerical mathematics 23: 49-61.
21. Zheng X, Liu C, Liu F, Yang CI (1998) Turbulent transition simulation using the model. Int J Numer Meth Engng 42: 907-926.
22. Valencia P, Burdiles M, Ignat J, Mura E, Bravo R, et al. (2013) Fluid structuralanalysis of human cerebral aneurysm using their own wall mechanicalproperties. Computational and Mathematical Methods in Medicine.
23. Wiwatanapataphee B (2008) Modelling of non-newtonian blood flow through stenosed coronary arteries, Dynamics of Continuous. Discrete and ImpulsiveSystems Series B: Applications and Algorithms 15: 619-634.
24. https://en.wikipedia.org/wiki/Turbulence_kinetic_energy
25. Hu ko B (2010) Experimental Measurement Of Arterial Mechanical Properties.Proceedings of PACAM XI, 11th Pan-American Congress of Applied Mechanics.
26. Mortazavinia Z, Arabi S, Mehdizadeh AR2 (2014) Numerical investigation ofangulation effects in stenosed renal arteries. J Biomed Phys Eng 4: 1-8.
27. Launder BE, Spalding DB (1974) The numerical computation of turbulent flows. Computer Methods in Applied Mechanics and Engineering 3: 269-289.
28. Johnston BM, Johnston PR, Corney S, Kilpatrick D (2004) Non-Newtonianblood flow in human right coronary arteries: steady state simulations. J Biomech 37: 709-720.
29. Wiwatanapataphee B, Wu YH, Siriapisith T, Nuntadilok B (2012) Effect ofbranches on blood flow in the system of human coronary arteries. Mathematical Biosciences and Engineering 9: 199-214.
30. Jenkins DR (1996) Numerical methods in laminar and turbulent flow. John Wiley and Sons Ltd.
31. Fei DY, Thomas JD, Rittgers SE (1994) The effect of angle and flow rate upon hemodynamics in distal vascular graft anatomoses: a numerical model study. J Biomechanical Engineering, 116: 331-336.
32. Driest ER (1996) On turbulence flow near a wall. Journal of the Aeronautical Sciences 23: 1007-1011.
33. Srivastava VP, Rastogi R (2009) Particulate suspension blood flow through a narrow catheterized artery. Computer & Mathematics with Applications 58:227-238.
34. Srivastava VP, Rastogi R (2010) Blood flow through a stenosed catheterized artery: Effects of hematocrit and stenosis shape. Computer & Mathematics with Applications 59: 1377-1385.
35. Potters WV, Marquering HA, VanBavel E, Nederveen AJ (2014) MeasuringWall Shear Stress Using Velocity-Encoded MRI. Current CardiovascularImaging Reports.
36. Fung YC (1993) Biomechanic. (2nd edition), Springer-Verlag, New York.