I NSURANCE : M ODELLING THE UNPREDICTABLE Vicky Gardner February 2013 1.
27
INSURANCE: MODELLING THE UNPREDICTABLE Vicky Gardner February 2013 1
-
Upload
sabina-clark -
Category
Documents
-
view
219 -
download
3
Transcript of I NSURANCE : M ODELLING THE UNPREDICTABLE Vicky Gardner February 2013 1.

1
INSURANCE: MODELLING THE UNPREDICTABLE
Vicky Gardner
February 2013

2
AGENDA
What is an actuary? What is insurance? Types of life insurance Pricing: How do we group people together to
charge an appropriate premium? Underwriting: How do we further differentiate
the prices for higher-risk individuals? Reserving: How do we make sure we have
enough capital to pay claims?
3
WHAT IS AN ACTUARY?
“Actuaries are experts in risk management. They use their mathematical skills to help measure the probability and risk of future events. This information is useful to many industries, including healthcare, pensions, insurance, banking and investments, where a single decision can have a major financial impact.”
Source: UK Actuarial Profession

4
WHAT DO ACTUARIES DO? Consultancies - offering advice on issues such as:
acquisitions and mergers, financing capital projects, occupational pension schemes.
Investment - involved in: research and on the pricing and management of investments, mitigating the risk of investments, using their understanding of insurance or pension liabilities to
manage the corresponding assets. Insurance
Investigate and analyse a huge range of numerical information, to create and price polices, to ensure they have the money to cover claims.
Pensions designing and advising on company pension schemes, placing a value on accumulated pension commitments.
5
WHAT IS INSURANCE? The transfer of risk from one party to another, in
exchange for payment Covers “insurable risks”:
Premium charged is high enough to cover risk cost and expenses
Nature of loss is financial and can be quantified Risk should be random to avoid anti-selection
For Life Insurance, the policyholder must have an “insurable interest” on the person they are insuring usually this means would be disadvantaged financially if
the insured party died the law says that you have an unlimited insurable
interest in yourself, your spouse or your civil partner. In practice, this extends to live-in partners
Involves pooling of risk
6
TYPES OF LIFE INSURANCE
Term assurance – pays on death only in term Level or decreasing With or without Critical Illness
Whole of Life – pays on death Income Protection – pays a monthly benefit
when cannot work due to illness/disability Pure Endowment – pays only on survival to
end of term Endowment Assurance – pays on death in
term or survival at end of term

7
HOW DOES IT WORK? Customer pays a regular premium to insurer Premium calculated to cover:
Average cost of payout + margin for adverse experience Future expenses Commission to brokers Profit Reinsurance costs Tax
On insured event (death, diagnosis of critical illness, signed off work due to illness etc), insurer will pay a lump sum/monthly benefit to policy owner/beneficiary
Payment only made if claim found to be valid It meets the definition No material missing/incorrect information on the original
application Policy may or may not terminate at that point

8
HOW DO WE PREDICT FUTURE CLAIMS? Pool the risk into homogenous groups that represent
similar risks Model the expected total payout over that group
e.g. risk of death = 5% Total people = 100 with sum assured of £10,000 each Total payout = 100 * 5% & £10k = £50,000
Divide the cost equally between the members of the group Total Premium per person = £500
Groups split by: Age Smoker Status (Sex) Occupation
Premiums adjusted further by underwriting
9
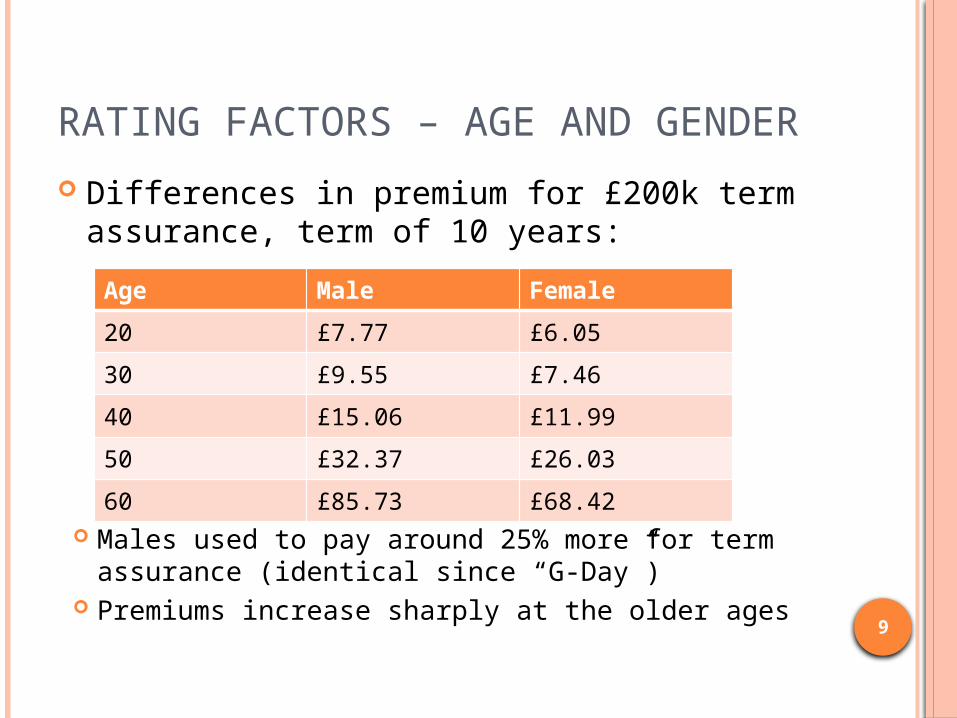
RATING FACTORS – AGE AND GENDER
Age Male Female
20 £7.77 £6.05
30 £9.55 £7.46
40 £15.06 £11.99
50 £32.37 £26.03
60 £85.73 £68.42
Differences in premium for £200k term assurance, term of 10 years:
Males used to pay around 25% more for term assurance (identical since “G-Day”)
Premiums increase sharply at the older ages

10
LIFE EXPECTANCY BY GENDER
Until 21st December 2012, term assurance premiums for females were lower than for males
European Court of Justice (ECJ) ruled this illegal – gender can no longer be used in EU
Statistics show differences do exist ECJ argue that the differences are due to socio-
economic and lifestyle factors Other evidence suggests other reasons:
More active hearts in females Testosterone increases risky behaviour, cholesterol
A few countries where difference is reversed: Zimbabwe, Lesotho, Swaziland, Afghanistan

11
RATING FACTORS - SMOKING
Age Non-smoker Smoker
30 £13.32 £20.19
40 £23.12 £42.61
50 £51.94 £119.06
60 £163.27 £343.95
Differences in premium for £300k term assurance, term of 15 years:
Smokers pay considerably more for term assurance
Differential increases with age

12
LIFE EXPECTANCY BY COUNTRY
Country of residence has a large impact on life expectancy: Disease prevalence Medical facilities Lifestyle Types of work
Estimates of different countries’ life expectancies: Monaco – 89.7 Japan – 83.9 UK – 80.2 USA – 78.5 Nigeria – 52.0 South Africa – 49.4

13
LIFE EXPECTANCY BY REGION - UK
Within countries, large differences exist Lowest male life expectancies:
Inverclyde – 73.0 Glasgow – 71.6 Blackpool – 73.6
Highest: Kensington & Chelsea – 85.1 Westminster – 83.8 East Dorset – 82.0
Source: Office of National Statistics - 2009
14
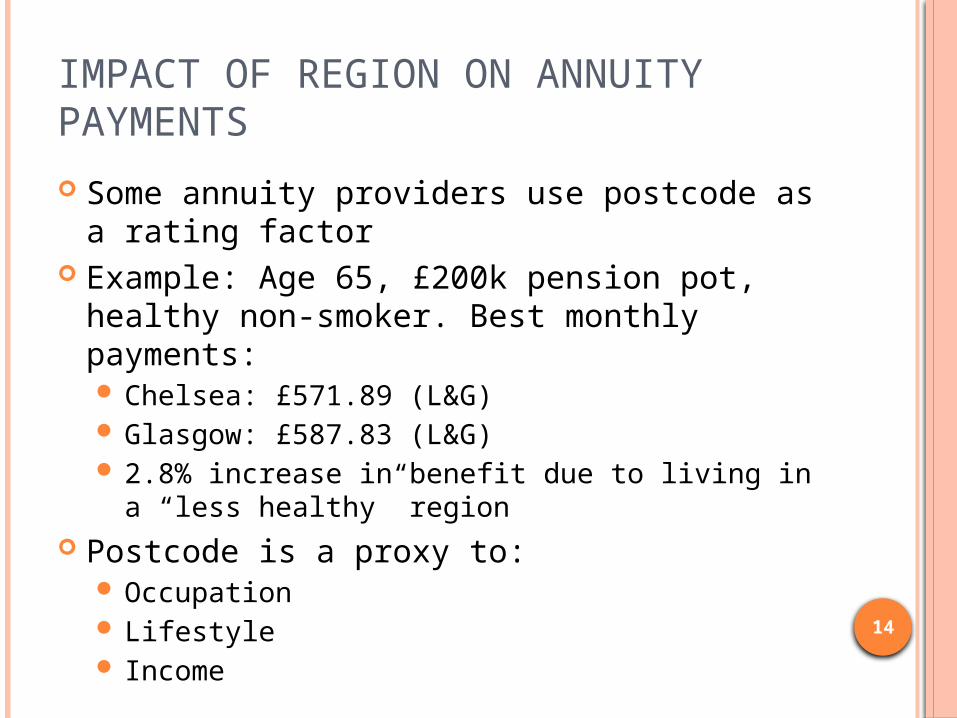
IMPACT OF REGION ON ANNUITY PAYMENTS
Some annuity providers use postcode as a rating factor
Example: Age 65, £200k pension pot, healthy non-smoker. Best monthly payments: Chelsea: £571.89 (L&G) Glasgow: £587.83 (L&G) 2.8% increase in benefit due to living in a “less
healthy” region Postcode is a proxy to:
Occupation Lifestyle Income
15
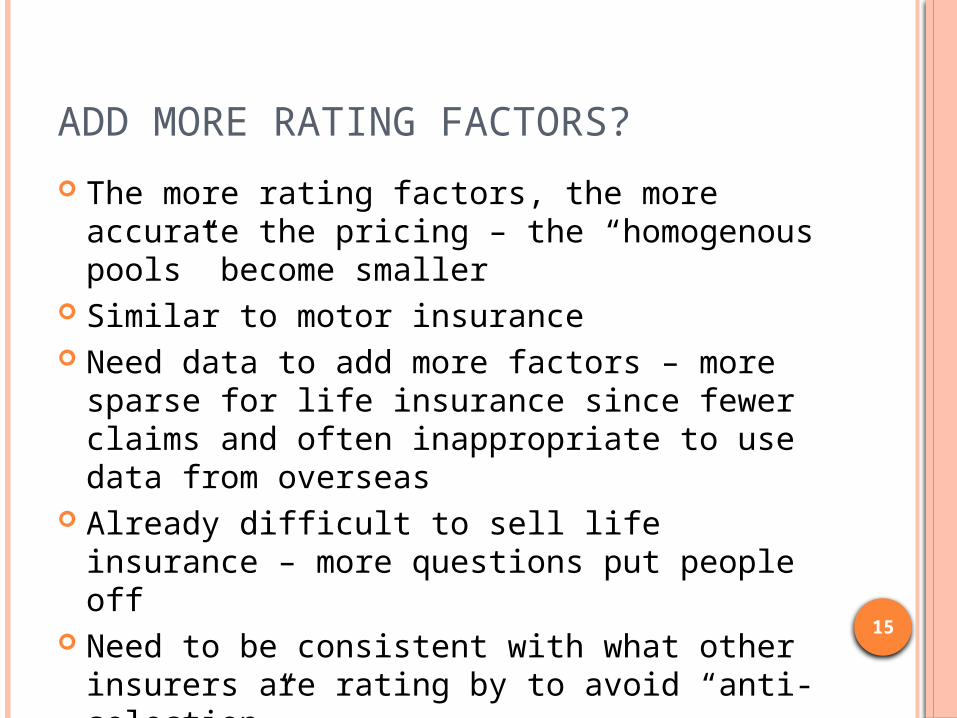
ADD MORE RATING FACTORS?
The more rating factors, the more accurate the pricing – the “homogenous pools” become smaller
Similar to motor insurance Need data to add more factors – more sparse
for life insurance since fewer claims and often inappropriate to use data from overseas
Already difficult to sell life insurance – more questions put people off
Need to be consistent with what other insurers are rating by to avoid “anti-selection”

16
UNDERWRITING Around 60% of applicants for life insurance will get the
headline premium shown on the initial quote (based on basic information only)
Before a policy is taken out, the applicant must undergo underwriting. Consists of: Medical questions, including family history Lifestyle questions e.g. alcohol consumption, dangerous
activities Financial questions – is sum assured reasonable compared with
salary? Some applicants will then:
have a rating applied e.g. premium is increased by 50% have an exclusion applied e.g. won’t pay out if cancer
diagnosed (will still usually pay out on death) be declined (temporarily or permanently)
Need to balance the cost of underwriting with the better risk classification it allows
17
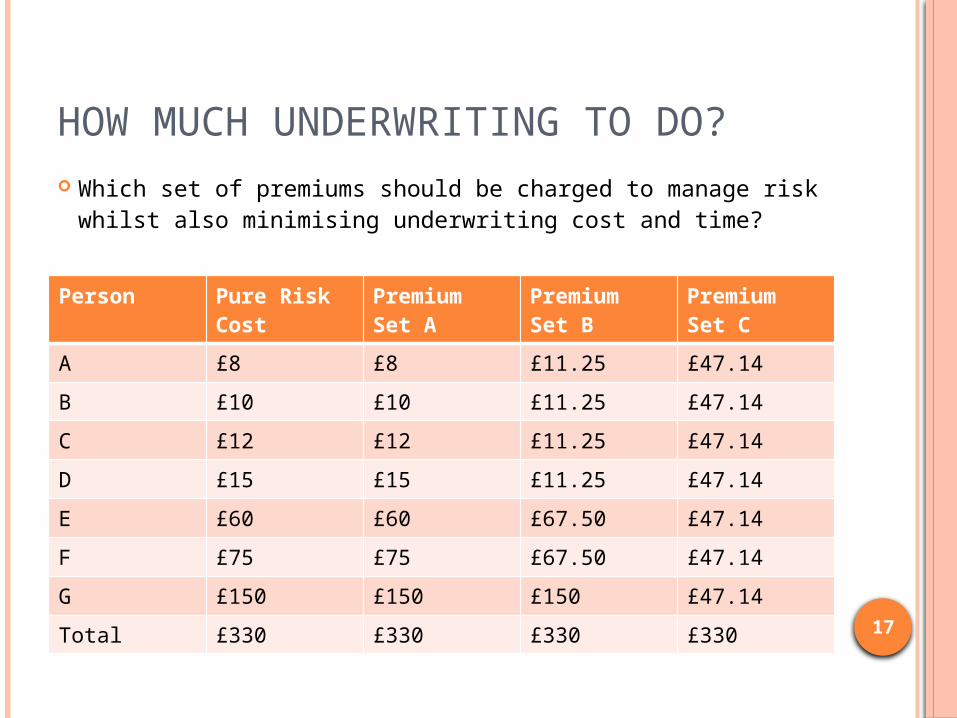
HOW MUCH UNDERWRITING TO DO?
Person Pure Risk Cost
Premium Set A
Premium Set B
Premium Set C
A £8 £8 £11.25 £47.14
B £10 £10 £11.25 £47.14
C £12 £12 £11.25 £47.14
D £15 £15 £11.25 £47.14
E £60 £60 £67.50 £47.14
F £75 £75 £67.50 £47.14
G £150 £150 £150 £47.14
Total £330 £330 £330 £330
Which set of premiums should be charged to manage risk whilst also minimising underwriting cost and time?
18
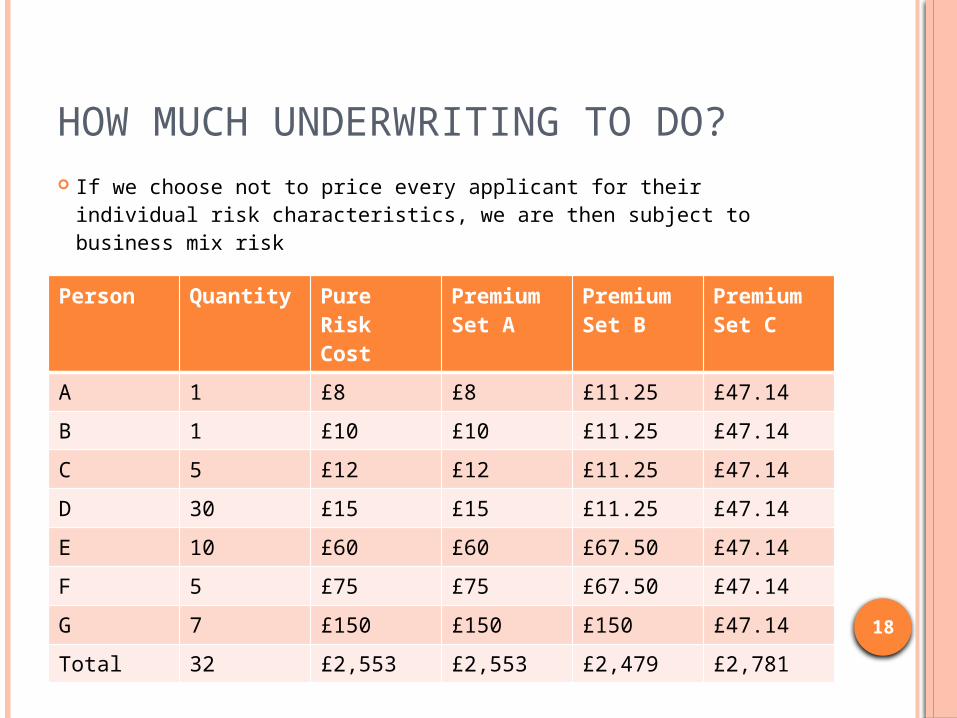
HOW MUCH UNDERWRITING TO DO?
Person Quantity Pure Risk Cost
Premium Set A
Premium Set B
Premium Set C
A 1 £8 £8 £11.25 £47.14
B 1 £10 £10 £11.25 £47.14
C 5 £12 £12 £11.25 £47.14
D 30 £15 £15 £11.25 £47.14
E 10 £60 £60 £67.50 £47.14
F 5 £75 £75 £67.50 £47.14
G 7 £150 £150 £150 £47.14
Total 32 £2,553 £2,553 £2,479 £2,781
If we choose not to price every applicant for their individual risk characteristics, we are then subject to business mix risk

19
SENTINEL EFFECT
The sentinel effect in underwriting refers to the tendency for unhealthy individuals to apply for insurance coverage where testing is not performed
This is ok as long as it is priced for The risk comes when other insurers do test
for the condition so we get a disproportionate share of higher-risk individuals.
20
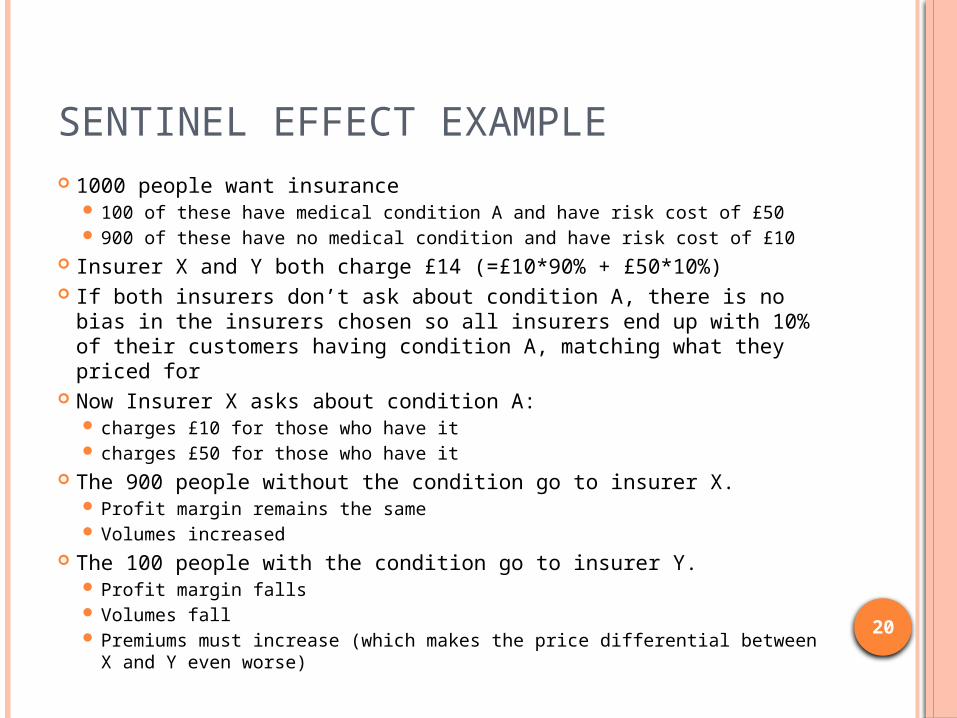
SENTINEL EFFECT EXAMPLE 1000 people want insurance
100 of these have medical condition A and have risk cost of £50 900 of these have no medical condition and have risk cost of £10
Insurer X and Y both charge £14 (=£10*90% + £50*10%) If both insurers don’t ask about condition A, there is no bias in
the insurers chosen so all insurers end up with 10% of their customers having condition A, matching what they priced for
Now Insurer X asks about condition A: charges £10 for those who have it charges £50 for those who have it
The 900 people without the condition go to insurer X. Profit margin remains the same Volumes increased
The 100 people with the condition go to insurer Y. Profit margin falls Volumes fall Premiums must increase (which makes the price differential between
X and Y even worse)

21
ANTI-SELECTIVE BEHAVIOUR
People who know they are a greater risk but the insurer does not – information asymmetry
For example, the applicant has a medical condition not covered by the underwriting questions (cannot ask for genetic test results)
Also occurs later on in the policy. A customer in good health is more likely to lapse than a customer is poor health. End up with a higher mortality rate than priced
for as more weighted towards the unhealthy people
These customers also more likely to take out options to increase sum assured

22
SETTING UP RESERVES
In the UK, most life insurance policies are paid for by level monthly premiums
For example, a 30 year old taking out a 20-year policy may pay £12 per month. At the start of that term, the risk that customer
represents is much lower than £12 At the end of that term, the customer is almost 50
and the risk that customer represents is much higher than £12
So early premiums cross-subsidise later premiums We need to hold back some of the premiums
in reserve to cover expected future claims How do we calculate how much to hold back?

23
SETTING UP RESERVESYear 1 2 3 4 5 6 7 Total
Premium £100 £100 £100 £100 £100 £100 £100
Average Claim Cost
£30 £35 £50 £70 £90 £115 £135
Profit (no reserves)
£70 £65 £50 £30 £10 -£15 -£35 £175
Reserve Set-Up £0 £0 -£10 -£30 -£10 +£15 +£35
Total Reserve at end of year
£0 £0 £10 £40 £50 £35 £0
Profit (with reserves)
£70 £65 £40 £0 £0 £0 £0 £175
If we took the profit as it is made, we would make a loss in later years and not have enough capital to pay claims
So we need to set aside reserves to cover future claims and delay the release of profits
24
SETTING UP RESERVES
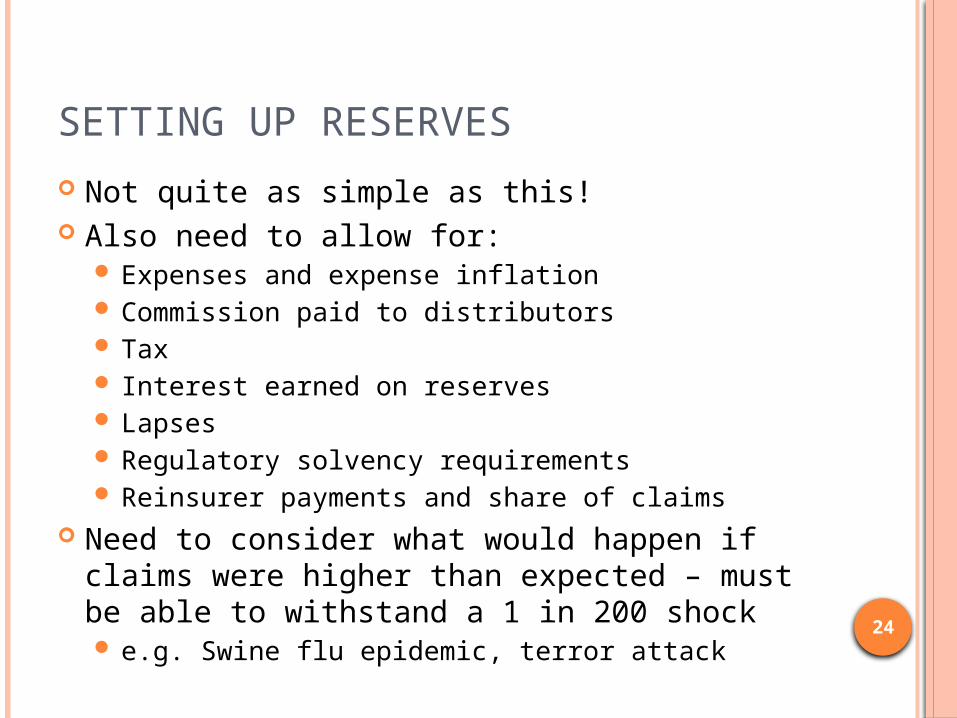
Not quite as simple as this! Also need to allow for:
Expenses and expense inflation Commission paid to distributors Tax Interest earned on reserves Lapses Regulatory solvency requirements Reinsurer payments and share of claims
Need to consider what would happen if claims were higher than expected – must be able to withstand a 1 in 200 shock e.g. Swine flu epidemic, terror attack
25
HOW DO WE MODEL SHOCKS?
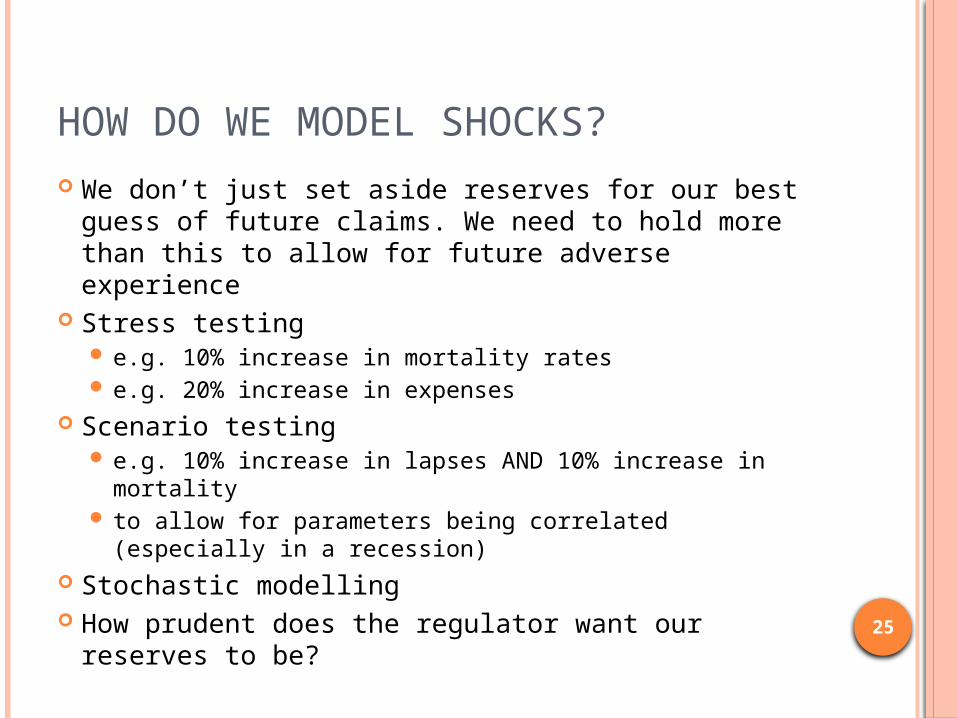
We don’t just set aside reserves for our best guess of future claims. We need to hold more than this to allow for future adverse experience
Stress testing e.g. 10% increase in mortality rates e.g. 20% increase in expenses
Scenario testing e.g. 10% increase in lapses AND 10% increase in
mortality to allow for parameters being correlated (especially in
a recession) Stochastic modelling How prudent does the regulator want our
reserves to be?

26
SUMMARY
Life insurance is a long-term business and modelling the full lifetime of the business is crucial
Uncertainty needs to be allowed for as much as possible but Need to remain competitive Cannot wait till end of policy to release profit
(unhappy shareholders) Actuaries play a critical part in:
Pricing the risk appropriately Ensuring enough capital is put aside to meet
claims

27
Any Questions?