I NCLUSIVE BUSINESS MA RKET STUDY FOR INDIA AND SRI...
81
INCLUSIVE BUSINESS MARKET STUDY FOR INDIA AND SRI LANKA DRAFT FINAL REPORT OCTOBER 30, 2012
Transcript of I NCLUSIVE BUSINESS MA RKET STUDY FOR INDIA AND SRI...

INCLUSIVE BUSINESS MARKET STUDY
FOR INDIA AND SRI LANKA
DRAFT FINAL REPORT
OCTOBER 30, 2012

ADB Inclusive Business Market Study for India and Sri Lanka Final Draft Report
1
List of abbreviations used
ADB Asian Development Bank
BOP Base of the pyramid
BMGF Bill & Melinda Gates Foundation
DFI Development finance institution
DFID Department for International Development
ESG Environmental, Social and Governance (criteria for investment)
FDI Foreign direct investment
FMO Netherlands Development Finance Company
GDP Gross domestic product
GDP (PPP) Gross domestic product at purchasing power parity
HDI Human development index
IB Inclusive business
IFC International Finance Corporation
IPO Initial public offering
IRR Internal rate of return
JICA Japan International Cooperation Agency
KfW Kreditanstalt für Wiederaufbau, a German government-owned development bank
LIS Low-income states
LP Limited partner
MPI Multidimensional poverty index
NORFUND Norwegian Government’s Investment Fund for Developing Countries
NSDC National Skill Development Corporation
PE Private equity
R & D Research and development
SIDA Swedish International Development Cooperation Agency
SIDBI Small Industries Development Bank of India
SME Small and medium enterprises
Swedfund Swedish Government’s Investment Fund for Developing Countries
TA Technical assistance
VC Venture capital
ADB Inclusive Business Market Study for India and Sri Lanka Final Draft Report
2
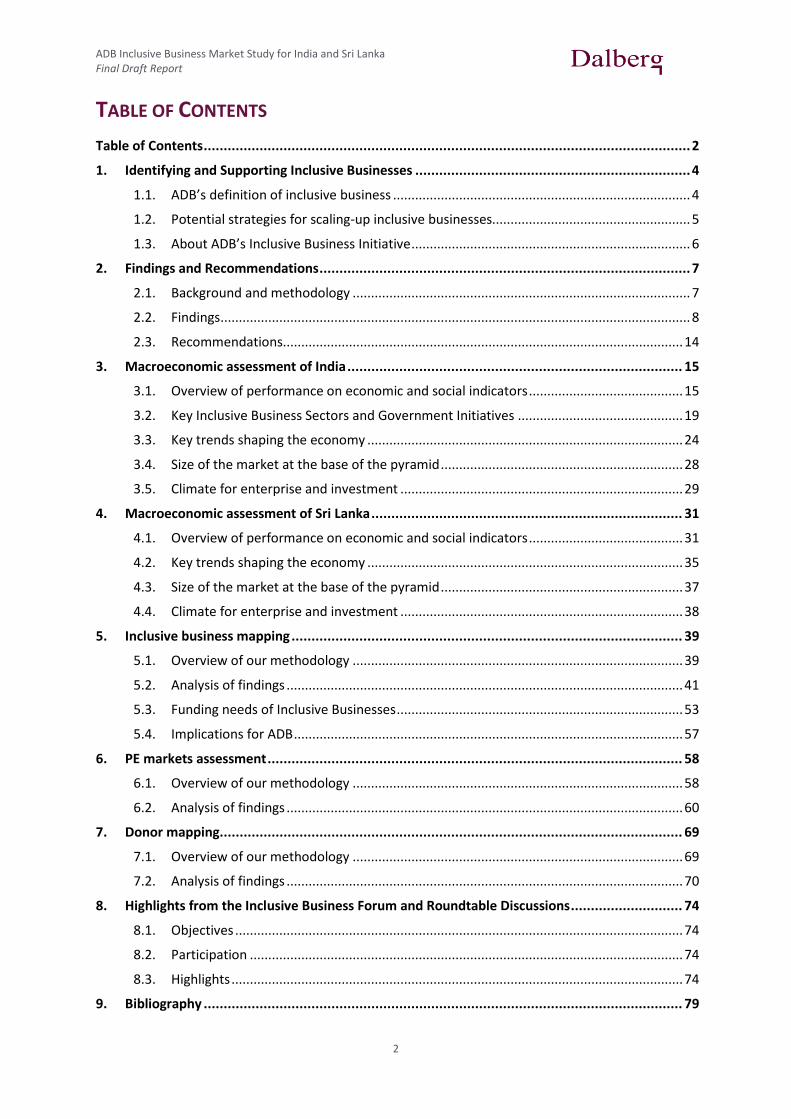
TABLE OF CONTENTS
Table of Contents .......................................................................................................................... 2
1. Identifying and Supporting Inclusive Businesses ..................................................................... 4
1.1. ADB’s definition of inclusive business ................................................................................. 4
1.2. Potential strategies for scaling-up inclusive businesses...................................................... 5
1.3. About ADB’s Inclusive Business Initiative ............................................................................ 6
2. Findings and Recommendations ............................................................................................. 7
2.1. Background and methodology ............................................................................................ 7
2.2. Findings................................................................................................................................ 8
2.3. Recommendations............................................................................................................. 14
3. Macroeconomic assessment of India .................................................................................... 15
3.1. Overview of performance on economic and social indicators .......................................... 15
3.2. Key Inclusive Business Sectors and Government Initiatives ............................................. 19
3.3. Key trends shaping the economy ...................................................................................... 24
3.4. Size of the market at the base of the pyramid .................................................................. 28
3.5. Climate for enterprise and investment ............................................................................. 29
4. Macroeconomic assessment of Sri Lanka .............................................................................. 31
4.1. Overview of performance on economic and social indicators .......................................... 31
4.2. Key trends shaping the economy ...................................................................................... 35
4.3. Size of the market at the base of the pyramid .................................................................. 37
4.4. Climate for enterprise and investment ............................................................................. 38
5. Inclusive business mapping .................................................................................................. 39
5.1. Overview of our methodology .......................................................................................... 39
5.2. Analysis of findings ............................................................................................................ 41
5.3. Funding needs of Inclusive Businesses .............................................................................. 53
5.4. Implications for ADB .......................................................................................................... 57
6. PE markets assessment ........................................................................................................ 58
6.1. Overview of our methodology .......................................................................................... 58
6.2. Analysis of findings ............................................................................................................ 60
7. Donor mapping.................................................................................................................... 69
7.1. Overview of our methodology .......................................................................................... 69
7.2. Analysis of findings ............................................................................................................ 70
8. Highlights from the Inclusive Business Forum and Roundtable Discussions ............................ 74
8.1. Objectives .......................................................................................................................... 74
8.2. Participation ...................................................................................................................... 74
8.3. Highlights ........................................................................................................................... 74
9. Bibliography ........................................................................................................................ 79

ADB Inclusive Business Market Study for India and Sri Lanka Final Draft Report
3
List of Figures
Figure 1: Classification of business models ............................................................................................. 4 Figure 2: Potential strategies for scaling up inclusive business activities ............................................... 5 Figure 3: Framework to organize insights collected in the study ........................................................... 7 Figure 4: Total and equity-only FDI inflows into India .......................................................................... 15 Figure 5: Gross domestic product (GDP) at PPP ................................................................................... 15 Figure 6: Historic and planned sector growth rates ............................................................................. 16 Figure 7: Contribution of sectors to GDP and labour force employment ............................................. 17 Figure 8: Percentage of India's population in 9 poorest states ............................................................ 18 Figure 9: Half of the households in India do not have access to basic sanitation facilities ................. 21 Figure 10: Projections for India's working age population ................................................................... 25 Figure 11: Distribution of urban and rural population ......................................................................... 25 Figure 12: Increase in the number of urban towns .............................................................................. 26 Figure 11: Annual household consumer expenditure in India (1987-2010) ......................................... 27 Figure 14: Market size of India's BOP ................................................................................................... 28 Figure 15: India's credit ratings by various rating agencies .................................................................. 30 Figure 16: Gross domestic product of South and Southeast Asian countries ...................................... 31 Figure 17: Weighted contribution to GDP growth rate by sectors ....................................................... 32 Figure 18: Composition of FDI inflows .................................................................................................. 33 Figure 19: Age profile of Sri Lanka’s population ................................................................................... 35 Figure 20: Unemployment in Sri Lanka by education level and age group .......................................... 36 Figure 21: Segmentation of market at the base of the pyramid .......................................................... 37 Figure 22: List of IBs whom we conducted in-person interviews with ................................................. 39 Figure 23: Distribution of survey respondents ..................................................................................... 40 Figure 24: Primary BOP engagement mode of survey respondents ..................................................... 41 Figure 25: Additional BOP modes of engagement ................................................................................ 42 Figure 26: Consumer model strategies ................................................................................................. 42 Figure 27: Distributor model strategies ................................................................................................ 43 Figure 28: Supplier model strategies .................................................................................................... 44 Figure 29: Employee model strategies.................................................................................................. 44 Figure 30: Benefits to company of being inclusive ............................................................................... 45 Figure 31: Benefits to the BOP of inclusive businesses ........................................................................ 46 Figure 32: Level of social impact measurement ................................................................................... 47 Figure 33: Geographical spread of IB operations ................................................................................. 48 Figure 34: Perceptions of operating in low-income states ................................................................... 49 Figure 35: Critical growth factors .......................................................................................................... 49 Figure 36: Key risk factors ..................................................................................................................... 50 Figure 37: Equity received to date ........................................................................................................ 53 Figure 38: Debt received to date .......................................................................................................... 53 Figure 39: Credit guarantees received to date ..................................................................................... 54 Figure 40: Required investment size, by sector .................................................................................... 54 Figure 41: Investment size by geography and mode of engagement ................................................... 55 Figure 42: Ideal grant-funded investments .......................................................................................... 55 Figure 43: List of fund managers interviewed ...................................................................................... 58 Figure 44: Composition of Dalberg's sample of 21 fund managers ...................................................... 59 Figure 45: Market capitalization of countries in South and Southeast Asia ......................................... 60 Figure 46: Number and volume of PE (non real estate) investments in India ...................................... 60 Figure 47: Responses to the question: "What is your general outlook for India's economy?" ............ 61 Figure 48: Sector prioritization analysis ................................................................................................ 64 Figure 49: Illustrative approaches of major investors deploying equity/debt to IBs in India............... 70 Figure 50: Exposure of major investors deploying equity/debt to priority sectors in South Asia ........ 71 Figure 51: Participation at the three inclusive business events in India & Sri Lanka ............................ 74

ADB Inclusive Business Market Study for India and Sri Lanka Final Draft Report
4
1. IDENTIFYING AND SUPPORTING INCLUSIVE BUSINESSES
1.1. ADB’S DEFINITION OF INCLUSIVE BUSINESS
The ADB defines Inclusive Businesses (IBs) as those profit making companies that bring systemic impact in scale to the poor and vulnerable people under the $3 international poverty line (i.e. about 60% percent of developing Asia’s population). These Inclusive Businesses are focused on making a reasonable profit (an IRR of 10-20%) while contributing to systemic impact on the lives of the poor. This can occur in a number of ways – specifically including the poor as suppliers, consumers, employees, and distributors.
As described in Figure 1 below, Inclusive Businesses differ from social enterprises and corporate social responsibility activities in their realized profit making motive/ability to offer market returns, as well as the scale of positive externalities generated. This results in their needing larger investments than social enterprises. Many IBs, particularly those that have attained scale in operations, deliver market returns or above market returns on par with commercial businesses enabling them to access a large spectrum of commercially-oriented funding sources including stock markets.
However, the number of standalone IBs in Asia that have attained that level of scale is very low. There are very few examples of companies like Jain Irrigation Systems Limited, the world’s second largest irrigation company in the world with a customer base of 1.2 million farmers across developing countries, which are listed on the Bombay Stock Exchange. There are many more enterprises that are still in the ‘social enterprise’ category, the bulk of which are relatively small in size. In India, the ADB found 150 social enterprises of which 90% had annual revenues of USD 500,000 or less1. Again, while there are a number of examples of established commercial business houses like Unilever and Nestle expanding their businesses in ways that are inclusive2 in Asia, there is limited understanding of the kind of external support that might help scale these initiatives or inspire other established commercial businesses, especially those that aren’t multinationals.
Therefore, in addition to finding ways to help existing IBs expand, ADB’s Inclusive Business initiative must to understand how to support the growth of social enterprises into inclusive businesses and how to promote greater inclusivity among commercial or traditional businesses.
Figure 1: Classification of business models
1 India Social Enterprise Landscape Report, ADB, 2012 2 Unilever has pioneered a direct-to-home distribution model in India for which they engage over 45,000 women from base-of-pyramid populations as distributors for the products, significantly enhancing their monthly income. Nestle’s milk district model wherein dairy farmers are now provided with continuous training, technology and skill development touches farmers in 30 countries globally.
Market returns
Business
Below market
Social enterprise
Above market returns
Low HighPositive externalities 1
Inclusive Business
1 Improvement in human development indicators Source: Dalberg analysis

ADB Inclusive Business Market Study for India and Sri Lanka Final Draft Report
5
1.2. POTENTIAL STRATEGIES FOR SCALING-UP INCLUSIVE BUSINESSES
Inclusive business activities can be promoted by supporting and scaling-up inclusive businesses, social enterprises and inclusive operations of corporate firms. The ADB, in its role as the anchor DFI for Asia, is most suited to addressing gaps in terms of finances required to scale IB activities. Dalberg’s team has identified a broad set of potential strategies for ADB to follow in supporting growth of IB activities. These potential strategies vary by type of organization - Inclusive Businesses, Social Enterprises and traditional businesses.
Figure 2: Potential strategies for scaling up inclusive business activities
a) Potential strategies to support existing Inclusive Businesses
Address equity requirements as many businesses may still be years away from an IPO and/or may be operating in markets with limited private equity activity
Provide concessional debt to finance working capital requirements that tend to be sizeable in businesses that have attained a certain scale
Offer technical assistance to help companies strengthen areas that are typically under-invested in, but those that generate long-term benefits such as R&D or training
b) Potential strategies to support social enterprises scale-up to become inclusive businesses
Address ‘early growth’ equity requirements beyond the scope of seed and social venture capital, i.e. look to supplement the efforts of existing impact investors
Address debt requirements of equity investees of existing impact investors so that equity goes further, especially where access to formal debt sources is restricted
Offer technical assistance /grant support to help companies invest in areas that are typically under-invested due to long-term, ‘public good’ nature of returns
c) Potential strategies to make commercial businesses more inclusive
Offer concessional debt to account for higher risk and value of social benefit created by firms wishing to expand inclusive operations
Offer a credit guarantee facility to select sectors or sub-sectors that deliver high impact
The bank must adopt a tailored approach that’s appropriate to the needs of the local businesses in each of the geographies in which is seeks to support IBs. The main focus of this report is the
BusinessInclusive Business
Below market
Social enterprise
Above market returns
Low HighPositive externalities 1
1 Improvement in human development indicatorsSource; Dalberg analysis
ADB Inclusive Business Market Study for India and Sri Lanka Final Draft Report
6
approach the ADB should adopt to grow IB activity in India and Sri Lanka with a particular focus on whether and how a dedicated IB PE fund could be relevant and effective.
1.3. ABOUT ADB’S INCLUSIVE BUSINESS INITIATIVE
First approved in 2008 and refined in 2010, ADB engaged in an initiative to stimulate IB in Asia and the Pacific. An initial technical assistance (TA) project aimed to develop inclusive business ventures in 6 (later broadened to 10) target Asian countries (Bangladesh, India, Indonesia, Pakistan, the Philippines and Viet Nam; later to include Cambodia, Lao PDR, Sri Lanka, and Thailand) and prepare them for project financing through the development of national/sub-regional private equity funds. The project is co-implemented, and leveraged where appropriate, with the Netherlands' Development Organization SNV and the networks and assets of the World Business Council for Sustainable Development (WBCSD). The Ford Foundation is supporting the work in Indonesia.
The initiative aims to:
• perform market studies in 10 Asian countries with the results to be discussed in country investment roundtables and regional inclusive businesses fora;
• develop an impact assessment tool for possible ADB investments;
• build up the first inclusive businesses investment fund for the Mekong region;
• work on the creation of a technical assistance facility (2013-2016) together with other donors who support inclusive business activities in Asia.
• promote further knowledge exchange with development partners, including IDB, World Business Council for Sustainable development, SIDA, DFID, Ford Foundation, KfW, and development institutions in Japan, among others.

ADB Inclusive Business Market Study for India and Sri Lanka Final Draft Report
7
2. FINDINGS AND RECOMMENDATIONS
2.1. BACKGROUND AND METHODOLOGY
In May 2012, the ADB commissioned Dalberg Global Development Advisors to undertake a study on the Inclusive Business3 Market in India and Sri Lanka as part of a larger project titled “Promoting Inclusive Growth through Business Development at the Base of the Pyramid”.
The objective of the market study was to assess the feasibility of setting up an inclusive business (IB) private equity fund in India and Sri Lanka. Dalberg’s analysis focused on answering the following key questions:
(1) Relevance. Is PE funding relevant for the growth of IBs in India and Sri Lanka? (2) Strategy. What should ADB’s investment strategy be? (3) Operationalisation. How should ADB’s fund be operationalised?
These key areas of analysis - relevance, strategy and operationalisation – were then broken down into sub-questions as described in the table below:
Figure 3: Framework to organize insights collected in the study
Dalberg’s approach had four distinct parts:
A. Assessment of macroeconomic and microeconomic conditions in India and Sri Lanka B. Mapping of inclusive businesses operating in India and Sri Lanka through an online survey of
130 businesses, and interviews with 20 potential investees for ADB C. Assessment of strength of capital markets in both countries through interviews with 21 fund
managers with exposure to inclusive businesses D. Mapping of potential co-investors (donors) in ADB’s fund through interviews with 11
agencies including family foundations, banks, DFI-funded investors and bilateral aid agencies
3 As defined by ADB, the Base of the Pyramid (BOP) is defined as individuals earning $3-$4 per day, per capita,
or less. Inclusive businesses are enterprises that engage the BOP in their core business operations as either:
consumers, distributors, suppliers or employees
7
Our analysis is presented along 3 topics:(1) Relevance of ADB’s potential IB fund, (2) investment strategy and (3) fund operationalisation
Key questions addressed in our study
Relevance
a. Are macroeconomic conditions conducive for IB growth?
b. Are macroeconomic and business conditions favorable for VC/PE investment?
c. Is there demand from inclusive businesses to seek out VC/PE investment?
Strategy
a. What size of enterprise and investment should the fund target?
b. Which sectors should the fund prioritize?
c. Should geography be a factor, and if so, where should the fund focus?
d. Which financial instruments should the fund deploy?
e. Should mode of engagement be an investment criterion?
f. Which company-specific parameters should influence investment decisions?
Operationalisation
a. How should ADB engage existing PE funds investing in IBs?
b. Who should ADB target to raise funds from?
c. What are some other key considerations to set the IB fund up for success?
METHODOLOGY
ADB Inclusive Business Market Study for India and Sri Lanka Final Draft Report
8
The detailed methodology adopted within each of these work streams is described in the relevant sections of the report.
2.2. FINDINGS
This section presents our findings in detail, organized by the three broad questions outlined at the start of this chapter: Relevance, Strategy, and Operationalisation.
RELEVANCE Private equity funding is relevant for the growth of small and medium IBs in both India and Sri Lanka, however diverse conditions warrant a differentiated approach to investment in both countries. In India the need for equity is being met to some extent by the existing investment community including impact investors, whereas in Sri Lanka the nascent venture capital and private equity market implies a scarcity of equity and the need for intervention. Debt requirement for growth stage businesses in both countries is very large and not being addressed due to the stringent collateral requirements of banks in India and the challenges of accessing debt at reasonable terms in Sri Lanka.
In order to assess relevance of an ADB intervention to support Inclusive Businesses in India and Sri Lanka, Dalberg’s team looked at both demand and supply factors. On the demand-side, we examined whether macroeconomic conditions support the growth of IBs and whether IBs look to PE firms to support their growth. On the supply-side, we looked at whether macroeconomic conditions and capital markets support PE investment.
In India, the growth of private business is supported by the country’s positive long-term economic prospects driven by favourable demographics and consumption growth. The segment of the private sector expected to grow the fastest is the collection of approximately 12 million ‘small and medium enterprises’ (SMEs) that employ over 30 million people. Within this large set, there are thousands of inclusive businesses that engage members of India’s vast BOP population (>1 billion) and need growth financing in the range of $1-10 million. Impact investors are particularly optimistic about the growth of enterprises that provide access to basic services like energy, water, education and health as India’s massive BOP population suffers deprivation across multiple development parameters4. On whether IBs are turning to PE funds for support, we found that among the SMEs that qualify as inclusive businesses, at least 75-100 business are receiving equity support from designated impact investors5 in India. This figure does not include those whose equity needs are being met by pure commercial funds.
Most of the IBs we spoke with, expressed a greater need for support in securing debt to meet their working capital requirements. The larger need for debt is supported by a recent IFC-sponsored publication that found that the addressable gap in debt financing for the Micro, Small and Medium Enterprise sector in India stood at $58 billion while the gap for equity stood at $38 billion6. The same study found that it is the collateral requirements of commercial banks, which account for 80% of existing lending to the MSME sector, that are the key barrier to debt. Almost all banks insist on
4 India’s 2011 HDI rank was 134th of187 countries and MPI for the same year stood at 0.283 putting it at 76
th of
209 countries in 2011 5 There are over 15 impact investors in India with more than $750 million in committed capital
6 Micro, Small and Medium Enterprise Finance Market in India, International Finance Corporation, 2012
ADB Inclusive Business Market Study for India and Sri Lanka Final Draft Report
9
immovable collateral to hedge against risk of default. The study found that the typical collateral to credit ratio is estimated between 125% and 170%. Even though a credit guarantee facility has been instituted to support collateral-free debt up to INR 10 million ($ 0.2 million) by institutions like the Small Industries Development Bank of India (SIDBI), this facility remains underutilized at less than 5% of the overall debt to the sector. While collateral-free debt is growing gradually, collateralized debt continues to account for 95%-98% of MSME credit.
On the equity front, while there are at least 15-20 dedicated impact investors investing in IBs in India, with more than $750 million in committed capital, there is definitely scope to deploy more funds. For the VC/PE community (supply-side), India‘s most attractive features are the size of its stock market, IPO issuing activity and expected economic growth. PE market statistics show that the number of deals is increasing, indicative of more opportunities for PE investment. While an unclear regulatory environment and inadequate infrastructure do pose challenges to doing business in the country, we feel that these will dissipate over a 10-year period. Thus, the conditions are suitable for making equity investments in IBs in India.
In Sri Lanka, conditions warrant a different, more measured approach. Sri Lanka’s economy has grown at more than 8% since 2009, when its 26-year long civil war ended. The government has initiated a number of measures to stimulate the growth of businesses in sectors like tourism where the target is to attract 1.5 million tourists by 2016 from 850,000 in 2011. The results of these efforts are beginning to show – from 2011 to 2012 the country jumped nine places in the Doing Business Rankings and is ranked 89th of 183 countries, which is second best (behind Maldives) in the South Asia region.
Fund managers (there are two active PE funds at present bringing in foreign investments) expect investment opportunities to emerge in the SME sector, especially in services and manufacturing companies catering to the needs of larger firms in inherently inclusive sectors like tourism, agri-business and renewable energy. These businesses are expected to engage hundreds of BOP members as employees and suppliers addressing Sri Lanka’s problems of a high youth unemployment rate (20%). Consumer-oriented IBs are less relevant in Sri Lanka due to the relatively small BOP population (<2% of India’s at 12 million people) and the high level of access to basic services contributing to Sri Lanka’s low multi-dimensional poverty score of 0.021 compared to India 0.283.
It must also be kept in mind that PE is a relatively new asset class in Sri Lanka. The total number of investible opportunities ready to absorb PE funds is said to be in the range of 100-150. This number is hard to verify as accessing opportunities in Sri Lanka is entirely dependent on proprietary networks, unlike in India where the PE market is highly intermediated. Many IBs we spoke with expressed a preference for concessionary debt over equity given the prevailing high interest rates. A lot of groundwork will need to be done to convince business owners to sell their stake. Exit options must also be thoroughly explored before investment. The corpus of money raised by IPOs on the Colombo Stock Exchange increased nearly fivefold from 2010 to 2011, but the LKR 19.2 billion ($165 million) raised by the 13 listings in 2011, is small in absolute terms. Overall market capitalization as a percentage of GDP continues to remain very low at 40.2% of GDP, compared to other nations like India (93.6%), Philippines (78.8%) and Indonesia (51%).
It is clear that in Sri Lanka, while the need for debt on concessionary terms is large, there is a strong case for equity support from development banks for small and medium-sized inclusive businesses, especially those that engage the BOP as suppliers and employees. While the Sri Lankan PE market presents risks associated with a nascent market, we believe these risks can be effectively managed by taking a measured approach to investment. ADB should set aside a limited amount to invest through an experienced fund manager with the expectation of making 1-2 IB investments a year initially.
ADB Inclusive Business Market Study for India and Sri Lanka Final Draft Report
10
STRATEGY
Our findings in response to the question of what the fund’s strategy should be are divided into six parts:
a) Instruments and returns expectation b) Target size of IBs’ investment requirement c) Sector focus d) Geographic focus e) Mode of engagement f) Other criteria for investment
a) Instruments and returns expectations
ADB should observe financial discipline across all instruments that it deploys; reasonable net financial return expectations provide an opportunity to service the large need for non-equity instruments.
In our assessment, ADB’s expectation of net financial returns in the range of 10-12% can be met by observing discipline across the instruments deployed by the fund. This implies that expected returns on equity and debt should be no less than market rate (typically in excess of 20% for equity and 14% for debt, gross).
A strategy that is focused solely on equity will not address the large underserved need for debt for working capital, which is currently a critical barrier to growth of inclusive businesses, largely for want of collateral/security. ADB’s reasonable overall returns expectations and impact-orientation provide an important opportunity to address this issue by focusing on increasing access to debt for IBs. This could be achieved by setting-up a debt financing facility where loans are provided to investees of existing impact investors. An additional intervention to increase debt could be a credit guarantee scheme, targeted at IBs that are keen to access debt from the commercial banking sector. Interventions on the debt side may be considered timely as a number of impact-oriented PE funds are currently contemplating launching Non-Banking Finance Companies to provide debt to businesses. ADB could consider collaborating with a few SME, LIS and IB-focused PE funds to extend debt to their investee companies.
A technical assistance (TA) or grant facility is another important mechanism to supporting capacity-building in IBs. Pre-investment support could be offered through collaborating with existing incubators in areas such as legal and IP support, accounting, MIS, etc. Post-investment support could target areas such as training and awareness generation that also result in the creation of public goods. In Sri Lanka, an ADB TA facility could look at supporting capital market development and reforming the tea estates sector.
b) Target size of IBs’ investment requirement
In terms of equity, the gap in the market is between $2-10 million; debt financing to meet working capital requirements is a large need across a wide range of asset-light businesses and requires further analysis on the size of debt offerings that should be priority
Stakeholders across various categories – IBs, fund managers and donors – have echoed the view that ADB’s fund should focus on supporting the growth of small and medium-scale IBs that roughly correspond to the Indian government’s small and medium industry classification, i.e. firms with less than $2 million invested in plant and machinery. The largest unmet need in these firms is the need for debt for working capital. These firms have limited access to external sources of debt finance as
ADB Inclusive Business Market Study for India and Sri Lanka Final Draft Report
11
banks practice collateral-based lending and a large number of these firms are unable to comply with these requirements.
Larger firms, on the other hand, have several alternate financing options, including commercial PE (there are over 300 PE funds in India, majority of whom invest upwards of $10 million per deal); commercial bank loans, corporate debt and the stock market.
In equity, very few equity investors provide support in the $1-10 million range required for early growth financing. While USD $1-10 million is seen as a relevant range to support inclusive businesses, investors expect a higher proportion of deals to be below $5 million given the nascent stage of development of most IBs in India and Sri Lanka today. This, along with the focus on low-income states and impact investments, would have implications on the selection of fund managers that ADB would collaborate with to make available its debt financing facility.
c) Sector focus
ADB should adopt a sector agnostic approach, but prioritize sectors that are currently presenting strong opportunities for social impact, such as rural livelihood (agri-businesses, tourism, handicrafts), education, healthcare, water, sanitation and energy.
Though the overall market for PE deals in India is substantial (460 deals in 2011), very few sectors, barring large infrastructure, real estate, finance and telecom, see sufficient annual deal flow to warrant exclusive focus. Highly inclusive sectors like agriculture saw fewer than 4 deals per year between 2005 and 20107. The relative lack of depth in any specific sector has resulted in very few sector-specific PE funds - over 80% of the 300+ PE funds active in India today are sector-agnostic. Given the newness of the asset class in Sri Lanka, adopting a sector-agnostic approach is perceived by many as the only feasible approach.
Acknowledging the constraints imposed by the stage of PE market development, we recommend that ADB work with funds that are sector-agnostic in their approach with a light focus on sectors that deliver high financial and social returns, in addition to being relatively asset-light and free of risks such as over-regulation and ESG concerns. Based on Dalberg’s analysis of these factors and risks, inclusive businesses that impact rural livelihoods like agri-businesses, handicrafts, tourism etc. and those in education, healthcare, water, sanitation, and energy appear to be the most attractive.
d) Geographic focus
ADB should largely adopt a geography-agnostic approach, but may consider channelling part of its debt financing facility through existing low-income states (LIS) focused funds.
Low deal flow is a key reason cited by many impact-oriented investors as the key reason for maintaining a pan-India investment approach instead of focusing exclusively on India’s low-income states in the north and east. India’s high and growing incidence of urban poverty (298 million BOP live in urban areas that typically fall in high-income states) and the pan-India growth plans of majority (more than 75%) of IBs that responded to our survey, are additional arguments in favour of a geography-agnostic approach in planning for its debt financing facility. There are, at present, only two funds in India which invest exclusively in low-income states. Both were launched in 2012 with support from DFIs and DFI-funded investors like DFID, CDC and IFC and their performance is yet to be assessed.
7 Grant Thornton India PE Report 2011
ADB Inclusive Business Market Study for India and Sri Lanka Final Draft Report
12
In Sri Lanka too, investors are wary of exclusively focusing on post-conflict provinces in the north & north-east and under-developed eastern and southern provinces. The higher operational costs, in terms of personnel and time to source deals from these regions, was also cited as a disincentive.
While uncertainty concerning deal quality and deal flow can be mitigated with an agnostic approach, the argument still remains that under-developed regions deserve special attention. We recommend that ADB collaborate with a few existing low-income states-focused SME funds to extend its debt facility to IBs operating in low-income states.
e) Mode of engagement with the BOP
The ADB should remain open to supporting businesses that engage the BOP in a variety of ways
Mode of engaging the BOP refers to the way in which businesses interface with the poor – as consumers, distributors, employees or suppliers. The analysis reveals that successful IBs tend to utilize more than one mode of engagement, sometimes even three or four. In the Indian context, all modes of engagement are relevant and have high potential for social impact and financial returns. The relatively small size of the BOP in Sri Lanka and high level of human development reduce the relevance of pursuing consumer-oriented models in Sri Lanka. Overall, our recommendation is that the ADB should support innovative businesses that engage the BOP in a variety of ways.
f) Other criteria for investment
The ADB should focus on businesses that are asset-light, service-oriented and are deploying technology to facilitate growth.
Across the board, fund managers have said they prefer to make equity investments in businesses that are asset light, service oriented and enabled by technology.
Capital intensive sectors such as microfinance and housing are not favoured by investors with limited funds. Service orientation, i.e. the addition of a layer of service on top of a product is also seen to play a big role in the success of inclusive businesses many of which are selling novel products, such as solar lanterns, milk chillers, phone-based medical counselling, etc. to first-time buyers.
In the Indian context, technologies like smart cards and mobile-based payments and information systems are helping to drive scale especially for models that require extensive rural reach. Company innovation and access to technology was cited as the top two critical factors for growth by majority of inclusive businesses surveyed as part of this study.
OPERATIONALIZATION
ADB should collaborate with a few, existing impact-focused funds managed by experienced fund managers.
India has several funds targeting IBs, many of which have fund managers with deep experience in investing for both impact and financial returns. Feedback from fund managers suggests that they would consider collaborating with the ADB where ADB provides debt to the funds’ investee companies.

ADB Inclusive Business Market Study for India and Sri Lanka Final Draft Report
13
This feedback was corroborated by feedback from other donors and investors, majority of whom have taken a fund-of-funds approach. CDC and IFC, two of the largest DFI-supported PE investors, have only recently invested in impact-oriented SME funds8 where managers are still in the process of fund raising. Considering the large unaddressed need for debt, a number of PE funds are considering setting-up of Non-Banking Financing Companies to provide debt to companies to meet their working capital needs. These funds are an attractive option for ADB to collaborate with as their managers have completed the due diligence process, have local networks and experience, critical elements for a debt financing facility.
We recommend, therefore, that ADB support the scale-up IBs in India by setting-up a debt financing facility and route its debt through a few established funds that are impact focused. These may be a mix of funds that are focused on SMEs and/or LIS. The funds would independently select the companies they choose to make an equity investment in. The ADB could, through a separate debt facility, offer debt to select investees that fall under ADB’s classification of inclusive business. We believe this approach could help ADB achieve the desired outcome of supporting the scaling-up of IBs and serving an unmet need, without the costs and risks associated with having to identify offer and monitor debt to companies entirely independently.
In Sri Lanka, in addition to setting-up a debt facility, the ADB could make equity investments into IBs by partnering with the existing PE funds. Deal sourcing in Sri Lanka is largely non-intermediated and most under-the-radar opportunities can be accessed only by experienced fund managers. This would place ADB in a unique position in Sri Lanka in both, the IB debt financing and equity investing space.
Potential Fund Manager Partners for ADB
Our recommendation to the ADB would be to consider fund managers to partner with based on 5 criteria – 1) the stage in which they invest into companies; 2) their exposure to low income states; 3) their development mandate; 4) their experience in making $1-$10 million investments with a preference towards $1-$5 million; and 5) their familiarity with social impact reporting metrics.
Based on our interviews with nearly 21 fund managers in India and Sri Lanka, we recommend the following fund managers for the ADB to consider partnering with:
a) Pragati India Fund (India) b) Aavishkaar (India) c) Small Enterprises Assistance Fund (India) d) SIDBI-Venture Capital (India) e) Aureos South Asia (India & Sri Lanka) f) LR Global (Sri Lanka)
More details on the above-mentioned fund managers may be found in the annexure to this report.
8 CDC and IFC have invested in Pragati, a low-income-states focused SME fund; IFC has invested in LR Global,
an SME-focused fund in Sri Lanka
ADB Inclusive Business Market Study for India and Sri Lanka Final Draft Report
14
2.3. RECOMMENDATIONS
In light of these findings, Dalberg advises ADB to adopt a three-pronged strategy to support the development of inclusive business in India and Sri Lanka.:
I. First, given the larger, unaddressed need for collateral-free debt financing, ADB should set up a debt-financing facility to support growth of existing IBs in India and Sri Lanka.
Given the diversity observed in existing IBs, the debt-financing facility should be geography agnostic, though the ADB may consider channelling part of its debt financing facility through existing low-income states (LIS)-focused funds
ADB should adopt a sector agnostic approach, though priority may be given to addressing needs of IBs operating in high impact sectors such as rural livelihoods ( e.g. agri-business, tourism, handicrafts), water, sanitation, education, healthcare and energy
Mode of engagement with BOP should not be a major criterion for offering debt
Focus should be on innovative, high-growth models that are asset-light, service oriented and enabled by technology
The financing facility should work in collaboration with a selection of existing fund managers with experience of making investments in social enterprises and inclusive businesses in the sub $10 million deal size category (but not necessarily including angel investors)
In addition to offering debt to companies, the facility could also provide credit guarantees for inclusive businesses in India & Si Lanka that have challenges providing collateral acceptable to the banking system. Defining the exact size, rules and distribution was not part of the scope of this study and needs to be further explored.
II. Second, ADB should establish a Technical Assistance facility to support pre-investment and post-investment capacity building in IBs.
Pre-investment support could be provided through existing incubation centres that provide support in areas such as legal, IP support, accounting, MIS, etc.
Post-investment support could be targeted at areas such as training and awareness generation, that also result in the creation of public goods
In Sri Lanka, the ADB TA facility could support capital market development and reforming the tea estates sector
III. Third, in Sri Lanka, the ADB should consider offering equity to inclusive businesses either
directly or through an existing fund with a mandate to support inclusive business.
We also recommend further analysis to understand the role ADB can play in offering debt to help inclusive businesses in India and Sri Lanka achieve scale.
ADB Inclusive Business Market Study for India and Sri Lanka Final Draft Report
15
3. MACROECONOMIC ASSESSMENT OF INDIA
A number of secondary data sources were used to conduct an assessment of macroeconomic conditions in India. These sources include government census reports, economic publications and surveys, data published by international organizations such as the ADB, UN, World Bank and CIA, and other key BOP-focused reports including The Next 4 Billion.
3.1. OVERVIEW OF PERFORMANCE ON ECONOMIC AND SOCIAL INDICATORS
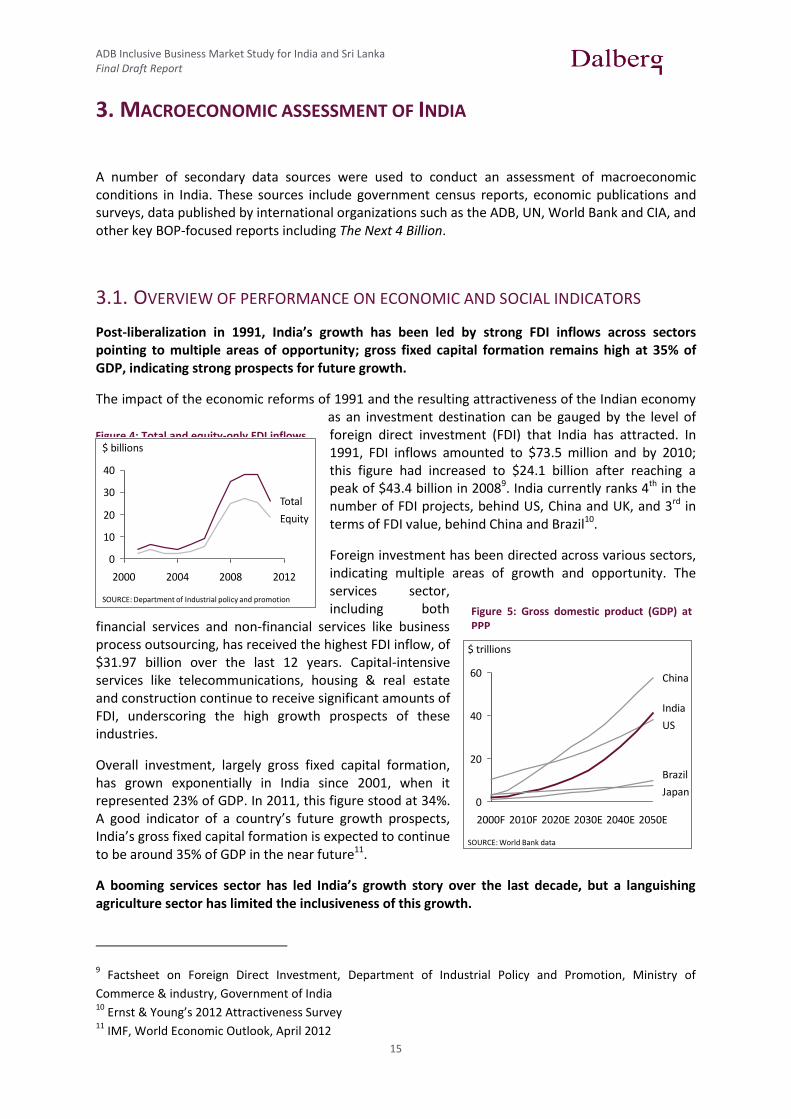
Post-liberalization in 1991, India’s growth has been led by strong FDI inflows across sectors pointing to multiple areas of opportunity; gross fixed capital formation remains high at 35% of GDP, indicating strong prospects for future growth.
The impact of the economic reforms of 1991 and the resulting attractiveness of the Indian economy as an investment destination can be gauged by the level of foreign direct investment (FDI) that India has attracted. In 1991, FDI inflows amounted to $73.5 million and by 2010; this figure had increased to $24.1 billion after reaching a peak of $43.4 billion in 20089. India currently ranks 4th in the number of FDI projects, behind US, China and UK, and 3rd in terms of FDI value, behind China and Brazil10.
Foreign investment has been directed across various sectors, indicating multiple areas of growth and opportunity. The services sector, including both
financial services and non-financial services like business process outsourcing, has received the highest FDI inflow, of $31.97 billion over the last 12 years. Capital-intensive services like telecommunications, housing & real estate and construction continue to receive significant amounts of FDI, underscoring the high growth prospects of these industries.
Overall investment, largely gross fixed capital formation, has grown exponentially in India since 2001, when it represented 23% of GDP. In 2011, this figure stood at 34%. A good indicator of a country’s future growth prospects, India’s gross fixed capital formation is expected to continue to be around 35% of GDP in the near future11.
A booming services sector has led India’s growth story over the last decade, but a languishing agriculture sector has limited the inclusiveness of this growth.
9 Factsheet on Foreign Direct Investment, Department of Industrial Policy and Promotion, Ministry of
Commerce & industry, Government of India 10
Ernst & Young’s 2012 Attractiveness Survey 11
IMF, World Economic Outlook, April 2012
Figure 4: Total and equity-only FDI inflows into India
2
Foreign Direct Investment (FDI) growth and top sectors
SOURCE: Department of Industrial policy and promotion
Sectors attracting highest equity inflows in 2011-12Figures in USD (billions)
Power
Computer software& hardware
2011-2012
18
26%
17%
12%
12%
11%
9%
9%
4%
Service sector
Drugs & pharmaceutical
Construction activities
Others
Telecommunication
Metallugical industry
2012
40
2000
30
20
10
2008
0
2004
Equity
Total
$ billions
Figure 5: Gross domestic product (GDP) at PPP
3
3. Gross Domestic Product at PPP
SOURCE: World Bank data
$ trillions
Brazil
Japan
India
China
US
2020E 2030E2010F2000F
40
60
0
20
2040E 2050E
ADB Inclusive Business Market Study for India and Sri Lanka Final Draft Report
16
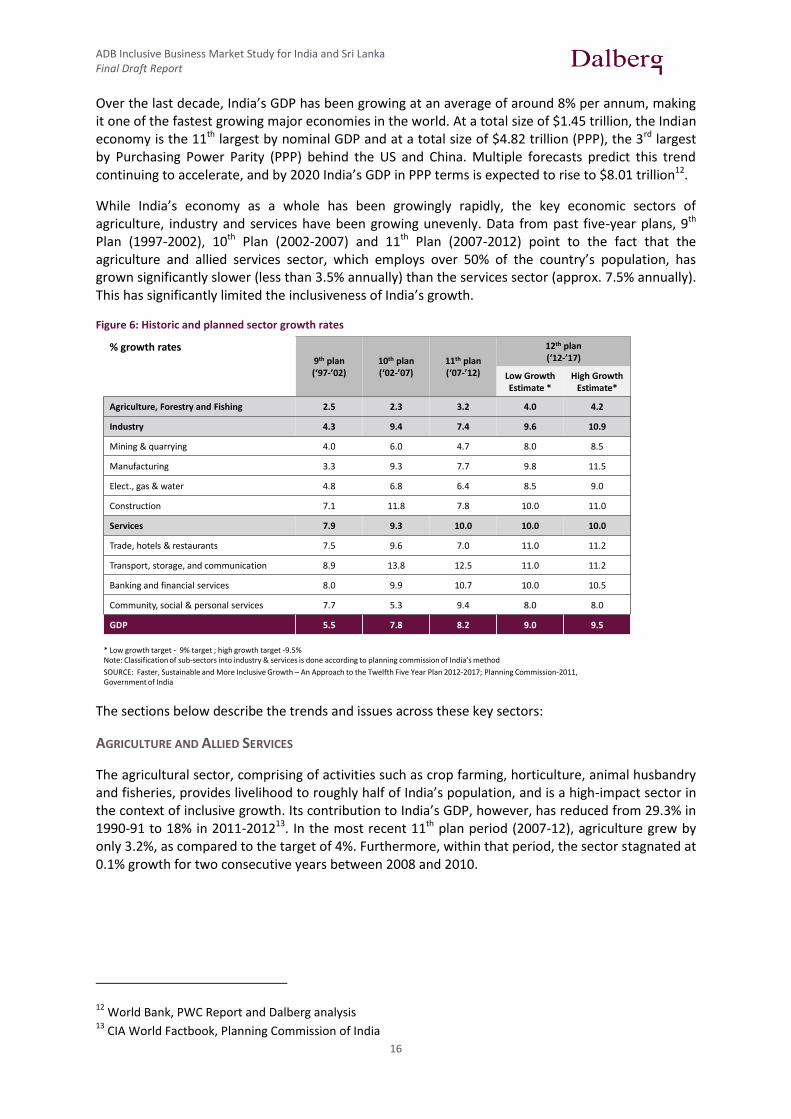
Over the last decade, India’s GDP has been growing at an average of around 8% per annum, making it one of the fastest growing major economies in the world. At a total size of $1.45 trillion, the Indian economy is the 11th largest by nominal GDP and at a total size of $4.82 trillion (PPP), the 3rd largest by Purchasing Power Parity (PPP) behind the US and China. Multiple forecasts predict this trend continuing to accelerate, and by 2020 India’s GDP in PPP terms is expected to rise to $8.01 trillion12.
While India’s economy as a whole has been growingly rapidly, the key economic sectors of agriculture, industry and services have been growing unevenly. Data from past five-year plans, 9th Plan (1997-2002), 10th Plan (2002-2007) and 11th Plan (2007-2012) point to the fact that the agriculture and allied services sector, which employs over 50% of the country’s population, has grown significantly slower (less than 3.5% annually) than the services sector (approx. 7.5% annually). This has significantly limited the inclusiveness of India’s growth.
Figure 6: Historic and planned sector growth rates
The sections below describe the trends and issues across these key sectors:
AGRICULTURE AND ALLIED SERVICES
The agricultural sector, comprising of activities such as crop farming, horticulture, animal husbandry and fisheries, provides livelihood to roughly half of India’s population, and is a high-impact sector in the context of inclusive growth. Its contribution to India’s GDP, however, has reduced from 29.3% in 1990-91 to 18% in 2011-201213. In the most recent 11th plan period (2007-12), agriculture grew by only 3.2%, as compared to the target of 4%. Furthermore, within that period, the sector stagnated at 0.1% growth for two consecutive years between 2008 and 2010.
12 World Bank, PWC Report and Dalberg analysis
13 CIA World Factbook, Planning Commission of India
4
3. Historic and planned sector growth rates
% growth rates9th plan(‘97-’02)
10th plan(‘02-’07)
11th plan(‘07-’12)
12th plan(‘12-’17)
Low Growth Estimate *
High Growth Estimate*
Agriculture, Forestry and Fishing 2.5 2.3 3.2 4.0 4.2
Industry 4.3 9.4 7.4 9.6 10.9
Mining & quarrying 4.0 6.0 4.7 8.0 8.5
Manufacturing 3.3 9.3 7.7 9.8 11.5
Elect., gas & water 4.8 6.8 6.4 8.5 9.0
Construction 7.1 11.8 7.8 10.0 11.0
Services 7.9 9.3 10.0 10.0 10.0
Trade, hotels & restaurants 7.5 9.6 7.0 11.0 11.2
Transport, storage, and communication 8.9 13.8 12.5 11.0 11.2
Banking and financial services 8.0 9.9 10.7 10.0 10.5
Community, social & personal services 7.7 5.3 9.4 8.0 8.0
GDP 5.5 7.8 8.2 9.0 9.5
* Low growth target - 9% target ; high growth target -9.5%Note: Classification of sub-sectors into industry & services is done according to planning commission of India’s method
SOURCE: Faster, Sustainable and More Inclusive Growth – An Approach to the Twelfth Five Year Plan 2012-2017; Planning Commission-2011, Government of India

ADB Inclusive Business Market Study for India and Sri Lanka Final Draft Report
17
Under-investment in critical infrastructure, inefficient land-use patterns and seasonal uncertainties are to be blamed
for the sector’s poor performance. In the 12th 5-year plan (2012-2017), the government plans to achieve growth rates over 4% by focusing on non-farm activities, such as post-harvest operations, rural supply chain management, and warehousing, which can all contribute significantly towards the expansion of employment and income opportunities.
INDUSTRY
Though industry has grown faster than agriculture (a 7.4% growth rate14 during the recent plan period), growth has still been below expectations (10-11%). Within that period, the growth of the sector, which includes mining
and quarrying, manufacturing and energy, dropped from 12.2% in 2006-2007 to 3.9% in 2011-2012. Furthermore, its contribution to India’s GDP decreased from 28.7% to 26%15. In addition to contributing heavily to overall GDP growth, a growing industrial sector is essential for absorbing surplus labour from the agricultural sector.
Growth in industry has been impeded by challenges in land acquisition and poor energy and water infrastructure. In more recent times (2011-12), the high interest rates imposed by the central bank to combat inflation have been blamed for the slow growth of industrial output, as measured by India’s Index of Industrial Production.
SERVICES
The services sector in India has grown sharply over the past decade and continues to do so. Services comprise of financial services, information technology and information technology-enabled services (IT and ITES), tourism and hospitality, health, education and construction. Combined contribution of all service-oriented industries to India’s GDP has grown from 54% in 2006-07 to 59% in 2011-12. The services sector is currently growing at a healthy 10% annually.
This growth in the service sector has been led primarily by private enterprises, aided by India’s large pool of workers, both skilled and unskilled. The sector’s activities have resulted in massive job creation, and it has become a catalyst of urbanization and urban migration. The construction industry alone provides direct/ indirect employment to 35 million people and is expected to employ 92 million people by 2022.
India’s limited inclusiveness of growth is reflected in its significant economic inequality and poor performance on human development indicators.
Despite emerging as one of the world’s largest economies, India’s per capita income still places it in the low-middle income bracket, as per World Bank’s definition of country lending groups. At $3,694 (PPP), India’s per-capita income places it at the 129th place in the world; just below Iraq16.
In 2004-05, the average per capita income of India’s bottom quintile by income was $176 (INR 9,305) but $1,997 (INR 105,845) for the top quintile, an eleven-fold difference in income levels. As per the
14 Planning Commission, 2011
15 Exim Bank of India report
16 IMF, World Economic Outlook, April 2012
5
3. Contribution of sectors to GDP and labor force employment
SOURCE: CIA Factbook
26%
14%
Services
Industry
Agriculture
Labour force by sector
(2009)
488 million
Sectoral contribution
to GDP(2011)
$ 1.8 trillion
18%
56%
52%
34%
Figure 7: Contribution of sectors to GDP and labour force employment
: asdasd
ADB Inclusive Business Market Study for India and Sri Lanka Final Draft Report
18
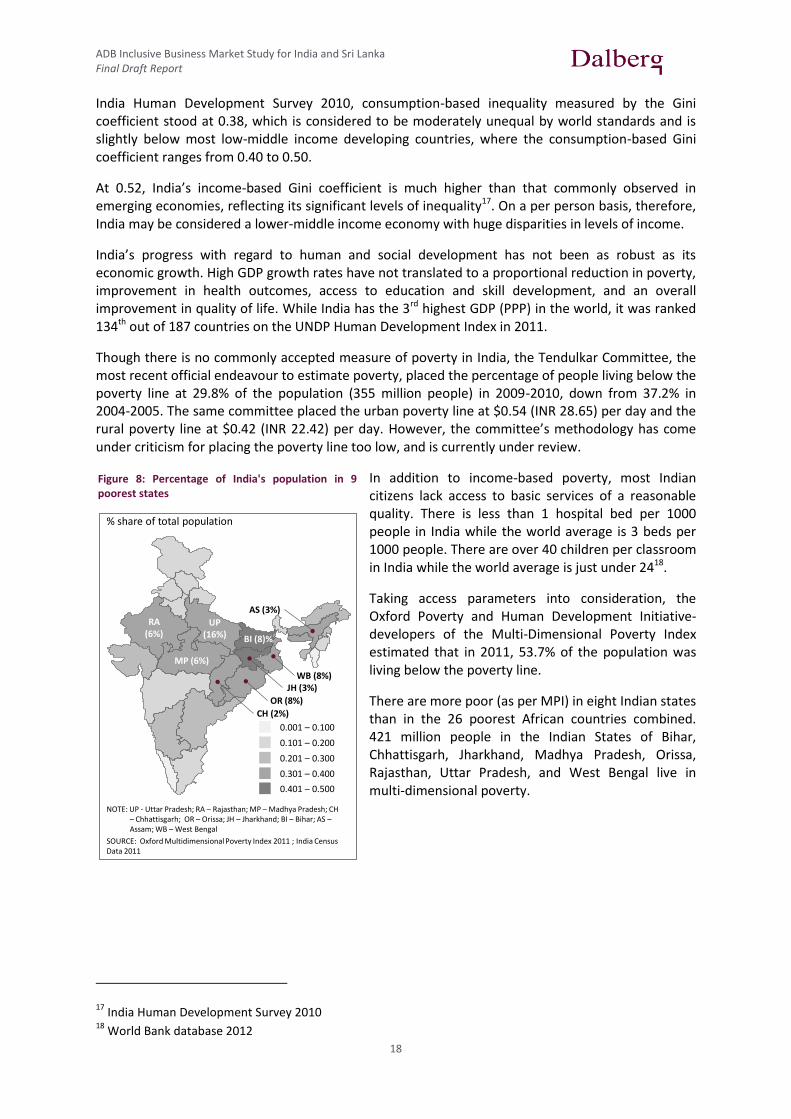
India Human Development Survey 2010, consumption-based inequality measured by the Gini coefficient stood at 0.38, which is considered to be moderately unequal by world standards and is slightly below most low-middle income developing countries, where the consumption-based Gini coefficient ranges from 0.40 to 0.50.
At 0.52, India’s income-based Gini coefficient is much higher than that commonly observed in emerging economies, reflecting its significant levels of inequality17. On a per person basis, therefore, India may be considered a lower-middle income economy with huge disparities in levels of income.
India’s progress with regard to human and social development has not been as robust as its economic growth. High GDP growth rates have not translated to a proportional reduction in poverty, improvement in health outcomes, access to education and skill development, and an overall improvement in quality of life. While India has the 3rd highest GDP (PPP) in the world, it was ranked 134th out of 187 countries on the UNDP Human Development Index in 2011.
Though there is no commonly accepted measure of poverty in India, the Tendulkar Committee, the most recent official endeavour to estimate poverty, placed the percentage of people living below the poverty line at 29.8% of the population (355 million people) in 2009-2010, down from 37.2% in 2004-2005. The same committee placed the urban poverty line at $0.54 (INR 28.65) per day and the rural poverty line at $0.42 (INR 22.42) per day. However, the committee’s methodology has come under criticism for placing the poverty line too low, and is currently under review.
In addition to income-based poverty, most Indian citizens lack access to basic services of a reasonable quality. There is less than 1 hospital bed per 1000 people in India while the world average is 3 beds per 1000 people. There are over 40 children per classroom in India while the world average is just under 2418.
Taking access parameters into consideration, the Oxford Poverty and Human Development Initiative- developers of the Multi-Dimensional Poverty Index estimated that in 2011, 53.7% of the population was living below the poverty line.
There are more poor (as per MPI) in eight Indian states than in the 26 poorest African countries combined. 421 million people in the Indian States of Bihar, Chhattisgarh, Jharkhand, Madhya Pradesh, Orissa, Rajasthan, Uttar Pradesh, and West Bengal live in multi-dimensional poverty.
17 India Human Development Survey 2010
18 World Bank database 2012
Figure 8: Percentage of India's population in 9 poorest states
6
3. Multi-dimensional poverty index (MPI) mapping of Indian States
NOTE: UP - Uttar Pradesh; RA – Rajasthan; MP – Madhya Pradesh; CH – Chhattisgarh; OR – Orissa; JH – Jharkhand; BI – Bihar; AS –Assam; WB – West Bengal
SOURCE: Oxford Multidimensional Poverty Index 2011 ; India Census Data 2011
% share of total population
0.301 – 0.400
0.201 – 0.300
0.101 – 0.200
0.001 – 0.100
0.401 – 0.500
RA (6%)
MP (6%)
UP (16%) BI (8)%
OR (8%)
WB (8%)JH (3%)
CH (2%)
AS (3%)

ADB Inclusive Business Market Study for India and Sri Lanka Final Draft Report
19
3.2. KEY INCLUSIVE BUSINESS SECTORS AND GOVERNMENT INITIATIVES
Agriculture
More than half the population of India is dependent on agriculture as a source of employment and livelihood. The long-term growth in agriculture has been just around 2%, which is just above the population growth rate. Agriculture’s declining share in the country’s economy is putting huge pressure on food security and consequently on food prices. Given the fact that this is a hugely important sector from an employment, food security and overall impact perspective, a lot needs to be done to stimulate growth.
India had record food grain production of over 250 million tonnes in 2011-2012 but the saddening irony is that there are millions in India that are either malnourished or go hungry. The Global Hunger Index released by the International Food Policy Research Institute ranks India 66th among 88 vulnerable countries and as per the government’s estimates 42% of children in India are malnourished. India’s food grain stockpile is roughly around 75 million tonnes, which is roughly two and a half times the stipulated maximum food buffer. However, our warehousing capacity is just 63 million tonnes. As per the government’s own estimate, 6 million tonnes of food grain rotted in its granaries due to poor storage last year. A report by the commissioner appointed by the Supreme Court of India put the figure at 13 million tonnes. While the government debates the Food Security Bill, 57% of the subsidized food does not reach the intended poor due to systemic leakages in the public distribution network19. To add to the woes, tons of food grains rot every year in open fields for want of proper storage facilities. Revamping the entire procurement, distribution, transport and storage ecosystem is required to meaningfully address these issues.
“Ensuring an increase in private investment” is the government’s focus for in this sector over the next five years. Other recommendations that are yet to be implemented are liberalizing agri-procurement, streamlining norms for private investment in agricultural supply chains and revisiting the Minimum Support Price norms.
Key government initiatives:
18% hike in the budgetary allocation to agriculture in the 2012-2013 budget, from $3.2 billion (INR 17,123 crore) in 2011-2012 to $3.8 billion (INR 20,208 crore) in 2012-2013.
Agricultural credit was also increased by $18.8 billion (INR 1,00,000 crore) over the previous year to $108.5 billion (INR 5,75,000 crore).
Focus areas in the 12th five-year plan:
Frame policies that trigger domestic demand recovery
Ensure rapid rise in private investment
Remove bottlenecks in agriculture, energy, transport, coal, power and national highway
Address malnutrition
Health
The hospital and diagnostic center segment in medical care in India has attracted FDI to the tune of $1.2 billion between 2000 and 2012, while the drugs $ pharmaceuticals and medical and surgical appliances industries received investments worth $9.2 billion and $514 million respectively. The
19 UID and PDS in India; Unique Identification Authority of India, Planning Commission, Government of India
ADB Inclusive Business Market Study for India and Sri Lanka Final Draft Report
20
government has taken some progressive measures to encourage private participation in the healthcare industry to bridge the vast demand-supply gap.
Key government initiatives20:
The government plans to increase health expenditure to 2.5% of GDP by the end of the 12th five-year plan, from the current 1.4%.
It has allowed 100% FDI for health and medical services under the automatic rule.
Allocation of funds to the National Rural Health Mission was increased from $3.59 billion in 2011-2012 to $4.13 billion in 2012-2013.
Education
The education sector holds a huge promise for private sector participation. Roughly 45% of the population is under the age of 19 years, meaning that over 500 million people are in need of primary, secondary and higher education. The government has committed $11 billion to this sector towards primary and secondary education in 2012-2013. However, the government is not well positioned to cater to the demand for quality education given restrictions on pay scales for teachers in government-run institutes and inability to expand schooling infrastructure at the required pace.
Between 2008 and 2012, the K12 education sector (Kindergarten to 12th grade) grew 14% from a market size of $20 billion to $34 billion, while higher education grew 12% from $6.5 billion in 2008 to $10.3 billion in 201221. Vocational training institutes, which have a huge relevance for the BOP segment, have a market size of approximately $4 billion, up from $1.6 billion in 2008. Overall, the education sector has a market size of $50 billion per annum with more than 45 million students and an investment requirement of approximately $100 billion by 2014.
Key government initiatives22:
In the 11th five-year plan (2007-2012) the allocation of funds towards technical and higher education was increased nine-fold to $18.8 billion from $2.1 Billion in the 10th five-year plan
100% FDI in education allowed through the automatic route23
National Skill Development Corporation has approved public-private partnership projects that are expected to train 62 million people in 10 years
The National Skill Development Fund has been allocated $ 0.19 billion for 2012-2013.
The government proposes to set-up a separate Credit Guarantee Fund to improve the flow of institutional credit for skill development
Water & Sanitation
By, India’s goal is to halve the proportion of people without sustainable access to improved water sources by 2015. As per available government statistics India had already met this target by 2008 by reducing the percentage of households without access to improved water sources from 32% in 1993 to 9% through a massive program of expanding bore well and hand pump construction under
20 IBEF, March 2012 Update: Ministry of Commerce and CII Initiative,
http://www.ibef.org/artdispview.aspx?art_id=31258&cat_id=119&in=29; DIPP 21
India Brand Equity Foundation (IBEF): Ministry of Commerce and CII initiative 22
IBEF, March 2012 Update: Ministry of Commerce and CII Initiative, http://www.ibef.org/artdispview.aspx?art_id=31278&cat_id=1057&in=76 23
Press release on “Foreign Universities and Educational Institutions”, 4 May, 2012: Press Information Bureau, Government of India
ADB Inclusive Business Market Study for India and Sri Lanka Final Draft Report
21
schemes such as the Accelerated Rural Water Supply Program However, drinking water experts fear that many habitations will ‘slip’ back with the drying up and contamination of ground water, the source for 85% of rural water supply. Supply of ‘safe drinking water’ will be a major focus for the government in the coming years as awareness of the health impacts of unsafe water spreads. Purification of water is also an area where the private sector has a key role to play, especially in the provision of appropriate technologies.
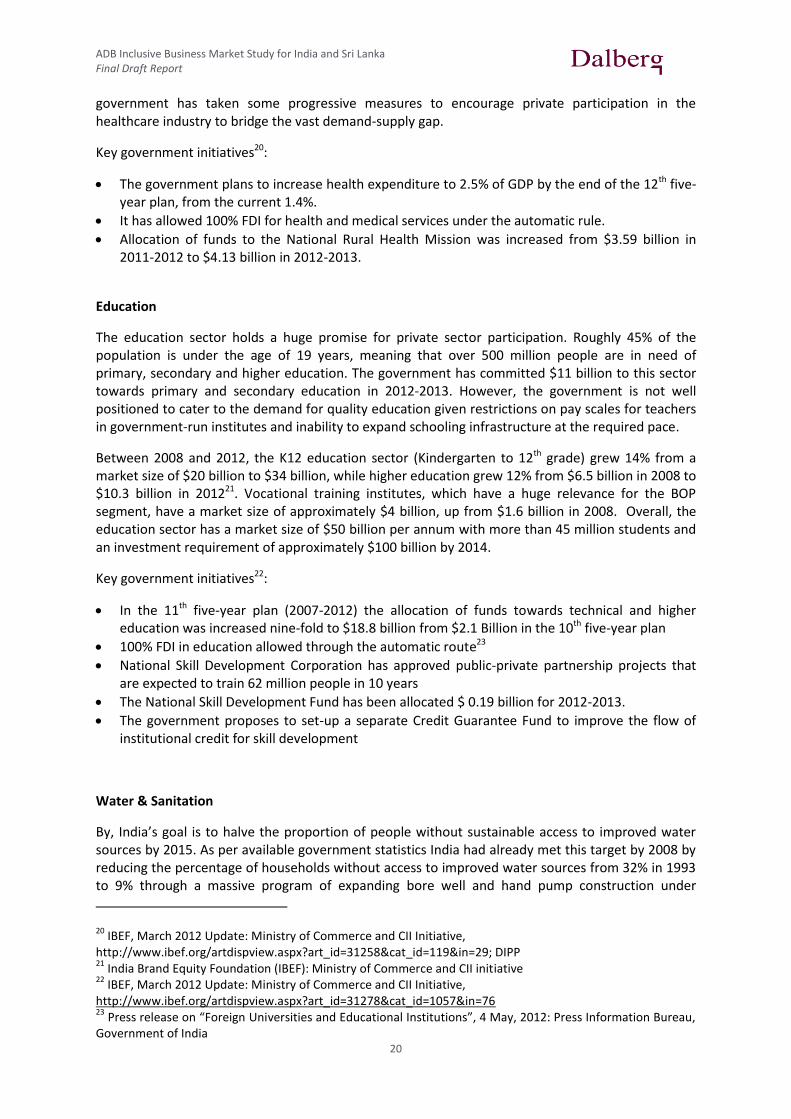
Figure 9: Half of the households in India do not have access to basic sanitation facilities
On sanitation however, India is unlikely to meet its goals. The country needs to reduce the percentage of households without access to basic sanitation facilities to 38% by 2015. It is estimated to reduce the number to about 43%, by 2015, thus missing the target by 5%24.
The NSSO report on Household Amenities in India, 2010 indicates that 65.2% of rural households and 11% of urban households do not have any latrine facility at home.
In sanitation too, the private sector has as significant role to play as a partner in projects launched by the government. Water Aid estimates that there is a shortfall of USD 34 billion for India to meet its water and sanitation targets by 201225. According to a World Bank Report, the value of investments in water and sanitation with private participation in India was $23.5 million in 2009 and $75.9 million in 2008 and is expected to grow.
Key government initiatives:
Special attention to be paid in the 12th five-year plan to private sector investment in infrastructure, including investments in water and sanitation. Total investment in infrastructure will need to increase from 8% of GDP in 2011-2012 to 10% of GDP in 2016-2017.
The National Water Policy of 2002 and the Planning Commission’s 11th Five-Year plan encourage private sector participation26.
The central government has committed $94 million (INR 500 Crore) for the Bharat Rural Livelihoods Foundation (BRLF) and is seeking another $94 million from the private sector27.
24 Millennium Development Goals – India Country Report 2011: Central Statistical Organisation, Ministry of
Statistics and Programme Implementation, Government of India 25
Position Paper on Water and Sanitation in India – 2009: Ministry of Economic Affairs, Government of India 26
Trends in Private Sector Participation in the Indian Water Sector: Water and Sanitation Program, World Bank 27
Report in the Economic Times, 30 May 2012: http://articles.economictimes.indiatimes.com/2012-05-30/news/31900347_1_jairam-ramesh-sanitation-solutions
15
Year Urban Rural AllIndia
1992-1993 24.0% 87.0% 70.0%
1998-1999 19.3% 81.1% 64.0%
2005-2006 16.8% 74.0% 55.3%
2007-2008 19.0% 66.0% 51.0%
2008-2009 11.3% 65.2% 49.2%
Propor onofhouseholdshavingnosanita onfacility
SOURCE:NFHS,DLHS,NSSReport535,Housingcondi onsandameni esinIndia
ADB Inclusive Business Market Study for India and Sri Lanka Final Draft Report
22
Energy
The energy requirements in a rapidly growing economy like India are growing at an accelerated rate. Access to clean and affordable energy is one of the primary requirements for everyone, especially the poor at the base of the pyramid.
Most rural households and indeed a significant of urban poor still use kerosene for lighting and largely free fuels like firewood or dung for cooking. These are not only harmful to their health but also contribute to environmental degradation. Besides, the time that is wasted in collecting firewood can be utilized for other productive activities.
The private sector is playing an active role in reaching out to this large market by providing clean energy solutions in cooking and lighting. Solar lighting, solar cookers, biomass gassifier systems etc. are some of the products being offered by the private sector to addressing needs of this large market.
The World Resources Institute, per a report published in 2004-05, estimated that the opportunity in the clean energy market in the rural BoP segment in India was $2.11 billion per year, including $ 2.04 billion for decentralized renewable energy services and $70.1 million for energy products per year. The solar lantern market for supplying basic lighting to the rural BoP alone was estimated to be worth $18 million. The energy-efficient cook stove market was estimated to be worth roughly $24 million per year.
Key government initiatives28:
The Rajiv Gandhi Grameen Vidyutikaran Yojana (RGGVY) was devised to remedy the issue of access to power in rural habitations, especially to households living below the poverty line.
Distribution of solar lanterns at subsidized rates
The Bachat Lamp Yojana (BLY) provides compact fluorescent lamps (CFLs) to households at the cost of incandescent lamps. Currently, 20 million CFLs have been distributed under the BYL.
Tourism
Tourism, along with hospitality, contributes approximately $33 billion, or around 6% of the GDP. The tourism sector in India is one of the largest service industry employment sectors in the country providing 9% of the total employment opportunity in India. The sector is estimated to create 78 jobs per million rupees (approx. $19,000) of investment as compared to 45 jobs per million rupees in the manufacturing sector. The sector is also more inclusive in that it provides jobs to a wide spectrum of job seekers from the unskilled to the highly specialized; jobs are spread across the country; and there is a large percentage of women employment in this sector. The Travel and Tourism Competitiveness Report by the World Economic Forum has ranked India at the 6th place in tourism and hospitality. According to the World Travel and Tourism Council, India is poised to be one of the top tourism destinations in the world till about 2018. The tourism industry in India is expected to grow at close to 9% per annum, making it the 2nd fastest growing tourism market in the world.
Besides providing large-scale employment, the tourism industry also has indirect contribution to the GDP providing a multiplier effect affecting several other associated sectors and industries. According to the Department of Industrial Policy and Promotion, the tourism sector attracted FDI worth $2.8 billion (INR 14,771 crore) between April 2000 and January 2012. Foreign tourism arrivals
28 Planning Commission of India

ADB Inclusive Business Market Study for India and Sri Lanka Final Draft Report
23
in the country have gone up from 3.9 million in 2005, to 5.4 million in 2010 and 6.9 million in the last year29.
Key government initiatives30:
FDI of up to 100% is permissible in the sector through the automatic route.
In 2011-2012, the Ministry of Tourism provided employment to 33,000 youth in tourism. In 2012-2013, they plan to increase this number to 100,000.
It is recommended that the National Tourism Policy form an integral part of the poverty reduction strategy during the 12th five-year plan.
29 IBEF, July 2012; Ministry of Tourism; Department of Industrial Policy and Promotion
30 IBEF, Planning Commission of India
ADB Inclusive Business Market Study for India and Sri Lanka Final Draft Report
24
3.3. KEY TRENDS SHAPING THE ECONOMY
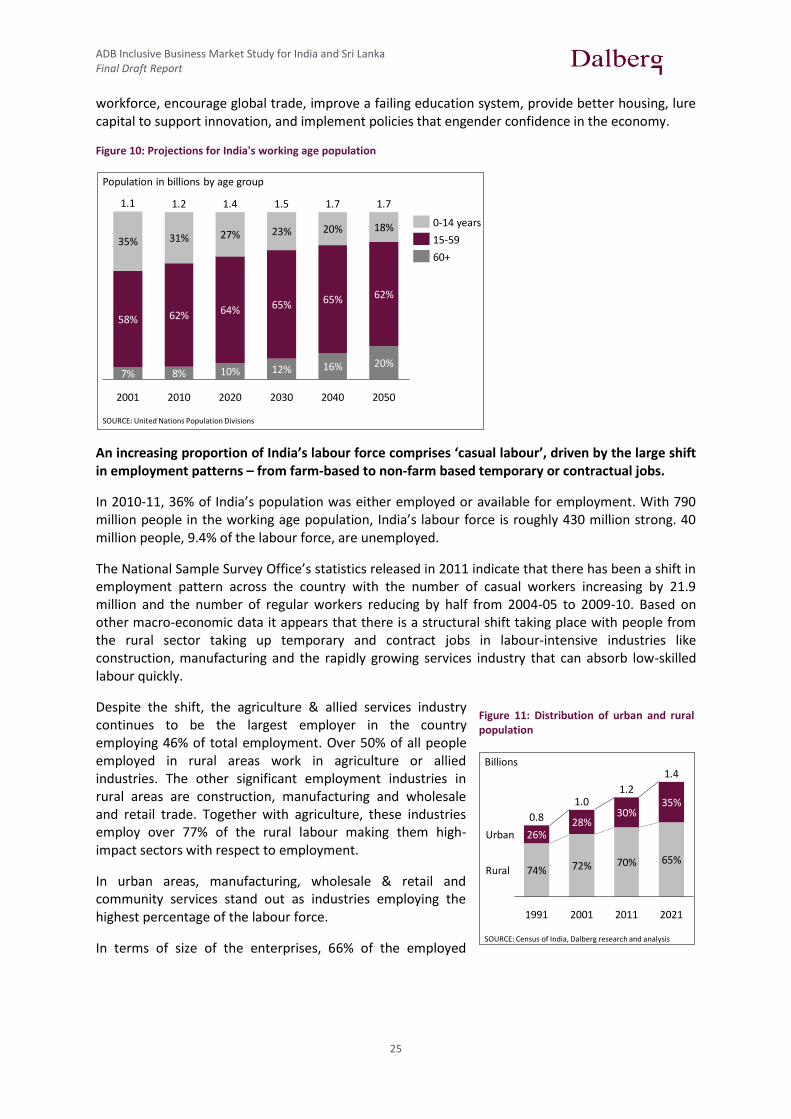
India could take advantage of its favourable age demographics and develop a competitive advantage in possessing 25% of the world’s workforce; demographics in low-income states are particularly well positioned to drive growth.
OECD estimates that in 2020, India will have a population of 1.3 billion people31, surpassing China to become the most populous nation in the world. Against the backdrop of new economic opportunities, India’s teeming millions, once seen as a major burden, are being seen as assets to propel the country onto a higher growth trajectory.
According to the IMF, a substantial proportion of growth that India experienced since the 1980’s can be attributed to the country’s age structure and age demographics32. Currently 54% of India’s 1.2 billion people are under the age of 25 and 63.5% of India’s population, roughly around 760 million people, falls in the working-age bracket of 15 to 59 years33. Further, 300 million people will enter the labour market by 2025, providing 25% of the world’s workers34. The continuing demographic dividend is estimated to add roughly 2 percentage points to India’s per capita GDP growth every year.
There are multiple implications of millions of young people entering the workforce. According to David Bloom - the demographer who first coined the term ‘demographic dividend’ - young, unencumbered workers are seen to spur entrepreneurship and innovation, enabling significant gains in productivity, savings, and capital inflows.
Additionally, India will be experiencing an increase in the number of working age people just when other large countries see the average age of their populations decline, opening up opportunities for the export of workers from India to the rest of the world. In 2020, the average age in India will be only 29 years, compared with 37 in China and the United States, 45 in Western Europe, and 48 in Japan35.
Demographics are also believed to have played a role in influencing the growth rates of Indian states. Authors of the IMF working paper feel that some of India’s economically strong states have already reaped a demographic dividend over the last couple of decades. Per their analysis, the states of Karnataka, Tamil Nadu and Gujarat can attribute between 2.4 and 3 percent of their annual per capital GDP growth rate in the 1980’s to a favourable age distribution.
According to the authors, the 9 economically weaker states36 in the country, home to more than half the population, may have just entered the sweet spot in terms of the age structure of their populations to start experiencing a demographic dividend. Bihar, a traditionally low-growth state, has been the fastest growing state for the last two years with its GDP expanding by 14.8% and 13.1% in 2010-11 and 2011-12 respectively. A percentage of this growth could be attributed to favourable demographics.
The value of India’s demographic dividend will depend in great measure on whether the public and private sector have the political will and foresight not only to create jobs but also to train the new
31 OECD Factbook, 2011-12
32 The Demographic Dividend: Evidence from Indian States, IMF, 2011
33 Report on Employment and Unemployment, Labour Bureau of India, 2010
34 The Financial Times
35 ‘India’s Demographic Moment’, Nandan Nilekani, 2009
36 The nine states include Uttar Pradesh, Rajasthan, Madhya Pradesh, Chhattisgarh, Orissa, Jharkhand, Bihar,
Assam & West Bengal
ADB Inclusive Business Market Study for India and Sri Lanka Final Draft Report
25
workforce, encourage global trade, improve a failing education system, provide better housing, lure capital to support innovation, and implement policies that engender confidence in the economy.
Figure 10: Projections for India's working age population
An increasing proportion of India’s labour force comprises ‘casual labour’, driven by the large shift in employment patterns – from farm-based to non-farm based temporary or contractual jobs.
In 2010-11, 36% of India’s population was either employed or available for employment. With 790 million people in the working age population, India’s labour force is roughly 430 million strong. 40 million people, 9.4% of the labour force, are unemployed.
The National Sample Survey Office’s statistics released in 2011 indicate that there has been a shift in employment pattern across the country with the number of casual workers increasing by 21.9 million and the number of regular workers reducing by half from 2004-05 to 2009-10. Based on other macro-economic data it appears that there is a structural shift taking place with people from the rural sector taking up temporary and contract jobs in labour-intensive industries like construction, manufacturing and the rapidly growing services industry that can absorb low-skilled labour quickly.
Despite the shift, the agriculture & allied services industry continues to be the largest employer in the country employing 46% of total employment. Over 50% of all people employed in rural areas work in agriculture or allied industries. The other significant employment industries in rural areas are construction, manufacturing and wholesale and retail trade. Together with agriculture, these industries employ over 77% of the rural labour making them high-impact sectors with respect to employment.
In urban areas, manufacturing, wholesale & retail and community services stand out as industries employing the highest percentage of the labour force.
In terms of size of the enterprises, 66% of the employed
7
3. Demographic projection for India
Population in billions by age group
SOURCE: United Nations Population Divisions
2040
18%
62%65%
16%
1.7
20%
2050
1.7
20%
2030
1.5
12%
65%
23%
2020
1.4
10%
64%
27%
2010
1.2
8%
62%
31%
2001
1.1
7%
58%
35%
60+
15-59
0-14 years
Figure 11: Distribution of urban and rural population
8
3. Rapid urbanization has been fueled by a sharp increase in number of census towns, which lack municipal facilities
Billions
SOURCE: Census of India, Dalberg research and analysis
26%
2021
1.4
65%
35%
2011
1.2
70%
30%
2001
1.0
Rural
Urban
72%
28%
1991
0.8
74%
Increase in the number of urban towns ‘000
+54%
+10%
CensusTown
StatutoryTown
2011
7.9
3.9
4.0
2001
5.2
1.4
3.8
1991
4.7
1.7
3.0
SOURCE: Census of India, Dalberg research and analysis

ADB Inclusive Business Market Study for India and Sri Lanka Final Draft Report
26
people work in enterprises that have less than 10 employees. A further 3% work in enterprises with between 10 and 19 employees and only 7%37 in firms with over 20 employees38.
Rapid migration away from rural areas has led to widespread, unplanned urbanization; there is a large opportunity to tackle the resulting urban poverty.
Urbanization in India is fuelled by migration of the rural population to existing urban areas and by growth of new urban areas. In 2001, 285 million people lived in designated urban areas. This increased to 380 million in 2011 and as per the Government of India’s projections; over 600 million people will live in urban areas by 2030.
Between 2001 and 2011, India witnessed a 54% increase in the number of urban towns from 5,161 in 2001 to 7,935 in 2011. Most of this increase, 2,532 towns, is on account of growth of census towns, rather than statutory towns, which saw an addition of only 242 between 2011 and 201139. Statutory towns are towns that have statutory governing structures like municipalities or town corporations. Census town do not have urban governing structures and are largely rural or semi-urban areas that turn urban on account of densification of their population. Census towns have poor civic urban infrastructure like roads, water, sanitation, etc.
With the share of urban population increasing at a rapid pace, instances of urban poverty have also increased. As per the available data on urban poverty, roughly 80 million in urban India live below the national poverty line40. As urbanization increases across the country, more and more migrants settle in unauthorized tenements often categorized as slums given the lack of legally available affordable housing. Per the 2011 census, 93 million people currently live in slums, a figure that is expected to grow 105 million by 201741.
As per Planning Commission recommendations, the government will need to attract private investment in all areas of urban infrastructure like drinking water supply, sewage treatment, urban roads, urban transport, power, as well as large infrastructure projects. The committee on Indian Urban Infrastructure and Services, appointed by the Ministry of Urban Development, estimates that $0.7 trillion (INR 39.2
trillion) will be required over the next 20 years to meet the requirements of the projected urban population.
With increase in per capita income, consumption expenditure across the country has also increased. As per the National Sample Survey Office’s (NSSO) 2011 report on household consumer expenditure in India, the Monthly Per Capita Consumption Expenditure (MPCE) (Mixed Reference Period) has increased substantially in both rural and urban areas. The average MPCE was estimated to be $18 (INR 953) in rural India and $35 (INR 1,856) in urban India in 2009-10, up from $11 (INR 579) and $21 (INR 1,104) in 2004-05, an increase of 65% and 68% respectively.
37 Report on Employment & Unemployment Survey (2009-2010); Labour Bureau, Ministry of Labour and
Employment, Government of India 38
The remaining percentage is classified as not reported 39
Planning Commission - 2011, Government of India 40
Census of India 41
Government of India, Committee on Slum Statistics/ Census 2011
Figure 12: Increase in the number of urban towns
8
3. Rapid urbanization has been fueled by a sharp increase in number of census towns, which lack municipal facilities
Billions
SOURCE: Census of India, Dalberg research and analysis
Rural
Urban
1991
0.8
74%
26%
2021
1.4
65%
35%
2011
1.2
70%
30%
2001
1.0
72%
28%
2011
7.9
+54%
+10%
CensusTown
StatutoryTown
3.9
4.0
2001
5.2
1.4
3.8
1991
4.7
1.7
3.0
SOURCE: Census of India, Dalberg research and analysis
‘000s
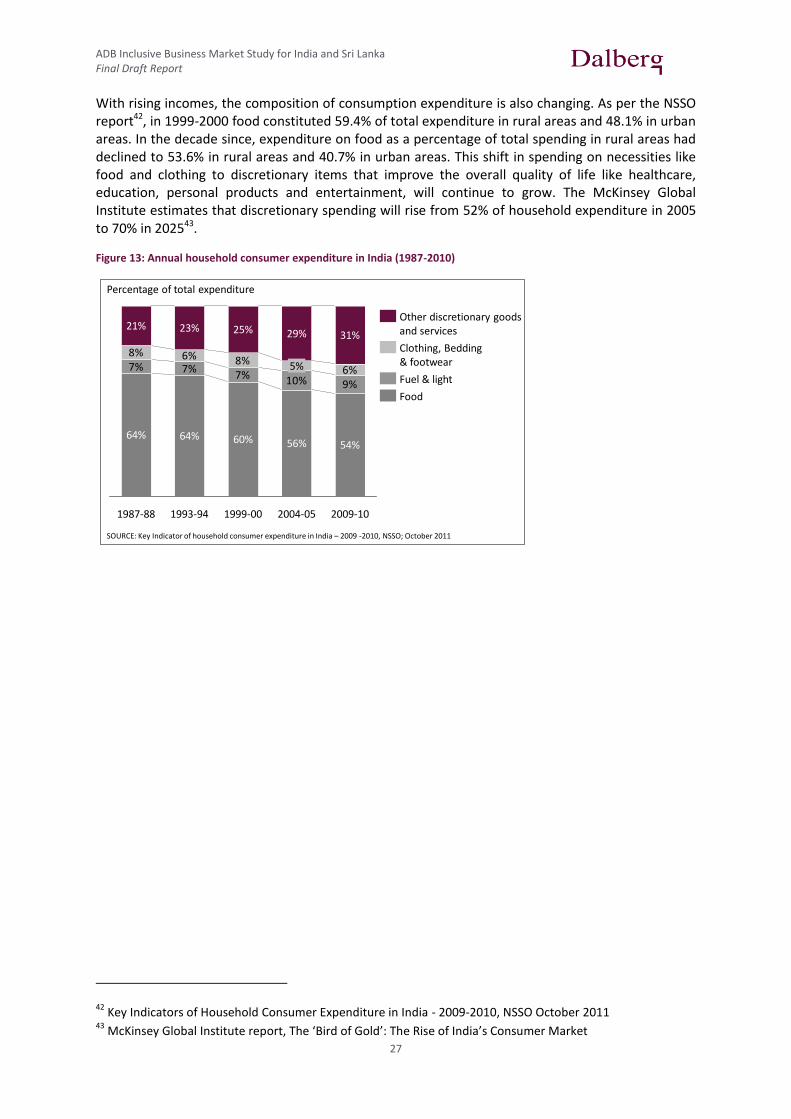
ADB Inclusive Business Market Study for India and Sri Lanka Final Draft Report
27
With rising incomes, the composition of consumption expenditure is also changing. As per the NSSO report42, in 1999-2000 food constituted 59.4% of total expenditure in rural areas and 48.1% in urban areas. In the decade since, expenditure on food as a percentage of total spending in rural areas had declined to 53.6% in rural areas and 40.7% in urban areas. This shift in spending on necessities like food and clothing to discretionary items that improve the overall quality of life like healthcare, education, personal products and entertainment, will continue to grow. The McKinsey Global Institute estimates that discretionary spending will rise from 52% of household expenditure in 2005 to 70% in 202543.
Figure 13: Annual household consumer expenditure in India (1987-2010)
42 Key Indicators of Household Consumer Expenditure in India - 2009-2010, NSSO October 2011
43 McKinsey Global Institute report, The ‘Bird of Gold’: The Rise of India’s Consumer Market
9
3. Annual household consumer expenditure for select years from 1987-2010
SOURCE: Key Indicator of household consumer expenditure in India – 2009 -2010, NSSO; October 2011
Percentage of total expenditure
7% 7%7% 10% 9%
8% 6% 8%6%
54%
31%
2004-05
25%
1993-94
56%
5%
29%
1999-00
60%64%
23%
1987-88 2009-10
64%
21%
Food
Fuel & light
Clothing, Bedding & footwear
Other discretionary goodsand services

ADB Inclusive Business Market Study for India and Sri Lanka Final Draft Report
28
3.4. SIZE OF THE MARKET AT THE BASE OF THE PYRAMID
87% of India’s population qualify as Base-of-Pyramid living under $4 a day; this segment spends $667 billion (PPP) on goods and services every year.
The Next 4 Billion report44 defines the BOP population as those earning $3,000 (2002 PPP terms) or less annually. Collectively, this represented 4 billion people globally at the time with 924 million living in India (95% of India’s population).
ADB classifies the BOP as those earning $3-4 PPP or less per day45. As per Dalberg’s estimates based on NSSO data, 1.04 billion people, or 87% of India’s population, would form the BOP population today. Approximately 90% of the rural population, or 743 million people and 80% of the urban population, or 299 million people can be classified as BOP population. In other words, 71% of India’s BOP population lives in rural areas. Dalberg estimates the total market for BOP as consumers is estimated to be $667 billion in PPP terms, approximately 62% of which would constitute the rural BOP market. As per this data, 61% of consumption expenditure for rural BOPs is towards food while urban BOPs spend 53% towards food.
Figure 14: Market size of India's BOP
As per the World Resource Institute’s The Next 4 Billion report, the BOP market in India was estimated to be USD $1.2 trillion in 2005. Of this, the BOP500, BOP1000 and BOP1500 segments, collectively classified as those earning less than USD $4 PPP per day in 2005, presented a USD $692 billion (PPP) consumer market opportunity. On an average, these three segments spent approximately 73.5% of their household expenditure on food and 12.1% on energy, the two highest expenditure heads in terms of percentage of household expenditure.
44 The Next 4 Billion, WRI and IFC, 2005
45 Asian Development Bank
10
3. Annual BoP household expenditure by category
$ billions (2005 PPP)
509
45
84
692
Transp-ortation
2
Other
5
EnergyFoodTotal market
size
Houshold goods
1810
EducationHealthcare ICT
12
Housing
7
NOTE: BOP taken as a sum of BOP500, BOP1000 and BOP1500 segments that spend less than USD ˜4 PPP per day (2005)
SOURCE: World Resources Institute, Next 4 Billion Report
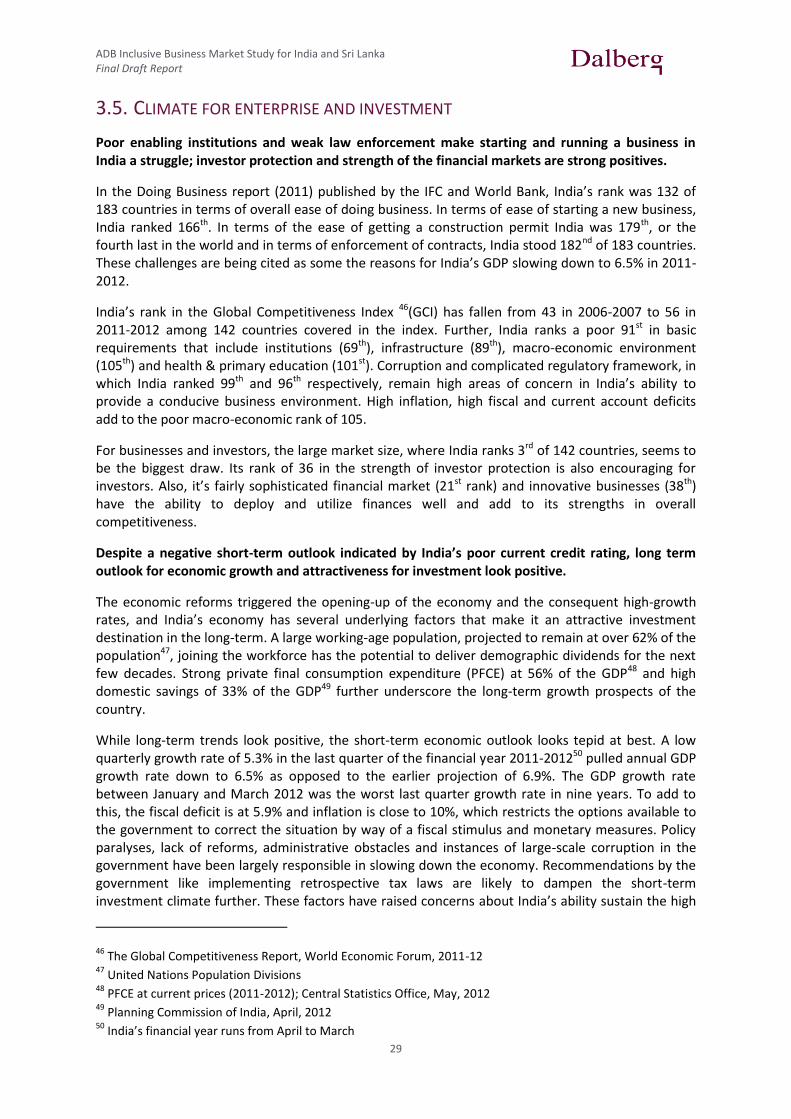
ADB Inclusive Business Market Study for India and Sri Lanka Final Draft Report
29
3.5. CLIMATE FOR ENTERPRISE AND INVESTMENT
Poor enabling institutions and weak law enforcement make starting and running a business in India a struggle; investor protection and strength of the financial markets are strong positives.
In the Doing Business report (2011) published by the IFC and World Bank, India’s rank was 132 of 183 countries in terms of overall ease of doing business. In terms of ease of starting a new business, India ranked 166th. In terms of the ease of getting a construction permit India was 179th, or the fourth last in the world and in terms of enforcement of contracts, India stood 182nd of 183 countries. These challenges are being cited as some the reasons for India’s GDP slowing down to 6.5% in 2011-2012.
India’s rank in the Global Competitiveness Index 46(GCI) has fallen from 43 in 2006-2007 to 56 in 2011-2012 among 142 countries covered in the index. Further, India ranks a poor 91st in basic requirements that include institutions (69th), infrastructure (89th), macro-economic environment (105th) and health & primary education (101st). Corruption and complicated regulatory framework, in which India ranked 99th and 96th respectively, remain high areas of concern in India’s ability to provide a conducive business environment. High inflation, high fiscal and current account deficits add to the poor macro-economic rank of 105.
For businesses and investors, the large market size, where India ranks 3rd of 142 countries, seems to be the biggest draw. Its rank of 36 in the strength of investor protection is also encouraging for investors. Also, it’s fairly sophisticated financial market (21st rank) and innovative businesses (38th) have the ability to deploy and utilize finances well and add to its strengths in overall competitiveness.
Despite a negative short-term outlook indicated by India’s poor current credit rating, long term outlook for economic growth and attractiveness for investment look positive.
The economic reforms triggered the opening-up of the economy and the consequent high-growth rates, and India’s economy has several underlying factors that make it an attractive investment destination in the long-term. A large working-age population, projected to remain at over 62% of the population47, joining the workforce has the potential to deliver demographic dividends for the next few decades. Strong private final consumption expenditure (PFCE) at 56% of the GDP48 and high domestic savings of 33% of the GDP49 further underscore the long-term growth prospects of the country.
While long-term trends look positive, the short-term economic outlook looks tepid at best. A low quarterly growth rate of 5.3% in the last quarter of the financial year 2011-201250 pulled annual GDP growth rate down to 6.5% as opposed to the earlier projection of 6.9%. The GDP growth rate between January and March 2012 was the worst last quarter growth rate in nine years. To add to this, the fiscal deficit is at 5.9% and inflation is close to 10%, which restricts the options available to the government to correct the situation by way of a fiscal stimulus and monetary measures. Policy paralyses, lack of reforms, administrative obstacles and instances of large-scale corruption in the government have been largely responsible in slowing down the economy. Recommendations by the government like implementing retrospective tax laws are likely to dampen the short-term investment climate further. These factors have raised concerns about India’s ability sustain the high
46 The Global Competitiveness Report, World Economic Forum, 2011-12
47 United Nations Population Divisions
48 PFCE at current prices (2011-2012); Central Statistics Office, May, 2012
49 Planning Commission of India, April, 2012
50 India’s financial year runs from April to March
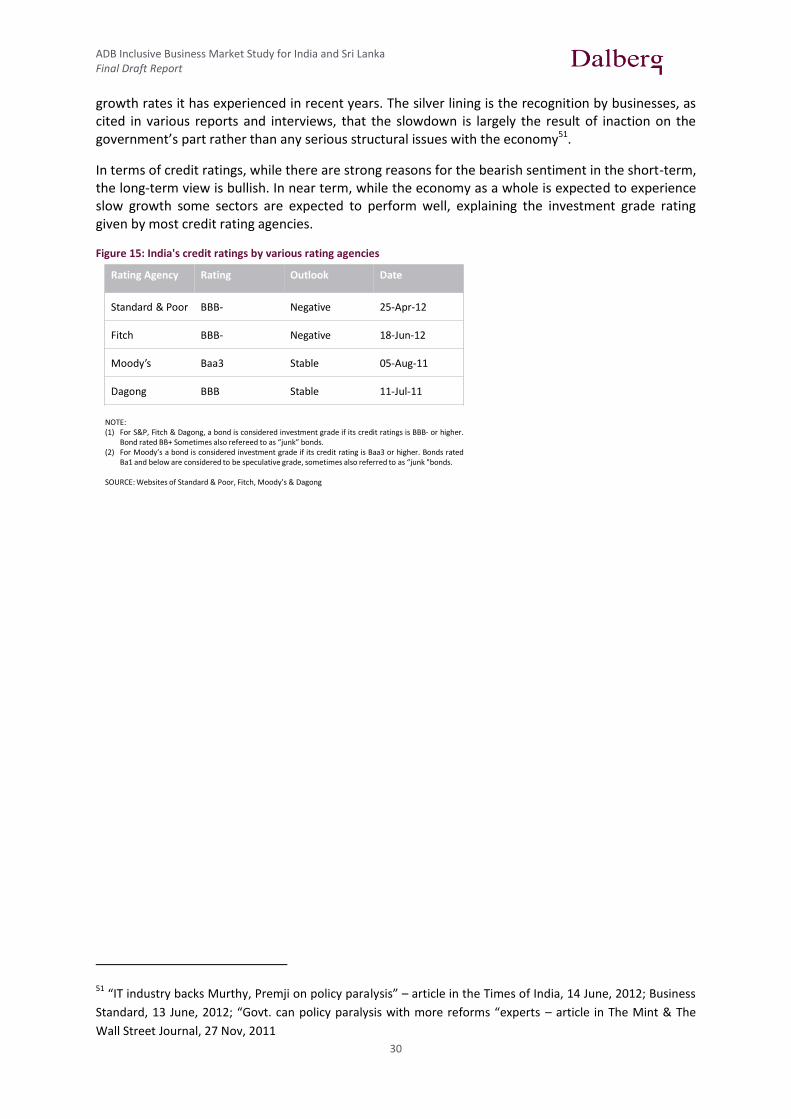
ADB Inclusive Business Market Study for India and Sri Lanka Final Draft Report
30
growth rates it has experienced in recent years. The silver lining is the recognition by businesses, as cited in various reports and interviews, that the slowdown is largely the result of inaction on the government’s part rather than any serious structural issues with the economy51.
In terms of credit ratings, while there are strong reasons for the bearish sentiment in the short-term, the long-term view is bullish. In near term, while the economy as a whole is expected to experience slow growth some sectors are expected to perform well, explaining the investment grade rating given by most credit rating agencies.
Figure 15: India's credit ratings by various rating agencies
51 “IT industry backs Murthy, Premji on policy paralysis” – article in the Times of India, 14 June, 2012; Business
Standard, 13 June, 2012; “Govt. can policy paralysis with more reforms “experts – article in The Mint & The
Wall Street Journal, 27 Nov, 2011
11
Rating Agency Rating Outlook Date
Standard & Poor BBB- Negative 25-Apr-12
Fitch BBB- Negative 18-Jun-12
Moody’s Baa3 Stable 05-Aug-11
Dagong BBB Stable 11-Jul-11
3. Short-term outlook by rating agencies was negative in mid-2012
NOTE:(1) For S&P, Fitch & Dagong, a bond is considered investment grade if its credit ratings is BBB- or higher.
Bond rated BB+ Sometimes also refereed to as “junk” bonds.(2) For Moody’s a bond is considered investment grade if its credit rating is Baa3 or higher. Bonds rated
Ba1 and below are considered to be speculative grade, sometimes also referred to as “junk "bonds.
SOURCE: Websites of Standard & Poor, Fitch, Moody’s & Dagong

ADB Inclusive Business Market Study for India and Sri Lanka Final Draft Report
31
4. MACROECONOMIC ASSESSMENT OF SRI LANKA
To develop a holistic perspective on the macroeconomic assessment of Sri Lanka, we used a number of sources of data. These sources include Central Bank of Sri Lanka reports and publications, data published by international organizations such as the IMF, UN, World Bank and CIA, and other key reports including The Next 4 Billion.
4.1. OVERVIEW OF PERFORMANCE ON ECONOMIC AND SOCIAL INDICATORS
Sri Lanka’s 26 year old civil war and – recently – the global recession have stunted growth, but post-conflict regions are now being developed amidst strong prospects for economic growth.
Since the beginning of reforms in 1977, the Sri Lankan economy has diversified from its dependence on commodities like tea and rubber, to services like banking and telecom. Sri Lanka’s potential for growth was not fully realized because of a civil war between the original inhabitants, the Sinhalese, and the immigrants from colonial times, the Tamils, that lasted for 26 years from 1983 to 2009.
Poor economic growth persisted in the country even after the end of the war in 2009 because of the global recession, which resulted in low exports. The resulting balance of payments crisis prompted the IMF to step in with a Stand-By-Arrangement (2009-12) to stabilize the situation. In June 2012, the IMF, at the conclusion of their staff mission to Sri Lanka, stated that Sri Lanka’s macroeconomic health had improved. The current account deficit had been curbed, credit growth had been moderated and reserves had been restored to stable levels.52 The Sri Lankan economy is expected to benefit from increased exports as the global economy recovers.
The peaceful environment has also brought about other favourable changes that have the potential to spur growth. Military expenditure is expected to reduce, giving the government more flexibility in managing the budget.53 The lifting of unfavourable travel advisories and insurance, issued due to risk of war, will facilitate growth of tourism and trade.54
In the two years since the war ended, the government has spent large sums of money to resettle Internally Displaced People (IDP) and to de-mine prior conflict areas. The government is also focusing on providing sustainable livelihood opportunities to IDPs, which could result in the inclusion of IDP’s in the labour force.
Additionally, multiple infrastructure projects in conflict affected provinces and across the country are likely to be completed by 2013. Between 2009 and 2011, $1.2 billion was spent on infrastructure projects in northern areas alone.
52 IMF Press Release, June, 2012
53 Ministry of Finance and Planning, Annual Report 2011
54 Lanka Business Online, July, 2010
Figure 16: Gross domestic product of South and Southeast Asian countries
2
4. Gross domestic product (GDP) based on purchasing-power-parity (PPP) valuation of country
$ billions (PPP)
Data is not available for Afghanistan before 2002 and for Myanmar before 1998
SOURCE: International Monetary Fund, World Economic Outlook Database, September 2011
100
0
2016E2010200419981992
Vietnam
Sri Lanka
Myanmar
Bangladesh
Afghanistan
500
400
300
200

ADB Inclusive Business Market Study for India and Sri Lanka Final Draft Report
32
Sri Lanka’s GDP is forecast to double to $189.4 billion (PPP), in the 8 years following the end of the war in 2009.55 The economy grew 8% in 2010 and 8.3% in 2011.56 As of 2011, GDP stood at $116.3 billion (PPP) which is small in absolute terms relative to the size of other countries in developing Asia such as Vietnam, Bangladesh and Pakistan (see figure below). However, it is one of the highest in the region on a per capita basis. GDP per capita reached $5,600 (PPP), after showing strong growth in the post-war years, rising 8.4% in 2010 and 9.7% in 2011. This figure is expected to continue with an increase to $9,000 (PPP) in 2017.
The short-term outlook for GDP growth is moderate, given the uncertainties of the global economy. Strong growth of 8% was expected at the start of this year, but the IMF has revised its forecast to 6.75% GDP growth for 2012. 57 The lower forecast is partly due to the impact of the recession and Euro Zone crisis on Sri Lanka’s trading partners, which will impact the country’s exports. The consequent widening of the trade deficit is expected to put further strain on Sri Lanka’s balance of payments situation. To avoid this, Sri Lanka might have to go in for a tighter fiscal and monetary policy, which may further slow down output and GDP growth.
Sri Lanka’s services sector is the engine of the country’s growth; construction and hospitality industries have grown significantly in the recent past.
The contribution of agriculture, services and industry to Sri Lanka’s GDP stood at 11%, 60% and 29% respectively in 201158.
Agriculture has seen the slowest growth of all three sectors, with a compounded annual growth rate of around 3.5% over the past decade. Tea, rubber, coconut and paddy are the main crops of Sri Lanka. Along with fishing, they form the bulk (approximately 45%) of agricultural output. Fishing has seen strong growth of 12.2% in 2010 and 15.5% in 2012. Output for other crops in 2011 was
adversely affected on account of heavy flooding.59 Currently, about a third of the population is dependent on agriculture and allied industries.
Industry (i.e., manufacturing, mining, etc.) has been the fastest growing sector since 2004, with a compounded annual growth rate of 7.5%. The growth of the industrial sector has been broad- based, with construction (14.2%), mining (18.5%) and textiles (10.8%) achieving double-digit growth in 2011.60 61 With reforms and liberalisation after the war, building capacity is the prime focus of the sector as a whole. Much of the multilateral grants and loans that Sri Lanka has received have gone
towards building infrastructure that is expected to help industries.
55 World Economic Outlook Database
56 Department of Census and Statistics, National Accounts Annual Report 2011
57 IMF, June, 2012
58 Department of Census and Statistics, National Accounts Annual Report 2011
59 Asian Development Bank Outlook for Sri Lanka – Forecast 2012
60 Textiles also includes wearing apparel and leather
61 Department of Census and Statistics, Sri Lanka, National Accounts Annual report, 2011
Figure 17: Weighted contribution to GDP growth rate by sectors
3
4. Sector-wise contribution to GDP growth rate
SOURCE: Central Bank of Sri Lanka Annual Report -2011
3.5%
62%
32%
6% 6.0%
6.8%
2011
8.0%
61%
36%
2%
2010
8.3%
60%
30%
10%
2009
56%
34%11%
2008
56%
28%
15%
2007
Services
Industry
Agriculture
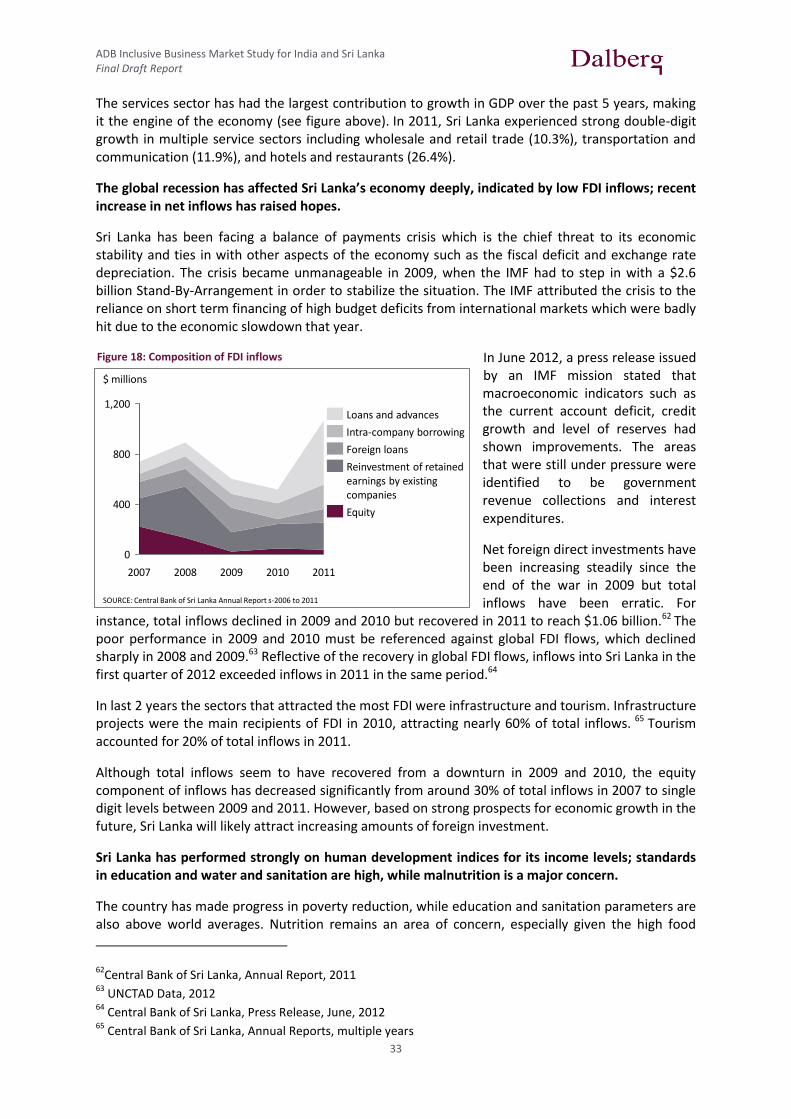
ADB Inclusive Business Market Study for India and Sri Lanka Final Draft Report
33
The services sector has had the largest contribution to growth in GDP over the past 5 years, making it the engine of the economy (see figure above). In 2011, Sri Lanka experienced strong double-digit growth in multiple service sectors including wholesale and retail trade (10.3%), transportation and communication (11.9%), and hotels and restaurants (26.4%).
The global recession has affected Sri Lanka’s economy deeply, indicated by low FDI inflows; recent increase in net inflows has raised hopes.
Sri Lanka has been facing a balance of payments crisis which is the chief threat to its economic stability and ties in with other aspects of the economy such as the fiscal deficit and exchange rate depreciation. The crisis became unmanageable in 2009, when the IMF had to step in with a $2.6 billion Stand-By-Arrangement in order to stabilize the situation. The IMF attributed the crisis to the reliance on short term financing of high budget deficits from international markets which were badly hit due to the economic slowdown that year.
In June 2012, a press release issued by an IMF mission stated that macroeconomic indicators such as the current account deficit, credit growth and level of reserves had shown improvements. The areas that were still under pressure were identified to be government revenue collections and interest expenditures.
Net foreign direct investments have been increasing steadily since the end of the war in 2009 but total inflows have been erratic. For
instance, total inflows declined in 2009 and 2010 but recovered in 2011 to reach $1.06 billion.62 The poor performance in 2009 and 2010 must be referenced against global FDI flows, which declined sharply in 2008 and 2009.63 Reflective of the recovery in global FDI flows, inflows into Sri Lanka in the first quarter of 2012 exceeded inflows in 2011 in the same period.64
In last 2 years the sectors that attracted the most FDI were infrastructure and tourism. Infrastructure projects were the main recipients of FDI in 2010, attracting nearly 60% of total inflows. 65 Tourism accounted for 20% of total inflows in 2011.
Although total inflows seem to have recovered from a downturn in 2009 and 2010, the equity component of inflows has decreased significantly from around 30% of total inflows in 2007 to single digit levels between 2009 and 2011. However, based on strong prospects for economic growth in the future, Sri Lanka will likely attract increasing amounts of foreign investment.
Sri Lanka has performed strongly on human development indices for its income levels; standards in education and water and sanitation are high, while malnutrition is a major concern.
The country has made progress in poverty reduction, while education and sanitation parameters are also above world averages. Nutrition remains an area of concern, especially given the high food
62Central Bank of Sri Lanka, Annual Report, 2011
63 UNCTAD Data, 2012
64 Central Bank of Sri Lanka, Press Release, June, 2012
65 Central Bank of Sri Lanka, Annual Reports, multiple years
Figure 18: Composition of FDI inflows
4
4. FDI inflows have shot up since the war ended in 2009, but equity flows have been contracting for the past 5 years
$ millions
SOURCE: Central Bank of Sri Lanka Annual Report s-2006 to 2011
1,200
800
400
0
20112010200920082007
Equity
Reinvestment of retainedearnings by existingcompanies
Foreign loans
Intra-company borrowing
Loans and advances
ADB Inclusive Business Market Study for India and Sri Lanka Final Draft Report
34
expenditure ratio. Sri Lanka has also nearly completed the process of resettling people displaced due to the war.66
Sri Lanka boasts of an unusually high Human Development Index of 0.691. 67 For instance, Turkey has a similar HDI (.699) despite having more than double the GNI per capita (PPP) of Sri Lanka. Sri Lanka’s Inequality-Adjusted HDI was .57- a discount of 16.2%.The reduced value incorporates the effects of inequality on various sub-dimensions such as education and health.
Sri Lanka’s Multi dimensional Poverty Index score is 0.021, which is not only much lower than most countries in South Asia, but also lower than countries like Turkey, China and Philippines.68 The proportion of poor to total population by the MPI methodology is 5.3%, which is significantly lower than the proportion of poor estimated by other poverty measures such as the National Poverty Line (22.7%) and the World Bank’s $1.25 Poverty Line (14%).69
HEALTH AND NUTRITION
Sri Lanka has been able to achieve relatively good healthcare standards for its population. The number of hospital beds per 1000 people was 3.1 in 2004, in line with the world average of 3. Almost all births (99%) were attended to by skilled health staff. 70
Malnutrition figures however, have not progressed at the same pace, and are a cause of concern. At 21.6% the prevalence of malnutrition, measured as weight for age for children under the age of 5, is roughly the same as the average for developing Sub Saharan Africa71 and much larger compared to Turkey’s 3.5%.
EDUCATION
Educational standards in Sri Lanka are also relatively good. The student teacher ratio of 19 compares favourably with a world average of 23.72 More than 95% of the teachers are either trained or graduates themselves. There is gender parity in the number of children in schools. World Bank data shows that in 2006, 99% of all children who join school reach the final primary grade, indicating a low drop-out rate in primary education.
WATER AND SANITATION
91% of Sri Lankans had access to improved drinking water sources in 2010 compared to 80% in 2000. There has been an impressive jump, from 77% to 90%, in rural areas. The figure in urban areas is a near universal, 99%. The figures are now above the world average of 88%.73 In the same period, access to improved sanitation facilities increased from 82% to 92%, keeping Sri Lanka miles ahead of the world average of 62%. Interestingly, at 93%, rural areas have now surpassed urban areas in access to improved sanitation facilities. Open defecation was eliminated in rural areas and reduced to 2% in urban areas, a small figure compared to the world average of 23%.
66 Ministry of Finance and Planning, Annual Report 2011
67 Human Development Report 2011, country statistics
68 UNDP Data Explorer
69 OPHI Country briefing, December 2011
70 World Bank Data
71 Classification as per World Bank
72 Statistics Branch of the Ministry of Education and Higher Education, School Census 2006
73 WHO & UNICEF Joint Monitoring Programme (JMP) for Water Supply and Sanitation

ADB Inclusive Business Market Study for India and Sri Lanka Final Draft Report
35
4.2. KEY TRENDS SHAPING THE ECONOMY
Increasing proportion of the aged within Sri Lanka’s age demographics may put a strain on resources, especially public healthcare, indicating an opportunity for the private sector.
Demographic and labour participation trends provide certain opportunities and risks for Sri Lanka’s competitiveness on the world stage. The percentage of population of working age has begun decreasing although the absolute number of people will increase to around 15 million in 2035, an increase of approximately 8% from the 2010 figure.74 75
The percentage of people aged 60 years and above is forecast to nearly double from 9.3% in 2000 to 18% in 2025.76 The parent support ratio, has also increased from 2.1 in 2000 to 4.1 in 2025. The decrease in the labour participation rate, from 50.3% in 2000 to 48.1% in 2010, will also add to the strain if the downward trend continues.
To ease the pressures created by an increasing dependency ratio, Sri Lanka has already begun taking measures like increasing the retirement age of public sector workers. 77 These demographics
shifts may be a burden for the government which currently provides free healthcare in its facilities. 78 This may also be viewed an opportunity for private healthcare services.
Although overall unemployment is decreasing, there is a large need for skilled jobs among the educated youth.
Sri Lanka’s overall unemployment rate has reduced significantly from 8.1% in 2003 to 4.9% in 2010.79 However, when unemployment rates across age-brackets are examined, they reveal that the unemployment rate of youth aged between 15 – 24 years is very high compared to older age-groups. 1 in every 5 youths is unemployed compared to 1 in every 20 for the entire population.
The youth unemployment rate for Sri Lanka is considerably higher than other developing countries in South Asia. The youth unemployment figures for Pakistan and Bangladesh have been below 10%, while the overall unemployment rates were similar to that of Sri Lanka. 80
In terms of unemployment rate across different educational levels, rates are shown to be higher for people with higher educational levels suggesting either a skill mismatch or insufficient employment opportunities for educated people. These are challenges that Sri Lanka will have to address in order to extract the most from the remainder of the demographic dividend.
74 United Nations, Department of Economic and Social Affairs.
75 Working age refers to ages between 15 - 64
76 UN data
77 Asian Times Online
78 Demographic and Health Survey, 2006
79 Department of Census and Statistics, Labour Force Survey Annual Report 2010
80 UNESCAP Data Explorer
Figure 19: Age profile of Sri Lanka’s population
5
4. Population distribution by age
Total population in millions
SOURCE: UN Department of Economic & Social Affairs, World Population prospects, 2010 Revision
41% 36% 32% 30% 26% 24% 22%
46%
2040
24.5
27%
54%
1990
17.5
9%
49%
2030
23.8
23%
54%
2000
18.9
11%
52%
2010
21.2
14%
51%
2020
22.8
18%
2050
24.6
32%
49%
60+
20-59
0-19
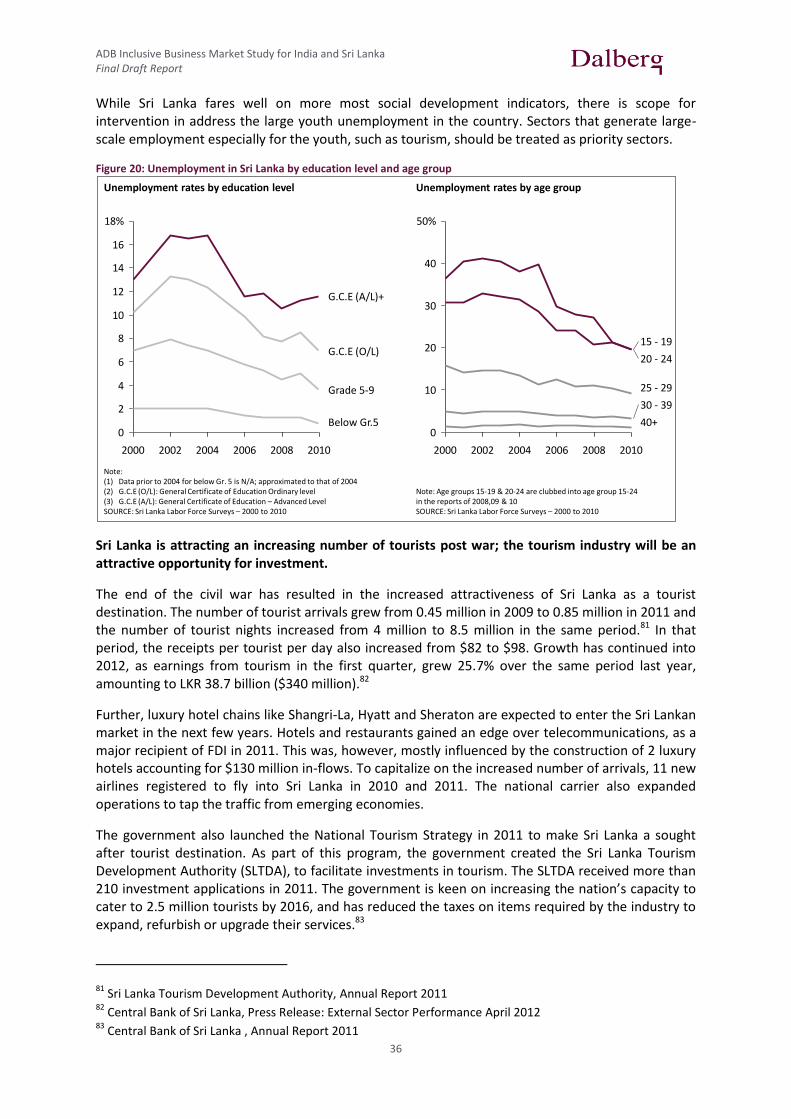
ADB Inclusive Business Market Study for India and Sri Lanka Final Draft Report
36
While Sri Lanka fares well on more most social development indicators, there is scope for intervention in address the large youth unemployment in the country. Sectors that generate large-scale employment especially for the youth, such as tourism, should be treated as priority sectors.
Figure 20: Unemployment in Sri Lanka by education level and age group
Sri Lanka is attracting an increasing number of tourists post war; the tourism industry will be an attractive opportunity for investment.
The end of the civil war has resulted in the increased attractiveness of Sri Lanka as a tourist destination. The number of tourist arrivals grew from 0.45 million in 2009 to 0.85 million in 2011 and the number of tourist nights increased from 4 million to 8.5 million in the same period.81 In that period, the receipts per tourist per day also increased from $82 to $98. Growth has continued into 2012, as earnings from tourism in the first quarter, grew 25.7% over the same period last year, amounting to LKR 38.7 billion ($340 million).82
Further, luxury hotel chains like Shangri-La, Hyatt and Sheraton are expected to enter the Sri Lankan market in the next few years. Hotels and restaurants gained an edge over telecommunications, as a major recipient of FDI in 2011. This was, however, mostly influenced by the construction of 2 luxury hotels accounting for $130 million in-flows. To capitalize on the increased number of arrivals, 11 new airlines registered to fly into Sri Lanka in 2010 and 2011. The national carrier also expanded operations to tap the traffic from emerging economies.
The government also launched the National Tourism Strategy in 2011 to make Sri Lanka a sought after tourist destination. As part of this program, the government created the Sri Lanka Tourism Development Authority (SLTDA), to facilitate investments in tourism. The SLTDA received more than 210 investment applications in 2011. The government is keen on increasing the nation’s capacity to cater to 2.5 million tourists by 2016, and has reduced the taxes on items required by the industry to expand, refurbish or upgrade their services.83
81 Sri Lanka Tourism Development Authority, Annual Report 2011
82 Central Bank of Sri Lanka, Press Release: External Sector Performance April 2012
83 Central Bank of Sri Lanka , Annual Report 2011
6
4. Unemployment rates by education level
Unemployment rates by education level
Note:(1) Data prior to 2004 for below Gr. 5 is N/A; approximated to that of 2004(2) G.C.E (O/L): General Certificate of Education Ordinary level(3) G.C.E (A/L): General Certificate of Education – Advanced LevelSOURCE: Sri Lanka Labor Force Surveys – 2000 to 2010
18%
16
14
12
10
8
6
4
2
0
201020082006200420022000
G.C.E (A/L)+
G.C.E (O/L)
Grade 5-9
Below Gr.5
20 - 24
15 - 19
2006200420022000
40+
30 - 39
25 - 29
50%
40
30
20
10
0
20102008
Note: Age groups 15-19 & 20-24 are clubbed into age group 15-24 in the reports of 2008,09 & 10SOURCE: Sri Lanka Labor Force Surveys – 2000 to 2010
Unemployment rates by age group

ADB Inclusive Business Market Study for India and Sri Lanka Final Draft Report
37
4.3. SIZE OF THE MARKET AT THE BASE OF THE PYRAMID
59% of Sri Lanka’s population forms its economic base of the pyramid, and spends $23 billion annually.
58.5% of Sri Lanka‘s population can be categorised as ‘base of the pyramid’, if we define the upper cut off of the segment as individuals earning $4 (PPP) per capita per day.84 This figure varies across the geographies. 79.5% (0.8 million) of the estate households, 60% (9.8 million) of the rural households and 43.5% (1.3 million) of urban households can be considered as “Base of the Pyramid.”
The market size at the base of the pyramid is of particular relevance to inclusive businesses engaging the poor as consumers. Dalberg estimates, the total market at the base of the pyramid to be $45 billion (PPP) in 2011. In 2011, BOP expenditure on food was $26 billion (PPP). Housing, which accounts for expenditure totalling $4.8 billion (PPP), was the second largest market after food. The other large markets were energy ($2.1 billion PPP), transportation ($2 billion PPP) and personal care and health ($1.9 billion PPP).
Figure 21: Segmentation of market at the base of the pyramid
Expenditure data reveals that richer deciles spent a larger percentage of their incomes on transport, communication and education. Notably, the spending on education varied from 1.8% for the poorest deciles’ non food expenditure to 5.9% for that of the richest decile.
84 Dalberg estimates based on Household Income Expenditure Survey 2009-10, Department of Census and
Statistics, Sri Lanka
27
4.
SOURCE: Dalberg Estimates using Household Income Expenditure Survey 2009-10, Department of Census and Statistics
Food 13
Non-food
23
10
5%Personal Care & Health
Education
Other
10
25%
11%
11%
10%
38%
Housing
Energy
Transport
Food vs. non-food market size
$ billions
Break up of non food market size

ADB Inclusive Business Market Study for India and Sri Lanka Final Draft Report
38
4.4. CLIMATE FOR ENTERPRISE AND INVESTMENT
Sri Lanka is continuously improving its investment climate in order to achieve its $2 billion FDI inflow target in 2012.
Sri Lanka jumped 9 places from 2011 and is ranked second best, behind Maldives, in the South Asia region with a Doing Business Rank of 89 (of 183 countries) in 2012. Sri Lanka’s rank in the Global Competitiveness Report follows closely, when it moved Sri Lanka to rank 52 (of 142 countries) in 2011-12 from 62nd position in 2010-11.
Both reports, however, stated that Sri Lanka’s tax policy was a road block to competitiveness. Sri Lanka ranked 173 out of 183 countries in terms of the ease of paying taxes in the Doing Business Report. The Global Competitiveness Report also identified tax rates and regulations as the most problematic factor for doing business. An additional area of concern identified by the Global Competitiveness Report was macroeconomic stability. The high government budget deficit and inflation rate caused concerns about the macroeconomic environment in Sri Lanka, leaving it with a rank of 116 out of 142 countries.
In response to these concerns the government has looked to rationalize tax policy and improve investor protection laws. Tax reforms have included reducing certain tax rates, replacing multiple rates with a single tax rate and setting up a Tax Appeals Commission to expedite the appeal process.85
Sri Lanka has also introduced tax reforms, which simplify and refocus tax incentives by restricting them to only strategically important projects. 86 These incentives were set up to attract investors during the civil war period and were previously a drain on revenues. The government is also considering revamping the Board of Investments (BOI) to ensure that the BOI does not withdraw concessions or change the terms of approval once they have been granted, thereby protecting investors from ad-hoc policy changes.87
The post conflict economy is expected to see strong growth in the long-term despite the current concerns. The short term risks have been mitigated by government policy measures, which have curbed the current account deficit to safeguard reserves.88 Even the double-digit inflation figures in the pre-war years have stabilized to single digit levels for the last three years.
Sri Lanka’s government has implemented focused policy measures to attract investments. Total investments, which are already at a healthy 27% of GDP since 2005, will also facilitate growth over the long term. Investor confidence has been reflected in the increasing flows of FDI into the country since 2010.
85 Ministry of Finance and Planning, Annual Report 2011
86 Lanka Business Online, March, 2011
87 Asian Tribune, November, 2010
88 IMF Press Release, June, 2012
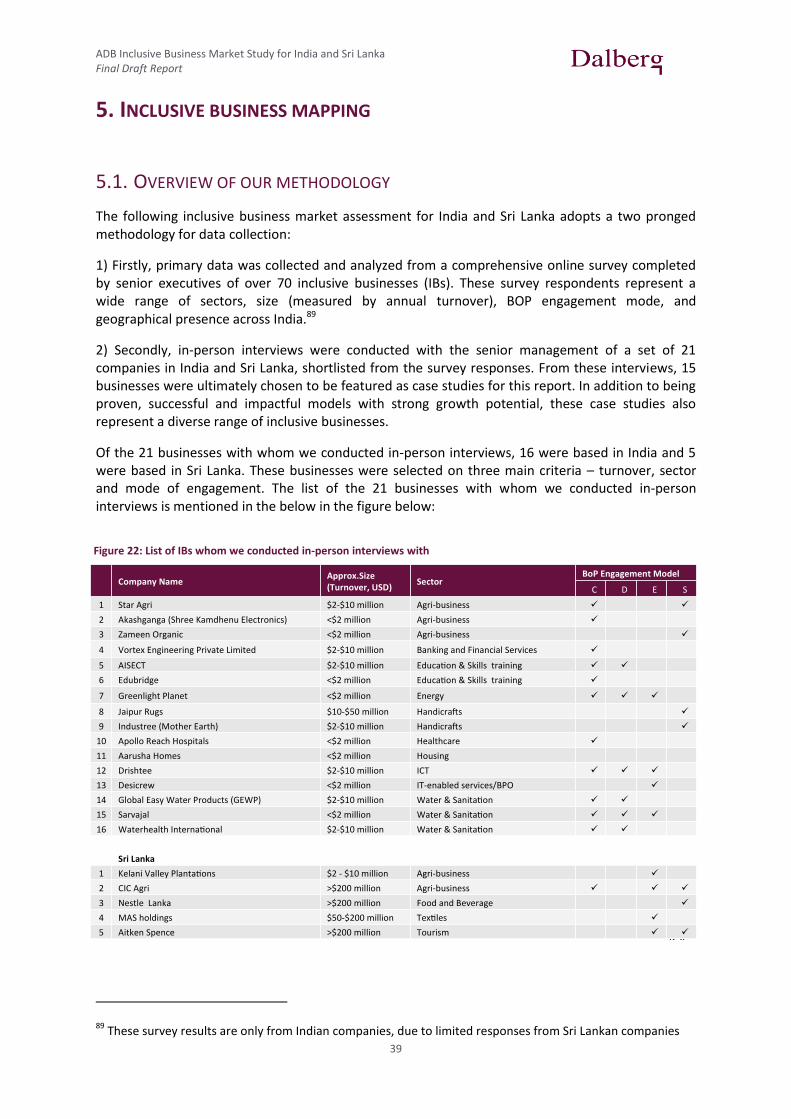
ADB Inclusive Business Market Study for India and Sri Lanka Final Draft Report
39
5. INCLUSIVE BUSINESS MAPPING
5.1. OVERVIEW OF OUR METHODOLOGY
The following inclusive business market assessment for India and Sri Lanka adopts a two pronged methodology for data collection:
1) Firstly, primary data was collected and analyzed from a comprehensive online survey completed by senior executives of over 70 inclusive businesses (IBs). These survey respondents represent a wide range of sectors, size (measured by annual turnover), BOP engagement mode, and geographical presence across India.89
2) Secondly, in-person interviews were conducted with the senior management of a set of 21 companies in India and Sri Lanka, shortlisted from the survey responses. From these interviews, 15 businesses were ultimately chosen to be featured as case studies for this report. In addition to being proven, successful and impactful models with strong growth potential, these case studies also represent a diverse range of inclusive businesses.
Of the 21 businesses with whom we conducted in-person interviews, 16 were based in India and 5 were based in Sri Lanka. These businesses were selected on three main criteria – turnover, sector and mode of engagement. The list of the 21 businesses with whom we conducted in-person interviews is mentioned in the below in the figure below:
89 These survey results are only from Indian companies, due to limited responses from Sri Lankan companies
Inaddi ontoanonlinesurvey,wevisited21IBsselectedalong3maincriteria–turnover,sectorandmodeofengagement
CompanyNameApprox.Size(Turnover,USD)
SectorBoPEngagementModel
C D E S
1 StarAgri $2-$10million Agri-business ü ü
2 Akashganga(ShreeKamdhenuElectronics) <$2million Agri-business ü
3 ZameenOrganic <$2million Agri-business ü
4 VortexEngineeringPrivateLimited $2-$10million BankingandFinancialServices ü
5 AISECT $2-$10million Educa on&Skillstraining ü ü
6 Edubridge <$2million Educa on&Skillstraining ü
7 GreenlightPlanet <$2million Energy ü ü ü
8 JaipurRugs $10-$50million Handicra s ü
9 Industree(MotherEarth) $2-$10million Handicra s ü
10 ApolloReachHospitals <$2million Healthcare ü
11 AarushaHomes <$2million Housing
12 Drishtee $2-$10million ICT ü ü ü
13 Desicrew <$2million IT-enabledservices/BPO ü
14 GlobalEasyWaterProducts(GEWP) $2-$10million Water&Sanita on ü ü
15 Sarvajal <$2million Water&Sanita on ü ü ü
16 WaterhealthInterna onal $2-$10million Water&Sanita on ü ü
SriLanka
1 KelaniValleyPlanta ons $2-$10million Agri-business ü
2 CICAgri >$200million Agri-business ü ü ü
3 NestleLanka >$200million FoodandBeverage ü
4 MASholdings $50-$200million Tex les ü
5 AitkenSpence >$200million Tourism ü ü
Figure 22: List of IBs whom we conducted in-person interviews with
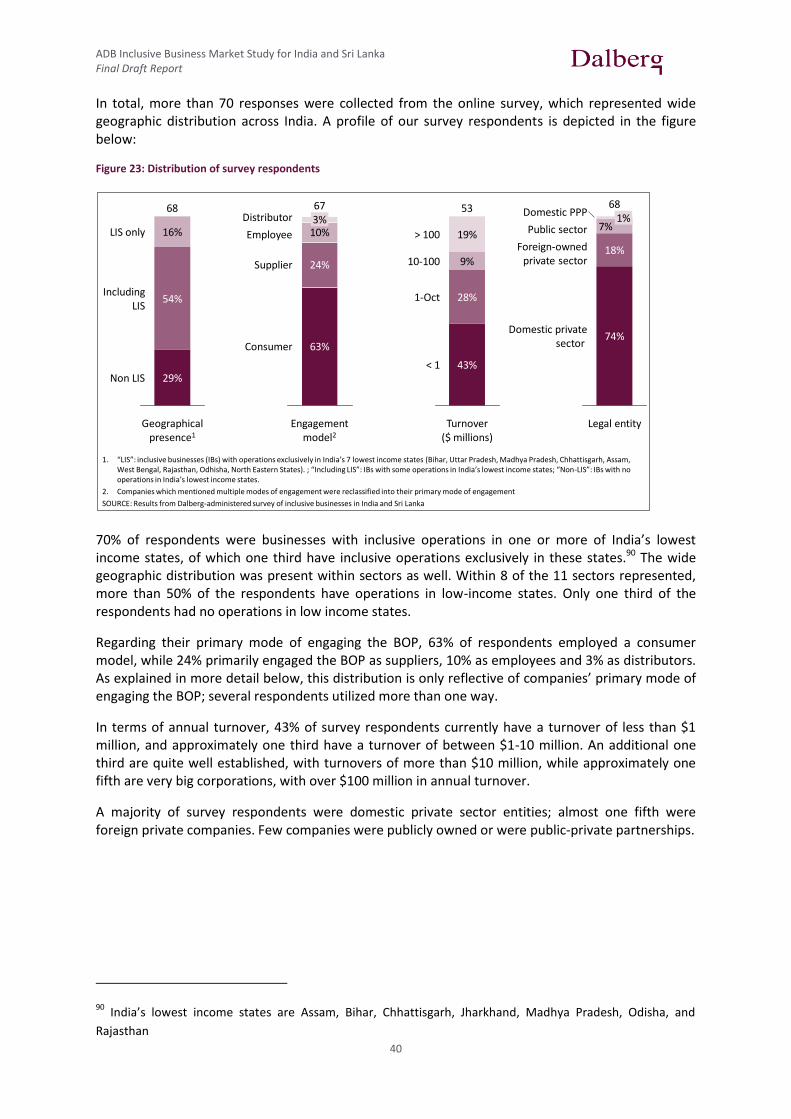
ADB Inclusive Business Market Study for India and Sri Lanka Final Draft Report
40
In total, more than 70 responses were collected from the online survey, which represented wide geographic distribution across India. A profile of our survey respondents is depicted in the figure below:
Figure 23: Distribution of survey respondents
70% of respondents were businesses with inclusive operations in one or more of India’s lowest income states, of which one third have inclusive operations exclusively in these states.90 The wide geographic distribution was present within sectors as well. Within 8 of the 11 sectors represented, more than 50% of the respondents have operations in low-income states. Only one third of the respondents had no operations in low income states.
Regarding their primary mode of engaging the BOP, 63% of respondents employed a consumer model, while 24% primarily engaged the BOP as suppliers, 10% as employees and 3% as distributors. As explained in more detail below, this distribution is only reflective of companies’ primary mode of engaging the BOP; several respondents utilized more than one way.
In terms of annual turnover, 43% of survey respondents currently have a turnover of less than $1 million, and approximately one third have a turnover of between $1-10 million. An additional one third are quite well established, with turnovers of more than $10 million, while approximately one fifth are very big corporations, with over $100 million in annual turnover.
A majority of survey respondents were domestic private sector entities; almost one fifth were foreign private companies. Few companies were publicly owned or were public-private partnerships.
90 India’s lowest income states are Assam, Bihar, Chhattisgarh, Jharkhand, Madhya Pradesh, Odisha, and
Rajasthan
29
Our 68 survey respondents from India comprised a diverse set of companies
1. “LIS”: inclusive businesses (IBs) with operations exclusively in India’s 7 lowest income states (Bihar, Uttar Pradesh, Madhya Pradesh, Chhattisgarh, Assam, West Bengal, Rajasthan, Odhisha, North Eastern States). ; “Including LIS”: IBs with some operations in India’s lowest income states; “Non-LIS”: IBs with no operations in India’s lowest income states.
2. Companies which mentioned multiple modes of engagement were reclassified into their primary mode of engagement
SOURCE: Results from Dalberg-administered survey of inclusive businesses in India and Sri Lanka
Legal entity
Domestic privatesector
Foreign-ownedprivate sector
Public sector
Domestic PPP68
74%
18%
7%1%
Geographical presence1
Non LIS
IncludingLIS
LIS only
68
29%
54%
16%
Turnover($ millions)
< 1
1-Oct
10-100
> 100
53
43%
28%
9%
19%
Supplier
Consumer
67
Engagement model2
63%
Employee
24%
Distributor
10%3%

ADB Inclusive Business Market Study for India and Sri Lanka Final Draft Report
41
5.2. ANALYSIS OF FINDINGS
All four modes of engaging the BOP occur across multiple sectors, and at times multiple modes are employed in a single business model; the consumer-oriented model is most prevalent.
As depicted in Figures 20 and 21 below, inclusive businesses within sectors adopt a variety of modes of engaging the BOP. Within agriculture, for example, though the largest component of survey respondents engage the BOP as suppliers of agricultural produce, some also employ the BOP (to work as company farmers), and consumer-focused agribusinesses sell inputs and/or advisory services to smallholder famers.
For sectors that provide critical goods and services, such as healthcare, water and sanitation, education and financial services, the majority engage the BOP as consumers. This is seemingly because the primary reason of being inclusive is precisely to increase access of basic service to these populations.
Figure 24: Primary BOP engagement mode of survey respondents
Furthermore, individual inclusive businesses often simultaneously engage the BOP in more than one way. As depicted in Figure 3 below, businesses that sell critical goods and services to BOP populations often also employ individuals from similar backgrounds. Using local distributors, for example, is a very effective method of reaching “last mile” customers.
30
Within sectors, inclusive businesses engage the BoP through various models
SOURCE: Results from Dalberg-administered survey of inclusive businesses in India and Sri Lanka
Engagement model by sector
N = 120
23%
69%
50%
60%
50%
75%
33%
19%
25%
10%
25%
38%
46% 15%
1
BFSI 3
Textiles, garmentsand handicrafts
425%
Real estate andconstruction
617% 33%
Education 1010% 20%
Water andsanitation
1217% 33%
Retail
Hospitality andtourism
25% 25%
Telecom,BPO and IT 1315% 23%
Healthcare 1331%
Energy 1625% 19%
Agri-business 3017% 27%
12
Consumer
Supplier
Distributor
Employee

ADB Inclusive Business Market Study for India and Sri Lanka Final Draft Report
42
Figure 25: Additional BOP modes of engagement
Inclusive businesses often begin serving the BOP in one way, and eventually form additional engagement approaches to meet their other needs. Engaging in complementary inclusive initiatives not only brings additional benefits to the target population, but is often also advantageous to the business. Star Agri, an agricultural production and supply chain company, buys agricultural produce from farmers while also providing them with storage facilities (for a fee) and advice on producing high quality crops.
Below, we outline our views on each of the four observed modes of engaging the BOP – as consumers, distributors, suppliers, or employees.
CONSUMER MODEL
For the purposes of this study, consumer-based inclusive businesses are defined as those providing a critical good or service to BOP populations. The key feature of companies adopting this model is ensuring affordability for BOP consumers.
Waterhealth International, for example, sells purified drinking water in rural India and East Africa for a very low price to encourage the consumption of purified drinking water and thereby reduce the incidence of water-borne disease. Apollo Hospitals, one of India’s largest healthcare companies, is building its “Reach” hospitals in Tier II and Tier III cities, to bring tertiary healthcare services to underserved communities.
A common challenge facing consumer-oriented inclusive businesses is not whether the product/service is affordable in the absolute sense, but the limited cash flow of BOP customers. To address this, businesses consider various financing options, such as monthly instalment plans, or the possibility of partnering with a microfinance institution (MFI). Edubridge,
31
40% of IBs are engaging the BoP in more than one way; the Employee model is the most common secondary mode of engagement
SOURCE: Results from Dalberg-administered survey of inclusive businesses in India and Sri Lanka
Presence of additional modes of engagement within each primary modes of engagement
N = 67
50%
75%86%
50%
7%13%
Distributor
2
Employee
14%
7
Supplier
16
13%
Consumer
42
29%
14%
50%
No additonal modes
Consumer
Supplier
Distributor
Employee
Figure 26: Consumer model strategies
37
44% of consumer oriented models invested in awareness generation, while almost 1/3rd
of distributor oriented companies appointed franchisees at the local level
NOTE: Some companies used strategies which were listed under different engagement models
SOURCE: Results from Dalberg-administered survey of inclusive businesses in India and Sri Lanka
Engagement strategies of consumer models
N = 43
Other
Provide rental/lease options
13%
Distribute servicevia mobile platforms
13%
Provide subscription-based service
18%
Provide “no frills” service option
22%
Sell smaller units 22%
Provide consumerfinancing options
24%
Provide ’Pay-per-use’ option
26%
Invest in awareness-generation/education
44%
13%
Provide financing to meetcosts of up-front investment
Decentralize productionto be close to distributors
Partner with NGOs/MFIs to sell through their networks
Identify & train micro-entrepreneurs
Appoint franchiseesat the village level
Other 10%
Engagement strategies of distributor models
N = 18

ADB Inclusive Business Market Study for India and Sri Lanka Final Draft Report
43
for example, a skills training organisation for rural youth in India, allows its students to pay class fees in instalments.
One of the ways in which consumer-oriented inclusive businesses are maximising their reach is through the use of the “hub and spoke” model. G.V. Meditech, for example, a hospital chain based in Varanasi, India, serves its rural patients through “spoke” micro-clinics. Patients needing more advanced treatment are referred to its larger, multi-specialty “hub”, located in the city. As opposed to a larger facility, multiple micro-clinics located in rural areas bring crucial healthcare services closer to rural populations, and their “no-frills” model reduces operational costs.
DISTRIBUTOR MODEL Partly due to the high costs associated with using existing distribution channels, some inclusive businesses engage the BOP to reach underserved populations. For example, Greenlight Planet, a company that sells affordable solar-powered lighting products to the BOP, has created an innovative, 1,000-member strong distribution network. Village-level entrepreneurs, called “Sun King Saathis”, are recruited and trained to sell its solar lighting products in rural villages. These distributors are also responsible for educating consumers on the benefits of using solar lights.
Greenlight Planet has found that successful distributors are not involved in any other entrepreneurial activities, which ensures that they are motivated by the sales commission to maximize sales. Further, they should be local, trusted individuals with credibility within the local community.
Similarly, Global Easy Water Products (GEWP) engages farmers to distribute its affordable drip irrigation products to small-scale farmers. Whereas GEWP’s distributors are not exclusively from BOP backgrounds, they are still local farmers, and therefore very effective. Given the sensitive nature of convincing a farmer to adopt a new technology which could potentially affect his livelihood, GEWP finds that local farmers are the most compelling salesmen. The company therefore invests heavily in training these “front-line” salesmen with basic marketing skills.
Given the logistical challenges involved in reaching rural areas with critical goods and services, distribution is an area with significant potential for partnerships. ITC Ltd, for example, an Indian multi-business conglomerate, shares its distribution platform with other companies for a fee. This reduces the costs of distribution for every stakeholder.
SUPPLIER MODEL Several inclusive businesses, especially those in the agriculture sector, engage BOP populations as suppliers of key inputs.
Figure 27: Distributor model strategies
37
44% of consumer oriented models invested in awareness generation, while almost 1/3rd
of distributor oriented companies appointed franchisees at the local level
NOTE: Some companies used strategies which were listed under different engagement models
SOURCE: Results from Dalberg-administered survey of inclusive businesses in India and Sri Lanka
models
18%
22%
22%
24%
26%
44%
Provide financing to meetcosts of up-front investment
12%
Decentralize productionto be close to distributors
13%
Partner with NGOs/MFIs to sell through their networks
21%
Identify & train micro-entrepreneurs
24%
Appoint franchiseesat the village level
28%
Other 10%
Engagement strategies of distributor models
N = 18
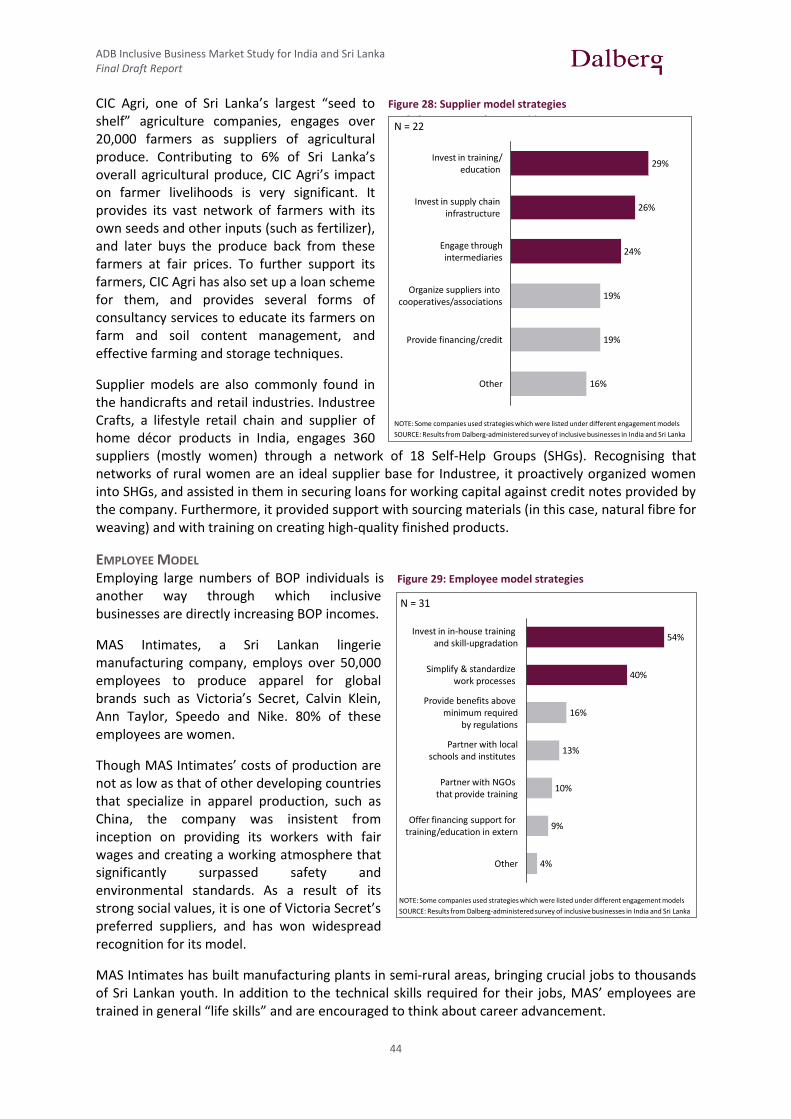
ADB Inclusive Business Market Study for India and Sri Lanka Final Draft Report
44
CIC Agri, one of Sri Lanka’s largest “seed to shelf” agriculture companies, engages over 20,000 farmers as suppliers of agricultural produce. Contributing to 6% of Sri Lanka’s overall agricultural produce, CIC Agri’s impact on farmer livelihoods is very significant. It provides its vast network of farmers with its own seeds and other inputs (such as fertilizer), and later buys the produce back from these farmers at fair prices. To further support its farmers, CIC Agri has also set up a loan scheme for them, and provides several forms of consultancy services to educate its farmers on farm and soil content management, and effective farming and storage techniques.
Supplier models are also commonly found in the handicrafts and retail industries. Industree Crafts, a lifestyle retail chain and supplier of home décor products in India, engages 360 suppliers (mostly women) through a network of 18 Self-Help Groups (SHGs). Recognising that networks of rural women are an ideal supplier base for Industree, it proactively organized women into SHGs, and assisted in them in securing loans for working capital against credit notes provided by the company. Furthermore, it provided support with sourcing materials (in this case, natural fibre for weaving) and with training on creating high-quality finished products.
EMPLOYEE MODEL Employing large numbers of BOP individuals is another way through which inclusive businesses are directly increasing BOP incomes.
MAS Intimates, a Sri Lankan lingerie manufacturing company, employs over 50,000 employees to produce apparel for global brands such as Victoria’s Secret, Calvin Klein, Ann Taylor, Speedo and Nike. 80% of these employees are women.
Though MAS Intimates’ costs of production are not as low as that of other developing countries that specialize in apparel production, such as China, the company was insistent from inception on providing its workers with fair wages and creating a working atmosphere that significantly surpassed safety and environmental standards. As a result of its strong social values, it is one of Victoria Secret’s preferred suppliers, and has won widespread recognition for its model.
MAS Intimates has built manufacturing plants in semi-rural areas, bringing crucial jobs to thousands of Sri Lankan youth. In addition to the technical skills required for their jobs, MAS’ employees are trained in general “life skills” and are encouraged to think about career advancement.
Figure 28: Supplier model strategies
Figure 29: Employee model strategies
33
The key strategy of IBs that engage the BoP either as employees or suppliers is to invest in training and skill development
40%
Other
Partner with localschools and institutes
4%
Simplify & standardize work processes
10%
Invest in in-house training and skill-upgradation
54%
9%
16%
13%
Provide benefits above minimum required
by regulations
Offer financing support for training/education in extern
Partner with NGOs that provide training
Invest in supply chain infrastructure
19%
Engage throughintermediaries
Organize suppliers into cooperatives/associations
19%
16%
24%
Other
Provide financing/credit
Invest in training/education
NOTE: Some companies used strategies which were listed under different engagement models
SOURCE: Results from Dalberg-administered survey of inclusive businesses in India and Sri Lanka
Engagement strategies of employee models
N = 31
Engagement strategies of supplier models
N = 22
33
The key strategy of IBs that engage the BoP either as employees or suppliers is to invest in training and skill development
Invest in supply chain infrastructure
19%
Engage throughintermediaries
Organize suppliers into cooperatives/associations
19%
26%
16%
24%
Other
Provide financing/credit
Invest in training/education
29%
Engagement strategies of supplier models
N = 22
NOTE: Some companies used strategies which were listed under different engagement models
SOURCE: Results from Dalberg-administered survey of inclusive businesses in India and Sri Lanka
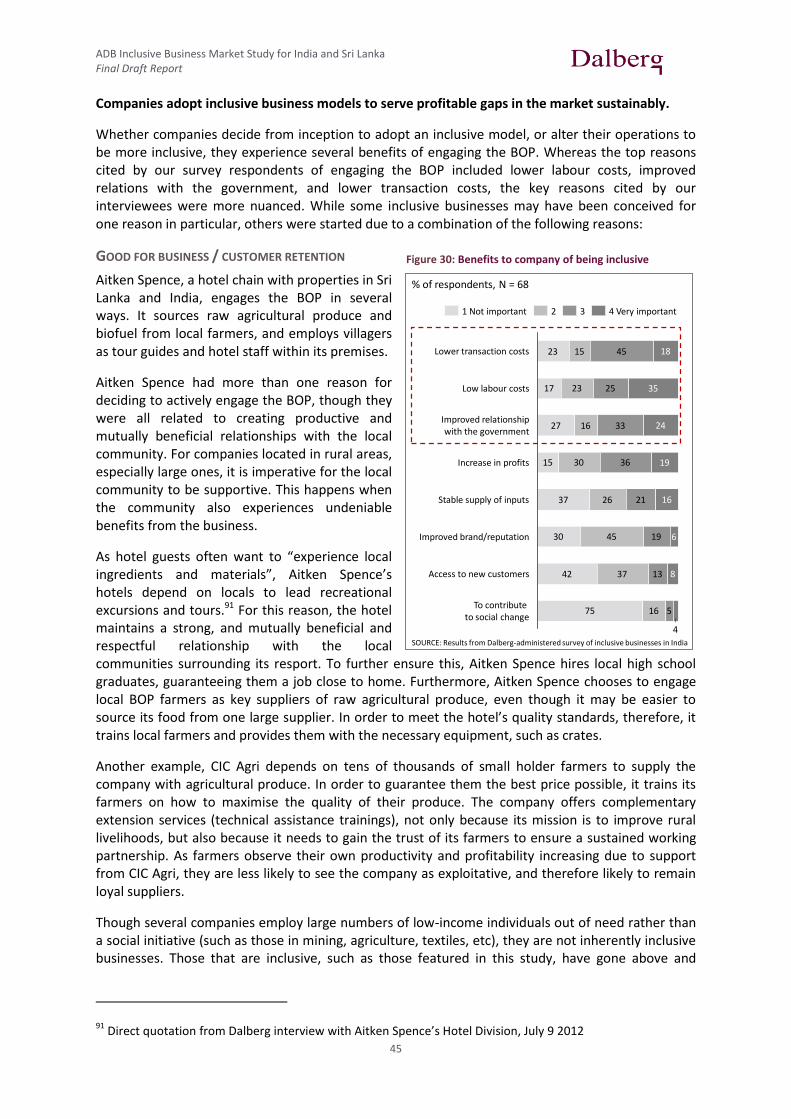
ADB Inclusive Business Market Study for India and Sri Lanka Final Draft Report
45
Companies adopt inclusive business models to serve profitable gaps in the market sustainably.
Whether companies decide from inception to adopt an inclusive model, or alter their operations to be more inclusive, they experience several benefits of engaging the BOP. Whereas the top reasons cited by our survey respondents of engaging the BOP included lower labour costs, improved relations with the government, and lower transaction costs, the key reasons cited by our interviewees were more nuanced. While some inclusive businesses may have been conceived for one reason in particular, others were started due to a combination of the following reasons:
GOOD FOR BUSINESS / CUSTOMER RETENTION
Aitken Spence, a hotel chain with properties in Sri Lanka and India, engages the BOP in several ways. It sources raw agricultural produce and biofuel from local farmers, and employs villagers as tour guides and hotel staff within its premises.
Aitken Spence had more than one reason for deciding to actively engage the BOP, though they were all related to creating productive and mutually beneficial relationships with the local community. For companies located in rural areas, especially large ones, it is imperative for the local community to be supportive. This happens when the community also experiences undeniable benefits from the business.
As hotel guests often want to “experience local ingredients and materials”, Aitken Spence’s hotels depend on locals to lead recreational excursions and tours.91 For this reason, the hotel maintains a strong, and mutually beneficial and respectful relationship with the local communities surrounding its resport. To further ensure this, Aitken Spence hires local high school graduates, guaranteeing them a job close to home. Furthermore, Aitken Spence chooses to engage local BOP farmers as key suppliers of raw agricultural produce, even though it may be easier to source its food from one large supplier. In order to meet the hotel’s quality standards, therefore, it trains local farmers and provides them with the necessary equipment, such as crates.
Another example, CIC Agri depends on tens of thousands of small holder farmers to supply the company with agricultural produce. In order to guarantee them the best price possible, it trains its farmers on how to maximise the quality of their produce. The company offers complementary extension services (technical assistance trainings), not only because its mission is to improve rural livelihoods, but also because it needs to gain the trust of its farmers to ensure a sustained working partnership. As farmers observe their own productivity and profitability increasing due to support from CIC Agri, they are less likely to see the company as exploitative, and therefore likely to remain loyal suppliers.
Though several companies employ large numbers of low-income individuals out of need rather than a social initiative (such as those in mining, agriculture, textiles, etc), they are not inherently inclusive businesses. Those that are inclusive, such as those featured in this study, have gone above and
91 Direct quotation from Dalberg interview with Aitken Spence’s Hotel Division, July 9 2012
Figure 30: Benefits to company of being inclusive
34
Whereas the top benefits to companies of adopting an inclusive model are financial, the BoP experience increased access to critical goods and services
23
17
27
15
37
30
42
75
15
23
16
30
26
45
37
16
45
25
33
36
21
19
13
5
4
To contribute to social change
Access to new customers 8
Improved brand/reputation 6
Stable supply of inputs 16
Increase in profits 19
Improved relationshipwith the government
24
Low labour costs 35
Lower transaction costs 18
1 Not important 2 3 4 Very important
SOURCE: Results from Dalberg-administered survey of inclusive businesses in India
40
37
43
40
33
67
72
20
29
29
36
51
18
21
2
12
Reduced discrimination 16
Stable or increasedincome
Access to information 9
Improved education/skills
Improved health/hygiene 20
Access to credit 20 15
Access to basic services 27 13
% of respondents, N = 68

ADB Inclusive Business Market Study for India and Sri Lanka Final Draft Report
46
beyond simply employing the BOP. They are either heavily investing in skills training, offering a higher-than-minimum salary, or providing them with significant benefits.
FILLING A PROFITABLE GAP IN THE MARKET Though some businesses may have been inherently inclusive from inception, they may have primarily started in order to fill a gap in the market.
Star Agri, for example, an agricultural production and supply chain company, was started when its co-founders recognized the glaring need to address India’s vast, disorganized agricultural sector. As a result of its operations, Star Agri benefits thousands of farmers as well as the companies that procure its produce.
Additionally, Vortex Engineering develops ATMs for “rugged”, rural areas. As traditional ATMs need to be maintained within a certain temperature range, they are inappropriate for rural areas, where there are often no reliable sources of energy to power an air conditioner. Vortex’s ATMs have been designed specifically with this environment in mind, and for use by BOP populations. There are now thousands of Vortex ATMs across India, bringing access to financial services to tens of thousands of rural populations. These BOP individuals are thus able to save and develop financial literacy, and government banks are now able to more effectively reach rural populations. Vortex is now poised to export its model to other countries in Asia and Africa.
The mode of engagement affects the benefits of IBs to the BOP; key benefits include improved access to critical goods and services and improved livelihoods.
As depicted in Figure 27, there are several key benefits to BOP populations of companies adopting inclusive models, the most important of which is increased access to basic services.
IMPROVED ACCESS TO CRITICAL GOODS AND SERVICES A key benefit to BOP populations of inclusive businesses is increased access to basic goods and services. In many cases these are services that the national government has failed to deliver adequately. Sarvajal, for example, a Gujarat-based company that builds reverse osmosis plants in rural areas, sells purified water to underserved communities. Due to its very low cost, consumers are able to afford clean water, and the company’s for-profit model keeps it sustainable.
Vortex is increasing access to financial services for rural populations with its “appropriate technology” ATMs, designed for energy-poor locations.
SKILLS DEVELOPMENT By engaging them as employees, distributors or suppliers, inclusive businesses are developing the skills of BOP populations. In addition to a steady source of income that is often the result of this engagement model, these skills empower the BOP and fundamentally alter their economic trajectory. MAS Holdings, an apparel manufacturing company based in Colombo, and one of Victoria Secret’s preferred manufacturers, employs thousands of youth from BOP backgrounds. Though their wages are not significantly higher than other employment opportunities available to educated youth
Figure 31: Benefits to the BOP of inclusive businesses
35
Whereas the top benefits to companies of adopting an inclusive model are financial, the BoP experience increased access to critical goods and services
SOURCE: Results from Dalberg-administered survey of inclusive businesses in India
37
43
40
33
67
72
20
29
29
36
51
18
21
40
2
20 8
Access to credit
Stable or increasedincome
6
Access to information 9 5
Improved education/skills 12 4
Reduced discrimination 16 9
Improved health/hygiene
20 15
Access to basic services 27 13
% respondents, N = 68
1 Not important 2 3 4 Very important

ADB Inclusive Business Market Study for India and Sri Lanka Final Draft Report
47
in Sri Lanka (due to a shortage of labour), the professional and life skills taught to MAS’ “team members” such as critical thinking and problem solving skills are significant non-financial benefits experienced by the employees. 92
INCREASED INCOMES Inclusive businesses that engage the BOP as suppliers, distributors and employees directly increase the incomes of these individuals. In most cases, these individuals are earning a higher income than they otherwise would without the presence of the inclusive business.
The agriculture companies included in our survey, such as Star Agri, CIC Agri and Nestle, all guarantee the highest possible price to the farmers that supply them with agricultural produce. Star Agri is able to do this by removing the multiple middle men who plague the Indian agricultural sector, impeding farmers from getting higher prices for their crop. CIC Agri and Nestle both train their farmers on how to improve the quality of their crop, to ensure that their produce is bought at a fair price. As a result, famers are earning higher incomes, benefitting from trainings that are very relevant to their livelihood generation, and are protected from exploitative middlemen.
Inclusive businesses may also indirectly contribute increased incomes. As a result of purchasing its solar lanterns, for example, Greenlight Planet’s customers are able to continue working during the events and nights, allowing them to be productive for longer hours each day.
75% of inclusive businesses in India are either directly or indirectly measuring their social impact.
Almost half of the IBs in our survey measure their social impact indirectly. This is mostly done by measuring output indicators, such as number of individuals trained, treated, employed, or with improved access to a critical good or service. IBs that are improving livelihoods tend to measure changes in income, number of jobs created, or changes in the expenditure of aspirational goods.
Direct measures of social impact, would include metrics such as an increase in awareness about commodity prices and differences in expenditure on healthcare services (to treat water-borne disease).
Inclusive businesses choose geographies similar to other businesses – presence of a strong market and local availability of human and material resources.
Across sectors, inclusive businesses have operations throughout India. This holds true for the Sri Lankan respondents as well. The majority of inclusive businesses have operations in at least one of India’s lowest income states. For some sectors, such as textiles and handicrafts, it is more advantageous for production to take place in the lower-income states, given the large availability of labour.
A few companies, however, lament the fact that logistical challenges and poor infrastructure make it very difficult to operate in these states. Some consumer-oriented IBs are fearful of the population’s poor credit record and subsequent reluctance of financial institutions to serve this region. This would hamper on their ability to partner with a financial institution to facilitate sales. Furthermore, some companies view local experience as a key criterion for operating in this region.
92 “Team members” is the official name of MAS’ factory workers
Figure 32: Level of social impact measurement
36
Measuring social impact
Do not measure
30%
25%
Directly measure
Indirectly measure 45%
SOURCE: Results from Dalberg-administered survey of inclusive businesses in India
Direct• Increase in salary• Increase in cultivated land• Increase in productivity/yields• Number of farmers engaged• Milk collection per farmer • Awareness about commodity prices• Consumption patterns• Amount saved by water consumers on
health
Indirect- Number of patients treated- Number of persons trained- Number of users, drink water users, - Access to energy - No. of cities reached, number of water centers, - No of camps conducted- Number of jobs created- Reduction in kerosene usage, expenditure on energy - Aspirational goods purchased- Co2 reduction - Rise in students trained
% of respondents, N = 64

ADB Inclusive Business Market Study for India and Sri Lanka Final Draft Report
48
Figure 33: Geographical spread of IB operations
STRONG MARKET When choosing where to operate, consumer-oriented inclusive businesses first determine whether or not there is a market for its good/service in a prospective region. Attractive geographies would be ones in which there is a lack of access to this good/service. Some consumer-oriented companies also need to ensure that the BOP population has a minimum level of purchasing power. Other IBs focus more on where the need for their service is the strongest, and which areas have the largest BOP populations.
One way that geographic expansion is achieved at a low-cost is franchising. AISECT, for example, has expanded to 27 states and 3 union territories because of its franchise network. In addition to being a low-cost model (the company does not have to bear the cost of building new facilities), local entrepreneurs who start each new AISECT centre have crucial local knowledge to leverage.
AVAILABILITY OF KEY INPUTS Many inclusive businesses choose their geographic location based on key inputs. Desicrew, for example, which runs rural Business Process Outsourcing (BPO) centers in Karnataka, chooses the location of its centers based on the availability of infrastructure, universities, and proximity to a major railway stop. This would ensure a steady supply of young, educated graduates to employ.
Further, some IBs choose to locate where there is a strong presence of a complementary sector. SELCO, for example, a company that sells solar lighting products to off-grid and underserved rural populations, chooses to operate in areas with a strong and mature banking sector. Financing partners are needed to provide its consumers with financing options.
Waterhealth International, which sells purified drinking water to rural populations, chooses areas with a good supply of groundwater when identifying where to expand its centres.
Edubridge, a training centre for rural youth, chooses to locate its activities where there is a presence of on-the-ground partners. Star Agri, an agricultural production company, assesses for the total population of farmers, the presence of potential substitutes to Star Agri’s services, and the relative ease of doing business in particular states.
37
N=68
Respondents covered a variety of sectors, with nearly every sector having a pan-India presence
SOURCE: Results from Dalberg-administered survey of inclusive businesses in India and Sri Lanka
1
LIS only Including LIS Non LIS
Hospitality andtourism
BFSI 333% 67%
Textiles, garmentsand handicrafts
367% 33%
Real estate / construction 333% 67%
Retail 580% 20%
Water and sanitation 743% 57%
Energy 714% 57% 29%
Education 729% 57% 14%
Healthcare 922% 44% 33%
Telecom,BPO and IT 1010% 70% 20%
Agri-business 138% 62% 31%

ADB Inclusive Business Market Study for India and Sri Lanka Final Draft Report
49
PERCEPTIONS OF OPERATING IN INDIA’S LOWEST INCOME STATES Interestingly, perceptions of operating in India’s low-income states is more or less similar between those IBs that already have operations in these geographies compared to those that do not. The biggest concern is the lack of infrastructure in these states. Other risks are perceived to be the difficulty of finding skilled manpower, and a low willingness of consumers to pay for goods or services.
Figure 34: Perceptions of operating in low-income states
Of note is the observation that 50% of our respondents that do not have operations in low income states perceive the security concerns in low income states to be a significant challenge, whereas only about a third of IBs working in this area agree with this view.
Another interesting observation is companies without operations in low income states do not perceive the lack of talent to be as acute a challenge as it apparently is, according to those that have experienced this. Furthermore, IBs unfamiliar with low income states do not think cultural barriers would be an issue, whereas one fifth of IBs in low income states believe this to be an issue.
Technology and cost management will remain the critical success factors for inclusive businesses.
TECHNOLOGY HAS THE POTENTIAL TO SIGNIFICANTLY INCREASE THE IMPACT OF INCLUSIVE BUSINESSES The majority of inclusive businesses, not unlike any business, would benefit greatly with access to technological products. Across all sectors, technology was identified as a key factor to the success of IBs.
43
Concerns with operating in low income states are related to poor infrastructure and manpower; security concerns are higher among IBswith no presence in LIS
SOURCE: Results from Dalberg-administered survey of inclusive businesses in India and Sri Lanka
10
22
29
32
41
41
49
63
13
6
31
50
31
38
19
69
No challengesexperienced/perceived
Cultural barriers
Lack of relevantphysical conditions
Security concernsor poor law enforcement
Low willingness to pay
Regulatory risk
Lack of skilled manpower
Poor infrastructure
No LIS presence
LIS presence
% of companies operating in that geography, N=59
Figure 35: Critical growth factors
48
% of companies which marked the factor, N=60
Scarcity of talent and company innovation are critical to the growth of IBs, though specific success factors vary across sectors
SOURCE: Results from Dalberg-administered survey of inclusive businesses in India and Sri Lanka
Which of the following have a potential
to hamper the growth of your IB ?
19%
14%
51%
22%
51%Access to technology
Rise in domesticconsumption
Company innovation
Government incentives
71%
Increasing exportopportunities
Lower cost ofphysical inputs
Lower cost ofhuman resources
M&A opportunities
27%
32%
High labour costs
Scarcity of quality talent
Consumer reluctanceto change behaviour
Access to working capital
Finance for capital investments
High cost of non-labour inputs
Regulatory complexity
Poor infrastructure
72%
60%
57%
48%
45%
38%
28%
25%
Which of the following have a potential to
enable the growth of your IB?
% of companies which marked the factor, N=59

ADB Inclusive Business Market Study for India and Sri Lanka Final Draft Report
50
Greenlight Planet, for example, is currently piloting the use of mobile technology to track the sales of its 1,000 distributors. This would result in real-time data that would allow optimal inventory management and sales trends. They are also experimenting with remote product monitoring technology that will help them develop new, affordable leasing models.
Technology is also seen as the key to keeping a large network of decentralized stakeholders engaged. AISECT, which has set up thousands of centers throughout India that offer educational and skills training services to rural youth, sees technology as the way to improve processes and its management information systems. Star Agri, an agricultural production company, would use technology to keep its network of thousands of farmers quickly and effectively informed of the services available to them, which many farmers are not even aware of.
Companies like Shree Kamdhenu Electronics are allowing dairy farmer collectives to gain from the growing demand for dairy products by supplying them with technology with which to improve the quality of their milk. Electronic measurement and quality testing products allow these collectives to assess for themselves the quality of their milk, making the milk collection process transparent and efficient.
The role of technology will be particularly important for businesses in the agricultural sector. As agricultural companies strive to capture more value, they will focus on producing more value-added products, such as cheese and yoghurt. Unlike traditional farming practices, this will require more machinery. In the Sri Lankan market, this development will happen with a growth in its GDP per capita, which is expected to increase from its current level of $2,800 to $4,000 by 2016. Demand for dairy and processed food products will increase as incomes and tourism rises.
Furthermore, whereas more than half of India’s BOP population is rural and subsistent on agriculture, Sri Lanka’s labour market is tight, and as incomes rise, labour is expected to move out of agriculture. As machinery will be needed to replace farmers, technology will play a greater role in the future growth of agricultural companies. The use of technology would not only increase productivity, a key priority for Sri Lanka’s agriculture sector, but it would contribute to improved farmer livelihoods. CIC Agri, a big agribusiness company, believes its farmers’ incomes could be doubled with technology.
COST MANAGEMENT Another key success factor for inclusive businesses is the ability to keep costs as low as possible. Apollo’s Reach Hospitals, for example, need to keep operating costs at a minimum to ensure its services stay affordable for its target rural patients. It is not only
consumer-oriented IBs that feel the pressure to maintain costs, however. Desicrew, which builds rural BPOs in India, has targets for its centres to have standardized costs, so that the company can remain competitive.
Lack of access to affordable working capital, complexity in the regulatory environment, and shortage in qualified manpower are key challenges to the growth of inclusive businesses.
LACK OF ACCESS TO AFFORDABLE WORKING CAPITAL In both India and Sri Lanka, inclusive businesses are facing a significant challenge of not having access to affordable working capital. Ideally, working capital could be raised in the form of debt from
Figure 36: Key risk factors
48
% of companies which marked the factor, N=60
Scarcity of talent and company innovation are critical to the growth of IBs, though specific success factors vary across sectors
SOURCE: Results from Dalberg-administered survey of inclusive businesses in India and Sri Lanka
Which of the following have a potential
to hamper the growth of your IB ?
19%
14%
51%
22%
51%Access to technology
Rise in domesticconsumption
Company innovation
Government incentives
71%
Increasing exportopportunities
Lower cost ofphysical inputs
Lower cost ofhuman resources
M&A opportunities
27%
32%
High labour costs
Scarcity of quality talent
Consumer reluctanceto change behaviour
Access to working capital
Finance forcapital investments
High cost ofnon-labour inputs
Regulatory complexity
Poor infrastructure
72%
60%
57%
48%
45%
38%
28%
25%
Which of the following have a potential to
enable the growth of your IB?
% of companies which marked the factor, N=59

ADB Inclusive Business Market Study for India and Sri Lanka Final Draft Report
51
a local bank. However, in India, banks traditionally do not give debt to young companies, especially those without assets/collateral. Banks regard businesses that have been operational for several years to be safe investees. However, consumer-focused inclusive businesses often adopt an asset-light model, to keep costs down and thereby stay affordable for BOP consumers, reducing their ability to provide collateral. As local banks tend to regard young companies as too risky, working capital needs are often most pressing during the early stages in a business’ growth trajectory.
Greenlight Planet, for example, has stated that its only major bottleneck to growth is a lack of working capital. They are able to fund all their operations with existing capital reserves, but the unavailability of affordable working capital is the only reason why it is not already operating in more states across India.
As expressed by several companies, access to debt would help ease the pressure on working capital, and would enable them to grow faster. Global Easy Water Products (GEWP), that sells affordable drip irrigation technology to small-holder farmers in India, finds it challenging to keep inventory in time for its busiest season due to its tight cash flow. Water Health International, which sells purified drinking water to rural populations, and Apollo, a leading hospital in India that is launching tertiary healthcare centres in Tier II and III cities, have both received debt funding from the IFC at cheaper rates than those offered by Indian banks such as ICICI.
In Sri Lanka, debt is similarly expensive; however this problem has not disproportionately affected inclusive businesses, as in India. Whereas in India, interest rates on debt for early-stage inclusive businesses are a reflection of their perceived risk level, in Sri Lanka government policy has dictated much higher interest rates, aimed at correcting the country’s severe balance of payments situation. Since January 2012, Sri Lanka has hiked interest rates by 75 basis points, or approx 11%.
Sri Lankan companies are therefore not growing as fast as they could be with additional funding. Kelani Valley Plantations, for example, a company that produces high quality tea and rubber in its estates, has found that the return on an investment to replant ageing tea bushes would not be high enough to cover current interest rates. As a result, the only investments made are funded by a small percentage of its annual profits.
The Sri Lankan inclusive businesses included in this study, however, are quite big. For them, a lack of financing is impeding fast expansion of an already large and established business. Smaller inclusive businesses in India that are either approaching profitability or recently achieved profitability do not have the options that some Sri Lankan companies have. CIC Agri and MAS Intimates, for example, has grown using its own capital and MAS Holdings has grown through joint ventures with other companies.
COMPLEXITY IN REGULATORY ENVIRONMENT Though some inclusive businesses were started to provide an alternative, market-based approach to the traditional government-provided basic services, others are large corporations with a large impact on the local economy and their operations could be significantly improved with the right government policy. Lack of adequate support from government on problems that need to be solved at an industry-wide or nation-wide level is an issue for companies in both India and Sri Lanka.
Agricultural companies across Sri Lanka, for instance, are facing the challenge of low productivity. Nestle Lanka, for example, suffers from low productivity of its dairy farmers. Sri Lanka’s production per cow is 3 litres, compared to India’s 9-10 litres, Pakistan’s 20 litres and New Zealand’s 30 litres.93 The government has increased the purchase price of milk, which has increased the supply of milk, but the productivity has not changed. This productivity issue is not one that can be solely solved with
93 Direct quotation from Dalberg interview with Nestle Lanka, July 11 2012
ADB Inclusive Business Market Study for India and Sri Lanka Final Draft Report
52
financing; ideally the Sri Lankan government would be involved in attempts to systematically increase the country’s milk production capacity as it would require working with technical experts from other countries and making use of artificial insemination on a national scale.
Tourism is another sector whose growth is currently stifled due to a lack of government support, as is the case in Sri Lanka, where tourism is likely to grow exponentially and contribute significantly to GDP growth over the next several years. There is currently a gap, however, between the country’s current capacity and what is needed to accommodate the 1.5 million tourists per year expected by 2016. Though extensive infrastructure development is required, the private sector is reluctant to make the necessary investments without active government support to promote tourism (especially to promote Sri Lanka as a high-end destination).
In India, GEWP experiences negative impacts on its businesses when local politicians promise the distribution of free drip irrigation systems for farmers during election season. Government subsidies are furthermore allowing inefficient competitors to stay in business. Removing these subsidies would force manufacturers of drip irrigation products to stay innovative. When companies supply these products to the government (as opposed to GEWP’s model of selling directly to farmers), they are not forced to optimize the effectiveness of their products.
Waterhealth International also disagrees with government subsidies on water, stating that the distorted price of water does not incentivize people to understand the true scarcity, and therefore value, of purified water.
On the other hand, several inclusive businesses have benefitted significantly from support from the government. Vortex, for example, has received government support to set up ATMs in rural areas. AISECT and Edubridge, two education and skills training organizations, have received a credit line from the National Skills Development Corporation at a concessionary rate, which proved critical to their scale. In the case of AISECT, these funds are financing expansion into new states, the cost of manpower, as well as content development and process improvement throughout the company.
Government policy can therefore either support or restrict the growth of inclusive businesses. By partnering with businesses, governments can provide crucial support to inclusive initiatives, if not financially then by supporting their image/credibility.
LACK OF TALENT A common issue for IBs in India and Sri Lanka is the shortage of technical and managerial talent. Apollo, a leading hospital chain in India, is experiencing a problem faced by the healthcare sector as a whole in India; the lack of skilled manpower. This is a bottleneck faced by other sectors too; Star Agri, an agricultural production company, finds it hard to find talented business managers.
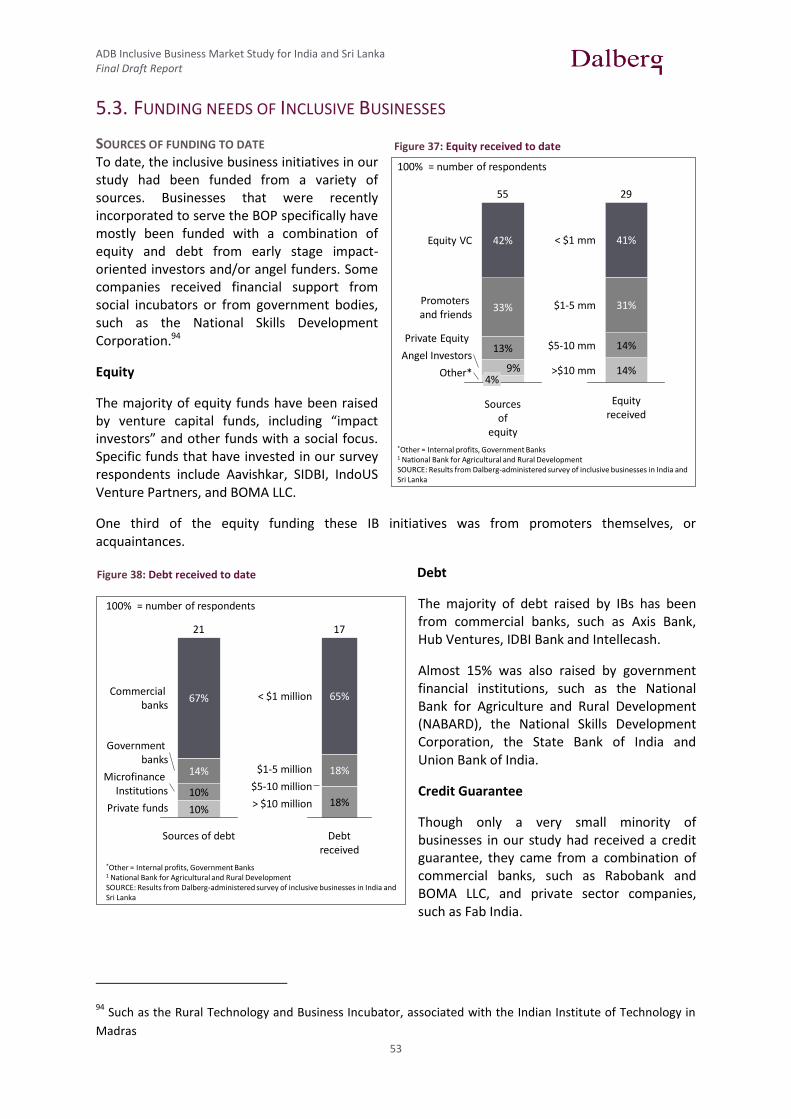
ADB Inclusive Business Market Study for India and Sri Lanka Final Draft Report
53
5.3. FUNDING NEEDS OF INCLUSIVE BUSINESSES
SOURCES OF FUNDING TO DATE To date, the inclusive business initiatives in our study had been funded from a variety of sources. Businesses that were recently incorporated to serve the BOP specifically have mostly been funded with a combination of equity and debt from early stage impact-oriented investors and/or angel funders. Some companies received financial support from social incubators or from government bodies, such as the National Skills Development Corporation.94
Equity
The majority of equity funds have been raised by venture capital funds, including “impact investors” and other funds with a social focus. Specific funds that have invested in our survey respondents include Aavishkar, SIDBI, IndoUS Venture Partners, and BOMA LLC.
One third of the equity funding these IB initiatives was from promoters themselves, or acquaintances.
Debt
The majority of debt raised by IBs has been from commercial banks, such as Axis Bank, Hub Ventures, IDBI Bank and Intellecash.
Almost 15% was also raised by government financial institutions, such as the National Bank for Agriculture and Rural Development (NABARD), the National Skills Development Corporation, the State Bank of India and Union Bank of India.
Credit Guarantee
Though only a very small minority of businesses in our study had received a credit guarantee, they came from a combination of commercial banks, such as Rabobank and BOMA LLC, and private sector companies, such as Fab India.
94 Such as the Rural Technology and Business Incubator, associated with the Indian Institute of Technology in
Madras
Figure 37: Equity received to date
49
Funding to date of IBs – equity and debt
administered survey of inclusive businesses in India and
29
14%
14%
31%
41%
Equity Received
Sources of equity funding:• Aavishkar• BOMA LLC• SIDBI VC • IndoUS Venture
Partners
> $10 million
$5-10 million
$1-5 million
< $1 million
Debt received
17
18%
18%
65%
10%
67%
14%
10%
21
Private funds
Commercial banks
Microfinance Institutions
Government banks
Sources of debt
Sources of debt funding:
• Axis Bank• NABARD1
• Hub Ventures• IDBI Bank • NSDC• Union Bank of
India• SBI• Intellecash
100% = number of respondents
*Other = Internal profits, Government Banks1 National Bank for Agricultural and Rural DevelopmentSOURCE: Results from Dalberg-administered survey of inclusive businesses in India and Sri Lanka
Figure 38: Debt received to date
49
Funding to date of IBs – equity and debt
*Other = Internal profits, Government Banks1 National Bank for Agricultural and Rural DevelopmentSOURCE: Results from Dalberg-administered survey of inclusive businesses in India and Sri Lanka
Other*
Angel Investors
Private Equity
Promoters and friends
Equity VC
55
4%9%
13%
33%
42%
Sourcesof
equity
>$10 mm
$5-10 mm
$1-5 mm
< $1 mm
29
14%
14%
31%
41%
Equity received
Sources of equity funding:• Aavishkar• BOMA LLC• SIDBI VC • IndoUS Venture
Partners
Private funds
Commercial banks
Microfinance Institutions
Government banks
Sources of debt
Sources of debt funding:
• Axis Bank• NABARD1
• Hub Ventures• IDBI Bank • NSDC• Union Bank of
India• SBI• Intellecash
100% = number of respondents
100% = number of respondents
*Other = Internal profits, Government 1 National Bank for Agricultural and Rural DevelopmentSOURCE: Results from DalbergSri Lanka

ADB Inclusive Business Market Study for India and Sri Lanka Final Draft Report
54
FINANCING REQUIREMENTS As depicted in the figures below, inclusive businesses across all sectors represented in our survey require an investment amount that matches ADB’s proposed deal size, but especially those in the Telecom, Education and Energy sectors.
51
Funding to date of IBs – equity and debt
*Other = Internal profits, Government Banks1 National Bank for Agricultural and Rural DevelopmentSOURCE: Results from Dalberg-administered survey of inclusive businesses in India and Sri Lanka
Sources of equity funding:• Aavishkar• BOMA LLC• SIDBI VC • IndoUS Venture
Partners
100% = number of respondents
Privatesector
company
Commercial banks
5
60%
40%
Sources of credit guarantees
>$10 mm
$5-10 mm
$1-5 mm
< $1 mm
3
33%
67%
Credit guarantees
received
45
N = 56
Our proposed deal size meets the requirements of companies across multiple sectors, especially Information Technology, Education and Energy
SOURCE: Results from Dalberg-administered survey of inclusive businesses in India and Sri Lanka
14%
17%
29%
40%
45%
50%
33%
33%
13%
50%
50%
33%
33%
50%
Real estate / construction 2
BFSI 1
Textiles, garmentsand handicrafts
333%
Telecom and IT 333%
Healthcare 813% 25%
Water and sanitation 450%
Agri-business 1136% 18%
Retail 560%
Energy 729% 43%
Education 667% 17%
Telecom, BPO and IT 757% 29% < $1 million
$1 - 5 million
$5 - 10 million
> $10 million
Figure 40: Required investment size, by sector
Figure 39: Credit guarantees received to date
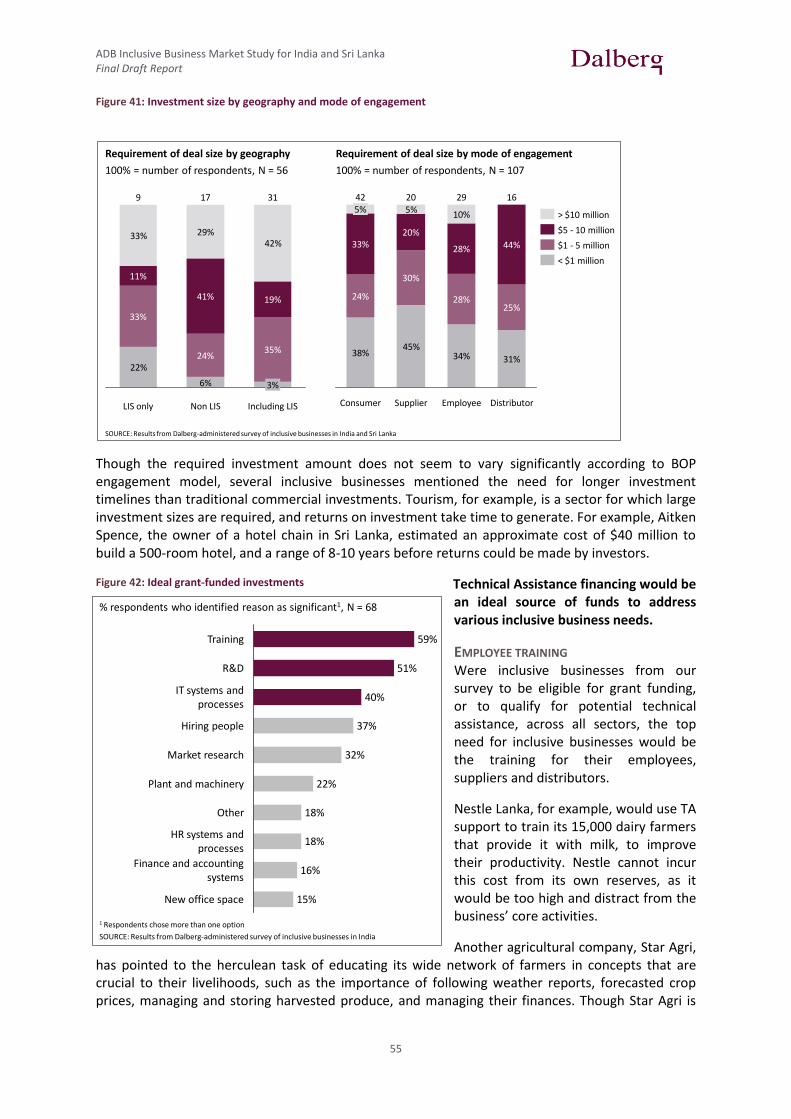
ADB Inclusive Business Market Study for India and Sri Lanka Final Draft Report
55
Figure 41: Investment size by geography and mode of engagement
Though the required investment amount does not seem to vary significantly according to BOP engagement model, several inclusive businesses mentioned the need for longer investment timelines than traditional commercial investments. Tourism, for example, is a sector for which large investment sizes are required, and returns on investment take time to generate. For example, Aitken Spence, the owner of a hotel chain in Sri Lanka, estimated an approximate cost of $40 million to build a 500-room hotel, and a range of 8-10 years before returns could be made by investors.
Technical Assistance financing would be an ideal source of funds to address various inclusive business needs.
EMPLOYEE TRAINING Were inclusive businesses from our survey to be eligible for grant funding, or to qualify for potential technical assistance, across all sectors, the top need for inclusive businesses would be the training for their employees, suppliers and distributors.
Nestle Lanka, for example, would use TA support to train its 15,000 dairy farmers that provide it with milk, to improve their productivity. Nestle cannot incur this cost from its own reserves, as it would be too high and distract from the business’ core activities.
Another agricultural company, Star Agri, has pointed to the herculean task of educating its wide network of farmers in concepts that are crucial to their livelihoods, such as the importance of following weather reports, forecasted crop prices, managing and storing harvested produce, and managing their finances. Though Star Agri is
46
It is also compatible across geographies and modes of engagement
SOURCE: Results from Dalberg-administered survey of inclusive businesses in India and Sri Lanka
Requirement of deal size by geography
100% = number of respondents, N = 56
22%
33% 29%42%
6%
Including LIS
31
3%
35%
19%
Non LIS
17
24%
41%
LIS only
9
33%
11%
< $1 million
$1 - 5 million
$5 - 10 million
> $10 million
38%45%
34% 31%
5% 10%
Distributor
16
25%
44%
Employee
29
28%
28%
Supplier
20
30%
20%
Consumer
42
24%
33%
5%
Requirement of deal size by mode of engagement
100% = number of respondents, N = 107
Figure 42: Ideal grant-funded investments
47
Inclusive businesses would use grant funding to increase training, R&D and their use of technology
15%New office space
Finance and accountingsystems
16%
HR systems andprocesses
18%
Other 18%
Plant and machinery 22%
Market research 32%
Hiring people 37%
IT systems andprocesses
40%
R&D 51%
Training 59%
% respondents who identified reason as significant1, N = 68
1 Respondents chose more than one option
SOURCE: Results from Dalberg-administered survey of inclusive businesses in India
ADB Inclusive Business Market Study for India and Sri Lanka Final Draft Report
56
taking on the cost of this training itself, further training is an area into which it would benefit from TA funding.
Jaipur Rugs, a Rajasthan-based manufacturer of high quality hand-knotted carpets would benefit from further developing the skills of its 40,000 carpet weavers, and developing business literacy to improve upward communication from the weavers to managers.
All these companies are currently taking on the cost of such trainings themselves, as they have no choice and doing so is crucial to their business. Since every business is constrained by its own funding capacity and manpower, and there is an obvious trade-off with other areas which could be supported with these resources (especially activities that are core business priorities). They are inevitably growing more slowly than would be the case if this investment could be made with grant funding. A few IBs, such as Aitken Spence, Industree Crafts and AISECT, have set up foundations to absorb grant funds from government and other sources to be deployed towards training.
RESEARCH AND DEVELOPMENT The second key area IBs would like to strengthen is Research and Development (R&D). Given that R&D projects are usually relatively riskier initiatives and are regarded as an investment rather than revenue-generating activity for the business, most IBs would use grant funding for this cost. Greenlight Planet, for example, would use TA funding to work on developing new models of solar lamps.
DEVELOPING IT SYSTEMS The third area that IBs would like to strengthen is the use of IT systems and processes to improve their operational efficiency. IBs across sectors referred to the desire to improve their processes through the use of technology. Waterhealth International (WHI), for example, recognized the need to build an online enterprise resource planning system to streamline its operations. The costs involved in procuring a custom-made system were too prohibitive for the company, however, so WHI created the system itself. Unfortunately, due to the significant financial and non-financial resources that were devoted to developing this system, WHI is now reluctant to share its platform with other businesses. As technological investments are often costly, but generate multiple benefits, this is an investment that inclusive businesses would make with technical assistance.

ADB Inclusive Business Market Study for India and Sri Lanka Final Draft Report
57
5.4. IMPLICATIONS FOR ADB
INDIA Small and medium companies, across modes of engaging the BOP, need ADB’s support in the early growth stage more than larger firms.
Inclusive businesses in the early growth stage where funding requirements are in the range of $1-$10 million are not likely to receive affordable debt from local banks, regardless of strong growth potential, social impact, and mode of engaging the BOP. Their equity requirements also remain unmet due to the low limit on funds available with existing seed fund providers and impact investors in the country.
Larger companies are able to attract commercial funding more easily. Star Agri, for example, has recently raised $30 million from IDFC, India’s leading infrastructure finance company. ADB could fill a big gap in this sector and provide crucial funding (equity and debt) to inclusive businesses that don’t yet have a brand to support it. Given that the key challenge facing firms in accessing debt is the lack of collateral, ADB should consider setting up a debt financing facility and a credit guarantee scheme that enhances the ability of these IBs to access bank loans at reasonable rates.
SRI LANKA Investments in consumer models are likely to be less impactful in the long term.
Unlike India, Sri Lanka’s BOP population has a relatively higher quality of life, especially with regards to access to water, energy, education and healthcare. The presence of trade unions also ensures that workers in organized sectors, such as tea harvesting, have the ability to negotiate for certain benefits and working standards. Tea plantation workers, for example, who are considered to be among the most deprived segment of the population, tend to earn a minimum of $4 per day, excluding other benefits such as social security and housing. Furthermore, as Sri Lanka’s population is declining and labour shortages are increasing wages, Sri Lanka’s BOP is likely to experience increases in income in the future, which would propel them out of the BOP classification.
Businesses that focus on providing basic services at affordable prices to consumers therefore will likely not be as successful, as this population will start preferring aspirational goods.
Investments that maximize job creation would lead to greater social impact.
Considering Sri Lanka’s weak job market, investing in SMEs, would generate much needed jobs. Furthermore, setting up business operations in rural areas, where there are few employment opportunities, creates a ripple effect as complementary businesses start mushrooming to service key industries. Companies operating in the Northeast of the country would have an especially large impact on the local communities, which have the country’s worse socioeconomic indicators due to the recently ended war.

ADB Inclusive Business Market Study for India and Sri Lanka Final Draft Report
58
6. PE MARKETS ASSESSMENT
6.1. OVERVIEW OF OUR METHODOLOGY
The following private equity market assessment for India and Sri Lanka adopts a two pronged methodology for data collection: 1) primary data collection from direct interviews with a broad range of fund managers, and 2) synthesis of secondary information from a literature review. Our team interviewed 21 fund managers, representing both impact investors and commercial investors.
While selecting fund managers to be part of the study, Dalberg’s team focused on 4 key parameters: inclusive business-focus; sector-focus; geographic-focus; and target stage of investment. Below is a list of all fund managers we interviewed in India and Sri Lanka:
While Dalberg’s team found several relevant fund managers to interview in India from a reasonably large pool of private equity players, Sri Lanka’s PE market on the whole is very nascent. As a result, the sample includes only 2 funds from Sri Lanka (LR Global and Aureos), compared to 14 from India, and another 3 that focus on emerging markets globally and have a footprint in both India and Sri Lanka. Two of the India-based funds have an exclusive focus on India’s low-income states. Further, the sample includes adequate representation from early-stage (9 out of 20) and growth-stage (11 out of 20) investors. The profiles of these 21 fund managers are represented in the figure below.
Weinterviewed21fundmanagersselectedalong4keyparameters–focusonIBs,sectorfocus,geographyfocusandstageofinvestment
SOURCE:Interviewswithfundmanagers
Fundmanager FocusonIB? Sectorfocus Geographicfocus Stageofinvestment
Sampleinvestment
Aavishkaar Yes Agnos c India Early ServalsAutoma on(Efficientcookstoves)
Ac s No Agnos c EmergingMarkets Growth IDFC(BFSI),SterlingAddLife(Health)
AcumenFund Yes Agnos c EmergingMarkets Early HuskPowerSystems(Villageelectrifica on)
AureosCapital No(SME) Agnos c EmergingMarkets Growth Con nentalWarehousing(Transporta on)
BambooFinance Yes Agnos c India Early CoastCoconutFarms(Agri-processing)
ElevarEquity Yes Agnos c India Growth AarushaHomes(Lowcosthousing)
GrayGhost Yes Agnos c EmergingMarkets Early BookBox(Vernaculareduca onso ware)
IIP Yes Healthcare India Growth Noinvestmentsmadeyet
ImprintCapital Yes Agnos c EmergingMarkets Growth
Indo-US No IT/ITES India Early Grada m(ITpla ormsformicro-banking)
LokCapital Yes Agnos c India Early BasixMicrofinance
LRGlobal No Agnos c SriLanka Growth DelmegGroup(Conglomerate)
NEA No Agnos c India Growth
NereusCapital No Energy India Growth N/A
Praga No(SME) Agnos c LIS Growth JashEngineering(Waste-waterrecycling)
RaboEquity Yes Agribusiness India Growth SuperAgriSeeds(Agri-inputs)
SamriddhFund No(SME) Agnos c LIS Early PrateekApparels(Tex les)
SEAF Yes Agribusiness India Growth AbhayCotex(Co onseedprocessing)
SongAdvisors Yes Agnos c India Early
Zephyr No(SME) Agnos c India Growth WLCIndia(Voca onaltraining)
Tobenamed No Agnos c SriLanka Growth Noinvestmentsmadeyet
Figure 43: List of fund managers interviewed
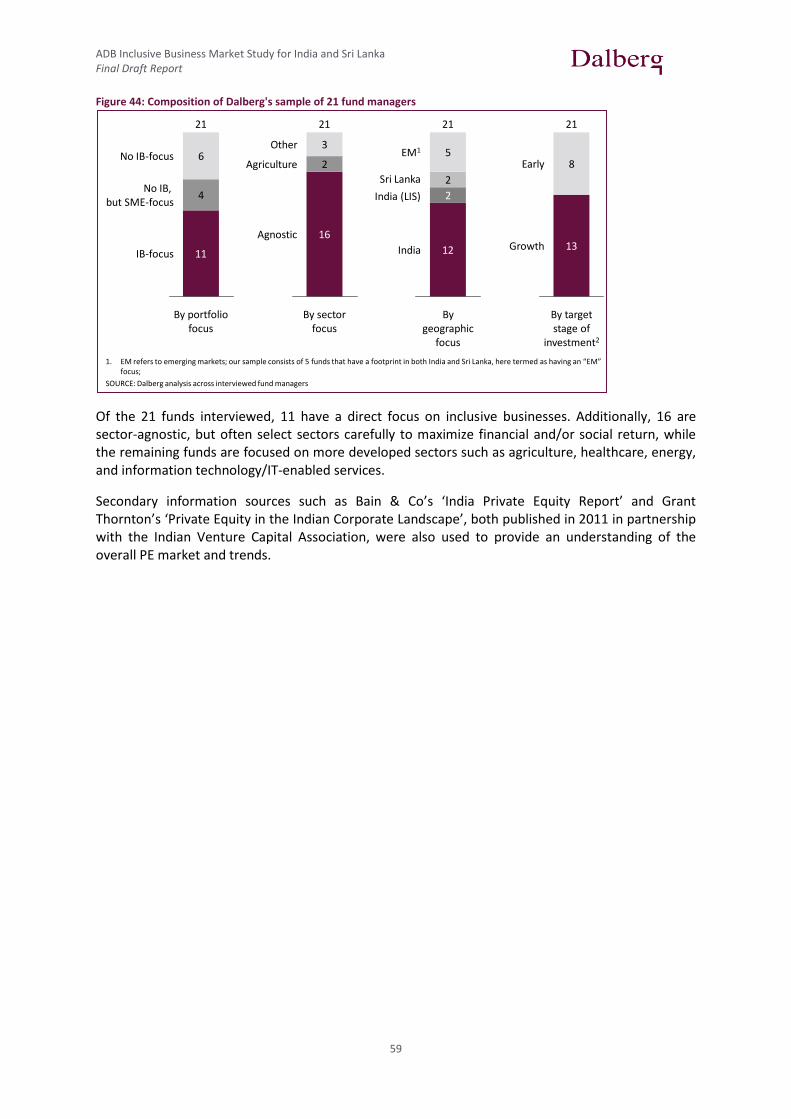
ADB Inclusive Business Market Study for India and Sri Lanka Final Draft Report
59
Figure 44: Composition of Dalberg's sample of 21 fund managers
Of the 21 funds interviewed, 11 have a direct focus on inclusive businesses. Additionally, 16 are sector-agnostic, but often select sectors carefully to maximize financial and/or social return, while the remaining funds are focused on more developed sectors such as agriculture, healthcare, energy, and information technology/IT-enabled services.
Secondary information sources such as Bain & Co’s ‘India Private Equity Report’ and Grant Thornton’s ‘Private Equity in the Indian Corporate Landscape’, both published in 2011 in partnership with the Indian Venture Capital Association, were also used to provide an understanding of the overall PE market and trends.
30
6. Composition of Dalberg’s selected sample of 21 fund managers
1. EM refers to emerging markets; our sample consists of 5 funds that have a footprint in both India and Sri Lanka, here termed as having an “EM” focus;
SOURCE: Dalberg analysis across interviewed fund managers
IB-focus
No IB, but SME-focus
No IB-focus
By portfolio focus
21
11
4
6
By sector focus
21
16
2
3
Agnostic
Agriculture
Other
2
5
India
India (LIS)
Sri Lanka
EM1
By geographic
focus
21
12
2
Growth
Early
By target stage of
investment2
21
13
8
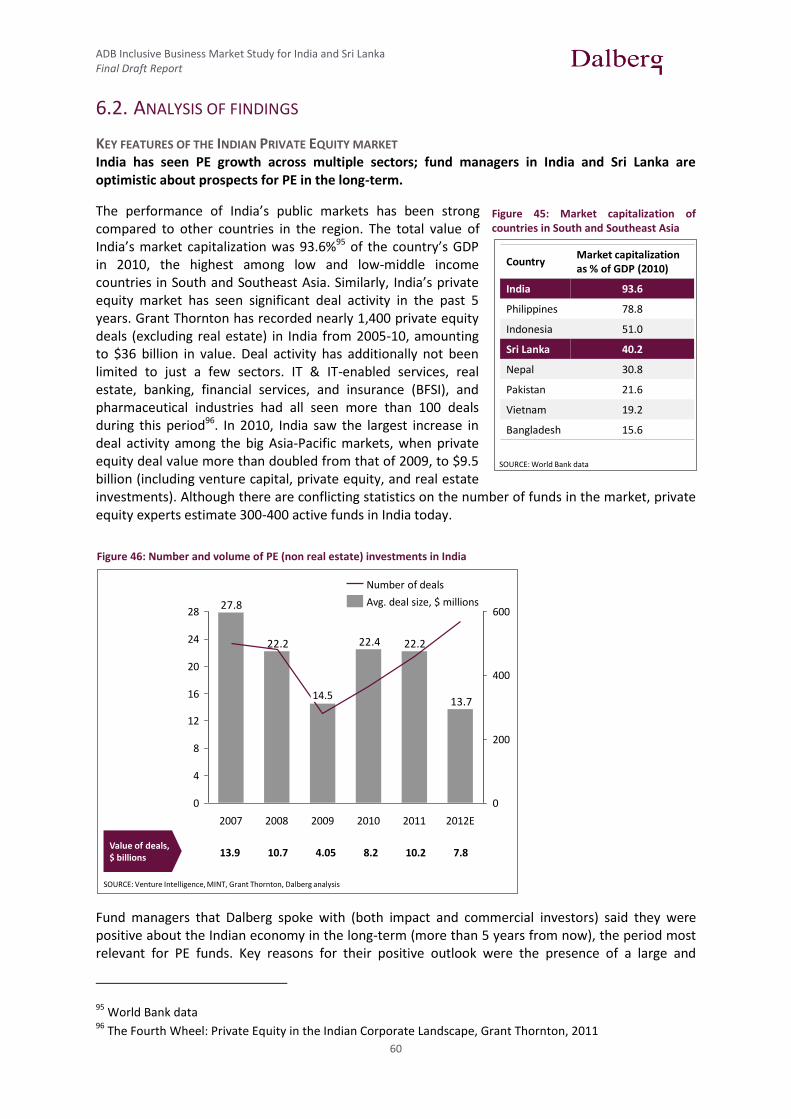
ADB Inclusive Business Market Study for India and Sri Lanka Final Draft Report
60
6.2. ANALYSIS OF FINDINGS
KEY FEATURES OF THE INDIAN PRIVATE EQUITY MARKET India has seen PE growth across multiple sectors; fund managers in India and Sri Lanka are optimistic about prospects for PE in the long-term.
The performance of India’s public markets has been strong compared to other countries in the region. The total value of India’s market capitalization was 93.6%95 of the country’s GDP in 2010, the highest among low and low-middle income countries in South and Southeast Asia. Similarly, India’s private equity market has seen significant deal activity in the past 5 years. Grant Thornton has recorded nearly 1,400 private equity deals (excluding real estate) in India from 2005-10, amounting to $36 billion in value. Deal activity has additionally not been limited to just a few sectors. IT & IT-enabled services, real estate, banking, financial services, and insurance (BFSI), and pharmaceutical industries had all seen more than 100 deals during this period96. In 2010, India saw the largest increase in deal activity among the big Asia-Pacific markets, when private equity deal value more than doubled from that of 2009, to $9.5 billion (including venture capital, private equity, and real estate investments). Although there are conflicting statistics on the number of funds in the market, private equity experts estimate 300-400 active funds in India today.
Fund managers that Dalberg spoke with (both impact and commercial investors) said they were positive about the Indian economy in the long-term (more than 5 years from now), the period most relevant for PE funds. Key reasons for their positive outlook were the presence of a large and
95 World Bank data
96 The Fourth Wheel: Private Equity in the Indian Corporate Landscape, Grant Thornton, 2011
32
6. Number and volume of PE (ex-VC) investments (2007-12)
SOURCE: Venture Intelligence, MINT, Grant Thornton, Dalberg analysis
13.7
22.422.2
27.8
22.2
12
2009
600
400
14.516
2008
24
200
0
20
0
28
4
8
2010 2011 2012E2007
Value of deals, $ billions 13.9 10.7 4.05 8.2 10.2 7.8
Below: Value of deals, $ billionsAbove: Average deal size, $ millions
Avg. deal size, $ millions
Number of deals2
SOURCE: World Bank data
CountryMarket capitalization as % of GDP (2010)
India 93.6
Philippines 78.8
Indonesia 51.0
Sri Lanka 40.2
Nepal 30.8
Pakistan 21.6
Vietnam 19.2
Bangladesh 15.6
Figure 45: Market capitalization of countries in South and Southeast Asia
Figure 46: Number and volume of PE (non real estate) investments in India
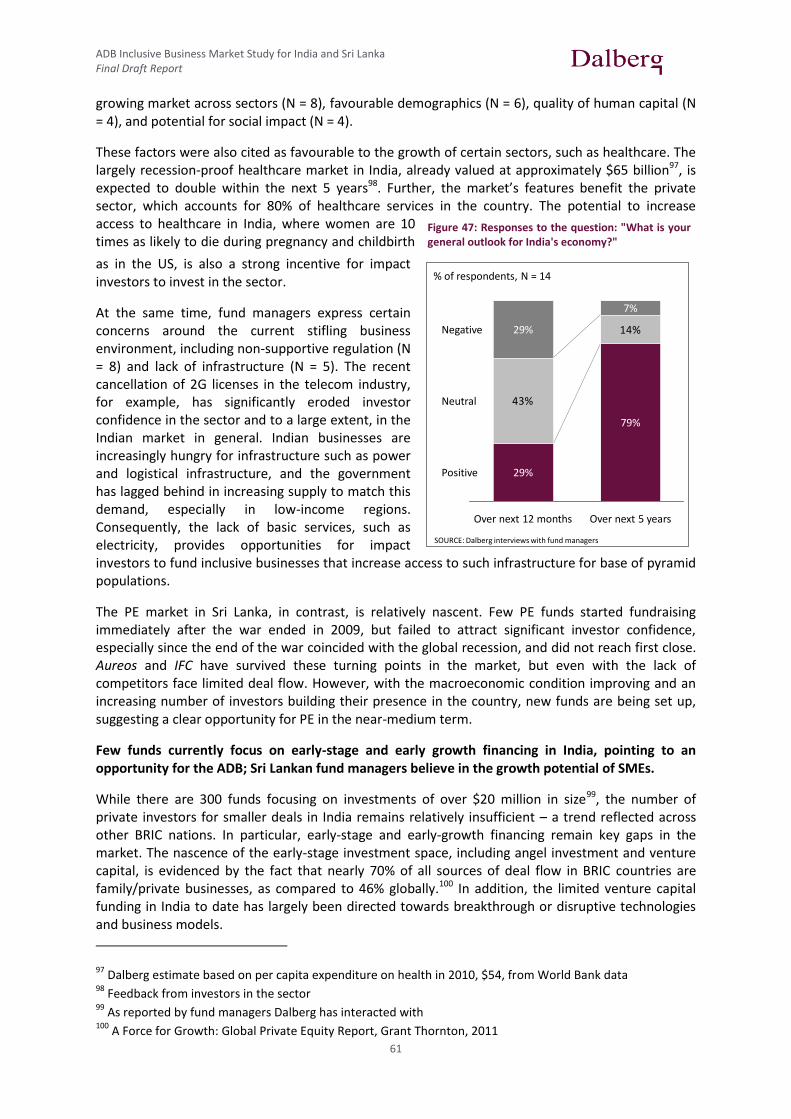
ADB Inclusive Business Market Study for India and Sri Lanka Final Draft Report
61
growing market across sectors (N = 8), favourable demographics (N = 6), quality of human capital (N = 4), and potential for social impact (N = 4).
These factors were also cited as favourable to the growth of certain sectors, such as healthcare. The largely recession-proof healthcare market in India, already valued at approximately $65 billion97, is expected to double within the next 5 years98. Further, the market’s features benefit the private sector, which accounts for 80% of healthcare services in the country. The potential to increase access to healthcare in India, where women are 10 times as likely to die during pregnancy and childbirth
as in the US, is also a strong incentive for impact investors to invest in the sector.
At the same time, fund managers express certain concerns around the current stifling business environment, including non-supportive regulation (N = 8) and lack of infrastructure (N = 5). The recent cancellation of 2G licenses in the telecom industry, for example, has significantly eroded investor confidence in the sector and to a large extent, in the Indian market in general. Indian businesses are increasingly hungry for infrastructure such as power and logistical infrastructure, and the government has lagged behind in increasing supply to match this demand, especially in low-income regions. Consequently, the lack of basic services, such as electricity, provides opportunities for impact investors to fund inclusive businesses that increase access to such infrastructure for base of pyramid populations.
The PE market in Sri Lanka, in contrast, is relatively nascent. Few PE funds started fundraising immediately after the war ended in 2009, but failed to attract significant investor confidence, especially since the end of the war coincided with the global recession, and did not reach first close. Aureos and IFC have survived these turning points in the market, but even with the lack of competitors face limited deal flow. However, with the macroeconomic condition improving and an increasing number of investors building their presence in the country, new funds are being set up, suggesting a clear opportunity for PE in the near-medium term.
Few funds currently focus on early-stage and early growth financing in India, pointing to an opportunity for the ADB; Sri Lankan fund managers believe in the growth potential of SMEs.
While there are 300 funds focusing on investments of over $20 million in size99, the number of private investors for smaller deals in India remains relatively insufficient – a trend reflected across other BRIC nations. In particular, early-stage and early-growth financing remain key gaps in the market. The nascence of the early-stage investment space, including angel investment and venture capital, is evidenced by the fact that nearly 70% of all sources of deal flow in BRIC countries are family/private businesses, as compared to 46% globally.100 In addition, the limited venture capital funding in India to date has largely been directed towards breakthrough or disruptive technologies and business models.
97 Dalberg estimate based on per capita expenditure on health in 2010, $54, from World Bank data
98 Feedback from investors in the sector
99 As reported by fund managers Dalberg has interacted with
100 A Force for Growth: Global Private Equity Report, Grant Thornton, 2011
Figure 47: Responses to the question: "What is your general outlook for India's economy?"
33
Responses to the question: "What is your general outlook for India's economy?"
SOURCE: Dalberg interviews with fund managers
43%
14%
79%
Positive
Neutral
Negative
Over next 5 years
7%
Over next 12 months
29%
29%
% of respondents, N = 14
ADB Inclusive Business Market Study for India and Sri Lanka Final Draft Report
62
The existence of a gap in the early-growth financing space, typically termed the “missing middle”, is noted by fund managers across investment sizes. Growth equity funds (typically investing over $20 million per deal) are set up such that smaller deals would be inefficient and expensive to manage. On the other end of the spectrum, impact investors (typically investing less than $2 – 5 million per deal) have limited resources to deploy. Further, impact investors have expressed difficulty in finding Series ‘B’ investors to provide follow-on financing to their investees. Growth equity investors providing larger ticket-size investments, show limited interest in these exits due to their inability to provide the more hands-on assistance that early-stage businesses require. There is therefore a clear need for impact-oriented, mid-sized equity.
In Sri Lanka, fund managers believe attractive investment opportunities will be in the SME space. Larger companies often do not offer strong valuations, and the PE market is too nascent and illiquid for high-risk venture capital investments. Exits have remained a challenge, and investments in SMEs would provide a diversified set of exit options.
Most funds are dependent on foreign sources of capital and fund raising from Indian institutions is seen as a challenge; Sri Lanka is expecting large investment from DFIs.
It is estimated that 80% of funds raised in 2011 by private equity fund managers were sourced from a combination of foreign institutional investment, foreign direct investment, and foreign venture capital investment101. Sources include Development Finance Institutions (DFIs), High Net-Worth Individuals (HNIs), university endowments, foundations, and other private investors. Of the 11 funds that shared details with Dalberg on their Limited Partnership (LP), 8 have been invested in by DFIs. Both impact investors and commercial fund managers with inclusive businesses in their portfolios have claimed that raising funds from domestic sources has been a challenge, suggesting that foreign capital will likely remain an important source of capital for India’s private equity market in the years to come. Due to recent regulatory restrictions in the telecom sector and India’s poor short-term economic outlook, however, foreign investment in India has recently declined significantly.
Successful fund managers in Sri Lanka have traditionally attracted investment from DFIs. While IFC is wholly funded by the World Bank, Aureos has enlisted a number of other DFIs to invest in their South Asia Fund, which has set aside a portion of funds for investment in Sri Lankan businesses.
INVESTMENT STRATEGIES AND RELEVANCE TO ADB’S INCLUSIVE BUSINESS AGENDA A. Multiple funds in India, both impact and commercial investors, are already investing in
inclusive businesses; Sri Lankan PE funds do not narrow focus from SMEs.
Though the definition of ‘inclusive business’, as per ADB, is relatively unknown among fund managers, the majority of funds interviewed for this study (11 out of 21) were found to have significant exposure to such businesses – at times the majority of their portfolios consist of inclusive businesses. Through a specific investment philosophy or focus within their investment strategy, the portfolios of these fund managers often include a subset of “inclusive businesses”.
The majority of companies funded by investors such as Aavishkaar and Lok Capital, for example, would qualify as inclusive businesses, as a result of their targeted investment philosophy. According to Aavishkaar, “[our] fund provides risk capital to businesses that have the potential to make a difference to the base of the pyramid and scale up profitably”. Lok Capital’s goal is to “promote inclusive growth by supporting the development of social enterprises to deliver basic services to serve the BOP segment in a scalable, affordable and commercially viable manner”. As is evident, these investment philosophies at times favour particular models of engaging the poor, e.g., Lok
101 Bain India Private Equity Report, 2011

ADB Inclusive Business Market Study for India and Sri Lanka Final Draft Report
63
Capital would primarily consider investing in businesses that engage low-income populations as consumers.
On the other hand, Pragati Fund and SIDBI-VC’s Samridh Fund target small-and-medium-enterprises (SMEs) in low-income states in India, and have therefore shaped their investment strategy to target what would most likely be inclusive businesses. According to these funds, the very presence of SMEs in traditionally deprived regions will have significant development impact. At a minimum, fund managers expect that such businesses will hire locally, develop their employees’ skills and invest in local supply chains.
Additionally, other funds were found to invest in sectors that are inherently inclusive. Rabo Equity’s India Agribusiness Fund, for example, is one such example. By virtue of investing in agribusinesses, all of the fund’s investments have either a direct or indirect impact on those individuals dependent on agriculture for their livelihoods, representing approximately 52% of India’s population102, and over 80% of who may be considered members of the BOP.
These findings point to the existence of multiple experienced funds and fund managers through whom the ADB could route its investments into inclusive businesses.
B. Sri Lanka’s PE market is nascent, with a small number of fund managers currently active, and DFIs are likely to remain chief source of investment.
Sri Lanka’s PE market, on the other hand, is shallow with few fund managers currently active, and hence stands in sharp contrast to that of India. The market’s journey in Sri Lanka’s early years post the war has been challenging. 2 fund managers – Calamander and Leopard Capital – attempted to set up PE funds exclusively focused on Sri Lanka, but failed to generate sufficient interest among investors. Not only has this stunted the development of the PE market, it has also somewhat eroded promoter’s confidence in private equity as a source of financing.
However, there are signs that the market is picking up. Other than the few funds that are currently active, including IFC and Aureos, a few more funds are currently being set up. These funds are all targeting the SME space, in the investment size range of $5 – 10 million, encouraged by the growth opportunity in Sri Lanka, where 6%+ growth is expected to sustain over the short-medium term. However, given the nature of the market, which has seen very little PE activity in the past, getting traction early will be a challenge. As a result, Sri Lankan funds adopt a sector and geography agnostic investment approach, and recommend the same for any potential ADB intervention in the country.
As a result, there are no funds that focus on inclusive business exclusively, and finding fund managers in Sri Lanka that fit ADB’s investment thesis will likely generate limited interest. Our view is that it is likely to find investments within the portfolio of current fund managers that could match ADB’s investment criteria of ‘inclusive businesses’, but at this stage of maturity of Sri Lanka’s PE market, it will be a challenge to truly adhere to it. At the same time, there is a large opportunity to strengthen the capital markets in Sri Lanka – if ADB takes on the role of ‘first-mover’, other investors may follow suit soon, backed by Sri Lanka’s promising economic outlook.
This is because raising funds has been a significant challenge for Sri Lankan fund managers – difficulty in fundraising has led to the failure of PE funds in the recent past. As a result, two approaches have emerged. The first type of fund managers is looking to raise funds domestically, since they have found attracting foreign investment without a significant investment track record difficult. The second is relying on DFIs as the primary source of investment. Bar none, fund managers in Sri Lanka would welcome any engagement from ADB, for which any investment in Sri Lanka presents a high risk-return profile.
102 CIA Factbook, 2009 estimate
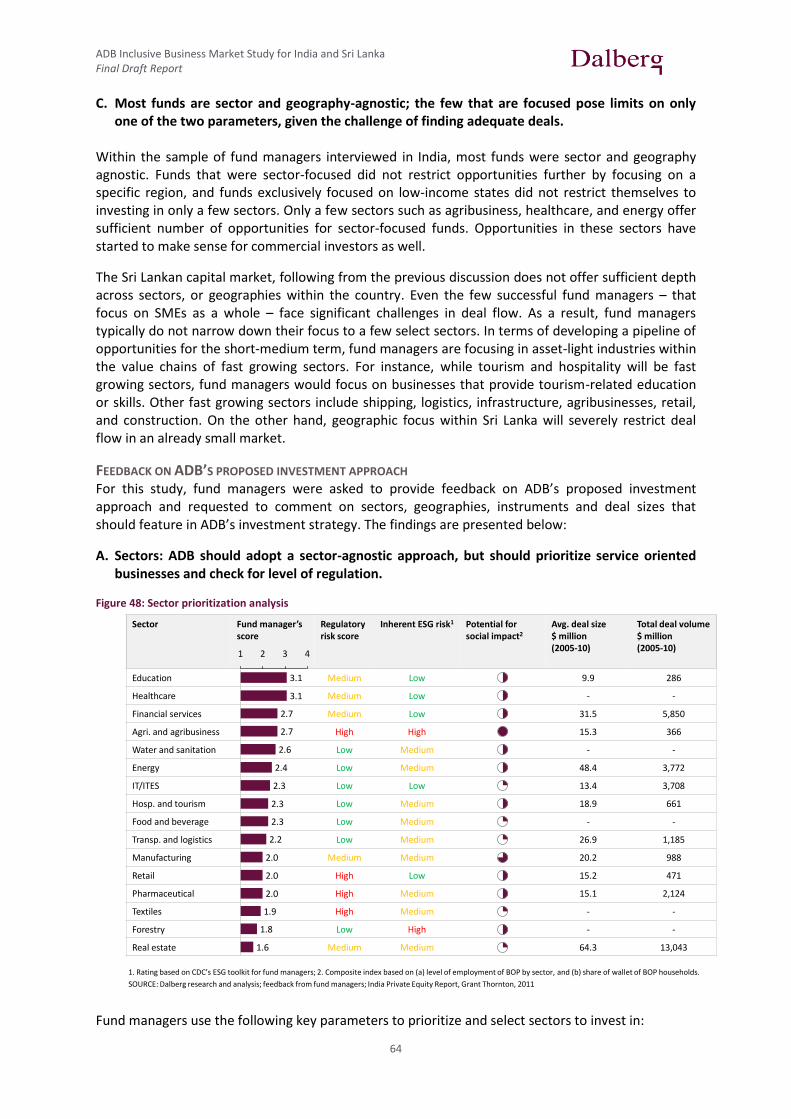
ADB Inclusive Business Market Study for India and Sri Lanka Final Draft Report
64
C. Most funds are sector and geography-agnostic; the few that are focused pose limits on only one of the two parameters, given the challenge of finding adequate deals.
Within the sample of fund managers interviewed in India, most funds were sector and geography agnostic. Funds that were sector-focused did not restrict opportunities further by focusing on a specific region, and funds exclusively focused on low-income states did not restrict themselves to investing in only a few sectors. Only a few sectors such as agribusiness, healthcare, and energy offer sufficient number of opportunities for sector-focused funds. Opportunities in these sectors have started to make sense for commercial investors as well.
The Sri Lankan capital market, following from the previous discussion does not offer sufficient depth across sectors, or geographies within the country. Even the few successful fund managers – that focus on SMEs as a whole – face significant challenges in deal flow. As a result, fund managers typically do not narrow down their focus to a few select sectors. In terms of developing a pipeline of opportunities for the short-medium term, fund managers are focusing in asset-light industries within the value chains of fast growing sectors. For instance, while tourism and hospitality will be fast growing sectors, fund managers would focus on businesses that provide tourism-related education or skills. Other fast growing sectors include shipping, logistics, infrastructure, agribusinesses, retail, and construction. On the other hand, geographic focus within Sri Lanka will severely restrict deal flow in an already small market.
FEEDBACK ON ADB’S PROPOSED INVESTMENT APPROACH For this study, fund managers were asked to provide feedback on ADB’s proposed investment approach and requested to comment on sectors, geographies, instruments and deal sizes that should feature in ADB’s investment strategy. The findings are presented below:
A. Sectors: ADB should adopt a sector-agnostic approach, but should prioritize service oriented businesses and check for level of regulation.
Figure 48: Sector prioritization analysis
Fund managers use the following key parameters to prioritize and select sectors to invest in:
20
Key decision parameters used by fund managers suggesteducation, healthcare, water, and tourism should be priority sectors
Sector Fund manager’s score
Regulatory risk score
Inherent ESG risk1 Potential for social impact2
Avg. deal size$ million(2005-10)
Total deal volume$ million(2005-10)
Education Medium Low 9.9 286
Healthcare Medium Low - -
Financial services Medium Low 31.5 5,850
Agri. and agribusiness High High 15.3 366
Water and sanitation Low Medium - -
Energy Low Medium 48.4 3,772
IT/ITES Low Low 13.4 3,708
Hosp. and tourism Low Medium 18.9 661
Food and beverage Low Medium - -
Transp. and logistics Low Medium 26.9 1,185
Manufacturing Medium Medium 20.2 988
Retail High Low 15.2 471
Pharmaceutical High Medium 15.1 2,124
Textiles High Medium - -
Forestry Low High - -
Real estate Medium Medium 64.3 13,043
2.3
2.0
2.0
2.0
2.2
3.1
3.1
2.7
2.7
2.3
2.3
2.4
2.6
1
1.6
1.8
1.9
432
1. Rating based on CDC’s ESG toolkit for fund managers; 2. Composite index based on (a) level of employment of BOP by sector, and (b) share of wallet of BOP households.
SOURCE: Dalberg research and analysis; feedback from fund managers; India Private Equity Report, Grant Thornton, 2011
STRATEGY

ADB Inclusive Business Market Study for India and Sri Lanka Final Draft Report
65
(1) Level of regulation. In highly regulated environments such as India and Sri Lanka, there is often limited opportunity to escape regulatory risk. However, certain sectors are inherently more prone to regulatory risk. For example, education is covered under the ‘concurrent list’ of subjects, and regulation often differs drastically from state to state. Other sectors are likely to benefit from the government’s mandate to promote them. For instance, India’s Electricity Act of 2003, and its subsequent amendments have made it easier for foreign investors to invest in power generation.
(2) Inherent ESG risk. Businesses in certain sectors such as mining and heavy manufacturing are
more likely to cause greater adverse environmental and social impact. As a result, inherent Environmental, Social, Governance (ESG) risk – as defined by several ESG measurement frameworks that DFIs such as the International Finance Corporation and DFID’s CDC Group have created – is a parameter that is used to minimize risk. DFIs often impose adherence to ESG standards as a condition for their General Partners (GPs)
(3) Capital intensive nature. At the level of ADB’s proposed investment size (sub $10 million),
funds typically do not invest in asset-heavy sectors, such as real estate, retail, power generation, and other large infrastructure. Sectors such as education and healthcare – often described as “soft infrastructure” – form the key focus of investors in this deal size range. Even within such sectors, though, funds typically pick service-oriented businesses that are less capital intensive, and can therefore utilize the equity investment to drive scale and growth. For instance, smaller fund managers would prefer opportunities in asset-light mobile health as opposed to large hospital chains.
Once sectors have been selected using the above criteria, funds typically consider ‘potential for impact’ as an investment criterion on a case-by-case basis. The table above aggregates methodology adopted by fund managers and other parameters to act as proxies for gaps in financing.
The table includes fund managers’ ratings of investment attractiveness and the level of enabling regulatory environment, across sectors. It also highlights the inherent ESG risk across sectors as per CDC’s ESG toolkit for fund managers. Finally, it lists average deal sizes and total deal volume over the last 5 years to indicate the capital intensive nature (the higher the average deal size, the more the number of capital intensive opportunities in the sector) and total deal volume (the higher the funds deployed by sector, the higher the likelihood of the gap being filled by the market already) respectively. From this analysis, key sectors to highlight are education, healthcare, and agriculture and agribusiness. Fund managers find opportunities in these sectors financially attractive and relatively low on ESG risk. Additionally, average deal sizes suggest that there could be several investment opportunities in ADB’s prescribed deal size ($0.5-10 million), and there appears to still be room for significant additional funding.
B. Geographies: Exposure to low-income states in India will likely increase impact, but should not be the sole focus of ADB’s fund.
Two fund managers in our sample – Pragati Fund and SIDBI-VC – have an exclusive focus on low-income states in India, such as Bihar, Jharkhand, Uttar Pradesh, Madhya Pradesh, Chhattisgarh and Orissa. These states perform poorly across most socioeconomic parameters such as life expectancy, literacy, and of course, per capita income.
Both Pragati and SIDBI claim that by virtue of their investees having significant operations in these regions, their portfolios will naturally have an impact on local livelihoods. For example, a BPO established in a low-income state would naturally increase otherwise restricted employment opportunities in the region. Alternatively, low-cost hospitals in rural areas are more likely to reach severely underserved populations than hospitals in urban areas. Further, Pragati finds entrepreneurs

ADB Inclusive Business Market Study for India and Sri Lanka Final Draft Report
66
that are committed to developing its employees’ skills. As a result, the opportunity to improve livelihoods and quality of life through investments in businesses operating in such regions is large.
Both Pragati and SIDBI-VC are relatively new funds that are exploring the market for deals. Whether there will be sufficient deal flow remains an open question. Businesses in low-income states are typically new to private equity investments, and often lack the corporate governance structures needed to absorb this type and quantity of capital. However, funds remain confident that finding the right opportunities will depend on employing a deal-sourcing team that is close to the ground, maintaining a sector agnostic approach and investing in fewer, but larger deals. As a result, funds operating in low income states will have higher management overheads.
Given these challenges, all of the fund managers interviewed had recommended that ADB avoid following an investment strategy that exclusively focuses on low-income stats, given the risk of low deal flow.
In Dalberg’s view, the ADB’s fund should have some focus on low-income regions, but not exclusively. The Bank may choose to achieve this focus by channelling investments through existing funds that focus on these regions. Beyond Pragati and SIDBI, several other fund managers have a strong footprint in these states, including Aavishkaar, which has approximately 55% of its capital deployed in the poorest states of India. This approach increases the flow of capital to regions where it is most required, without increasing competition for already scarce deals.
C. Instruments and investment size: Beyond the “missing middle” in equity, the need for debt across the board is large; credit guarantees could help leverage ADB’s funds to provide debt.
Equity: 20 of the 21 funds interviewed have deployed 100% of their investments as equity. SIDBI-VC, a government run investment firm, is the only fund manager to also have an attached Non-Banking Financial Company (NBFC) that provides debt.
As discussed earlier (see discussion on key insights on the PE market in India), fund managers have expressed the need for “early growth equity”, typically in the range of $2-10 million investments for small and growing businesses. Additionally, venture capital (sub $2 million) typically focuses on technology-based businesses, if not disruptive or breakthrough technology alone. There is room for additional players that finance early-stage inclusive businesses, products or services of which are not technology based. Such businesses often find securing debt a major challenge, and typically treat their equity investments as debt.
In Sri Lanka, the $5-10 million investment size range offers fewer opportunities than the $1-5 million range. However, smaller deals are more difficult to manage given the limited exposure of early stage investment to PE investment. The focus on SMEs drives fund managers in Sri Lanka, therefore, to focus on the $5-10 million investment size range.
Debt: 70% of the fund managers interviewed for this study claim that their investees find it difficult to access affordable debt – primarily to finance working capital requirements. Though the need for cheaper debt is relevant to businesses of all sizes, India’s commercial banking infrastructure is particularly unsupportive of small businesses with limited assets or collateral to offer as security. This situation is exacerbated in markets like India and Sri Lanka, which have traditionally been high interest rate markets.
The larger need for debt is supported by a recent IFC-sponsored publication that found that the addressable gap in debt financing for the Micro, Small and Medium Enterprise sector in India stood at $58 billion while the gap for equity stood at $38 billion103. The same study found that it is the
103 Micro, Small and Medium Enterprise Finance Market in India, International Finance Corporation, 2012
ADB Inclusive Business Market Study for India and Sri Lanka Final Draft Report
67
collateral requirements of commercial banks, which account for 80% of existing lending to the MSME sector, that are the key barrier to debt. The study found that the typical collateral to credit ratio is estimated between 125% and 170%.
Credit guarantees are important instruments to leverage the investor’s capital manifold and offer cheaper debt with limited collateral requirements. Even though a credit guarantee facility has been instituted to support collateral-free debt up to INR 10 million ($ 0.2 million) by institutions like the Small Industries Development Bank of India (SIDBI), this facility remains underutilized at less than 5% of the overall debt to the sector. While collateral-free debt is growing gradually, collateralized debt continues to account for 95%-98% of MSME credit.
The availability of cheaper debt is likely to create a more enabling environment for private equity investors, who could then ensure that equity capital is utilized for the growth of the business.
Technical assistance: Of the 8 fund managers operating in the SME space, 7 expressed a clear need for technical assistance on behalf of their investees, particularly for training and the purchase of equipment to mitigate environmental or social risk, within the broader ESG framework. Further, shared needs of investees such as a market primer for Africa, a market that several SME investees of these fund managers are strongly considering entry in, could increase opportunities for inclusive businesses. However, fund managers have also offered a caveat that promoters are often wary of technical assistance, in particular of its demands on management bandwidth.
D. Investment decisions: Financial discipline is vital to equity investments, and expectations of lower returns should be used as an opportunity to leverage other financial instruments.
18 of the 21 fund managers interviewed by Dalberg claim they do not compromise on returns to achieve investment goals. For these funds, financial discipline is typically practiced by identifying the most financially attractive opportunities after defining an investment strategy. Given that the major source of funds for private equity fund managers is foreign commercial investors, funds with target Internal Rates of Return (IRR) that are lower than market returns often find fundraising a greater challenge that those targeting market returns and above.
This trend of defining a focused investment strategy, and following it with financial discipline expecting market returns forms an emerging trend in investing in inclusive businesses in India. Of the 10 funds that shared their expected market returns with Dalberg, 8 target IRRs of 18% and above. The two funds that have lower targets are SIDBI-VC (marginally lower, at 14-16% gross), which is funded by DFID and is a government-run institution, and Acumen Fund, a non-profit entity.
Fund managers cited the following as key factors when making an investment decision:
a) potential for financial returns b) potential for scale and financial sustainability c) quality of management team d) potential for social impact e) availability of exit opportunities
In our view, an expectation of 10-12% net IRR, as prescribed by ADB, could open opportunities to leverage other financial instruments that deliver lower returns. The need for such instruments, especially debt or credit guarantees, is large. ADB’s inclusive business fund could therefore target rates of 10-12% net IRR for the fund by deploying a mix of equity and debt, and thereby achieve both financial return and development outcomes.
FUND MANAGER’S INTEREST IN MANAGING ADB’S FUND Fund managers recommend leveraging existing channels to reach inclusive businesses, as opposed to increasing competition in a space with limited deal flow.

ADB Inclusive Business Market Study for India and Sri Lanka Final Draft Report
68
While it may be convenient for fund managers to recommend that ADB play the role of an additional LP as opposed to a competitor fund, the reasons for the same are compelling:
(1) Lack of available talent. All fund managers interviewed reported that available talent is limited, and that finding the right fund manager is a critical step, in which most unsuccessful funds have failed. As existing fund managers are unlikely to forego relationships with, and commitments to, their current LPs, the market is further devoid of available talent to manage an ADB fund.
(2) Need for strong management team on the ground. Deal sourcing is a common challenge quoted by fund managers. If ADB’s inclusive business fund is focused on a particular geography, low-income states for instance, the fund would need a highly capable sourcing team that typically spends over 50% of their time in the field.
(3) Expectations of limited deal flow and increased valuations. As mentioned above, in a market with limited deal flow, GPs follow similar – if not largely the same – deals in their pipelines. More competition by way of another General Partner would increase competition and likely drive up valuations. This would take away from ADB’s intended catalytic effect.
(4) Challenge of remaining sector-agnostic. It would be difficult to establish a narrow sector focus, e.g., healthcare or education, for the fund without a team with significant deal-making experience in the sector and a ready pipeline. To mitigate this risk, the fund should adopt a sector agnostic strategy, as mentioned in the previous section. However, remaining sector agnostic would delay the uptake of a new fund and makes managing technical assistance across investments a major challenge.
Fund managers often provide their LPs with an option of co-investment in some deals, which could be an opportunity for ADB to gradually build up their presence in the direct investment route, should it choose that path. While some funds do provide the option to non-LPs as well, LPs have priority co-investment rights.
As a result, while only 4 of the 10 fund managers with inclusive businesses in their portfolios expressed an interest in managing ADB’s fund, all of them expressed a strong interest in engaging ADB as an LP. Additionally, 4 fund managers claimed that they are already in talks with ADB, or that ADB has been an investor in one of their funds previously. Additionally, fund managers believe raising additional funds from foreign investors will not be a challenge, but Indian investors are likely to remain a small source of capital.

ADB Inclusive Business Market Study for India and Sri Lanka Final Draft Report
69
7. DONOR MAPPING
7.1. OVERVIEW OF OUR METHODOLOGY
The term ‘donor’ can be ambiguous – it could mean an agency primarily giving grants to non-profit organisations, or an impact investor looking for social and financial return. While the intended outcome of generating social impact is consistent across all definitions, for the purposes of this study, we use the term ‘investor’ to refer to any impact-oriented investor who deploys funds through equity or debt (potentially in conjunction with technical assistance) instruments to for-profit businesses to generate social impact.
The investors we have engaged in this study could be classified into three types:
(1) Bilateral aid agencies. As part of their overseas development assistance (ODA) programs, several countries have set up offices within their embassies in India and Sri Lanka to primarily deploy grants and concessionary loans. Primary focus of these agencies is often two-fold, given that they operate under the close watch and direction of the government of the host country: (a) to build infrastructure in the foreign country to catalyze growth, and (b) to further bilateral cooperation between the countries through business linkages and technical assistance. Examples: KfW, USAID, DFID, JICA.
(2) DFI-funded investors. Since bilateral and multilateral agencies are often not permitted to take equity positions in businesses in host countries, they route their equity investments through globally structured investment funds. In most cases, these entities invest in private equity funds with a footprint in the country in question, i.e., through a fund of funds approach. A few may also be able to make equity investments directly in businesses. Examples: IFC, CDC (DFID funded), Swedfund (SIDA funded), Norfund (NORAD funded).
(3) Independent private funds. Domestic and foreign HNIs can also route their investments for social impact through funds and foundations. Foundations are typically grant-making agencies. Domestic HNIs typically operate through single-investor private equity funds or ‘family offices’. Examples: Gates Foundation, Premji Invest, Catamaran Ventures.
The views contained in this section reflect the results of interviews with of 9 such investors, and findings from research on activities of various kinds of investors. The investors our team interviewed includes 3 bilateral aid agencies (KfW, DFID, SIDA), 3 DFI-funded investors (IFC Sri Lanka, CDC, Swedfund), and 3 independent private funds (Catamaran, SD Tata Trust, Omidyar Network).
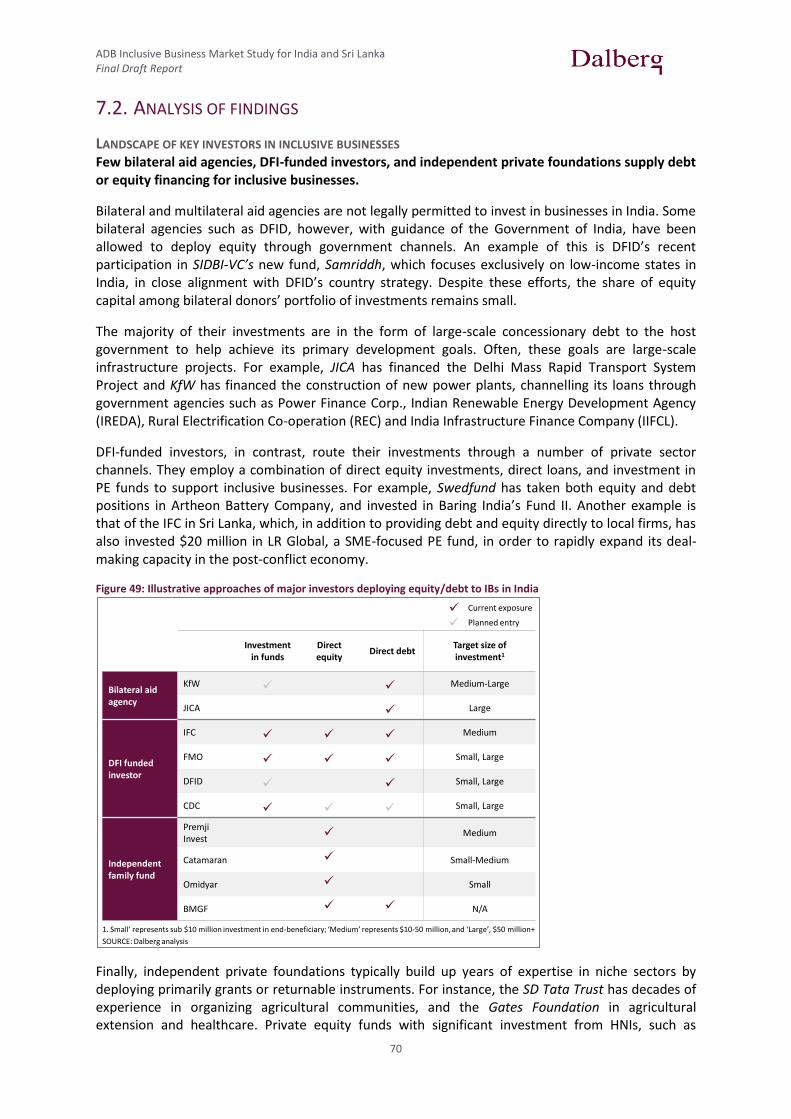
ADB Inclusive Business Market Study for India and Sri Lanka Final Draft Report
70
7.2. ANALYSIS OF FINDINGS
LANDSCAPE OF KEY INVESTORS IN INCLUSIVE BUSINESSES Few bilateral aid agencies, DFI-funded investors, and independent private foundations supply debt or equity financing for inclusive businesses.
Bilateral and multilateral aid agencies are not legally permitted to invest in businesses in India. Some bilateral agencies such as DFID, however, with guidance of the Government of India, have been allowed to deploy equity through government channels. An example of this is DFID’s recent participation in SIDBI-VC’s new fund, Samriddh, which focuses exclusively on low-income states in India, in close alignment with DFID’s country strategy. Despite these efforts, the share of equity capital among bilateral donors’ portfolio of investments remains small.
The majority of their investments are in the form of large-scale concessionary debt to the host government to help achieve its primary development goals. Often, these goals are large-scale infrastructure projects. For example, JICA has financed the Delhi Mass Rapid Transport System Project and KfW has financed the construction of new power plants, channelling its loans through government agencies such as Power Finance Corp., Indian Renewable Energy Development Agency (IREDA), Rural Electrification Co-operation (REC) and India Infrastructure Finance Company (IIFCL).
DFI-funded investors, in contrast, route their investments through a number of private sector channels. They employ a combination of direct equity investments, direct loans, and investment in PE funds to support inclusive businesses. For example, Swedfund has taken both equity and debt positions in Artheon Battery Company, and invested in Baring India’s Fund II. Another example is that of the IFC in Sri Lanka, which, in addition to providing debt and equity directly to local firms, has also invested $20 million in LR Global, a SME-focused PE fund, in order to rapidly expand its deal-making capacity in the post-conflict economy.
Figure 49: Illustrative approaches of major investors deploying equity/debt to IBs in India
Finally, independent private foundations typically build up years of expertise in niche sectors by deploying primarily grants or returnable instruments. For instance, the SD Tata Trust has decades of experience in organizing agricultural communities, and the Gates Foundation in agricultural extension and healthcare. Private equity funds with significant investment from HNIs, such as
59
7. Instruments and size of investment
1. Small’ represents sub $10 million investment in end-beneficiary; ‘Medium’ represents $10-50 million, and ‘Large’, $50 million+
SOURCE: Dalberg analysis
Investmentin funds
Direct equity
Direct debtTarget size of investment1
Bilateral aid agency
KfW Medium-Large
JICA Large
DFI fundedinvestor
IFC Medium
FMO Small, Large
DFID Small, Large
CDC Small, Large
Independentfamily fund
PremjiInvest
Medium
Catamaran Small-Medium
Omidyar Small
BMGF N/A
Current exposure
Planned entry

ADB Inclusive Business Market Study for India and Sri Lanka Final Draft Report
71
Omidyar Network and Catamaran Ventures, typically operate with a dual objective – to achieve both social and financial return. Such investors primarily deploy equity capital.
Majority of bilateral funds are directed through government channels to mainly large-scale infrastructure projects, while more independent investors follow a sector agnostic approach.
As mentioned earlier, bilateral aid agencies work closely with host governments and aim to help them achieve their primary development objectives, which often revolve around developing new infrastructure. As a result, such organisations are by default restricted to operate in a narrow space of sectors constituting heavy infrastructure such as power generation.
Entities more detached from government operations, such as DFI-funded investors and private funds and foundations can invest smaller amounts through other financial instruments. Among the listed organisations in the figure below, the level of dependence on the host government largely decreases from top to down. Not surprisingly, this correlates with the number of sectors the organization has exposure to. The more independent investors such as DFI-funded investors and independent private investors typically adopt a sector-agnostic approach.
Figure 50: Exposure of major investors deploying equity/debt to priority sectors in South Asia
BFSI and energy have attracted significant financing from various investors; agriculture, healthcare, water and sanitation are likely to receive increasing funding, especially from private foundations.
A deeper look into sectors other than large-scale infrastructure reveals that some sectors have received interest from all types of investors. Banking and financial services, owing to the widespread interest in microfinance, and renewable energy / energy efficiency have seen investments from various types of investors.
Typically, bilateral aid that is not directed towards heavy infrastructure goes towards sectors that do not attract significant private investment, e.g., water and sanitation. In contrast, independent private investors weigh financial returns higher, and focus on sectors that offer attractive investment
37
7. Sectors – Concentration & Gaps
1. CDC operates an offshore fund of funds, several GPs of which have large exposure to India/Sri Lanka ; FMO has recently invested in an offshore fund focused on inclusive businesses; IFC is an independent onshore investor; DFID has recently invested in a domestic onshore fundSOURCE: Dalberg analysis
Agriculture BFSIEnergy &
Env’tEducation Healthcare
Water &Sanitation
Infra.
Bilateral aid agency
KfW
JICA
FMO
DFID
DFI fundedinvestor1
IFC
CDC
Swedfund
Norfund
Independentfamily fund
PremjiInvest
Catamaran
Omidyar
BMGF
Current exposure
Planned entry
ADB Inclusive Business Market Study for India and Sri Lanka Final Draft Report
72
opportunities from the perspective of both financial and social returns. Beyond energy and microfinance, education has seen significant interest from private investors.
Some sectors have traditionally been recipients of grants and concessional debt from bilateral aid agencies, i.e., agriculture, healthcare, and water and sanitation. These sectors are gathering increasing interest and funding from private donors. This could imply that these sectors present increasingly attractive opportunities from a financial return perspective in the medium term.
FEEDBACK ON ADB’S PROPOSED INVESTMENT STRATEGY A. Sectors: Investors believe that a sector agnostic approach should mitigate deal flow risk.
Most investors deploying equity directly to inclusive businesses have expressed that deal flow is a significant risk, much in line with impact investors’ perception. Investors believe that ecosystems catalyzing growth in some sectors are more conducive to inclusive business growth than those in others. For example, government agencies such as NSDC increase the supply of credit for the skills development sector, while water and sanitation doesn’t benefit from similar enabling institutions. Investors believe that a sector agnostic approach, with balanced exposure to both types of sectors, would mitigate both deal flow and overexposure risk.
In line with criteria used by fund managers for sector prioritization, smaller investors prioritize exposure to sectors based on the level of capital intensity. This effectively rules out investments in sectors such as microfinance. According to one private investor, it takes a $20 million investment at minimum, on average, to stabilize a microfinance business. Similarly, asset-heavy businesses like hospital chains and power generation are left open for commercial investors to promote.
Given the variance in types of investors that we have spoken to, it is difficult to identify trends that would inform sector exposure across the sample. However, tourism, post-harvest agro-processing, education and healthcare are priority sectors for a number of investors.
B. Geographies: Most impact investors are increasingly focusing on low-income states in India; ADB could increase capacity of new funds, which have gathered strong investor interest.
An increasing number of investors such as IFC and DFID (and, as a result, CDC) are focusing exclusively on low-income states in India. This is primarily driven by direction (and at times backlash on amount of returns generated) from their shareholders –taxpayers in their home countries – to make investments beyond the purview of commercial investors. As a result, DFID is redirecting its equity capital to funds such as Samriddh, an LIS-focused SME PE fund managed by SIDBI Venture Capital IFC and CDC are LPs in Pragati, another LIS-focused SME PE fund.
C. Instrument and investment size: Indian and foreign equity investors have identified gaps in the early-stage and early growth-stage financing markets; supply of debt is restricted on account of regulation, and ADB could fill the gap through credit guarantee schemes.
Investors reiterate that the real gaps in the equity market are in early to early-growth stages of financing for small and medium inclusive businesses. For example, KfW has taken an LP position in Aavishkaar, which is deploying money in early stage businesses. Investors do not perceive there to be any major gaps in equity or debt financing for large-scale IBs or IB initiatives of large firms.
Feedback from sample investors on the large need for debt for SMEs resonates with that from fund managers. Currently, few working solutions exist for investors to deploy debt to SMEs. Notably, JICA and KfW have engaged SIDBI (as per Government of India direction) to deploy debt to SMEs in the renewable energy and energy efficiency sector.
One potential solution, suggested by several investors could be in the form of credit guarantees. NABARD and SIDBI are currently engaging several investors to set up focused credit guarantees to

ADB Inclusive Business Market Study for India and Sri Lanka Final Draft Report
73
businesses that can offer limited collateral to secure debt. Credit guarantee schemes offer significant opportunity to leverage an investor’s funds– the ratio of invested capital to disbursed debt in typical credit guarantee scheme is 1:10, which could be further improved with co-investment from other donors. Further, the economics of credit guarantees look promising. Typical administration of fees of 1-2% of disbursed debt has been known to largely cover the cost of guaranteeing full recovery of non-performing loans. A successful credit guarantee scheme would help catalyze the banking system and create a new asset class.
INTEREST IN COLLABORATING WITH ADB ON PROPOSED FUND Investors have expressed strong early interest in collaborating with ADB, but encourage ADB to complement existing efforts of investors.
At this early stage of development of the fund, with several critical decisions around investment strategy and operationalisation approach pending, investors are hesitant in committing to a partnership, or discussing terms of a potential partnership in detail.
However, since ADB’s overall investment philosophy of return-oriented investment in inclusive businesses is largely aligned with strategies of other DFIs, all bilateral aid agencies and DFI-funded investors have expressed a strong interest in collaborating with ADB. Beyond adding to the overall resource pool of the fund, some specific areas where collaboration could be fruitful are technical assistance and sharing lessons learned.
Fund managers’ expectation of limited interest from domestic investors was reinforced from our conversations. Domestic investors who are largely grant-oriented are more interested in lending their expertise to ADB in specific areas of common interest, e.g., SD Tata Trust has decades of experience dealing with producer companies and cooperatives, and could help ADB in generating an initial deal pipeline, or in providing technical assistance to ADB’s agribusiness investments. Strong interest in collaboration from HNI-owned private funds, in particular Omidyar Network and Catamaran Ventures was particularly noted.

ADB Inclusive Business Market Study for India and Sri Lanka Final Draft Report
74
8. HIGHLIGHTS FROM THE INCLUSIVE BUSINESS FORUM AND
ROUNDTABLE DISCUSSIONS
8.1. OBJECTIVES
The objective of the multi-stakeholder inclusive business forum and roundtable discussions was to gain feedback on discuss the findings of the inclusive business (IB) scoping study for India & Sri Lanka, and the recommendations for the ADB to support IB scale-up in these two countries.
8.2. PARTICIPATION
The inclusive business forum (Mumbai, 31st August 2012) and two roundtable discussions (Colombo, 28th August 2012 and Delhi, 30th August 2012) saw participation from key stakeholders in the inclusive business landscape including founders and management team members from inclusive businesses and social enterprises, divisional heads of inclusive initiatives at large firms, representatives from the government, relevant industry associations, members of academia, incubators, donor organizations, intermediaries and fund managers. Close to 150 key decision-makers participated in events hosted by ADB and Dalberg in India and Sri Lanka.
8.3. HIGHLIGHTS
Inclusive Business Forum & Roundtable Discussion – Mumbai, 31st Aug. 2012
The inclusive business forum in Mumbai participation mainly from inclusive businesses, fund managers and government backed organizations. Six inclusive businesses made presentations on their business models and approach to engaging BOP populations. Two panel discussions, one on engaging the BOP as consumers and distributors and the other on engaging the BOP as employees and suppliers, saw discussions around the challenges faced by inclusive businesses and the around the issue of scaling-up these enterprises.
During the course of day’s events, many crucial insights emerged and several constructive suggestions were put forward. While there was unanimity on the role of the government in helping create an enabling environment to support this sector, financial support to address the underserved debt requirements of inclusive businesses was highlighted as one of the crucial interventions required to facilitate their scale-up.
Figure 51: Participation at the three inclusive business events in India & Sri Lanka
16
Event City,Country No.ofPar cipants Date
Roundtablediscussion Colombo,SriLanka 27 28thAug,2012
Roundtablediscussion Delhi,India 33 30thAug,2012
Forum&roundtablediscussion Mumbai,India 88 31stAug,2012
Par cipa onatthethreeinclusivebusinesseventsinIndia&SriLanka(2012)
ADB Inclusive Business Market Study for India and Sri Lanka Final Draft Report
75
Highlights from the opening remarks delivered by Shri. Sushil Muhnot, Managing Director, Small Industries Development Bank of India (SIDBI).
There are 30 million micro, small and medium enterprises (MSME) in India and collectively they employ 60 million people.
40% of the advances from commercial banks go to MSMEs.
Non-Banking Finance Companies (NBFCs) provide last-mile connectivity to MSMEs.
The government believes that cooperative banks are well suited to work with the MSME sector.
SIDBI has three venture capital funds totally to $210 million targeted at MSMEs and one social alternative investment fund of $60 million.
SIDBI is actively working with the government of India to make it easier for investors to enter this sector by bringing down the costs of issue and compliance.
SIDBI has also set-up a Credit Guarantee Fund Trust for Micro and Small Enterprises (CGTMSE) to support this sector.
There is scope to synergize ADB’s IB strategies with SIDBI Venture Capital Limited (SVCL) by the former adopting a fund of funds approach.
Highlights from the inclusive business market scoping study presented by Mr. Gaurav Gupta, Partner & Regional Director, Asia, Dalberg Global Development Advisors
Across all sectors, inclusive businesses engage the BOP in multiple ways – as consumers, distributors, employees and suppliers; at times multiple ways are employed by a single business.
Most inclusive businesses and social enterprises are looking for investments in the $1-$10 million range.
Growth equity space, greater than $20 million, is crowded with over 300 funds that are set-up for large deals. Social venture capital funds have limited resources and typically service the under $2 million market. There is a missing middle, between $2-$10 million in early growth finance.
Access to adequate working capital is seen as one of the biggest barriers to early IB growth. Access is currently limited to those businesses that are able to meet the stringent collateral requirements of the banking sector leaving most small businesses out of the formal debt market.
Credit guarantees specifically for SME IBs could leverage funds manifold.
Education, healthcare, agriculture, water and tourism are the most attractive sectors in which to invest for their financial and social returns.
Highlights from the panel discussion on engaging the BOP as consumers and distributors
After selling 400,000 units in 12 countries with 250 employees on board and systems and management ready to scale, growth is limited by working capital availability – Mr. Anish Thakkar, CEO, Greenlight Planet Pvt. Ltd.
AISECT operates in the computer and IT education and training space. It has trained over 1.2 million students, works with over 11,000 entrepreneurs and employees over 50,000 people. Lack of infrastructural facilities like power and connectivity and availably of funds for expansion are among the most crucial challenges to operating in vocational education – Mr. Abhishek Pandit, Director, All India Society for Electronics and Computer Technology (AISECT).
Pureit household water purifiers have sold 6 million units since its launch in 2008. To scale further and turn this to a sustainable business targeting the BOP, support is needed in the
ADB Inclusive Business Market Study for India and Sri Lanka Final Draft Report
76
form of consumer financing, providing viability gap funding to outreach partners and safe-water awareness and education efforts – Mr. Deepak Saksena, Head – Partnerships, Water Business, Hindustan Unilever Ltd.
Finding great entrepreneurs that are driven by delivering value to the customer, understand the metrics of business and have the ability to take risks within a defined timeframe is the key to selecting an inclusive business that you want to invest in. – Mr. Sandeep Farias, Founder, Elevar Equity.
The issue of scalability versus replicability is interesting. We need to look at solutions which are both scalable and replicable. For social enterprises, scalability should not be a fixation. A business model that can be replicated with diminishing involvement of the entrepreneur would be very interesting – Adrien Couton, Associate Partner, Dalberg Global Development Advisors (Panel moderator)
Highlights from the panel discussion on engaging the BOP as employees and suppliers
200 million rural artisans in India live with income of under $2 per day. Urban migration, lack of ownership in the value chain, inability to scale-up production, and no connection with actual market needs has trapped the traditional creative industries in India. Changing the classification of handicrafts industries and including them as MSMEs and bridging the rural infrastructure gap will help this sector. Skills like pottery, handicrafts etc. are vanishing not just due to low wages in skill-based jobs but also due to lack of accreditation in the form of a degree or certificate. – Ms. Neelam Chhiber, Co-founder, Industree Crafts Pvt. Ltd ( Mother Earth).
In preparing the BOP for employability, skill development is more important than educational degrees. Collaborating with the government can produce large-scale impact - Mr. Hanmantrao Gaikwad, Managing Director, Bharat Vikas Group Limited
Eliminating intermediaries in traditional industries leads to large improvements in efficiency and quality resulting in higher incomes for the artisans. Providing market access for traditional arts, crafts and handicrafts provides an excellent option for non-farm employment in rural areas. Technical assistance to focus on skill development and building a global supply chain can produce impact. – Mr. Sameer Chaturvedi, CEO, Jaipur Foundation
Global initiatives are very different from what India does to encourage skill development. The inability or unwillingness of students to pay for vocational courses is an issue. The government is trying to work with banks and NBFCs to introduce loans for this. The mandate to the National Skills Development Corporation (NSDC) is to train 150 million people within the next few years. The NSDC in turn is working with private sector companies to meet this target by offering financial intervention. – Ms. Gouri Gupta, Program Lead, National Skills Development Corporation
Highlights from the roundtable discussion (following the Forum)
Debt is a better instrument for the ADB to offer to inclusive businesses. It could be a term loan, working capital loan or any other instrument as long as it is collateral free and at reasonable rates of interest. Equity is being used to finance expenditure that should be financed by debt.
Credit guarantees are an effective way of supporting the scaling-up of inclusive businesses.
If debt is being offered by the fund, the debt fund needs to sit outside the equity fund as the incentives of the fund managers may not necessarily be aligned. Moreover, financial regulations do not allow the fund to have both, equity and debt.
ADB Inclusive Business Market Study for India and Sri Lanka Final Draft Report
77
While the proposal is to have a ten-year fund for ADB, it is worth considering an open-ended structure where there are multiple exists at multiple time periods.
The idea for the ADB to have an equity fund is to leverage their equity and produce a big fund by catalyzing the private sector and attracting money from other investors. If ADB goes in with a debt fund, the focus would be to encourage other lenders to lend to IBs and it would be targeted at growing companies. The idea would be to test innovative concepts, maybe by providing a debt facility, not committed to any fund or company, but by having a deal with some funds that they can then apply to specific companies or sectors.
ADB is keen on filling a gap in the market that local financial institutions cannot or are not filling. One option could be to provide debt without collateral or get into sectors where local institutions currently have limited exposure like health, tourism, agriculture etc.
One question for the ADB is whether it can take the first risk. The answer to that is probably in the negative but ADB could look at counter guaranteeing 50% of the first loss with another institution.
The ADB could also look at creating a financing facility for technical assistance in such a way that it benefits the actual business rather than consultants implementing them. Partnering with incubation centers that provide mentoring, legal and IP support, accounting support, strategy for the second round of funding etc., could prove useful in this respect.
On the TA front, areas where a company needs expert external advice, such as business strategy, can be provided by building capacity within the fund to cater for TA needs.
Funds that the ADB partners with should be given the flexibility to decide the percentage of the TA per deal rather than have a maximum ceiling per deal. Further, there needs to be a buy-in from the investee companies where the companies bear certain percentage of the TA costs, probably in the region of 20%.
Highlights from the IB roundtable discussion held in New Delhi
Discussion highlights
The government instituted National Rural Livelihood Mission, was represented by Mission Director, Mr. Vijay Kumar. He discussed the objectives and principles guiding the NRLM’s operations. NRLM has been set up to reduce poverty among rural below-poverty-line households by promoting diversified and gainful self-employment and wage employment opportunities which would lead to an appreciable increase in income on sustainable basis. The NRLM’s main intervention is to create ‘Institutions by the poor and for the poor’. This mission channelizes credit facilities and a wide range of support services to networks of rural self-help groups. The belief is that the poor must be active participants in any poverty alleviation program and that they are capable of defining sustainable paths out of poverty.
IFC representative, Ishira Mehta, advised the ADB against engaging only at the level of the national government or national headquarters of public institutions on any intervention that seeks to support growth of IBs. There is a clear need to engage and target interventions at the state level especially if the ADB is focused on low-income states.
CEO of Business 2 Rural, Mr. Dhiraj Dolwani, offered the view that sectors like IT and ITES hold potential for significant impact especially if facilities are located in rural areas and low-income states as they provide well paying jobs to moderately skilled people who may not have otherwise had access to such forms of employment.
Several donors and fund managers present felt that the need for debt was the most pressing issue facing inclusive businesses. Mr. Hemendra Mathur, representing SEAF, suggested that ‘mezzanine debt’, which falls between equity and debt in its characteristics, may be one instrument for the ADB to consider offering
ADB Inclusive Business Market Study for India and Sri Lanka Final Draft Report
78
Feedback on ADB’s proposed Impact Assessment Tool
The idea of harmonizing impact assessment methodologies across development institutions was welcomed by the development finance institutions present in the room, especially by the IFC
Simplicity, transparency and efficiency are some of the characteristics that the tool must bear in order to be accepted by the wider community of donors, investors and IBs.
Highlights from the IB roundtable discussion held in Colombo
General Sri Lankan context
In Sri Lanka the need is for long-term financing at concessionary rates
The yields of tea estates are losing money at the gross margin level, because of the lack of investment
There is a shortage of trained manpower, and the youth is not employable
Projected tourism targets are not sustainable with existing infrastructure
Challenges that ADB will potentially face
IBs will not engage in measuring impact of their activities if it is not required by anyone, because this costs money
ADB should consider financing the ex-ante and ex-post studies for impact evaluation

ADB Inclusive Business Market Study for India and Sri Lanka Final Draft Report
79
9. BIBLIOGRAPHY
Ahluwalia, M. “Economic Reforms in India since 1991: Has Gradualism Worked?”, 2011.
Bain & Company. “India Private Equity Report”, 2011.
Central Bank of Sri Lanka. “Annual Report”, 2011.
Central Bank of Sri Lanka. “Economic and social statistics of Sri Lanka”, 2011.
Central Statistical Organization, Government of India. “Millennium development goals India country
report 2011”, 2011.
Chaudhuri, S., Gupta, N. “Levels of living and poverty patterns: a district-wise analysis for India”,
Februrary 2009.
Department of Census and Statistics, Sri Lanka. “National Accounts Annual Report”, 2011.
DISE. “State elementary education report card 2010-11”, 2011.
Economic Advisory Council to the Prime Minister of India. “Economic Outlook for 2010-11”, July
2010.
Export Import Bank of India. “Annual report 2011 – 2012”, March 2012.
Foundation for MSME Clusters (FMC), clusters in India, 2010.
Goldman Sachs. “Dreaming with BRICs: The Path to 2050”, October 2003.
Grant Thornton. “A Force for Growth: Global Private Equity Report”, 2011.
Grant Thornton. “The Fourth Wheel: Private Equity in the Indian Corporate Landscape”, 2011.
Grant Thornton. “India PE Report 2011”, 2011.
Groh, A., Liechtenstein, H., Lieser, K. "The Global Venture Capital and Private Equity Attractiveness
Index”, 2011.
IFAD. “Republic of India: Country strategic opportunities programme”, 2011.
IFC. “Doing Business –Economy profile: India”, 2012.
IFC. “Doing Business –Economy profile: Sri Lanka”, 2012.
ILO. “General employment trends 2012”.
IMF. “The Demographic Dividend: Evidence from the Indian States”, 2011.
India Human Development Survey. “Human development in India” January 2010.
J.P. Morgan. “Impact Investments: An emerging asset class”, November 2010.
KPMG. “Private equity investing in India”, 2007.
McKinsey Global Institute, “The ‘Bird of Gold’: The Rise of India’s Consumer Market”, May 2007.
Ministry of Finance and Planning. “Annual Report 2011”, 2011
Ministry of Labour & Employment, Government of India. “Report on Employment & Unemployment
Survey”, 2010.
ADB Inclusive Business Market Study for India and Sri Lanka Final Draft Report
80
Ministry of Micro, Small & Medium Enterprises, Government of India. “Fourth all India census of
Micro, small & medium enterprises”.
Monitor Group. “Emerging Markets, Emerging Models”, march 2009.
Nilekani, N. “India’s Demographic Moment”, 2009.
NSSO. “Key Indicators of Household Consumer Expenditure in India - 2009-2010”, October 2011.
Planning Commission, Government of India. “Faster, sustainable and more inclusive growth: An
approach to twelfth five year plan”, October 2011.
PricewaterhouseCoopers. “The World in 2050”, 2011.
Reserve Bank of India. “Macroeconomic Indicators 2011”, 2011.
Sri Lanka Tourism Development Authority. “Annual Report”, 2011.
Steering Committee on Urbanization, Planning Commission. “Report of the working group on urban
poverty, slums, and service delivery system”, October 2011.
The World Bank. “Perspectives on poverty in India”, 2011.
World Economic Forum. “The Global Competitiveness Report”, 2011.
WRI and IFC. “The Next 4 Billion”, 2005.
UNICEF & WHO. “Progress on Drinking Water & Sanitation 2012 update”, 2012.
UNIDO. “Cluster development and BDS promotion: UNIDO’s experience in India”, March 2000.
UNDP. “Human Development Report 2011”, 2011.