I N V E S T O R P R E S E N T A T I O N | Q 1 F Y 1 7 PROJECTS 79 30.96 100 29.15 6 4.81 6 1.37 8...
66
PRESTIGE GROUP | Investor Presentation | JUNE 2016 1 INVESTOR PRESENTATION | Q1FY17
Transcript of I N V E S T O R P R E S E N T A T I O N | Q 1 F Y 1 7 PROJECTS 79 30.96 100 29.15 6 4.81 6 1.37 8...

PRESTIGE GROUP | Investor Presentation | JUNE 2016 1
I N V E S T O R P R E S E N T A T I O N | Q 1 F Y 1 7

PRESTIGE GROUP | Investor Presentation | JUNE 2016 2
INDEX.
1. ABOUT PRESTIGE
2. OPERATIONAL HIGHLIGHTS
3. FINANCIAL HIGHLIGHTS
4. PROJECT PORTFOLIO & UPDATE
5. RECEIVABLES PROFILE
6. AWARDS & RECOGNITIONS
7. PROJECT STATUS
8. GUIDANCE VS ACHIEVED

3
Iconic developments
-Forum Mall, Prestige
Shantiniketan, UB
City, Prestige
Golfshire etc
42 mn sftPotential
development from
Low cost land bank of
424 acre
ICRA A+,
ICRA A1+Credit rating
CRISIL DA1rated Developer by CRISIL
Spearheaded by
Real Estate Icon, Mr.
Irfan Razack & his
brothers
Mr. Rezwan and
Mr.Noaman Razack
Ongoing Projects
spanning
Over 65.68 Mnsf of
developable area
Completed projects spanning across 73.70 Mnsf of Developed area
Strong Joint Venture partners -CapitaLand, etc
One of the Most
Trusted Developers
by Land Owners and
Customers
199
65Over 28Years
of Legacy
StrongAssociations with Various Banks & FIs
A B O U T P R E S T I G E
Excellence Across Sector-Residential, Commercial, Retail & Hospitality
Diversified Cash Flowsfrom Various Segments
Upcoming Projects spanning Over 47.23 Mnsf of developable area
368.7 mn sftGLA of Operational
Rental portfolio (PG share)
11.5 mn sftGLA Under
construction &
Planning (PG share)

PRESTIGE GROUP | Investor Presentation | JUNE 2016 4
B U S I N E S S S E G M E N T S
RESIDENTIAL Apartments VillasIntegrated
Townships
Plotted
Developments
COMMERCIAL Office SpaceBuilt to suit
CampusesSEZs IT Parks
RETAIL Malls
HOSPITALITY ResortsServiced
ApartmentsHotels Food Courts
SERVICESSub leasing &
fit out services
Interior Design
& ExecutionProject & Construction Mgmt Services
Facilities & Property Mgmt
Logistics

PRESTIGE GROUP | Investor Presentation | JUNE 2016 5
S C A L E O F O P E R A T I O N
PARTICULARS
RESIDENTIAL COMMERCIAL RETAIL HOSPITALITYPLOTTED
DEVELOPMENTTOTAL
NOS. AREA NOS. AREA NOS. AREA NOS. AREA NOS. AREA NOS. AREA
COMPLETED PROJECTS 79 30.96 100 29.15 6 4.81 6 1.37 8 7.42 199 73.70
ONGOING PROJECTS 50 55.61 6 4.97 6 3.04 3 2.07 0 0.00 65 65.68
UPCOMING PROJECTS* 23 30.31 11 15.14 2 1.78 0 0.00 0 0.00 36 47.23
LAND BANK* 41.53
TOTAL 152 116.87 117 49.25 14 9.62 9 3.44 8 7.42 300 228.14
*Estimated
Areas are in Million SqftD e e p d e v e l o p m e n t p i p e l i n e t o t h e t u n e o f 1 5 4 m n s f t

PRESTIGE GROUP | Investor Presentation | JUNE 2016 6
S H A R E H O L D I N G P A T T E R N
Promoters FIIs Mutual Funds Retail
70%
24%
1%
5%
As on 30th June 2016

PRESTIGE GROUP | Investor Presentation | JUNE 2016 7
Irfan RazackChairman & Managing
Director
Rezwan RazackJoint Managing Director
Noaman RazackWholetime Director
Uzma IrfanDirector
Jagdeesh K. ReddyIndependent
Director
B.G. KoshyIndependent
Director
Noor Ahmed JafferIndependent
Director
Dr. Pangal RanganathNayak
Independent
Director
B O A R D O F D I R E C T O R S

PRESTIGE GROUP | Investor Presentation | JUNE 2016 8
E X E C U T I V E M A N A G E M E N T
Faiz RezwanExecutive Director-
Contracts & Projects
Zackria HashimExecutive Director- Land
Acquisition
Zaid SadiqExecutive Director-
Liasion & Hospitality
Anjum JungExecutive Director- Interior
Design
Nayeem NoorExecutive Director-
Government Relations
Omer Bin JungExecutive Director-
Hospitality
V. GopalExecutive Director-
Projects & Planning
Zayd NoamanExecutive Director- CMD’s
OFFICE

PRESTIGE GROUP | Investor Presentation | JUNE 2016 9
Suresh SingaraveluExecutive Director- Retail,
Hospitality & Business
Expansion
Swaroop AnishExecutive Director- Business
Development
Ravinda JainExecutive Director-
Contracts
Venkat K NarayanExecutive Director-
Finance & CFO
E X E C U T I V E M A N A G E M E N T
Arvind PaiExecutive Director- Legal
PRESTIGE GROUP | Investor Presentation | JUNE 2016 10
INDEX.
1. ABOUT PRESTIGE
2. OPERATIONAL HIGHLIGHTS
3. FINANCIAL HIGHLIGHTS
4. PROJECT PORTFOLIO & UPDATE
5. RECEIVABLES PROFILE
6. AWARDS & RECOGNITIONS
7. PROJECT STATUS
8. GUIDANCE VS ACHIEVED
PRESTIGE GROUP | Investor Presentation | JUNE 2016 11
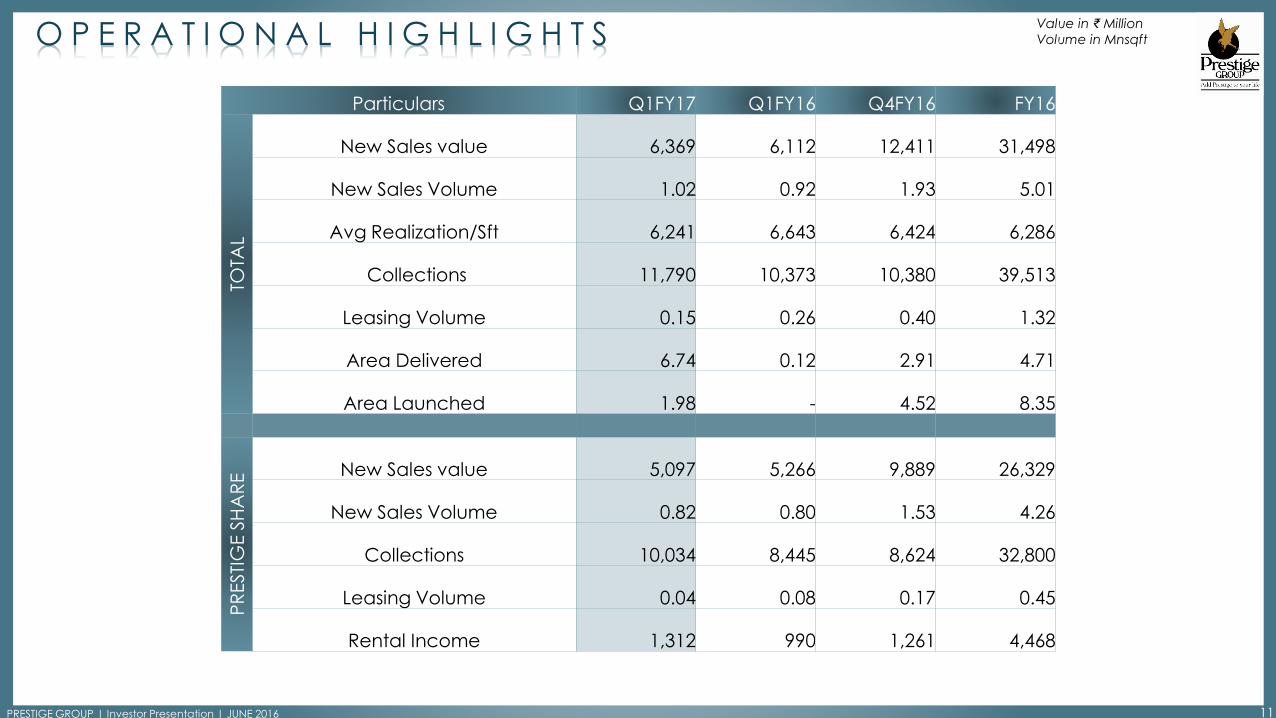
O P E R A T I O N A L H I G H L I G H T S
Particulars Q1FY17 Q1FY16 Q4FY16 FY16
TOTA
L
New Sales value 6,369 6,112 12,411 31,498
New Sales Volume 1.02 0.92 1.93 5.01
Avg Realization/Sft 6,241 6,643 6,424 6,286
Collections 11,790 10,373 10,380 39,513
Leasing Volume 0.15 0.26 0.40 1.32
Area Delivered 6.74 0.12 2.91 4.71
Area Launched 1.98 - 4.52 8.35
PR
ESTI
GE S
HA
RE New Sales value 5,097 5,266 9,889 26,329
New Sales Volume 0.82 0.80 1.53 4.26
Collections 10,034 8,445 8,624 32,800
Leasing Volume 0.04 0.08 0.17 0.45
Rental Income 1,312 990 1,261 4,468
Value in ₹ Million
Volume in Mnsqft

PRESTIGE GROUP | Investor Presentation | JUNE 2016 12
B U S I N E S S P E R F O R M A N C E
Q 1 L A U N C H / P R E - L A U N C H
Q 1 C O M P L E T I O N S
Sl.No Launched Project Location SegmentDevelopable Area
(Mnsf)Economic Interest Prestige Share (Mnsf)
1
Prestige Lake ridge
(Phase 1) Bengaluru Residential 1.02 67% 0.68
2 Prestige Valley Crest Mangaluru Residential 0.96 70% 0.67
TOTAL 1.98 1.35
Sl.No Completed Project Location SegmentDevelopable
Area (Mnsf)
Economic
Interest
Prestige Share
(Mnsf)
1
Prestige Tranquility
(B1-B8) Bangalore Residential 2.21 100% 2.21
2
Prestige Bellavista
(C1&C3) Chennai Residential 3.87 60% 2.32
3 Prestige Down Town Chennai Residential 0.23 100% 0.23
4 Prestige Casabella Bengaluru Residential 0.43 75% 0.32
TOTAL 6.74 5.08

PRESTIGE GROUP | Investor Presentation | JUNE 2016 13
S A L E S S U M M A R Y | P R E S T I G E S H A R EValues are in Million ₹
Areas are in Million Sqft
NOTE
− Substantial portion of above sales are yet to come for revenue recognition in the books of accounts since the projects have not reached the
threshold limits of 25% completion (excluding land)
− Overall unrecognized revenue in the books of accounts from all the projects as on 30/06/2016 (Sales made and yet to come for recognition)
based on POC is approximately ₹ 69,869 mn
− The above sales value and realization are excluding Stamp duty, Registration fee and Taxes. (These exclusions approximately aggregate to
around 15% of the sales value).
Particulars
Q1FY17 Q1FY16 Q4FY16 FY16
Area Units Value Area Units Value Area Units Value Area Units Value
Residential
Mid Income Segment 0.62 401 3,735 0.64 372 4,320 1.08 721 6,975 3.33 2,136 19,913
Premium Segment 0.06 17 481 0.06 17 701 0.14 54 1,105 0.45 170 3,980
TOTAL 0.68 418 4,216 0.70 389 5,021 1.22 775 8,080 3.78 2,306 23,893
Commercial 0.14 0 882 0.10 - 245 0.32 1,809 0.48 - 2,435
GRANDTOTAL 0.82 418 5,097 0.80 389 5266 1.53 775 9,889 4.26 2,306 26,328
Realisation per sft 6,241 6,582 6,443 6,188

PRESTIGE GROUP | Investor Presentation | JUNE 2016 14
INDEX.
1. ABOUT PRESTIGE
2. OPERATIONAL HIGHLIGHTS
3. FINANCIAL HIGHLIGHTS
4. PROJECT PORTFOLIO & UPDATE
5. RECEIVABLES PROFILE
6. AWARDS & RECOGNITIONS
7. PROJECT STATUS
8. GUIDANCE VS ACHIEVED

PRESTIGE GROUP | Investor Presentation | JUNE 2016 15
F I N A N C I A L H I G H L I G H T S | Q 1 F Y 1 7 | S T A N D A L O N EValues are in Million ₹
Particulars Q1FY17 Q1FY16
Turnover (Rs. Mn) 6,091 9,628
EBIDTA (Rs. Mn) 1,827 1,907
EBIDTA % 30% 20%
PAT (Rs. Mn) 1,367 1,132
PAT % 22% 12%
PRESTIGE GROUP | Investor Presentation | JUNE 2016 16
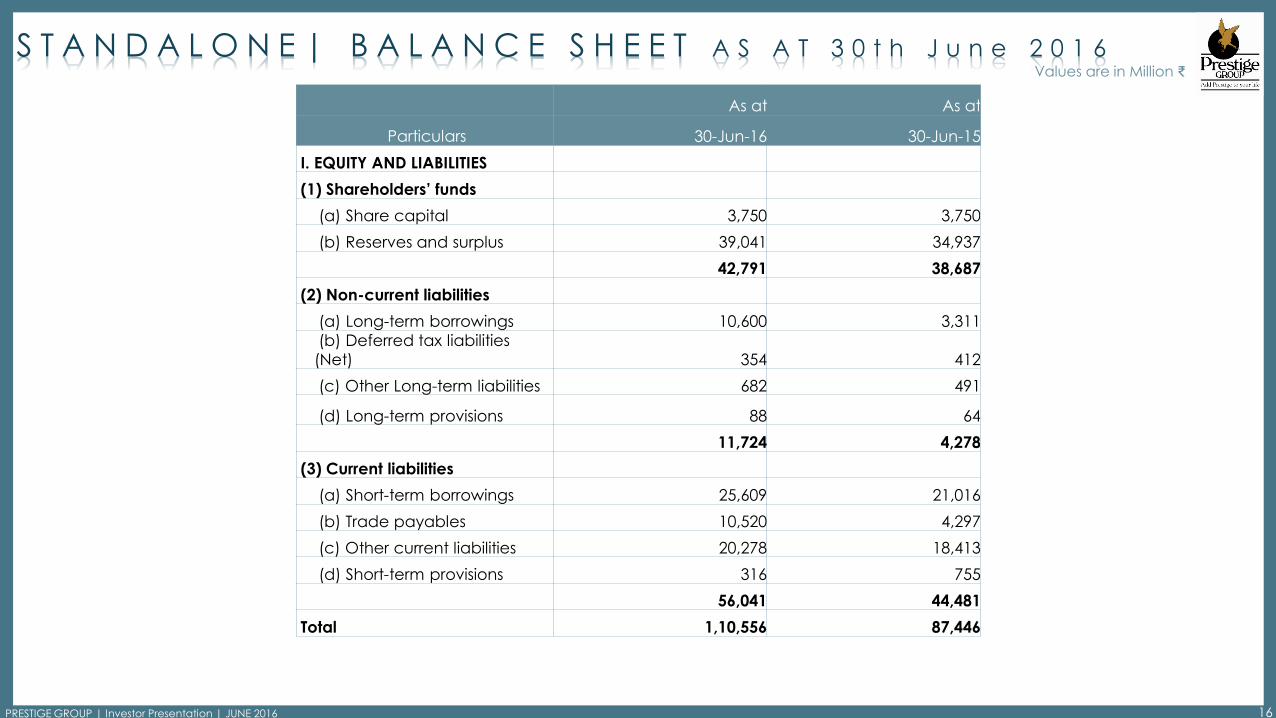
S T A N D A L O N E | B A L A N C E S H E E T A S A T 3 0 t h J u n e 2 0 1 6Values are in Million ₹
As at As at
Particulars 30-Jun-16 30-Jun-15
I. EQUITY AND LIABILITIES
(1) Shareholders’ funds
(a) Share capital 3,750 3,750
(b) Reserves and surplus 39,041 34,937
42,791 38,687
(2) Non-current liabilities
(a) Long-term borrowings 10,600 3,311
(b) Deferred tax liabilities
(Net) 354 412
(c) Other Long-term liabilities 682 491
(d) Long-term provisions 88 64
11,724 4,278
(3) Current liabilities
(a) Short-term borrowings 25,609 21,016
(b) Trade payables 10,520 4,297
(c) Other current liabilities 20,278 18,413
(d) Short-term provisions 316 755
56,041 44,481
Total 1,10,556 87,446
PRESTIGE GROUP | Investor Presentation | JUNE 2016 17
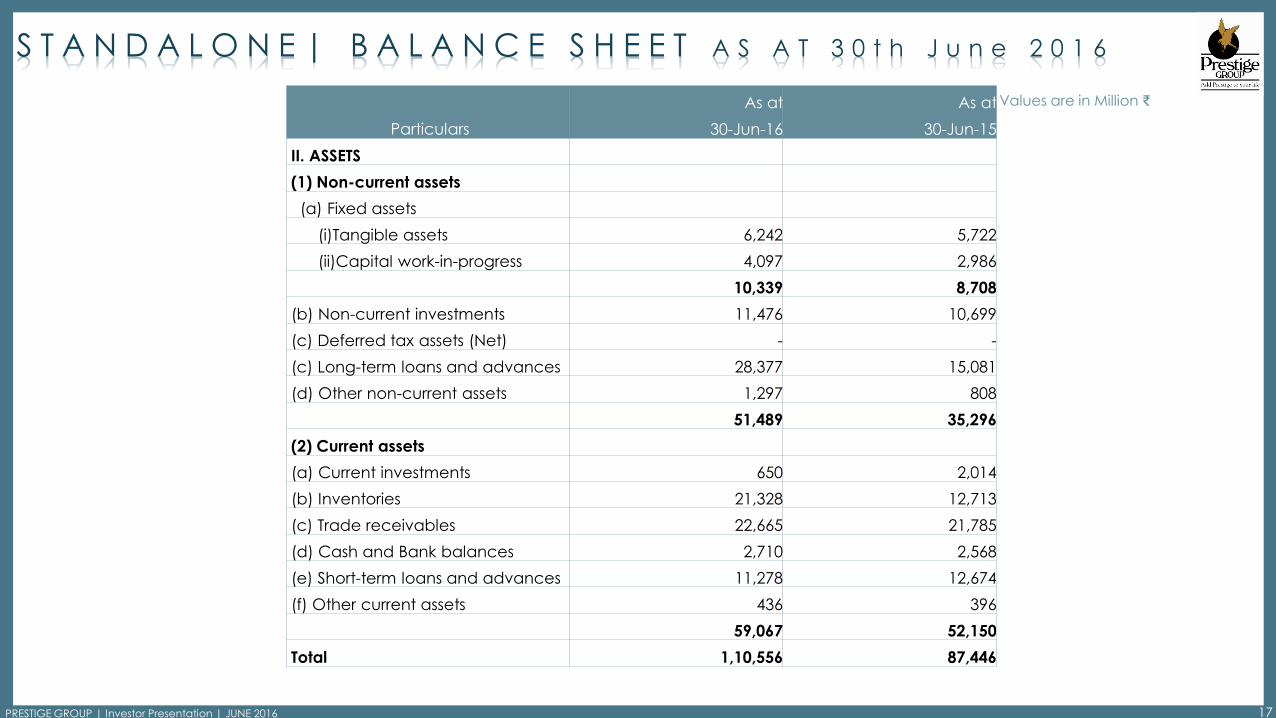
S T A N D A L O N E | B A L A N C E S H E E T A S A T 3 0 t h J u n e 2 0 1 6
Values are in Million ₹As at As at
Particulars 30-Jun-16 30-Jun-15
II. ASSETS
(1) Non-current assets
(a) Fixed assets
(i)Tangible assets 6,242 5,722
(ii)Capital work-in-progress 4,097 2,986
10,339 8,708
(b) Non-current investments 11,476 10,699
(c) Deferred tax assets (Net) - -
(c) Long-term loans and advances 28,377 15,081
(d) Other non-current assets 1,297 808
51,489 35,296
(2) Current assets
(a) Current investments 650 2,014
(b) Inventories 21,328 12,713
(c) Trade receivables 22,665 21,785
(d) Cash and Bank balances 2,710 2,568
(e) Short-term loans and advances 11,278 12,674
(f) Other current assets 436 396
59,067 52,150
Total 1,10,556 87,446
PRESTIGE GROUP | Investor Presentation | JUNE 2016 18
Values are in Million ₹
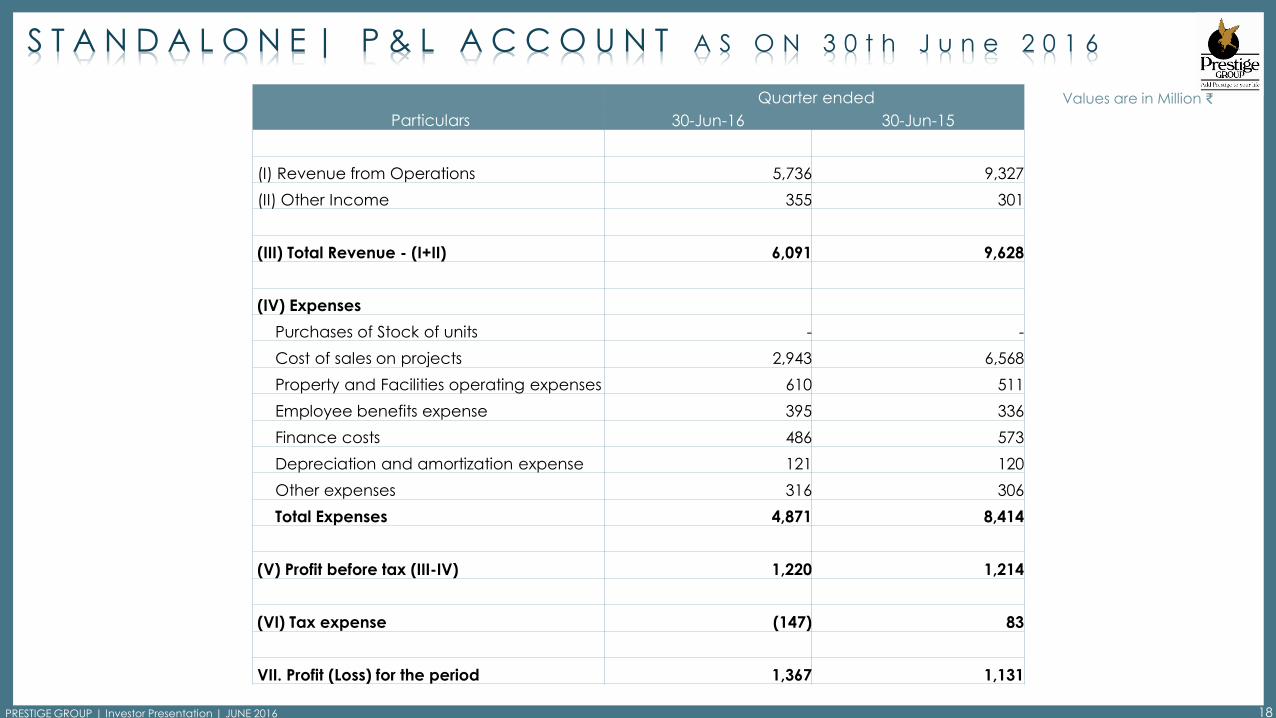
S T A N D A L O N E | P & L A C C O U N T A S O N 3 0 t h J u n e 2 0 1 6
Quarter ended
Particulars 30-Jun-16 30-Jun-15
(I) Revenue from Operations 5,736 9,327
(II) Other Income 355 301
(III) Total Revenue - (I+II) 6,091 9,628
(IV) Expenses
Purchases of Stock of units - -
Cost of sales on projects 2,943 6,568
Property and Facilities operating expenses 610 511
Employee benefits expense 395 336
Finance costs 486 573
Depreciation and amortization expense 121 120
Other expenses 316 306
Total Expenses 4,871 8,414
(V) Profit before tax (III-IV) 1,220 1,214
(VI) Tax expense (147) 83
VII. Profit (Loss) for the period 1,367 1,131

PRESTIGE GROUP | Investor Presentation | JUNE 2016 19
F I N A N C I A L S | K E Y R A T I O S | S T A N D A L O N E Values are in Million ₹
Sl. No. Particulars
Quarter ended
30-Jun-16Ratio/%
30-Jun-15Ratio/%(Unaudited) (Unaudited)
1 Sale of Projects & Property Income 5,736 9,327
2 Other Income 355 301
3 Total Income 6,091 9,628
4 Cost of project sold and property expenses 3,553 7,079
5 Gross Margin 2,183 38% 2,248 24%
6 Admin, Employee and Selling cost 711 642
7 EBIDTA 1,827 30% 1,907 20%
8 Financial Expenses 486 573
9 Depreciation 121 120
10 Total Expenses 4,871 8,414
11 PBT 1,220 20% 1,214 13%
12 Tax (147) 83
13 PAT 1,367 22% 1,131 12%
14 EPS (Annualized) (In Rs) 14.58 6.92
15 Market Price per share 185.30 248.75
16 PE Ratio 13 36
17 Market Cap 69,488 93,281
18 Net Worth 42,791 41,901
19 Book Value per share 114 112
20 Price to Book Value 1.62 2.23

PRESTIGE GROUP | Investor Presentation | JUNE 2016 20
F I N A N C I A L H I G H L I G H T S | Q 1 F Y 1 7 | C O N S O L I D A T E D
Values are in Million ₹
Particulars Q1FY17 Q1FY16
Turnover (Rs. Mn) 9,714 15,118
EBIDTA (Rs. Mn) 1,972 3,086
EBIDTA % 20% 20%
PAT (Rs. Mn) 705 1,336
PAT % 7% 9%

PRESTIGE GROUP | Investor Presentation | JUNE 2016 21
C O N S O L I D A T E D | B A L A N C E S H E E T A S A T 3 0 t h J u n e 2 0 1 6
Values are in Million ₹
As at As at
Particulars 30-Jun-16 30-Jun-15
I. EQUITY AND LIABILITIES
(1) Shareholders’ funds
(a) Share capital 3,750 3,750
(b) Reserves and surplus 38,113 34,265
(c) Capital reserve arising on
consolidation - -
41,863 38,015
(2) Minority interest 2,785 2,836
(3) Non-current liabilities
(a) Long-term borrowings 33,344 12,163
(b) Deferred tax liabilities (Net) 876 672
(c) Other Long-term liabilities 1,065 1,479
(d) Long-term provisions 76 95
35,361 14,409
(4) Current liabilities
(a) Short-term borrowings 20,793 21,917
(b) Trade payables 13,486 6,466
(c) Other current liabilities 39,974 42,211
(d) Short-term provisions 1,772 1,846
76,025 72,440
Total 1,56,034 1,27,700

PRESTIGE GROUP | Investor Presentation | JUNE 2016 22
C O N S O L I D A T E D | B A L A N C E S H E E T A S A T 3 0 t h J u n e 2 0 1 6
Values are in Million ₹As at As at
Particulars 30-Jun-16 30-Jun-15
II. ASSETS
(1) Non-current assets
(a) Fixed assets
(i)Tangible assets 25,232 18,063
(ii)Intangible assets 42 30
(iii)Capital work-in-progress 12,502 7,960
37,776 26,053
(b) Goodwill (arising on consolidation) 8,414 4,465
(c) Non-current investments 3,338 3,859
(d) Deferred tax assets (net) 797 520
(e) Long-term loans and advances 18,696 12,178
(f) Other non-current assets 894 365
69,915 47,440
(2) Current assets
(a) Current investments 741 2,014
(b) Inventories 47,464 36,582
(c) Trade receivables 23,987 23,589
(d) Cash and Bank balances 5,048 4,910
(e) Short-term loans and advances 8,002 12,119
(f) Other current assets 877 1,046
86,119 80,260
Total 1,56,030 1,27,700

PRESTIGE GROUP | Investor Presentation | JUNE 2016 23
C O N S O L I D A T E D | P & L a s o n 3 0 t h J u n e 2 0 1 6 Values are in Million ₹
Quarter ended
Particulars 30-Jun-16 30-Jun-15
(I) Revenue from Operations 9,449 14,933
(II) Other Income 265 185
(III) Total Revenue - (I+II) 9,714 15,118
(IV) Expenses
Cost of sales on projects 5,232 9,842
Cost of contractual projects 16 86
Property and Facilities operating expenses 1,274 1,111
Employee benefits expense 720 590
Finance costs 790 837
Depreciation and amortization expense 336 290
Other expenses 500 403
Total Expenses 8,868 13,159
(V) Profit before tax (III-IV) 846 1,959
(VI) Tax expense 141 623

PRESTIGE GROUP | Investor Presentation | JUNE 2016 24
C O N S O L I D A T E D | P & L a s o n 3 0 t h J u n e 2 0 1 6 Values are in Million ₹
Quarter ended
Particulars 30-Jun-16 30-Jun-15
VII. Profit (Loss) for the year 705 1,336
Share of profit / (loss) from associates (Net) (VIII) 3 (69)
Profit after tax (before adjustment for Minority interest) (IX = VII - VIII) 708 1,267
Share in (profit) / loss to Minority interest (X) (229) (120)
Profit after tax and Minority interest (VIII - X) 479 1,147
Other Comprehensive Income (8) (1)
Profit after Other Comprehensive Income 471 1,146
PRESTIGE GROUP | Investor Presentation | JUNE 2016 25
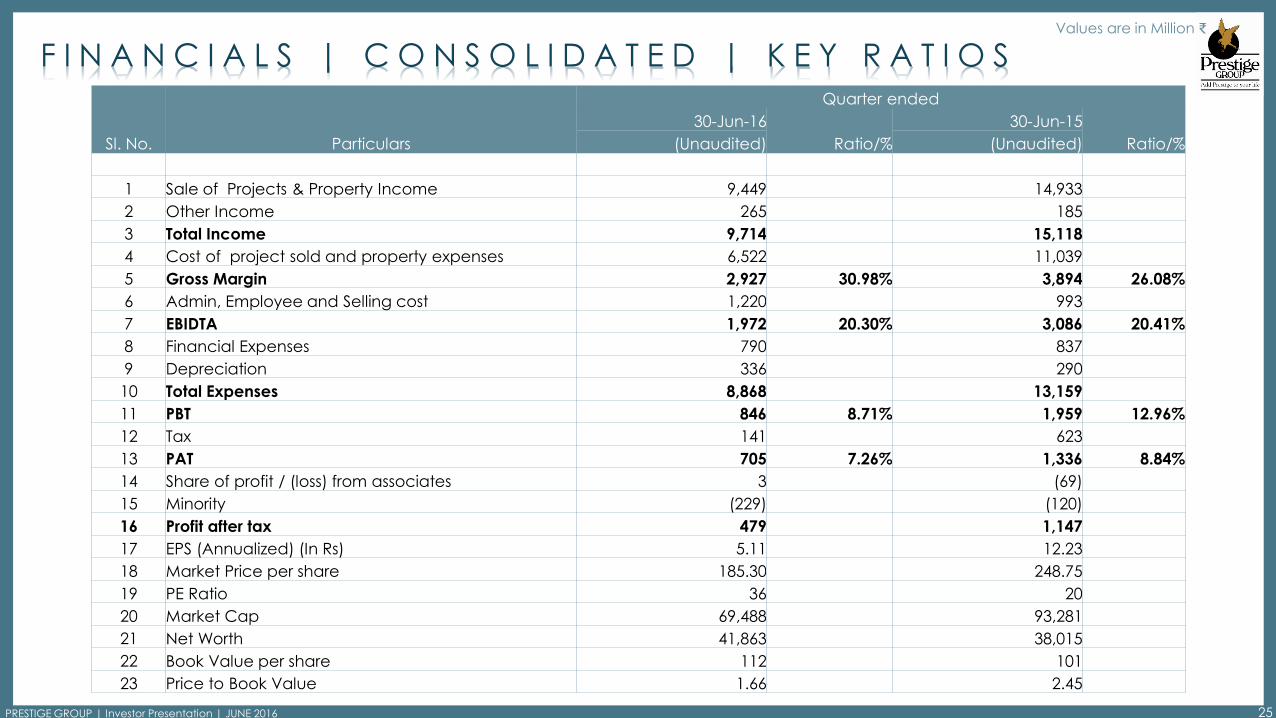
F I N A N C I A L S | C O N S O L I D A T E D | K E Y R A T I O S Values are in Million ₹
Sl. No. Particulars
Quarter ended
30-Jun-16
Ratio/%
30-Jun-15
Ratio/%(Unaudited) (Unaudited)
1 Sale of Projects & Property Income 9,449 14,933
2 Other Income 265 185
3 Total Income 9,714 15,118
4 Cost of project sold and property expenses 6,522 11,039
5 Gross Margin 2,927 30.98% 3,894 26.08%
6 Admin, Employee and Selling cost 1,220 993
7 EBIDTA 1,972 20.30% 3,086 20.41%
8 Financial Expenses 790 837
9 Depreciation 336 290
10 Total Expenses 8,868 13,159
11 PBT 846 8.71% 1,959 12.96%
12 Tax 141 623
13 PAT 705 7.26% 1,336 8.84%
14 Share of profit / (loss) from associates 3 (69)
15 Minority (229) (120)
16 Profit after tax 479 1,147
17 EPS (Annualized) (In Rs) 5.11 12.23
18 Market Price per share 185.30 248.75
19 PE Ratio 36 20
20 Market Cap 69,488 93,281
21 Net Worth 41,863 38,015
22 Book Value per share 112 101
23 Price to Book Value 1.66 2.45

PRESTIGE GROUP | Investor Presentation | JUNE 2016 26
UNRECOGNIZED REVENUE | F R O M P R O J E C T S U N D E R C O N S T R U C T I O N
Values are in Million ₹
Sl.No Projects
Total sales value of
unit sold as at 30-
June-2016
Cumulative
turnover declared
upto 30-June-2016
Balance turnover
to be declared on
POC
Expected timeline
to reach 25% trigger
1 Prestige Bellavista 13,335 13,105 231
2 Prestige Tranquility 9,662 8,572 1,091
3 Prestige White Meadows-1&2 7,069 6,530 539
4 Prestige Kingfisher Towers 7,816 6,393 1,423
5 Prestige Golf Shire 5,457 4,023 1,434
6 Prestige Royal wood 1,979 1,906 73
7 Prestige Casabella 887 748 139
8 Prestige Edwardian 604 493 112
9 Prestige Ferns Residency 7,676 5,935 1,741
10 Prestige Mayberry 2,734 2,577 157
11 Prestige Westwoods 4,167 2,895 1,273
12 Prestige Ivy Terraces 1,653 1,224 429
13 Prestige Downtown 1,152 942 210
14 Prestige Augusta Golf Village 6,553 4,187 2,365
15 Prestige Misty Waters 4,376 3,484 892

PRESTIGE GROUP | Investor Presentation | JUNE 2016 27
UNRECOGNIZED REVENUE | F R O M P R O J E C T S U N D E R C O N S T R U C T I O N
Values are in Million ₹
Sl.No Projects
Total sales value of
unit sold as at 30-
June-2016
Cumulative
turnover declared
upto 30-June-2016
Balance turnover
to be declared on
POC
Expected timeline
to reach 25% trigger
16 Prestige Silver Spring 2,187 1,966 221
17 Prestige Summer Fields 1,561 1,523 38
18 Prestige Jade Pavilion 2,540 2,181 359
19 Prestige Sunrise Park - Phase I & Phase II 10,184 6,733 3,451
20 Prestige Lakeside Habitat Phase I & II 16,746 9,877 6,869
21 Prestige Royale Garden-Phase I & Phase II 3,500 1,901 1,599
22 Prestige Brooklyn Heights 902 587 315
23 Prestige Bagmane Temple Bells 4,331 2,277 2,053
24 Prestige Spencer Heights 714 - 714 FY 17
25 Prestige Hermitage 176 - 176 FY 17
26 Prestige Falcon City- Phase I & II 15,005 - 15,005 FY 17
27 Prestige Falcon City Buy Back 1,838 - 1,838 FY 17
28 Prestige Falcon City Buy Back 2 572 - 572 FY 17
29 Prestige Gulmohar 2,313 - 2,313 FY 17
30 Prestige Leela Residences 2,228 - 2,228 FY 17

PRESTIGE GROUP | Investor Presentation | JUNE 2016 28
UNRECOGNIZED REVENUE | F R O M P R O J E C T S U N D E R C O N S T R U C T I O N
Values are in Million ₹
Sl.No Projects
Total sales value of
unit sold as at 30-
June-2016
Cumulative
turnover declared
upto 30-June-2016
Balance turnover
to be declared on
POC
Expected timeline
to reach 25% trigger
31 Prestige déjà vu 493 - 493 FY 17
32 Prestige Kenilworth 817 - 817 FY 17
33 Presige Woodside 271 - 271 FY 17
34 Prestige Pine Wood 875 - 875 FY 17
35 Prestige Woodland Park 1,217 - 1,217 FY 18
36 Prestige High Fields_Phase I 1,482 - 1,482 FY 17
37 Prestige Ivy League 1,124 - 1,124 FY 17
39 Prestige MSR 221 - 221 FY 18
40 Prestige Technostar 2,142 - 2,142 FY 17
41 Prestige Lake Ridge 520 - 520 FY 18
42 Prestige Northpoint 1,540 - 1,540 FY 18
43 Prestige Song of South 3,459 - 3,459 FY 18
44 Hillside Gateway 1,438 - 1,438 FY 18
45 Prestige Kew Gardens 2,712 - 2,712 FY 18

PRESTIGE GROUP | Investor Presentation | JUNE 2016 29
UNRECOGNIZED REVENUE | F R O M P R O J E C T S U N D E R C O N S T R U C T I O N
Values are in Million ₹
Sl.No Projects
Total sales value of
unit sold as at 30-
June-2016
Cumulative
turnover declared
upto 30-June-2016
Balance turnover
to be declared on
POC
Expected timeline
to reach 25% trigger
46 Prestige Fairfield 1,061 - 1,061 FY 18
47 Prestige Boulevard 600 - 600 FY 18
48 Prestige Valley Crest 37 - 37 FY 18
Total - A 1,59,926 90,058 69,869 -
PRESTIGE GROUP | Investor Presentation | JUNE 2016 30
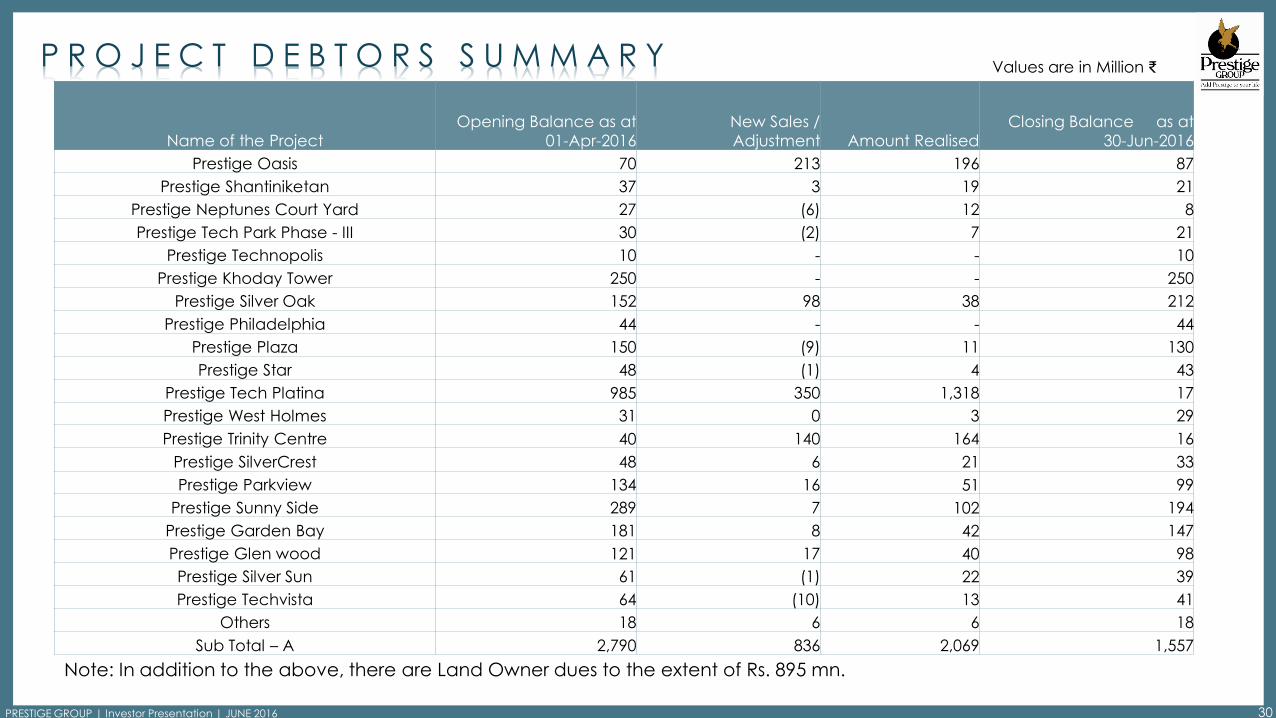
P R O J E C T D E B T O R S S U M M A R Y Values are in Million ₹
Name of the Project
Opening Balance as at
01-Apr-2016
New Sales /
Adjustment Amount Realised
Closing Balance as at
30-Jun-2016
Prestige Oasis 70 213 196 87
Prestige Shantiniketan 37 3 19 21
Prestige Neptunes Court Yard 27 (6) 12 8
Prestige Tech Park Phase - III 30 (2) 7 21
Prestige Technopolis 10 - - 10
Prestige Khoday Tower 250 - - 250
Prestige Silver Oak 152 98 38 212
Prestige Philadelphia 44 - - 44
Prestige Plaza 150 (9) 11 130
Prestige Star 48 (1) 4 43
Prestige Tech Platina 985 350 1,318 17
Prestige West Holmes 31 0 3 29
Prestige Trinity Centre 40 140 164 16
Prestige SilverCrest 48 6 21 33
Prestige Parkview 134 16 51 99
Prestige Sunny Side 289 7 102 194
Prestige Garden Bay 181 8 42 147
Prestige Glen wood 121 17 40 98
Prestige Silver Sun 61 (1) 22 39
Prestige Techvista 64 (10) 13 41
Others 18 6 6 18
Sub Total – A 2,790 836 2,069 1,557
Note: In addition to the above, there are Land Owner dues to the extent of Rs. 895 mn.
PRESTIGE GROUP | Investor Presentation | JUNE 2016 31
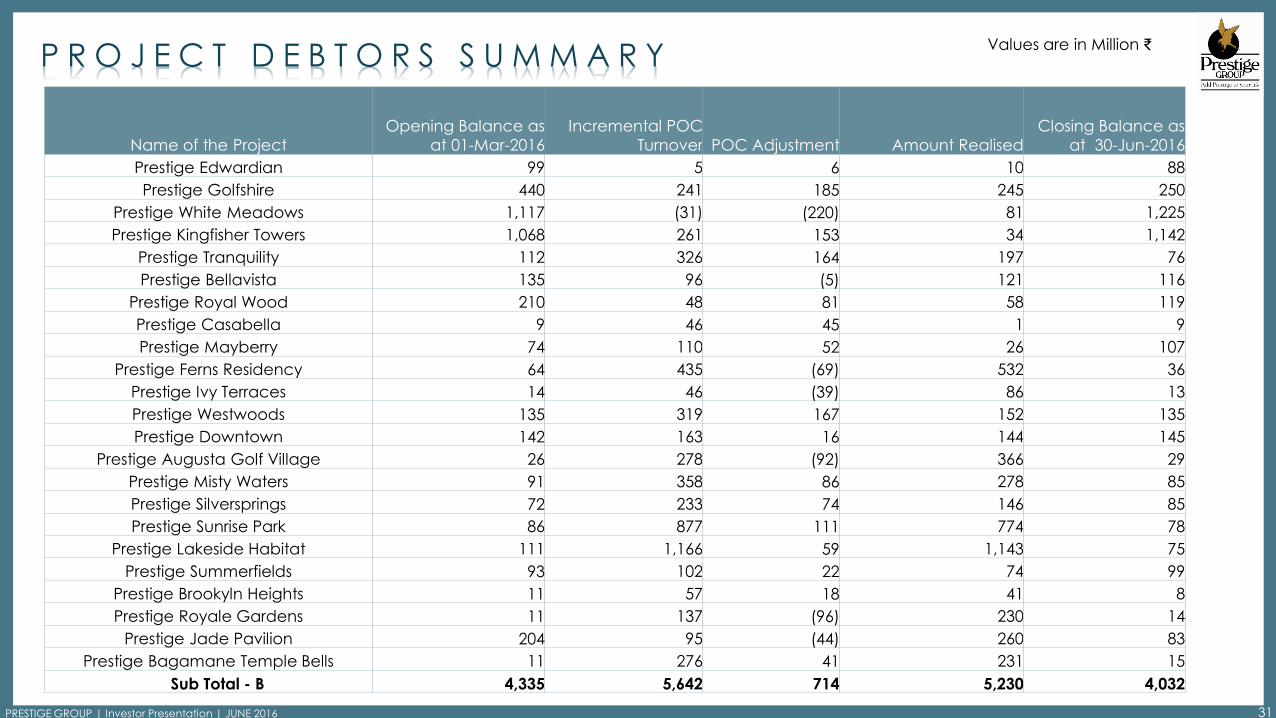
P R O J E C T D E B T O R S S U M M A R YValues are in Million ₹
Name of the Project
Opening Balance as
at 01-Mar-2016
Incremental POC
Turnover POC Adjustment Amount Realised
Closing Balance as
at 30-Jun-2016
Prestige Edwardian 99 5 6 10 88
Prestige Golfshire 440 241 185 245 250
Prestige White Meadows 1,117 (31) (220) 81 1,225
Prestige Kingfisher Towers 1,068 261 153 34 1,142
Prestige Tranquility 112 326 164 197 76
Prestige Bellavista 135 96 (5) 121 116
Prestige Royal Wood 210 48 81 58 119
Prestige Casabella 9 46 45 1 9
Prestige Mayberry 74 110 52 26 107
Prestige Ferns Residency 64 435 (69) 532 36
Prestige Ivy Terraces 14 46 (39) 86 13
Prestige Westwoods 135 319 167 152 135
Prestige Downtown 142 163 16 144 145
Prestige Augusta Golf Village 26 278 (92) 366 29
Prestige Misty Waters 91 358 86 278 85
Prestige Silversprings 72 233 74 146 85
Prestige Sunrise Park 86 877 111 774 78
Prestige Lakeside Habitat 111 1,166 59 1,143 75
Prestige Summerfields 93 102 22 74 99
Prestige Brookyln Heights 11 57 18 41 8
Prestige Royale Gardens 11 137 (96) 230 14
Prestige Jade Pavilion 204 95 (44) 260 83
Prestige Bagamane Temple Bells 11 276 41 231 15
Sub Total - B 4,335 5,642 714 5,230 4,032

PRESTIGE GROUP | Investor Presentation | JUNE 2016 32
P R O J E C T D E B T O R S S U M M A R Y Values are in Million ₹
Name of the Project
Opening Balance as
at 01-Mar-2016
Incremental POC
Turnover POC Adjustment Amount Realised
Closing Balance as
at 30-Jun-2016
Prestige Spencer Heights - - - 3 -
Prestige Falcon City - - - 1,141 -
Prestige Alta Vista Falcon City - - 173
Prestige KenilWorth - - - 29 -
Prestige High Fields - - - 21 -
Prestige Ivy League - - - 123 -
Prestige Leela Residences - - - 165 -
Prestige déjà vu - - - 31 -
Prestige Pinewood - - - 59 -
Prestige MSR - - - 2 -
Prestige North Point - - - 7 -
Prestige Wood Side - - - 10 -
Prestige Gulmohar - - - 115 -
Prestige Song of the south - - - 162 -
Prestige Hillside Gateway - - - 57 -
Prestige Boulevard 44
Prestige Kew Gardens 180
Prestige Fair Field 80
Prestige Techno Star 214
Prestige Hermitage 54
Prestige Lake Ridge 48
Prestige Misty Waters II 14
Sub Total - C - - - 2,734 -
Total (A+B+C) 7,125 6,477 714 10,033 5,589
PRESTIGE GROUP | Investor Presentation | JUNE 2016 33
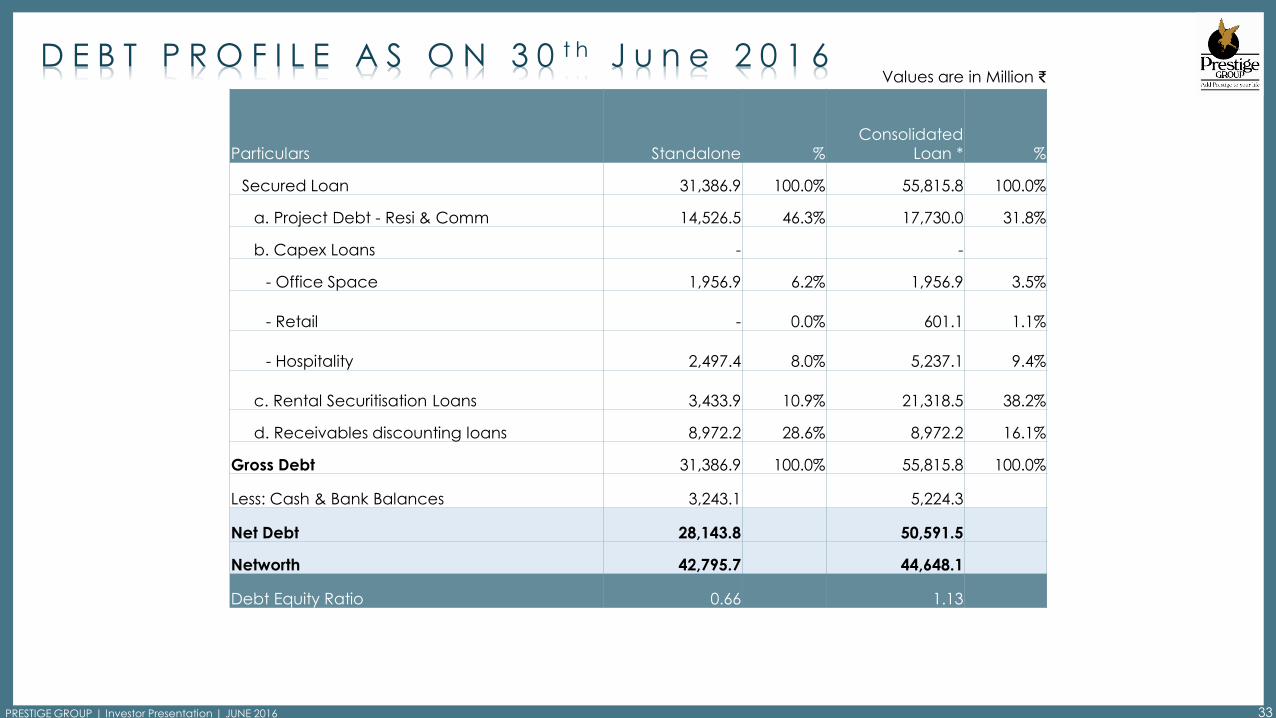
D E B T P R O F I L E A S O N 3 0 t h J u n e 2 0 1 6Values are in Million ₹
Particulars Standalone %
Consolidated
Loan * %
Secured Loan 31,386.9 100.0% 55,815.8 100.0%
a. Project Debt - Resi & Comm 14,526.5 46.3% 17,730.0 31.8%
b. Capex Loans - -
- Office Space 1,956.9 6.2% 1,956.9 3.5%
- Retail - 0.0% 601.1 1.1%
- Hospitality 2,497.4 8.0% 5,237.1 9.4%
c. Rental Securitisation Loans 3,433.9 10.9% 21,318.5 38.2%
d. Receivables discounting loans 8,972.2 28.6% 8,972.2 16.1%
Gross Debt 31,386.9 100.0% 55,815.8 100.0%
Less: Cash & Bank Balances 3,243.1 5,224.3
Net Debt 28,143.8 50,591.5
Networth 42,795.7 44,648.1
Debt Equity Ratio 0.66 1.13

PRESTIGE GROUP | Investor Presentation | JUNE 2016 34
ANNUALIZED PROJECTED EX IT RENTALS FOR AREA LEASED
Sl. No Project Name Segment
Total
Leasable Area
(Mnsqft)
Economic
Interest (Mnsqft)
Area Leased
Prestige Share
(Mnsqft)
Rent Per Sft
(₹)
Rent P.A
(Annualised)
(₹ Mn)
Existing Rental Income
1 Prestige Estates Projects Limited Commercial 1.90 1.90 1.90 38 866
2 West Palm Developers Pvt Ltd Commercial 0.32 0.19 0.19 35 80
3 Prestige Valley View Estates Pvt Ltd Commercial 0.01 0.004 0.004 235 12
4 Exora Business Park - Phase I-III Commercial 2.18 2.18 2.18 52 1,358
5 ICBI India Pvt Ltd Commercial 0.06 0.05 0.05 89 54
6 Cessna (B1 to B8) Commercial 2.77 2.35 2.35 43 1,226
7 Prestige Polygon Commercial 0.26 0.26 0.26 75 231
8 Forum Vijaya- Commercial Commercial 0.19 0.10 0.10 44 50
9 Forum Mall Retail 0.35 0.24 0.24 110 315
10 UB City Retail Retail 0.10 0.04 0.04 320 169
11 Forum Value Mall Retail 0.29 0.15 0.15 66 116
12 Forum Vijaya- Retail Retail 0.64 0.32 0.32 70 267
13 Forum Mall Sujana Hyderabad Retail 0.81 0.20 0.20 80 191
14 Forum Mall Mangalore Retail 0.66 0.23 0.23 40 111
15 SKN Commercial Commercial 0.39 0.39 0.39 35 165
Total annualised rentals as on 30th June
201610.92 8.60 8.60 5,210

PRESTIGE GROUP | Investor Presentation | JUNE 2016 35
ANNUALIZED PROJECTED EX IT RENTALS FOR AREA LEASED
Sl. No Project Name Segment
Total
Leasable Area
(Mnsqft)
Economic
Interest (Mnsqft)
Area Leased
Prestige Share
(Mnsqft)
Rent Per Sft
(₹)
Rent P.A
(Annualised)
(₹ Mn)
Rental Income by 31st March 2017
1 Prestige Polygon Commercial 0.08 0.08 0.00 75 69
2 Forum Mall Shantiniketan Retail 0.64 0.41 0.16 75 369
3 Prestige Mysore Central Retail 0.08 0.05 0.04 60 36
4 Forum Mall Mysore Retail 0.37 0.19 0.04 55 126
5 Prestige Falcon Towers Commercial 0.34 0.15 0.00 85 157
6 Prestige Trade Tower Commercial 0.48 0.22 0.00 100 261
Incremental rentals in FY17 1.99 1.10 0.24 1,018
Total annualised rentals by March 2017 12.92 9.70 8.84 6,229
PRESTIGE GROUP | Investor Presentation | JUNE 2016 36
INDEX.
1. ABOUT PRESTIGE
2. OPERATIONAL HIGHLIGHTS
3. FINANCIAL HIGHLIGHTS
4. PROJECT PORTFOLIO & UPDATE
5. RECEIVABLES PROFILE
6. AWARDS & RECOGNITIONS
7. PROJECT STATUS
8. GUIDANCE VS ACHIEVED

PRESTIGE GROUP | Investor Presentation | JUNE 2016 37
P R O D U C T M I X | O N G O I N G P R O J E C T SSEG
MEN
T
GEO
GR
AP
HY
City No. of ProjectsDevelopable
Area (Mnsf)
Bengaluru 52 55.68
Chennai 2 1.70
Cochin 5 3.50
Hyderabad 3 3.15
Mysuru 2 0.69
Mangaluru 1 0.96
Total 65 65.68
Segment No. of ProjectsDevelopable
Area (Mnsf)
Residential 50 55.61
Commercial 6 4.97
Retail 6 3.04
Hospitality 3 2.07
Total 65 65.68
Residential
85%
Commercial
7%
Retail
5%
Hospitality
3%
Residential
Commercial
Retail
Hospitality
Bengaluru
85%
Chennai
3%
Cochin
5%
Hyderabad
5%
Mysuru
1%
Mangaluru
1%Bengaluru
Chennai
Cochin
Hyderabad
Mysuru
Mangaluru
PRESTIGE GROUP | Investor Presentation | JUNE 2016 38
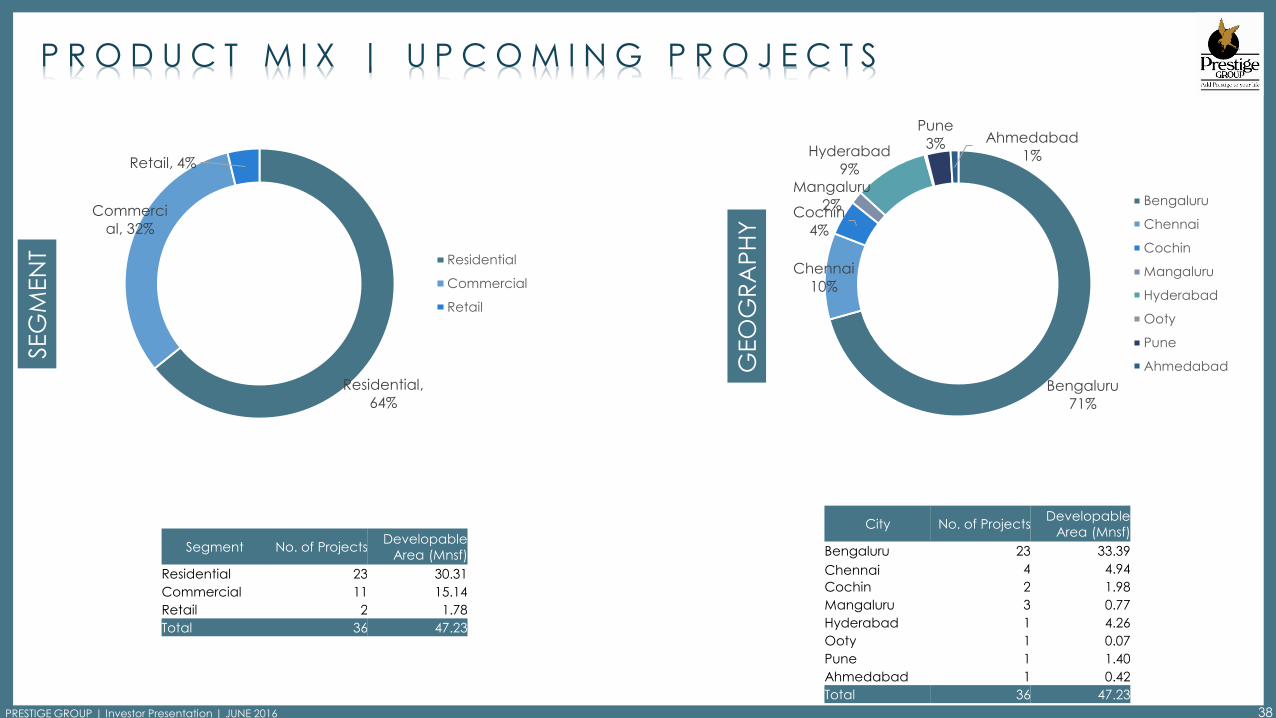
P R O D U C T M I X | U P C O M I N G P R O J E C T SSEG
MEN
T
GEO
GR
AP
HY
Bengaluru
71%
Chennai
10%
Cochin
4%
Mangaluru
2%
Hyderabad
9%
Pune
3% Ahmedabad
1%
Bengaluru
Chennai
Cochin
Mangaluru
Hyderabad
Ooty
Pune
Ahmedabad
Residential,
64%
Commerci
al, 32%
Retail, 4%
Residential
Commercial
Retail
City No. of ProjectsDevelopable
Area (Mnsf)
Bengaluru 23 33.39
Chennai 4 4.94
Cochin 2 1.98
Mangaluru 3 0.77
Hyderabad 1 4.26
Ooty 1 0.07
Pune 1 1.40
Ahmedabad 1 0.42
Total 36 47.23
Segment No. of ProjectsDevelopable
Area (Mnsf)
Residential 23 30.31
Commercial 11 15.14
Retail 2 1.78
Total 36 47.23

PRESTIGE GROUP | Investor Presentation | JUNE 2016 39
O N G O I N G P R O J E C T S | R E S I D E N T I A L
Sl.No Project City
Developable
Area (Mnsf)
Economic
Interest
Prestige Share
(Mnsf) No of Units
Prestige Share
of Units
1 Prestige Golfshire- Villas Bengaluru 1.75 100.00% 1.75 228 228
2 Prestige White Meadows -T3/T4 Bengaluru 1.04 100.00% 1.04 151 151
3 Prestige Royal Woods Hyderabad 0.63 50.00% 0.32 152 76
4 Prestige Edwardian Bengaluru 0.17 45.00% 0.08 26 12
5 Prestige Bella Vista (C2) Chennai 1.17 60.00% 0.70 607 364
6 Prestige Garden Bay Bengaluru 0.64 72.00% 0.46 184 132
7 Prestige Mayberry-1 Bengaluru 0.12 75.00% 0.09 40 30
8 Prestige Mayberry-2 Bengaluru 0.39 60.39% 0.24 126 76
9 Prestige Hermitage Bengaluru 0.23 50.00% 0.12 23 12
10 Prestige Summer Fields Bengaluru 0.31 50.85% 0.16 83 42
11 Kingfisher Towers Bengaluru 1.15 45.51% 0.52 83 38
12 Prestige Hillside Retreat Bengaluru 0.11 75.00% 0.08 58 44
13 Prestige Ferns Residency Bengaluru 3.38 62.00% 2.10 1,483 919
14 Prestige Misty Waters Bengaluru 1.22 51.00% 0.62 558 285
15 Prestige Brooklyn Heights Bengaluru 0.30 62.00% 0.19 94 58

PRESTIGE GROUP | Investor Presentation | JUNE 2016 40
O N G O I N G P R O J E C T S | R E S I D E N T I A L
Sl.No Project City
Developable
Area (Mnsf)
Economic
Interest
Prestige Share
(Mnsf) No of Units
Prestige Share
of Units
16 Prestige Spencer Heights Bengaluru 0.11 100.00% 0.11 34 34
17 Prestige Royale Garden - Phase I & II Bengaluru 3.15 68.50% 2.16 1,696 1,162
18 Prestige Sunrise Park - Phase I Bengaluru 1.69 99.00% 1.67 1,046 1,036
19 Prestige West Woods Bengaluru 1.34 60.00% 0.80 567 340
20 Prestige Augusta Golf Village Bengaluru 1.38 67.00% 0.92 460 308
21 Prestige Jade Pavilion Bengaluru 0.72 51.60% 0.37 266 137
22 Prestige Sunrise Park - Phase II Bengaluru 1.58 99.00% 1.56 864 855
23 Prestige Silver Spring Chennai 0.53 27.54% 0.15 121 33
24 Prestige Thomson Cochin 0.60 25.00% 0.15 238 60
25 Prestige Ivy Terraces Bengaluru 0.64 62.00% 0.40 315 195
26 Prestige Lakeside Habitat- Phase I & II Bengaluru 5.60 69.30% 3.88 2,488 1,724
27 Prestige Falcon City Phase I Bengaluru 4.98 42.84% 2.13 1,890 810
28 Prestige Bagmane Temple Bells Bengaluru 1.73 70.00% 1.21 968 678
29 Prestige Gulmohar Bengaluru 0.87 51.00% 0.44 404 206

PRESTIGE GROUP | Investor Presentation | JUNE 2016 41
Sl.No Project City
Developable
Area (Mnsf)
Economic
Interest
Prestige Share
(Mnsf) No of Units
Prestige Share
of Units
30 Prestige Leela Residences Bengaluru 0.53 60.00% 0.32 88 53
31 Prestige Ivy League Hyderabad 0.97 60.00% 0.58 349 209
32 Prestige High Fields_Phase I Hyderabad 1.55 68.34% 1.06 665 454
33 Prestige North Point Bengaluru 0.40 51.00% 0.21 184 94
34 Prestige Pine Wood Bengaluru 0.62 44.00% 0.27 256 113
35 Prestige Woodland Park Bengaluru 0.38 50.00% 0.19 166 83
36 Prestige Woodside Bengaluru 0.41 60.00% 0.25 132 79
37 Prestige MSR Bengaluru 0.15 65.00% 0.10 66 43
38 Prestige Bougainvillea Platinum Bengaluru 0.13 60.00% 0.08 22 13
39 Prestige Falcon City Phase II Bengaluru 1.52 35.70% 0.54 630 225
40 Prestige Déjà vu Bengaluru 0.15 56.00% 0.08 40 22
41 Prestige Kenilworth Bengaluru 0.19 40.00% 0.08 42 17
42 Prestige Song of South Bengaluru 2.28 69.04% 1.57 1,117 771
43 Prestige Tranquility (B9-B17) Bengaluru 2.36 100.00% 2.36 1,222 1,222
44 Prestige Hillside Gateway Cochin 1.55 70.00% 1.09 629 440
O N G O I N G P R O J E C T S | R E S I D E N T I A L

PRESTIGE GROUP | Investor Presentation | JUNE 2016 42
Sl.No Project City
Developable
Area (Mnsf)
Economic
Interest
Prestige Share
(Mnsf) No of Units
Prestige Share
of Units
45 Prestige Kew Gardens Bengaluru 1.71 60% 1.03 979 587
46 Prestige Fairfield (Dollars Colony) Bengaluru 0.54 27.03% 0.15 165 45
47 Prestige Boulevard Bengaluru 0.26 100% 0.26 144 144
48 Prestige Misty Waters (Phase 2) Bengaluru 0.41 51.00% 0.21 198 101
49 Prestige Lake ridge (Phase1) Bengaluru 1.02 66.70% 0.68 560 374
50 Prestige Valley Crest Mangaluru 0.96 70.00% 0.67 510 357
Total - A 55.61 36.20 23,417 15,491
O N G O I N G P R O J E C T S | R E S I D E N T I A L

PRESTIGE GROUP | Investor Presentation | JUNE 2016 43
O N G O I N G P R O J E C T S
Sl. No Project CityDevelopable
Area (Mnsf)
Economic
Interest
Prestige Share
(Mnsf)
1 Prestige Trade Towers Bengaluru 0.62 45.00% 0.28
2 Cessna Business Park B9-B11 Bengaluru 1.98 85.00% 1.68
3 Prestige TMS Square Cochin 0.17 58.00% 0.10
4 Prestige Falcon Towers Bengaluru 0.49 45.00% 0.22
5 Prestige Saleh Ahmed Bengaluru 0.11 50.00% 0.06
6 Prestige Technostar Bengaluru 1.60 80.00% 1.28
Total - B 4.97 3.62
Sl. No Project CityDevelopable
Area (Mnsf)
Economic
Interest
Prestige Share
(Mnsf)
1 Forum Shantiniketan Bengaluru 1.08 64.00% 0.69
2 Forum Mysuru Mysuru 0.58 50.99% 0.29
3 Prestige Mysuru Central Mysuru 0.11 65.00% 0.07
4 Prestige TMS Square Cochin 0.12 56.00% 0.07
5 Forum Thomsun Cochin 1.06 25.00% 0.26
6 Prestige Cube Bengaluru 0.09 100.00% 0.09
Total - C 3.04 1.47
Off
ice
Re
tail

PRESTIGE GROUP | Investor Presentation | JUNE 2016 44
Sl. No Project CityDevelopable
Area (Mnsf)
Economic
Interest
Prestige Share
(Mnsf)No. of Keys
1Conrad (Hilton)
Bengaluru 0.49 100.00% 0.49 285
2Sheraton Hotel & Convention Center
Bengaluru 0.65 100.00% 0.65 360
3Marriott Hotel & Convention Centre
Bengaluru 0.93 100.00% 0.93 297
Total - D 2.07 2.07 942
GRAND TOTAL 65.68 43.36
O N G O I N G P R O J E C T S
Ho
spita
lity

PRESTIGE GROUP | Investor Presentation | JUNE 2016 45
U P C O M I N G P R O J E C T S | R E S I D E N T I A L
Sl.No Project City
Developable Area
(Mnsf) Economic Interest
Prestige Share
(Mnsf)
1 Prestige Greenmoor Bengaluru 0.67 25.00% 0.17
2 Prestige Hillcrest Ooty 0.07 50.00% 0.04
3 Prestige Lakeside Habitat Phase III Bengaluru 3.29 69.30% 2.28
4 Prestige Primerose Hills Bengaluru 2.02 62.00% 1.25
5 Prestige Park Square Bengaluru 1.10 42.00% 0.46
6 Roshanara Property Bengaluru 0.22 100.00% 0.22
7 Mangaluru Villas Mangaluru 0.14 68.00% 0.09
8 Prestige Avalon Bengaluru 0.09 40.00% 0.03
9 Prestige Fountain Blue Bengaluru 0.20 60.00% 0.12
10 Prestige Dolce Vita Bengaluru 0.22 60.00% 0.13
11 Prestige Courtyards Chennai 0.90 70.00% 0.63
12 Prestige Lake ridge (Phase2) Bengaluru 1.02 66.70% 0.68
13 Prestige Cosmopoliton Chennai 0.18 100.00% 0.18
14 Prestige Jindal Property Bengaluru 4.65 37.23% 1.73
15 Prestige Verdant Vistas Mangaluru 0.29 60.00% 0.17

PRESTIGE GROUP | Investor Presentation | JUNE 2016 46
Sl.No Project City
Developable Area
(Mnsf) Economic Interest
Prestige Share
(Mnsf)
16 Prestige High Fields Phase II Hyderabad 4.26 68.34% 2.91
17 Song of south Ph II Bengaluru 2.28 69.04% 1.57
18 Prestige Botanique Bengaluru 0.14 55.00% 0.08
19 Prestige Palm Residences Mangaluru 0.34 75.00% 0.26
20 Prestige Green Gables Bengaluru 2.02 60.00% 1.21
21 Prestige Elysian, Bannerghatta Road Bengaluru 1.09 30.60% 0.33
22 Prestige Falcon City- Phase II Bengaluru 1.59 35.70% 0.57
23 Prestige Pelican Drive, Chennai (Pallavaram) Chennai 3.54 31.62% 1.12
Total - A 30.31 16.23
U P C O M I N G P R O J E C T S | R E S I D E N T I A L

PRESTIGE GROUP | Investor Presentation | JUNE 2016 47
U P C O M I N G P R O J E C T S | C O M M E R C I A L
Sl. No Project City
Developable Area
(Mnsf) Economic Interest
Prestige Share
(Mnsf)
1 Prestige Tech Cloud Bengaluru 4.48 73.93% 3.31
2 Prestige Tech Park IV Bengaluru 1.55 90.00% 1.40
3 Prestige Tech Pacifica Park (ORR) Bengaluru 1.65 62.95% 1.04
4 Prestige Central Street Bengaluru 0.18 55.00% 0.10
5 Mount road Chennai Chennai 0.32 45.00% 0.14
6 Prestige Star Tech Bengaluru 1.82 51.00% 0.93
7 Kharadi, Pune Property Pune 1.40 66.75% 0.93
8 Gift City (Ahmedabad) Ahmedabad 0.42 100.00% 0.42
9 Cyber Green (Kochi Smart City) Cochin 1.46 100.00% 1.46
10 Prestige Logistics Centre, Malur Bengaluru 0.38 100.00% 0.38
11 Prestige Retreat Bengaluru 1.48 100.00% 1.48
Total - B 15.14 8.45 11.59
PRESTIGE GROUP | Investor Presentation | JUNE 2016 48
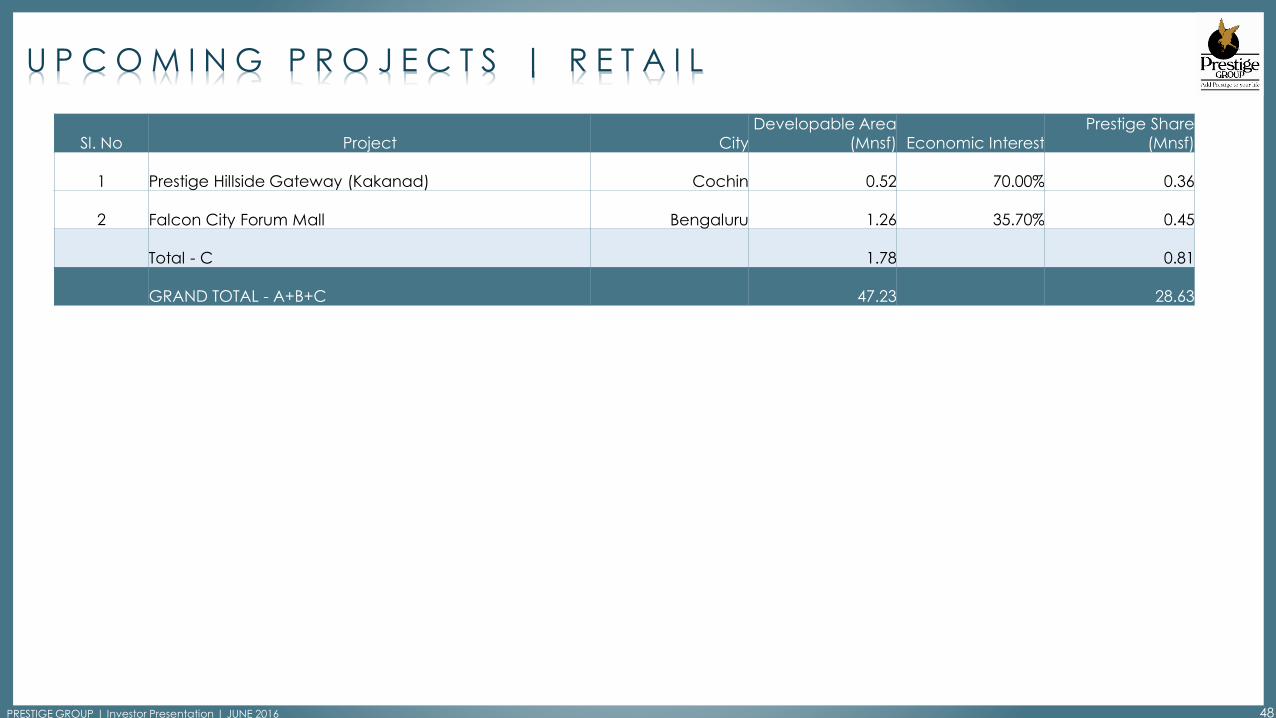
U P C O M I N G P R O J E C T S | R E T A I L
Sl. No Project City
Developable Area
(Mnsf) Economic Interest
Prestige Share
(Mnsf)
1 Prestige Hillside Gateway (Kakanad) Cochin 0.52 70.00% 0.36
2 Falcon City Forum Mall Bengaluru 1.26 35.70% 0.45
Total - C 1.78 0.81
GRAND TOTAL - A+B+C 47.23 28.63

PRESTIGE GROUP | Investor Presentation | JUNE 2016 49
L A N D B A N K
Potential Developable area of 42 mn sft (Prestige Share 28 Mn sqft)
Sl. No Entity Name Location Land Area (Acres) Economic Interest PEPL Share (Acres)
1 Prestige Bidadi Holdings Pvt Ltd Bidadi 143 100% 143
2 Prestige Projects Pvt Ltd Sarjapur/Bengaluru 182 33% 59
3 Prestige Estates Projects Ltd Bengaluru 2 100% 2
4 Village D Nandi Pvt Ltd Bengaluru 23 100% 23
5 Eden Investments Goa 74 78% 57
Total 424 284
PRESTIGE GROUP | Investor Presentation | JUNE 2016 50
INDEX.
1. ABOUT PRESTIGE
2. OPERATIONAL HIGHLIGHTS
3. FINANCIAL HIGHLIGHTS
4. PROJECT PORTFOLIO & UPDATE
5. RECEIVABLES PROFILE
6. AWARDS & RECOGNITIONS
7. PROJECT STATUS
8. GUIDANCE VS ACHIEVED

PRESTIGE GROUP | Investor Presentation | JUNE 2016 51
As on 30th June 2016
Areas are in Million Sqft
Values are in Million ₹
Sales
Developable Area 65.70
Car Park Area 15.52
Saleable Area 50.17
Prestige Share
Value 2,39,760
Area 38.08
Sales achieved (69%)
Value 1,54,656
Area 26.24
Stock (31%)
Value 85,106 = A
Area 11.83
Amount Received
1,00,788
Balance to be received
53,868 = B
Already
Incurred
83,930
Balance to be spent
66,681
Recovery fromLand Owner
(in JD)
1,255
Refundable Deposit
6,348
Balance to be incurred
Prestige Share
59,078= C
Cost
1,50,611
R E C E I V A B L E S P R O F I L E | O N G O I N G
P R O J E C T S
Net Cash Flows of Ongoing Projects (A+B-C)= ₹ 79,895
Partner Share
Value NA
Area 12.10
REVENUE
GENERATING
PROJECTS
52
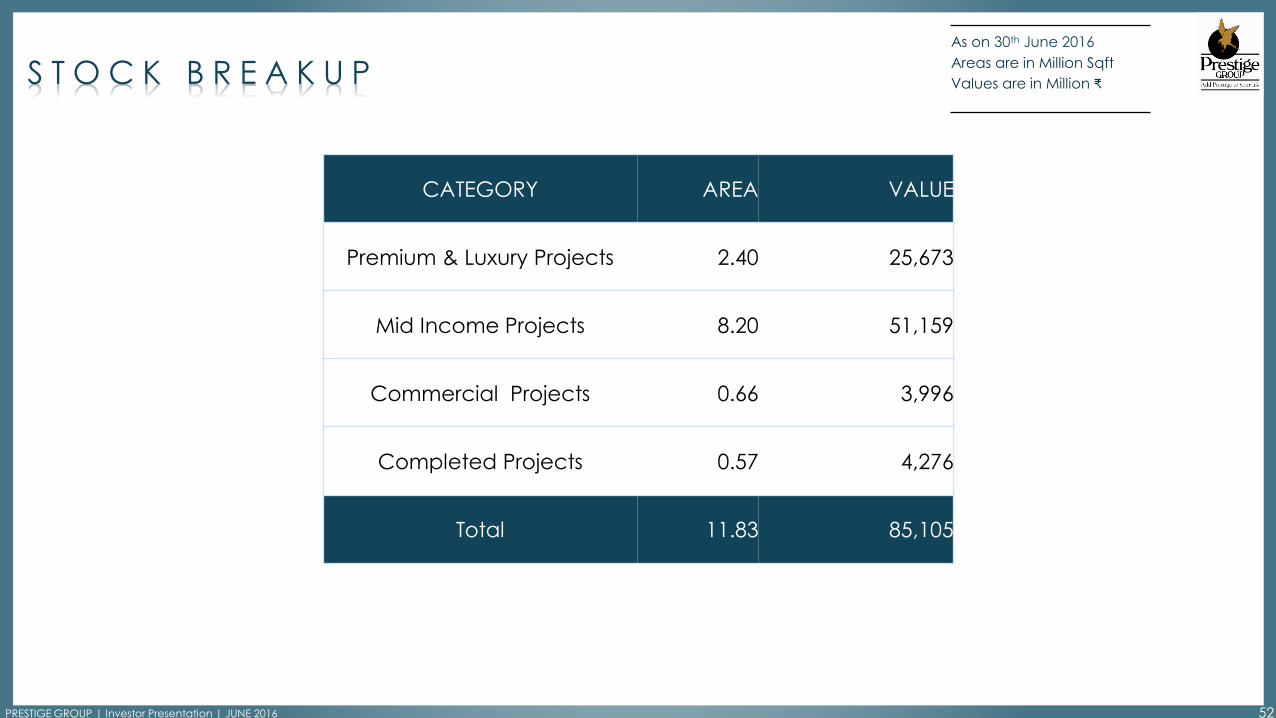
S T O C K B R E A K U PAs on 30th June 2016
Areas are in Million Sqft
Values are in Million ₹
CATEGORY AREA VALUE
Premium & Luxury Projects 2.40 25,673
Mid Income Projects 8.20 51,159
Commercial Projects 0.66 3,996
Completed Projects 0.57 4,276
Total 11.83 85,105
PRESTIGE GROUP | Investor Presentation | JUNE 2016

53
Sales*
Developable Area 30.30
Car Park Area 8.54
Saleable Area 21.76
Cost*
63,714
Partner Share
Value NA
Area 7.14
Prestige Share
Value 89,627
Area 14.62
Surplus^
28,159
As on 30th June 2016
Areas are in Million Sqft
Values are in Million ₹
R E C E I V A B L E S P R O F I L E | U P C O M I N G
P R O J E C T S
*Estimated, ^Includes RD
UPCOMING
REVENUE
GENERATING
PROJECTS
PRESTIGE GROUP | Investor Presentation | JUNE 2016
54
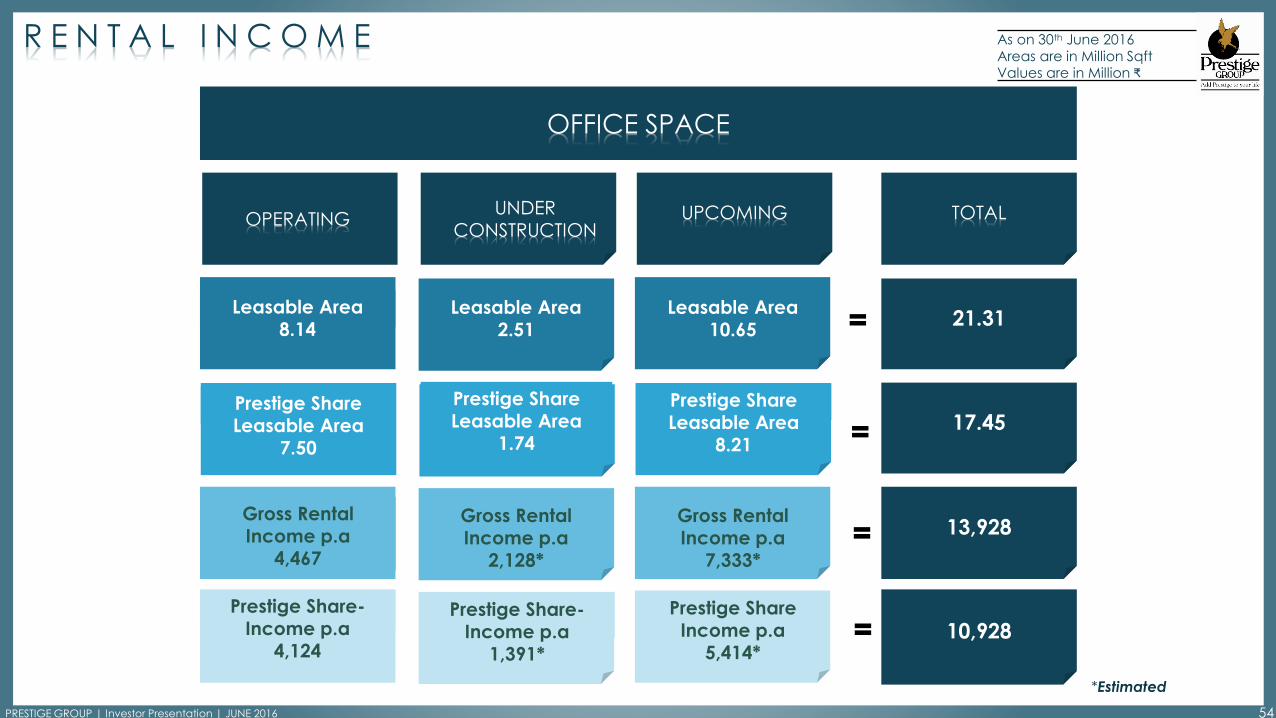
R E N T A L I N C O M E As on 30th June 2016Areas are in Million SqftValues are in Million ₹
*Estimated
OFFICE SPACE
Leasable Area 8.14
Leasable Area 2.51
Leasable Area 10.65
Prestige Share Leasable Area
7.50
Prestige Share
Leasable Area 1.74
Prestige Share Leasable Area
8.21
Gross Rental Income p.a
4,467
Gross Rental Income p.a
2,128*
Gross Rental Income p.a
7,333*
Prestige Share-Income p.a
4,124
Prestige Share-Income p.a
1,391*
Prestige Share Income p.a
5,414*
UPCOMING
21.31
17.45
13,928
10,928
TOTALUNDER CONSTRUCTION
OPERATING
PRESTIGE GROUP | Investor Presentation | JUNE 2016

55
R E N T A L I N C O M E
RETAIL
Leasable Area 2.85
Leasable Area 1.93
Leasable Area 1.34
Prestige Share Leasable Area
1.18
Prestige Share Leasable Area
0.90
Prestige Share Leasable Area
0.61
Gross Rental Income p.a
2,703
Gross Rental Income p.a
1,625*
Gross Rental Income p.a
1,718*
Prestige Share Income p.a
1,168
Prestige Share Income p.a
749*
Prestige Share Income p.a
734*
OPERATINGUNDER
CONSTRUCTION UPCOMING
6.12
2.69
6,046
2,651
TOTAL
As on 30th June 2016Areas are in Million SqftValues are in Million ₹
*Estimated
PRESTIGE GROUP | Investor Presentation | JUNE 2016

56
H O S P I T A L I T Y I N C O M E
HOSPITALITY
Total Keys 617
Prestige Share Keys 405
Gross Operating Income p.a
1,219
Gross Operating Income p.a
2,119*
Prestige Share Income p.a
833
Prestige Share Income p.a
2,119*
OPERATING UNDER CONSTRUCTION
1,559
1,347
3,337
2,952
TOTAL
Total Keys 942
Prestige Share Keys 942
As on 30th June 2016Values are in Million ₹
*Estimated
PRESTIGE GROUP | Investor Presentation | JUNE 2016

PRESTIGE GROUP | Investor Presentation | JUNE 2016 57
INDEX.
1. ABOUT PRESTIGE
2. OPERATIONAL HIGHLIGHTS
3. FINANCIAL HIGHLIGHTS
4. PROJECT PORTFOLIO & UPDATE
5. RECEIVABLES PROFILE
6. AWARDS & RECOGNITIONS
7. PROJECT STATUS
8. GUIDANCE VS ACHIEVED

PRESTIGE GROUP | Investor Presentation | JUNE 2016 58
Q 1 F Y 1 7 A W A R D S & R E C O G N I T I O N
D&B
Corporate Award
2016
World's Greatest Brands & Leaders
2015-16
FIABCI World Prix d’
Excellence Awards
Prestige Silver Oak
PRESTIGE GROUP | Investor Presentation | JUNE 2016 59
INDEX.
1. ABOUT PRESTIGE
2. OPERATIONAL HIGHLIGHTS
3. FINANCIAL HIGHLIGHTS
4. PROJECT PORTFOLIO & UPDATE
5. RECEIVABLES PROFILE
6. AWARDS & RECOGNITIONS
7. PROJECT STATUS
8. GUIDANCE VS ACHIEVED

60
P R O J E C T S N A P S H O T S | R E S I D E N T I A L P R O J E C T S
PRESTIGE FERNSRESIDENCY KINGFISHER TOWERS
PRESTIGE EDWARDIAN PRESTIGE WEST WOODS PRESTIGE BELLA VISTA
PRESTIGE TEMPLE BELLS

61
P R O J E C T S N A P S H O T S | R E S I D E N T I A L P R O J E C T S
PRESTIGE MISTY WATERS PRESTIGE LAKESIDE HABITAT
PRESTIGE JADE PAVILION
PRESTIGE DOWNTOWN
PRESTIGE WHITE MEADOWS PRESTIGE MAYBERRY

62
P R O J E C T S N A P S H O T S
PRESTIGE FALCON TOWERPRESTIGE FALCON CITY
CONRAD HOTEL
PRESTIGE HERMITAGE
SHERATON HOTEL JW MARRIOTT

PRESTIGE GROUP | Investor Presentation | JUNE 2016 63
INDEX.
1. ABOUT PRESTIGE
2. OPERATIONAL HIGHLIGHTS
3. FINANCIAL HIGHLIGHTS
4. PROJECT PORTFOLIO & UPDATE
5. RECEIVABLES PROFILE
6. AWARDS & RECOGNITIONS
7. PROJECT STATUS
8. GUIDANCE VS ACHIEVED

64
G U I D A N C E V S A C H I E V E D
PARTICULARS
TARGET FOR FULL YEAR(FY17) AS OF Q1FY17 % ACHIEVED
New Sales Value 35,000 - 40,000 6,369 18%
Turnover 40,000 - 45,000 9,482 24%
Collections 40,000 - 45,000 11,790 29%
Launch Volume 10 - 12 1.98 20%
Completions 10 - 12 6.74 67%
Leasing Volume 1.50 - 2.00 0.15 10%
Exit Rental Income 6,000 - 6,250 5,210 87%
Debt Equity Ratio
Consolidated 1.00 - 1.25 1.13
Standalone 0.60 - 0.75 0.66
Value in ₹ Million
Volume in Mnsqft

PRESTIGE GROUP | Investor Presentation | JUNE 2016 65
This presentation has been prepared by Prestige Estates Projects Limited (“Company”) solely for
providing information about the Company. It contains certain forward looking statements
concerning Prestige Estates Projects Ltd’s future business prospects and business profitability, which
are subject to a number of risks and uncertainties and the actual results could materially differ from
those in such forward looking statements. The risks and uncertainties relating to these statements
include, but are not limited to, risks and uncertainties, regarding fluctuations in earnings, our ability
to manage growth, competition, economic growth in India, ability to attract and retain highly skilled
professionals, time and cost over runs on contracts, government policies and actions with respect to
investments, fiscal deficits, regulation etc., interest and other fiscal cost generally prevailing in the
economy. The company does not undertake to make any announcement in case any of these
forward looking statements become materially incorrect in future or update any forward looking
statements made from time to time on behalf of the company.
D I S C L A I M E R

T H A N K Y O U
Venkata K. Narayana
Executive Director, Finance & CFO
Phone: +91 -80 – 25001280
E-mail: [email protected]
Registered Office
Prestige Estates Projects Limited
The Falcon House,
No. 1, Main Guard Cross Road,
Bangalore –560 001
Phone: +91 -80 –25591080, Fax: + 91 –80 -25591945
Website: www.prestigeconstructions.com