I Mfarinya Elizabeth T. declare that this project is my ...
71
i DECLARATION FORM I Mfarinya Elizabeth T. declare that this project is my own piece of work which has not been copied from any source without the acknowledgement of the source. Signature: …………………………………. Date: …....……………………………
Transcript of I Mfarinya Elizabeth T. declare that this project is my ...

i
DECLARATION FORM
I Mfarinya Elizabeth T. declare that this project is my own piece of work which has not been
copied from any source without the acknowledgement of the source.
Signature: …………………………………. Date: …....……………………………

ii
APPROVAL FORM
The undersigned certify that they have read, supervised and recommended to the Midlands State
University for acceptance a dissertation entitled:
The impact of cost containment strategies on the financial performance of health insurance
firms: case of PSMAS.
The dissertation was submitted by Mfarinya Elizabeth T. (R13394V) in partial fulfillment of the
requirements of the Bachelor of Commerce Accounting (Honours) degree at Midlands State
University.
SUPERVISOR: …………………………………. DATE: …....……………………………
CHAIRPERSON: ………………………………. DATE: …....……………………………

iii
RELEASE FORM
NAME OF STUDENT: Mfarinya Elizabeth T.
DISSERTATION TITLE: The impact of cost containment strategies on
the financial performance of health
insurance firms: case of PSMAS.
DISSERTATION SUPERVISOR: Mr. Kazembe.
DEGREE TITLE: Bachelor of Commerce Accounting Honours
Degree
YEAR DEGREE WAS GRANTED 2016
Permission is hereby granted to the Midlands State University Library to produce single copies
of this project and to lend or sell such copies for private, scholarly or scientific research purposes
only. The author reserves other publication rights and neither the project nor extensive extracts
from it may be printed or otherwise reproduced without the author’s written permission.
SIGNED: …………………………………………..
PERMANENT ADDRESS: 11112 Kuwadzana Extension,
Harare
DATE: October 2016

iv
ACKNOWLEDGEMENTS
I thank the Almighty God for being a pillar of strength and for the guidance throughout my
study.
Much appreciation is extended to my research supervisor Mr. Kazembe for his knowledgeable
guidance throughout my research. I am deeply indebted to Mr. Muchinenyika, PSMAS Finance
Director for his approval to carry out this research in the organisation as well as to the rest of the
PSMAS staff for participating in the research.
Special thanks also go to my mother and sister for their unwavering support as well as to my
colleagues, Kudakwashe Machinyi, Desmond Makadzange and Tariro Mabvira whose insight
and encouragement helped me during the course of the research.

v
DEDICATION
This piece of work is dedicated to my loving and supportive mother: for seeing more in me than I
ever did in myself.

vi
ABSTRACT
The research was prompted by the continual rising of costs and decreasing profitability of
PSMAS, a health insurance firm in Zimbabwe. Despite the fact that the firm had made efforts to
contain costs since 2013, its profitability and general financial performance continued to decline.
The research therefore sought to identify and analyse the cost containment strategies being
implemented by PSMAS and to establish factors that influence the success of these strategies.
The research also aimed to establish the relationship that exists between cost containment
strategies and the financial performance of health insurance firms. The study also had the
objective of suggesting more effective strategies to curb costs as well as to determine other
factors affecting the financial performance of health insurance firms like PSMAS. Literature
from other authors and scholars that relate to the research was reviewed and explored. The
researcher then made use of interviews and questionnaires to collect data for the research. A total
of 32 questionnaires were distributed to the PSMAS staff and 27 were returned earning a
response rate of 84% while three individuals were interviewed out of the five scheduled inspiring
an interview response rate of 60%. Data collected was presented into tables and charts and
analysis was made resulting in conclusions to be drawn. Recommendations were made based on
the conclusions.

vii
TABLE OF CONTENTS
DECLARATION FORM ................................................................................................................................. i
APPROVAL FORM ...................................................................................................................................... ii
RELEASE FORM ......................................................................................................................................... iii
ACKNOWLEDGEMENTS ............................................................................................................................ iv
DEDICATION .............................................................................................................................................. v
ABSTRACT ................................................................................................................................................. vi
TABLE OF CONTENTS ............................................................................................................................... vii
LIST OF TABLES ........................................................................................................................................ xii
LIST OF APPENDICES ................................................................................................................................... xiv
CHAPTER ONE ........................................................................................................................................... 1
Introduction .............................................................................................................................................. 1
1.0Introduction ......................................................................................................................................... 1
1.1Background of the study ...................................................................................................................... 1
1.2Statement of the problem ................................................................................................................... 3
1.3 Main Research Question ..................................................................................................................... 3
1.4Objectives ............................................................................................................................................ 3
1.5Research Questions ............................................................................................................................. 3
1.6Significance of the study ...................................................................................................................... 4
1.7Assumptions ......................................................................................................................................... 4
1.8Delimitations of the study ................................................................................................................... 4
1.9Limitations of the study ....................................................................................................................... 5
1.10Defination of terms ............................................................................................................................ 5
1.11Summary ............................................................................................................................................ 5
CHAPTER TWO .............................................................................................................................................. 6
Literature Review ...................................................................................................................................... 6
2.0Introduction ......................................................................................................................................... 6
2.1Analysis of cost containment strategies being implemented by health insurance firms. ................... 6
2.1.1Pay Cuts ............................................................................................................................................. 6

viii
2.1.2Restructuring .................................................................................................................................... 7
2.1.3Retrenchment ................................................................................................................................... 7
2.1.4Reducing Overtime spending ............................................................................................................ 8
2.2Factors influencing the successful implementation of cost containment strategies. ......................... 8
2.2.1Management commitment ............................................................................................................... 9
2.2.2Employee involvement ..................................................................................................................... 9
2.2.3Accountability and Monitoring of progress .................................................................................... 10
2.3The relationship between cost containment strategies and financial performance......................... 11
2.4Effective strategies that can be employed by health insurance firms to curb costs. ........................ 12
2.4.1Outsourcing non-core sections ....................................................................................................... 12
2.4.2Employing more interns .................................................................................................................. 13
2.4.3Energy Management ....................................................................................................................... 13
2.4.4Stationery Management ................................................................................................................. 13
2.4.5Reducing travelling and entertainment expenditure ..................................................................... 14
2.5Other factors affecting financial performance of insurance firms .................................................... 14
2.5.1Liquidity........................................................................................................................................... 14
2.5.2Consumer Demand ......................................................................................................................... 15
2.5.3Firm Size .......................................................................................................................................... 15
2.5.4Economic Conditions ...................................................................................................................... 15
2.6 Chapter Summary ............................................................................................................................. 16
CHAPTER THREE .......................................................................................................................................... 17
Research Methodology ........................................................................................................................... 17
3.0Introduction ....................................................................................................................................... 17
3.1Research Design ................................................................................................................................. 17
3.1.1Descriptive research design ............................................................................................................ 17
3.1.2Case Study research design ............................................................................................................ 18
3.2Study Population ................................................................................................................................ 18
3.3Sample Design and Procedures ......................................................................................................... 18
3.3.1Judgmental sampling ...................................................................................................................... 19
3.3.2Convinience Sampling ..................................................................................................................... 19
3.3.3Sample frame .................................................................................................................................. 19
ix
3.4Sources of Data .................................................................................................................................. 20
3.4.1Primary Data ................................................................................................................................... 20
3.5Data Collection Instruments .............................................................................................................. 20
3.5.1Interviews ....................................................................................................................................... 20
3.5.2Questionnaires ................................................................................................................................ 21
3.5.2.1The Likert Scale ............................................................................................................................ 21
3.6Validity and Reliability of Data ........................................................................................................... 22
3.7Data Presentation and analysis .......................................................................................................... 22
3.8Ethical Considerations........................................................................................................................ 22
3.9Chapter Summary .............................................................................................................................. 22
CHAPTER FOUR ........................................................................................................................................... 23
Data Presentation and Analysis .............................................................................................................. 23
4.0Introduction ....................................................................................................................................... 23
4.1Questionnaire Analysis ...................................................................................................................... 23
4.1.1Cost containment strategies being implemented by PSMAS. ........................................................ 24
4.1.2Factors influencing the successful implementation of cost containment strategies. .................... 26
4.1.3The relationship between cost containment strategies and financial performance of health
insurance firms........................................................................................................................................ 29
4.1.4Effective measures that can be implemented by health insurance firms to curb costs. ............... 30
4.1.5 Other factors that affect the financial performance of health insurance firms. ........................... 33
4.2Interview Analysis .............................................................................................................................. 36
4.2.1What cost containment strategies are being implemented by PSMAS? ........................................ 36
4.2.2What factors influence the successful implementation of cost containment strategies? ............. 37
4.2.3Does implementing cost containment strategies improve the financial performance of health
insurance firms? ...................................................................................................................................... 37
4.2.4 What more effective strategies can be implemented to curb costs in the organisation? ............ 38
4.2.5What other factors affect financial performance of insurance firms? ........................................... 38
4.3Chapter Summary .............................................................................................................................. 39
CHAPTER FIVE ............................................................................................................................................. 40
Summary, Conclusions and Recommendations ...................................................................................... 40
5.0Introduction ....................................................................................................................................... 40
5.1Executive Summary ............................................................................................................................ 40

x
5.2Summary of Major Findings ............................................................................................................... 41
5.3Conclusion .......................................................................................................................................... 42
5.4Recommendations ............................................................................................................................. 42
5.5Suggestion for further research ......................................................................................................... 43
REFERENCE LIST ...................................................................................................................................... 44

xi

xii
LIST OF TABLES
Table Description Page
1.1 PSMAS performance statistics for the years 2013-2015 2
3.1 Research sample 19
3.2 The Likert Scale 21
4.1 Questionnaire response rate 23
4.2 Responses on the cost containment strategies being implemented by
PSMAS
24
4.3 Responses on the factors influencing successful implementation of
cost containment strategies.
26
4.4 Responses on whether employing cost containment strategies
improves financial performance
29
4.5 Responses on effective cost containment strategies 30
4.6 Responses on other factors affecting financial performance 33
4.7 Interview Response rate 36
xiii
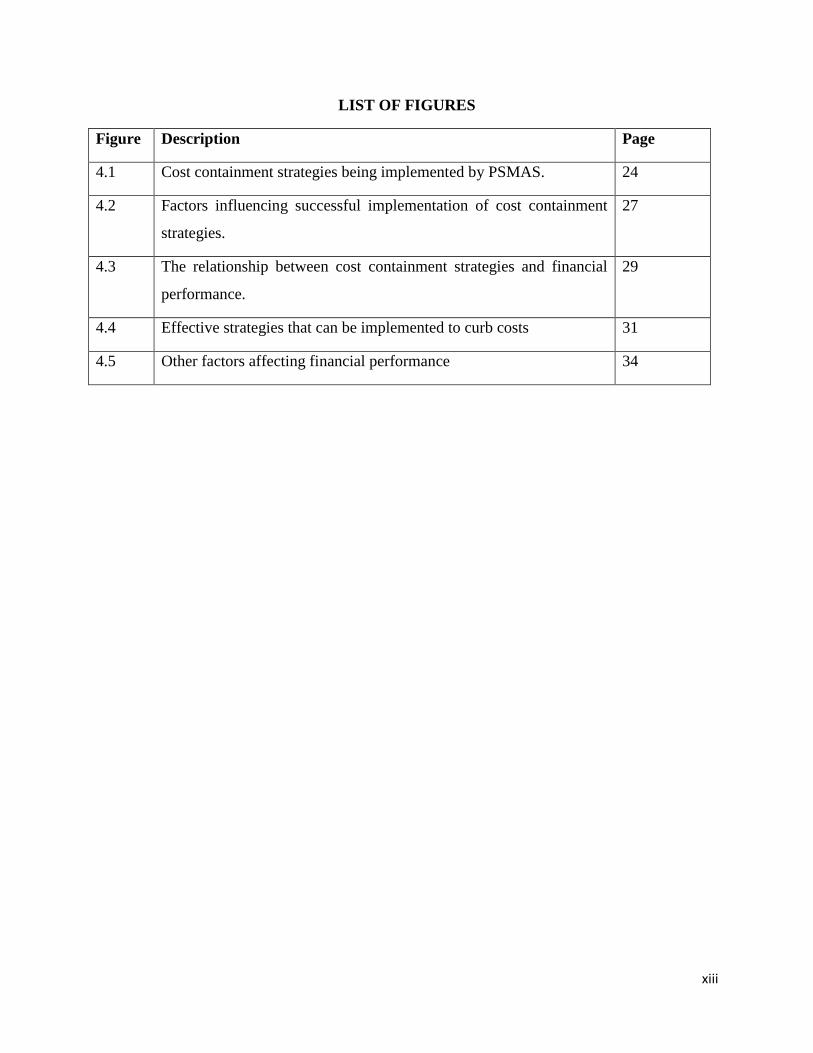
LIST OF FIGURES
Figure Description Page
4.1 Cost containment strategies being implemented by PSMAS. 24
4.2 Factors influencing successful implementation of cost containment
strategies.
27
4.3 The relationship between cost containment strategies and financial
performance.
29
4.4 Effective strategies that can be implemented to curb costs 31
4.5 Other factors affecting financial performance 34

xiv
LIST OF APPENDICES
Appendix Description Page
I Cover letter 52
Ii Request letter 53
Iii Questionnaire 54
Iv Interview guide 57

1
CHAPTER ONE
Introduction
1.0Introduction
This chapter is focused on highlighting the background leading to the study and it states the
problem under study. It also gives an insight into the objectives the study aimed to achieve
together with the sub-research questions. It proceeds to outline the significance the study has if
successfully conducted as well as the assumptions that the researcher made while conducting the
study. The chapter ends by highlighting limitations faced in the course of the research, definition
of key terms and finally summary of the chapter.
1.1Background of the study
PSMAS is a player in the health insurance industry operating with the aim of providing medical
aid cover to its members. Operating in over 10 branches across the country with over 800 000
members, the Society has a significantly large market share, thus making it the industrial leader.
The operations of the Society are such that members pay monthly subscriptions to the Society,
then they access medical services from service providers using a medical aid card. Service
providers then claim their fees from the Society. Over and above medical insurance, the Society
offers its members and other people healthcare services and facilities via its investment wing,
PSMI. Facilities provided include hospitals, clinics, laboratories, radiologies, rehabilitations,
dental clinics and optometries.
With the current economic crisis that has hit the country, PSMAS has been facing challenges that
pose a threat to its viability. Income has been dwindling significantly while costs have been
rocketing. The result has been a downward trend in profitability with the Society making losses
for three years in a row. Table1.1 below outlines the trend in detail.
2
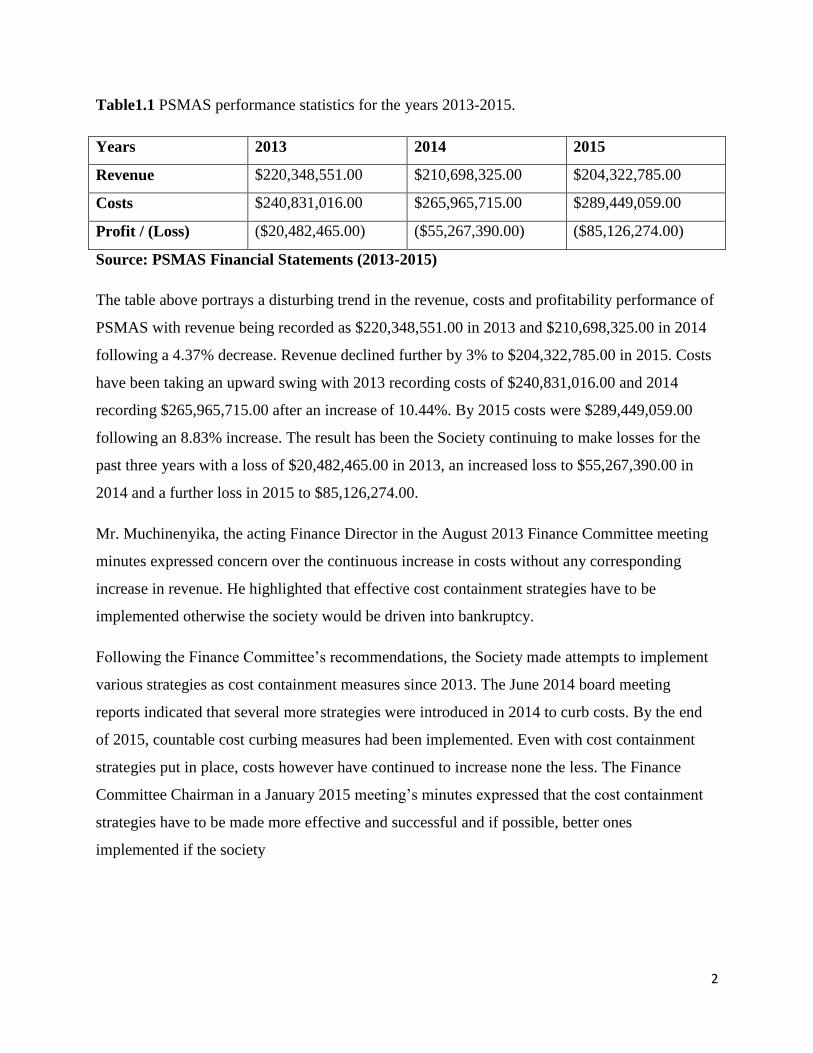
Table1.1 PSMAS performance statistics for the years 2013-2015.
Years 2013 2014 2015
Revenue $220,348,551.00 $210,698,325.00 $204,322,785.00
Costs $240,831,016.00 $265,965,715.00 $289,449,059.00
Profit / (Loss) ($20,482,465.00) ($55,267,390.00) ($85,126,274.00)
Source: PSMAS Financial Statements (2013-2015)
The table above portrays a disturbing trend in the revenue, costs and profitability performance of
PSMAS with revenue being recorded as $220,348,551.00 in 2013 and $210,698,325.00 in 2014
following a 4.37% decrease. Revenue declined further by 3% to $204,322,785.00 in 2015. Costs
have been taking an upward swing with 2013 recording costs of $240,831,016.00 and 2014
recording $265,965,715.00 after an increase of 10.44%. By 2015 costs were $289,449,059.00
following an 8.83% increase. The result has been the Society continuing to make losses for the
past three years with a loss of $20,482,465.00 in 2013, an increased loss to $55,267,390.00 in
2014 and a further loss in 2015 to $85,126,274.00.
Mr. Muchinenyika, the acting Finance Director in the August 2013 Finance Committee meeting
minutes expressed concern over the continuous increase in costs without any corresponding
increase in revenue. He highlighted that effective cost containment strategies have to be
implemented otherwise the society would be driven into bankruptcy.
Following the Finance Committee’s recommendations, the Society made attempts to implement
various strategies as cost containment measures since 2013. The June 2014 board meeting
reports indicated that several more strategies were introduced in 2014 to curb costs. By the end
of 2015, countable cost curbing measures had been implemented. Even with cost containment
strategies put in place, costs however have continued to increase none the less. The Finance
Committee Chairman in a January 2015 meeting’s minutes expressed that the cost containment
strategies have to be made more effective and successful and if possible, better ones
implemented if the society

3
1.2Statement of the problem
Due to various economic challenges, PSMAS has been facing a trend of decreasing revenue,
increasing costs and continuous losses. This has been a huge challenge to its viability. Efforts
have been made to try and contain the costs but there has been no change in the trend. The
research project aims to evaluate effective strategies that can be employed to contain the
increasing costs and how they impact on the financial performance of firms.
1.3 Main Research Question
The impact of cost containment strategies on the financial performance of health insurance firms.
1.4Objectives
The research aimed:
To identify cost containment strategies being implemented by PSMAS.
To determine factors influencing the successful implementation of cost containment
strategies in health insurance firms.
To ascertain the relationship between cost containment strategies implementation and
financial performance of firms.
To establish more effective cost containment strategies that can be implemented by health
insurance firms.
To determine other factors that affect financial performance of health insurance firms.
1.5Research Questions
What cost containment strategies are being implemented by PSMAS?
What factors influence the successful implementation of cost containment strategies in
health insurance firms?
Does implementing cost containment strategies improve financial performance of firms?
What more effective strategies can be implemented by health insurance firms to curb
costs?
What other factors affect the financial performance of insurance firms?

4
1.6Significance of the study
The research is significant to:
The researcher
It is a part fulfillment of the requirements of the Bachelor of Commerce Accounting (Honours)
Degree in which the researcher is currently studying for.
To Midlands State University
The research adds on to the repository material of the Midlands State University’s library and
also adds up to the literature for other researchers who would like to make related studies.
To the organisation
A study of this nature is relevant in bringing into the spotlight the measures that the firm can put
in place to contain increasing costs that hinder the profitability of the company. It is also helpful
by establishing the likely impact of these measures on the financial performance of the firm so
that management can take an informed decision when implementing on these measures. It also
highlights factors management should take into account to make the implementation of these
strategies successful.
1.7Assumptions
The research is based on the assumptions that:
There will be no major changes in the nature of operations of PSMAS in the
unforeseeable future.
The respondents were knowledgeable, capable and willing to participate.
Data collected from these respondents is free from any errors, misstatements and bias.
1.8Delimitations of the study
The research was centered on one firm in the insurance industry.
The research was limited to only 3 years of the entity’s life span, 2013-2015.
Key respondents were employees of PSMAS.

5
1.9Limitations of the study
There was limited time to conduct a thorough research and the researcher had to work
over weekends and outside normal working hours.
There were monetary constraints to conduct a thorough research and the researcher
sometimes had to rely on emails to minimize on transport costs.
Some of the respondent feared for the confidentiality of the information being collected
and the researcher had to assure them the information was safe and entirely for academic
purposes.
1.10Defination of terms
Costs- expenses associated with the running of day to day business of the entity as well
as putting a good or service into a sellable condition for clients.
Cost containment strategies-strategies meant to control or maintain expenses level
without long term damaging the entity.
Financial performance- the expression, in monetary terms, of the degree to which an
entity’s financial objectives are being met, over a specified period of time and usually in
the form of profits or losses.
Acronyms
PSMAS – Premier Service Medical Aid Society
PSMI- Premier Service Medical Investment
1.11Summary
The focus of this chapter was to give an introduction of the research. It started off by giving a
background into the problem leading to the research as well as stating the problem area. It went
further into stating the objectives of the study and the significance such a research has to the
researcher, institute and to PSMAS as the case study. The chapter ended by highlighting the
limitations that may arise in the course of the research. The following chapter reviews literature
by other scholars and authors on the problem under study.

6
CHAPTER TWO
Literature Review
2.0Introduction
The chapter reviews literature from other scholars and authors that relate to the problem under
study. It highlights the findings and conclusions drawn by other authors in prior studies that
relate to this current study. The objectives of this research are reviewed in this chapter in relation
to the prior works of other authors.
Cost Containment Strategies
Metzger (2009) defined cost containment strategies as measures of controlling expenses level of
a business by preventing unnecessary spending or by cutting down or reducing major cost
drivers. Feder (2010) further described cost containment strategies as measures employed by
management to keep expenses down to only necessary costs in an attempt to improve the
financial performance of a firm but without creating any long term damage to the business.
2.1Analysis of cost containment strategies being implemented by health insurance firms.
Given the current economic challenges Zimbabwe is facing, curbing costs is one of the available
options for companies to remain afloat (Taga et al, 2015). Health insurance firms operating in
Zimbabwe have also resorted to containing costs as measures to stay viable. As at date, most
firms have resorted to cutting pays, retrenching, reducing overtime spending, and restructuring as
means to contain costs, (Bususu, 2014).
2.1.1Pay Cuts
Kube et al (2011) defined pay cuts as the intentional reduction of wages, salaries and
employment benefits usually done as an attempt to curb costs. Pay cuts can be done in four ways,
according to Potter (2016). She clarified that pay cuts can be done by cutting salaries, cutting
employment benefits, cutting bonuses and reducing working hours. Preston (2016) emphasized
that cutting pays is one of the most effective ways of curbing costs since in most companies the
wage bill constitutes a greater proportion of costs. The cost saving realized from cutting cost can
go long way in improving profitability, Smith (2012) agreed. Competitiveness is also likely to
increase and improve once pays are cut since unit labour costs will be lower, Haliassos (2012)
asserted following a study he conducted on firms in Frankfurt.
7
Truman et al (2008) however argued that the costs of pay cuts may end up being higher than the
savings associated with it. Smith (2012) in her test of the “morale theory” outlined that
companies that enforce pay cuts may end up suffering from poor morale, lower productivity,
poor customer relations and eventually decreases in sales. This will thoroughly harm a
company’s financial performance. In a study conducted at the Zurich University library, Kube et
al (2011) asserted that output decreased by 20% once a pay cut was enforced on a team of
librarians, while decreased output imply decreased revenue.
2.1.2Restructuring
Restructuring is described by Omni (2012) as a process of changing a firm’s operating structure
to improve economic viability. Examples include shutting down or selling divisions, mergers,
downsizing and delayering, according to Edmunds (2016) with delayering being the commonly
form of restructuring being employed by insurance firms. Delayering, according to Thakur
(2011), involves destruction of tall organizational structures with layers of ineffective highly
paid managers into flat structures. Delayering by removing the number of managers in the
structure is a form of demotion to the managers concerned (Verheyen and Guerry, 2014). They
outlined that such a demotion involves a decrease in the job authority, level, salary and benefits.
Deschacht (2011) explained that the decrease in salary and fringe benefits can be a huge cost
saving to businesses making it a desirable cost containment strategy. Delayering can also
improve the efficiency and flexibility of the business to adapt to external factors, (Nayab, 2012).
However, such a demotion can result in decreased motivation amongst the concerned employees,
Borghans et al (2011) explained. They emphasized that once motivation is low, productivity,
efficiency and quality of work will decrease as well and this can have devastating effects on the
firm’s financial performance.
2.1.3Retrenchment
Retrenchment is defined as the downsizing of a firm’s payroll by employing forced lay-offs of
the staff, (Peetz, 2015). In the short run, this strategy can be very effective since significant costs
can be cut by dismissal and profitability may improve, according to Redman and Wilkinson
(2009). Sarala (2013) emphasized that when retrenchment is employed, there is likely to be
increased efficiency, effectiveness, competitiveness, better communication and less bureaucracy
in the business which in turn will result in better performance In the long run however, such a

8
move may be very costly, Ochieno (2013) noted. He argued that in as much as layoffs may
reduce payroll expenses, it will also come along with retrenchment costs such as the payment of
severance pays and retrenchment packages. Sanchez (2011) also argued that retrenching may
result in loss of morale to the survivors which in turn will result in decreased productivity and
lower quality of work, thus lower revenue.
2.1.4Reducing Overtime spending
Overtime spending arises when an employee receives compensation for working beyond the
normal working hours of the business, (Oaxaca, 2014). Mc Querrey (2013) asserted that
overtime spending usually contributes a considerable percentage to a business’ operating
expenses and if not properly managed can be a very costly liability. It can be more devastating
when overtime costs start to match the annual salary costs or exceed as in some of the firms
studied by Napoli (2012) during the course of his research. Thus reducing overtime spending in
such cases can do justice to the cost structures of the firms. According to the US Department of
Labor (2016), eliminating or reducing overtime expenses helps in cutting a huge part of labor
costs. Reducing overtime spending is an efficient way of cost containment since it has little
effects on the workforce (Astron Solutions, 2013). However, if the reduction is not done properly
it can result in a lot of pressure on the workforce to finish the work load within the stipulated
working hours and it can be stressful and frustrating on their part, according to Malinconico
(2016). This will compromise quality of the work.
2.2Factors influencing the successful implementation of cost containment strategies.
A lot of companies have failed to deliver desirable goals in as much cost containment strategies
are concerned (Dolan et al, 2010). Strategies to curb cost were implemented but no sustainable
decrease in costs was recognized. Deloitte (2016) attributed this to the absence of success factors
that should be present for cost containment strategies to be effective. Frey et al (2014) asserted
that for cost containment measures to be implemented successfully there should be commitment
from management and top executives, involvement of employees, accountability and monitoring
of progress. Karim et al (2010) further emphasized that employee participation and support of
top management is very vital in ensuring the success of cost curbing measures.
9
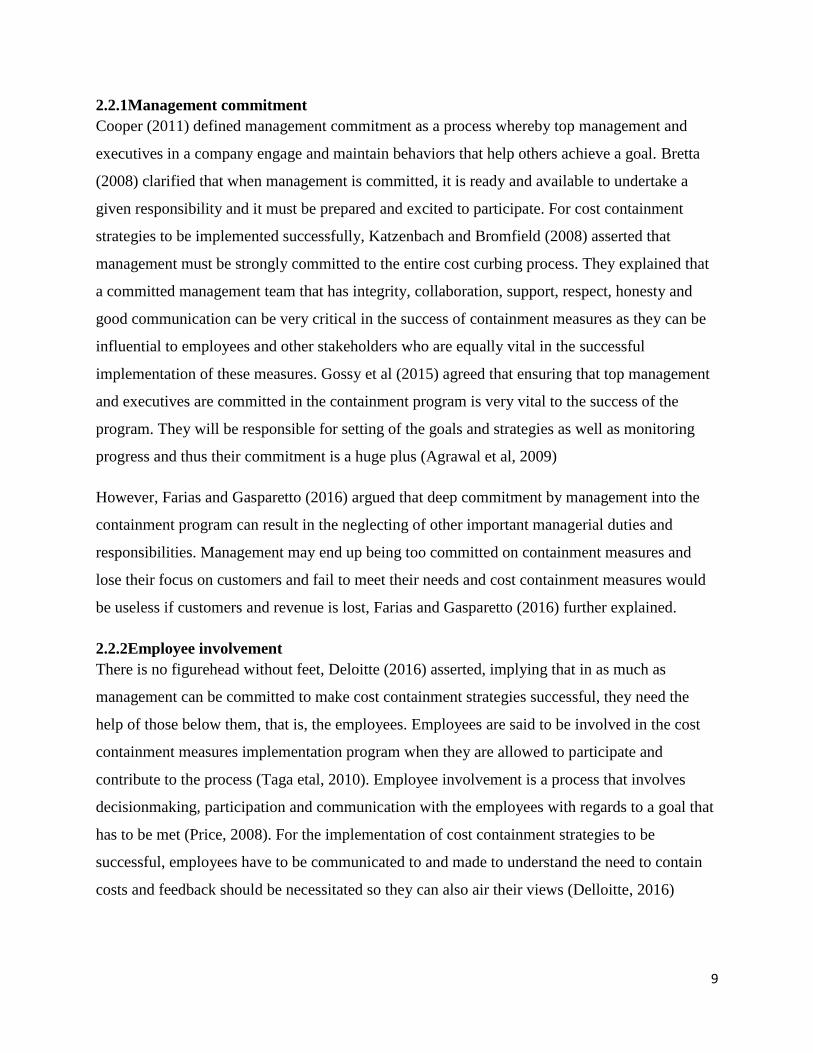
2.2.1Management commitment
Cooper (2011) defined management commitment as a process whereby top management and
executives in a company engage and maintain behaviors that help others achieve a goal. Bretta
(2008) clarified that when management is committed, it is ready and available to undertake a
given responsibility and it must be prepared and excited to participate. For cost containment
strategies to be implemented successfully, Katzenbach and Bromfield (2008) asserted that
management must be strongly committed to the entire cost curbing process. They explained that
a committed management team that has integrity, collaboration, support, respect, honesty and
good communication can be very critical in the success of containment measures as they can be
influential to employees and other stakeholders who are equally vital in the successful
implementation of these measures. Gossy et al (2015) agreed that ensuring that top management
and executives are committed in the containment program is very vital to the success of the
program. They will be responsible for setting of the goals and strategies as well as monitoring
progress and thus their commitment is a huge plus (Agrawal et al, 2009)
However, Farias and Gasparetto (2016) argued that deep commitment by management into the
containment program can result in the neglecting of other important managerial duties and
responsibilities. Management may end up being too committed on containment measures and
lose their focus on customers and fail to meet their needs and cost containment measures would
be useless if customers and revenue is lost, Farias and Gasparetto (2016) further explained.
2.2.2Employee involvement
There is no figurehead without feet, Deloitte (2016) asserted, implying that in as much as
management can be committed to make cost containment strategies successful, they need the
help of those below them, that is, the employees. Employees are said to be involved in the cost
containment measures implementation program when they are allowed to participate and
contribute to the process (Taga etal, 2010). Employee involvement is a process that involves
decisionmaking, participation and communication with the employees with regards to a goal that
has to be met (Price, 2008). For the implementation of cost containment strategies to be
successful, employees have to be communicated to and made to understand the need to contain
costs and feedback should be necessitated so they can also air their views (Delloitte, 2016)

10
Frey et al (2014) explained that such kind of involvement ensures acceptance for the goals to be
met and it creates the desire to contribute to the cost containment efforts within the employees.
According to Himme (2012), involving employees in the entire process will ensure that they are
not resistant to some changes that are brought about by implementing some cost containment
measures. After all, employees are on the ground and they are the labour for implementing, thus
their involvement will mean they are going in the right and desired direction when implementing
the cost containment measures, Kerr and Pauwels (2014) explained.
Gandolfi (2008) however argued that even if employees are involved in the implementation
process, if the measure to be implemented impacts them negatively for example salary cuts, they
will not be willing to participate positively in the cost containment strategies implementation.
Bususu (2014) emphasized that if the company’s employees’ motivation levels is generally low,
employee involvement is unlikely to bring much results when implementing cost containment
strategies.
2.2.3Accountability and Monitoring of progress
Accountability is the act of assuming responsibility for successfully completing a task and being
able to explain in case of failure or any deviations from the target, according to Cristofari et al
(2010). For the implementation of cost containment strategies to be successful, Goldsmith and
Stitt (2010) outlined that people within the workforce should be selected to manage the
implementation process and be accountable for its success. Agrawal et al (2009) emphasized that
these people should possess enough authority, skills and knowledge for them to be effective at
implementing the cost curbing measures. They should be answerable for every move in the
implementation process and Cristofari et al (2010) explained that this need to be answerable
creates a reason to be effective and efficient. For implementation of cost curbing measures to be
successful, Deloitte (2016) argued that progress should constantly be monitored. Monitoring
progress works hand in hand with enforcing accountability. The people accountable for the
implementation process should constantly track the progress of the strategies to review what is
working well and what is not and making necessary corrections to the strategies to ensure the
target is met (Frey et al, 2014).

11
2.3The relationship between cost containment strategies and financial performance
According to Bhunia et al (2011), financial performance is defined as a measure of how well a
firm is utilising its resources to meet its financial objectives over a specified period of time. The
financial performance can be measured by assessing the profitability, financial position,
cashflow position as well as by assessing financial ratios.
In their study of the nature of relationship that exists between cost containment measures and
profitability in over 40 firms, Olugawagbemiga et al (2014) ascertained that, a positive
significant relationship exists between the two. Their view is supported by Gichuki (2014) who
noted that in firms where cost containment measures were implemented, profitability and
cashflow positions improved significantly. Namu et al (2014) share the same view after their
study on 3 firms in Kenya. They concluded that a very strong positive relationship exists
between cost containment strategies and firms’ financial performance. Their research indicated
that where cost curbing measures were implemented, expenses declined significantly triggering
an increase in profitability and returns.
Strickland (2012) however argued that the relationship between the two is strangely negative.
This is because cost curbing can greatly affect productivity and quality of the firm’s service. An
example is when a firm decides to layoff key employees as a cost containment measure. This
will put pressure on the remaining workforce to meet targets and thus productivity and quality
may be compromised. The result will be dissatisfied clients, lower revenue and eventually lower
profits. Doraisamy and Lewis (2009) also shared the view that cost containment measures
usually impact negatively on customers and results in loss of revenue and consequently lower
profits.
The PA Consulting Group report (2012) also argued that cost curbing measures can end up
impacting negatively on the financial performance of firms. The report highlighted that measures
such as retrenchments and early retirements to curb payroll costs may improve profitability in the
short run but in the long run may cause negative cashflows and losses after having to pay heavy
retrenchment and severance packages as well as layoff costs.
Bender (2015) emphasized that the relationship between cost containment strategies and
financial performance is quite negative in the long run. This is because of the increased risks that
12
come along with employing cost curbing measures. Due to the tightening up of expenses,
reduction of bonuses and limiting of pay rises, workforce may become too demotivated and
dissatisfied, argued Bender (2015). This poses a risk on productivity, effectiveness, efficiency
and quality and more often than not, a dissatisfied workforce increases the risk of fraud while
employees seek to replace their monetary bonuses. The result will be poor financial performance
in the long run.
2.4Effective strategies that can be employed by health insurance firms to curb costs.
A variety of cost containment strategies have been put forward by different scholars that are
deemed to be effective without long term damaging the firm implementing them. Msunduzi
Municipality (2013) implemented several cost containment strategies that can also be applicable
to health insurance firms. These include energy management, stationery management, and
reduction of travelling and entertainment expenses. Prow et al (2012) suggested that outsourcing
unrelated business functions and employing more interns can be effective ways of curbing costs.
2.4.1Outsourcing non-core sections
Heric and Singh (2010) asserted that outsourcing functions that are not related to the main
business line like security, marketing and cleaning can be a very effective measure of cost
containing. Anderson (2011) defined outsourcing as the procurement of functions or services
from an outside agent that a firm could otherwise manage on its own in an attempt to save costs.
The major cost saving arises from the fact that the service will have to be procured at cost lower
than what the firm would have incurred (Corbett, 2014). Since companies will not have to deal
with the burden of providing staff benefits and health and life insurance of the outsourced
employees, this can be huge cost saving measure (Stanley, 2015). Rampton (2012) emphasized
that a company can save up to approximately sixty percent in costs with an outsourced
individual. The challenge however is on the fact that before outsourcing can be implemented;
staff in the functions to be outsourced have to be laid off and this can earn huge layoff costs,
according to Anderson (2011). A firm may also lose control over the quality of services once
outsourcing is implemented and this is a major disadvantage according to Heric and Singh
(2010).
13
2.4.2Employing more interns
The Sutton Trust (2014) described an intern as a student from college or university on work
related learning for a specified period of time, receiving practical knowledge of the career under
study. Mgaya and Mbekomize (2014) explained that this is a huge form of cost saving that a firm
can implement. For one thing, interns are hardly paid, in some instances they are paid allowances
only and in other cases they are given a mini salary which is a huge saving on payroll costs,
according to Lyons (2013). The fact that interns do not require to be provided with employee
benefits packages, bonuses, health and life insurance means that employing more of them will
get the job done at very little costs, according to the Michigan State University research (2012).
Moreover, it is a great Corporate Social Responsibility move, argued Mgaya and Mbekomize
(2014).
2.4.3Energy Management
Energy consumption, if not properly managed can contribute a huge percentage to costs,
according to Cigarran (2012). Based on his research on a local university, energy costs can be cut
by up to $2 million per year if an effective energy management system is put into place. Metcalf
(2012) defined energy management as the process of conserving, monitoring and controlling
energy reserves in an attempt to save costs. Lorenz (2009) explained that measures to manage
energy include installing a solar system to cut on electricity costs, installing motion lights for
night lighting and encouraging the switching off of energy devices not in use. Energy
management is a great cost curbing method because it requires no or little capital expenditure to
implement (Kramer et al, 2009).
2.4.4Stationery Management
Stationery wastage may seem like a very minor cost but in a big organisation the aggregate costs
can amount to thousands, according to Ingram (2009). He argued that effective stationery
management has to be implemented to curb stationery wastage costs. Rationing stationery
supplies, recycling paper and printing on both sides of the paper are all way in which stationery
can be managed to curb costs, according to the Msunduzi Municipality (2013). Going digital is
also another way to manage stationery costs (Sarantis, 2012). She asserted that by going digital, a
firm does away with circulating letters, memos, agendas, reminders and notices in printed form
and uses electronic media instead. McCool (2008) emphasized following a study on 500 firms
that millions can be saved if firms commit to a disciplined stationery management system.

14
2.4.5Reducing travelling and entertainment expenditure
Bruers et al (2011) explained that travelling expenditure are all those costs incurred when an
employee takes a business trip for meetings, seminars or even to meet clients. The costs include
fuel reimbursements, toll gate fees, meal and accommodation expenses as well as travel and
subsistence allowances (Msunduzi Municipality, 2013). Such costs can be best curbed by
banning unnecessary travelling, negotiating for discounts in air travelling and accommodation
and where possible to use cheaper means of transportation, according to Greene (2013).
Lowering the travel and subsistence allowance rate can be quite an effective way to curb
travelling costs since it discourages employees to make unnecessary business trips (Parekh,
2009). Entertainment costs which include throwing employee celebration parties and providing
food during meetings can be contained by providing lighter, cheaper snacks instead, according to
Matt (2012).
2.5Other factors affecting financial performance of insurance firms
Other than cost containment strategies, Dermirhan and Anwar (2014) argued that there are other
factors affecting financial performance in health insurance firms like liquidity and consumer
demand. Xou and Banchuenvijit (2013) also emphasized that general economic conditions and
firm size are equally important factors that affect financial performance.
2.5.1Liquidity
Garanina and Petrova (2015) defined liquidity as the extent to which a firm has cash, cash
equivalents and other current assets to meet short term obligations. Banafa et al (2015) explained
that the more liquid a firm is, the better it performs financially. The relationship between
liquidity and financial performance is significantly positive, emphasized Almajali (2012). This
view is supported by Vieira (2010) who concluded following his research of 5 insurance firms,
the higher the liquidity the higher the profitability would be for the firms. Garanina and Petrova
(2015) actually suggested that insurance firms should increase current assets and lower current
liabilities in order to perform better financially. Eljelly (2014) however argued that there is an
inverse relationship between financial performance and liquidity. Raneman and Wasr (2011) also
supported this view and argued that in their research, where liquidity was high, profitability
tended to be low.

15
2.5.2Consumer Demand
Chintagunta and Nair (2011) defined consumer demand as a measure of consumers’ desire,
interest and willingness to purchase a firm’s products and or services. PWC (2012) emphasized
that recognizing consumers’ interests and enforcing their demand for such can go a long way in
increasing sales and revenue for a firm. The higher the demand, the higher the revenue and
profitability, explained Hagel 111 et al (2011). Unilever Annual Report (2014) highlighted that
weak consumer demand contributed a lot to their decrease in sales. The theory simply being that
when demand is high, consumers buy more and this results in higher sales and higher profits if
costs are being managed well, according to Chintagunta and Nair (2011). In short, higher
consumer demand results in better financial performance (Dermirhan and Anwar, 2014).
2.5.3Firm Size
This is the size of a firm relative to the entire industry, according to Xou and Banchuenvijit
(2013). Measures of firm size include, total assets, market share, total sales and even the number
of employees, according to Beck et al (2015). Lee (2009) following his study of 7000 US
insurance firms explained that bigger firms naturally perform better financially because they can
harvest from the benefits of economies of scale. Larger firms can earn discounts from bulk
buying, can access larger bank loans, have superior asset resources and can employ better skilled
staff and this can significantly boost their performance financially (Pervan and Visiic, 2012).
Generally, bigger firms perform financially better, according to Kioko (2013). However Niresh
and Velnampy (2014) argued that with large firms, performance may improve up to a certain
point but will start declining due to the effects of diseconomies of scale.
2.5.4Economic Conditions
These are the state of economy of a region, particularly a country over a specified period of time
in relation to variables like inflation levels, unemployment rates, interest rate and even GDP,
according to Erkens et al (2012). Yap et al (2014) explained that when the state of the economy
is generally weak, insurance firms, like the rest of the country perform very poorly financially.
High inflation levels and high unemployment rate results in lower demand for insurance services
and this in turn leads to lower sales and lower profitability (Jones and Henshen, 2014). When the
economy is poor, there is a reduction of the availability of funding and this could lead most firms
into insolvency, explained Erkens et al (2012). Poor state of economy makes insurance firms to
perform poorly, according to Dorofiti and Jakubik (2014), and the reverse also applies. In the

16
period of study, the Zimbabwean economy was characterized by declining growth rates, debt
distress, poor export and import performance, negative inflation as well as limited direct foreign
investment (Bususu, 2014).
2.6 Chapter Summary
The chapter looked at other scholars’ views on the factors influencing the successful
implementation of financial performance of insurance firms, the relationship between financial
performance and cost containment strategies as well as effective cost curbing measures that
insurance firms can implement. The chapter ended by giving an insight on other factors that
influence financial performance of health insurance firms. The following chapter will then look
at the methodology used in the collection of data for the research.

17
CHAPTER THREE
Research Methodology
3.0Introduction
This chapter provides information on the research design, approaches and techniques used by the
researcher in the collection of data to meet the objectives of the study. It also encompasses a
discussion on the sources of the data used as well as details on the study population selected for
investigation. The sample sizes and sampling procedures used in the data collection are also
discussed in this chapter.
3.1Research Design
Kolbaek (2014) described a research design as the systematic approaches, procedures and plans
developed by the researcher to study a specific problem. It is a program designed to guide the
research in observing, collecting, analyzing and interpreting data meant to answer the research
objectives, according to Creswell (2011). Wyk (2012) summarised that a research design
articulates what data is essential, what techniques can be used for collection and analysis of the
data and how all this will help in answering the research objectives.
Research designs can be categorized into three broad classes namely the quantitative, qualitative
and mixed approaches (Green and Carmone, 2011). The quantitative approach is obtained from
the number of responses attained from questionnaires whereas the qualitative approach is
interpretive in nature and seeks to obtain explanations of study questions mainly through
interviews. The mixed approach as suggested by the name is a mixture of the afore mentioned
approaches. The choice of a research design lies upon the cross between the need to obtain
relevant reliable data, feasibility, ethics, availability of respondents, money and time (Church,
2013). In this study, the researcher used the case study design and descriptive research design
which are mixed approaches.
3.1.1Descriptive research design
A descriptive research design is defined by Wyk (2012) as a method designed to portray and
outline respondents in an accurate way. In short, a descriptive research is all about describing the
respondents of a study. It can be conducted through three ways according to Burns and Groove
(2012), that is, through observation, case study or survey. Observation is recording and viewing
of respondents, while case study is all about obtaining an in-depth study on an individual or

18
groups. Surveys on the other hand are all about having discussions or interviews with an
individual or groups of individuals on a particular topic.
3.1.2Case Study research design
Yin (2010) defined a case study as an in-depth examination of a single organisation to establish
its connection with the research phenomenon. It provides a real life analysis of the organization’s
behavioral trends through the respondents’ opinions and perspectives, according to Rose et al
(2015). A case study research design is considerably cheap as it can be conducted by a single
researcher and it only involves investigation of a single organisation, (Bryman, 2012). The
responses obtained via a case study design are also considered to be more realistic and detailed.
It is however difficult to assume that the results obtained via a case study design are
representative of the entire population because they were based on only one organisation, (Yin,
2010).
3.2Study Population
Saunders (2010) defined a study population as a universal set of elements with one or more
common characteristics that a researcher is interested in, in the course of the research. Bryman
(2012) further outlined that the population is a target group from which a researcher can sample
individuals in which the researcher will be interested in gaining data and drawing conclusions.
For the purpose of this study, the population considered was the employees and management of
PSMAS specifically from the finance department, internal audit and the finance committee.
3.3Sample Design and Procedures
Due to budget and time constraints, it was impossible for the research to be based upon the entire
population and thus a sample had to be selected. According to Scott and Morrison (2013), a
sample can be defined as a small proportion of a larger group drawn for observation and
analysis. Burns and Groove (2012) further described a sampling as the selection from a large
population, of a subset of individuals to represent the population. Sampling can be done either
using probability sampling methods or non-probability ones, according to Good and Hatt (2013).
Probability sampling is a method whereby the probability of any population unit being drawn is
unknown. In this study, non-probability sampling techniques were used namely judgmental and
convenience sampling.

19
3.3.1Judgmental sampling
This is a rather purposive method of sampling which involves selecting representatives of a
population based on the researcher’s personal and professional judgment (Green and Carmone,
2011). It is usually applicable in situations where the respondents are already known and the
selection is deliberate. In this research, the researcher used academic and professional
qualifications, experience, post and tittle in the organisation to judge which individuals to
include in the sample.
3.3.2Convinience Sampling
This is a method that qualifies whoever is ready and available to respond to the questionnaires
and interviews to be included into the sample frame. It is quite applicable with a busy target
population where some individuals are not always available for questioning.
3.3.3Sample frame
The research sample was selected using the judgmental and convenience non-probability
sampling methods. The management and employees of the internal audit department, finance
department and finance committee of PSMAS were the target population from which the sample
was drawn. The tables below shows details of the sample used for the research:
Table 3.1: Research Sample
Sample Elements Population Sample size
for
questionnaires
Sampled
population
%
Sample
size for
interviews
Sampled
population
%
Management 6 3 50% 3 50%
Finance Dept. staff 20 18 90% - 0%
Internal Audit staff 8 6 75% - 0%
Finance Committee 8 5 63% 2 25%
Total 42 32 76% 5 12%
Justification of the sampling
The sample was drawn from the employees and management of the finance and internal audit
departments and from members of the finance committee because these people are at the ground

20
for the recommendation, implementation and reviewing of the cost containment strategies in the
organisation and thus they are knowledgeable subjects for the research. Judgmental and
convenience sampling was used because some respondents were deemed to be too busy or
unwilling to participate and the researcher had to judge which individuals were convenient to
involve in the study.
3.4Sources of Data
3.4.1Primary Data
This is data collected from the sampled population on the research question under review
(Church, 2013). It provides current, accurate, valid and specific information from the selected
respondents. According to Burns and Groove (2012), primary data seeks to refine and update
existent literature on the research under question and is collected for the first time from the
sampled population. This kind of data is collected by means of questionnaires or interviews and
it has an advantage in that it provides specific data that answers the research questions. Primary
data, however, is very tiresome to access as respondents may be too busy or unwilling to
cooperate.
3.5Data Collection Instruments
These are tools used by a researcher to obtain valid reliable information that can answer the
research question. The tools used for this study were the questionnaires and interviews
techniques.
3.5.1Interviews
An interview is an exchange of views or a discussion between the researcher and the respondent
with the aim of seeking the respondent’s views on the subject of the research, according to
Saunders (2010). These can done on a face to face basis or via the telephone in situations where
the respondent is too busy to approve an appointment. Interviews allow the researcher to
establish rapport with the respondent and are thus able to read the respondent’s non-verbal cues
and can therefore judge on the reliability of the answers being provided (Good and Hatt, 2013).
The respondent also has room to ask questions and clarity where he/she did not understand the
question and this enhances the validity of the answers to be provided. Most importantly, the
researcher is able to ask or probe further follow up questions in an interview scenario and thus
more complete information is gained. There is however a loophole in interviewing in that most

21
researchers have a tendency to seek answers that back up their preconceived notions and this can
bias the whole research (Church, 2013). There has also been a noted tendency of respondents
being too eager to please the researcher in most interview situations and this can immensely
distort the results. In this study, the researcher conducted interviews with the sampled
management and members of the Finance Committee.
3.5.2Questionnaires
This is a paper and pen instrument that allows the respondent to complete a set of sequential
questions with specific indications on how each question should be answered, according to Scott
and Morrison (2013). Questionnaires are a very familiar technique with respondents and they are
user friendly especially when they are closed ended (Yin, 2010). They are very convenient to the
researcher since they can be distributed via e-mail prompting savings on time and money on the
researcher’s part. Moreover, bias is eliminated between the researcher and respondent when
questionnaires are used as the respondent does not have to face the researcher when completing
the questionnaire. That anonymity factor enhances the reliability of the questionnaire results.
Above all, questionnaires provide a written record of the research for further references at the
analysis stage. Questionnaires however, are rather impersonal and sometimes respondents may
be confused by the wording or jargon making the results biased. In this research, the researcher
also used questionnaires to collect data and they were distributed via emails and physically to the
sample population. The questionnaires were structured in the form of closed ended questions
using the Likert Scale. Closed ended questions are questions whereby the respondent has to
select from a set of possible answers.
3.5.2.1The Likert Scale
This is an attitude measure tool that shows the degree of a respondent’s opinion towards a given
question, according to Yin (2010). It also seeks to quantify qualitative data to make it more
compatible for statistical analysis. The scale ranges from strongly agree to strongly disagree or
from point 1 to point 5 as shown in the table below:
Table3.2: The Likert Scale
Strongly Agree Agree Not sure Disagree Strongly Disagree
5 4 3 2 1

22
3.6Validity and Reliability of Data
Data validity is defined by Guilford (2013) as the measure of the extent to which the data
collected is capable of addressing the problem in which it was intended to answer. When data is
valid, it is accurate, exact and precise to the research under question. Data validity in this
research was ensured by making sure that the questions asked in the instruments are relevant to
the research objectives. It was also ensured by the help and approval of the academic supervisor
that the questions to be asked were relevant to the research study. Data reliability is a measure of
the extent of consistency with an instrument that measures an attribute (Church, 2013). Reliable
data can be depended upon to be stable and accurate.
3.7Data Presentation and analysis
The data results collected from questionnaires and interviews would be meaningless if not
presented in a usable format that allows for interpretation and analysis (Guilford, 2013).
Converting the data into useable format involved organizing it then using tables, graphs and
charts to present it. This allowed the user to better understand the data and be able to deduce
meanings and arrive at conclusions.
3.8Ethical Considerations
The research was carried out on an ethical basis. The data collected was merely for academic
purposes only and high levels of confidentiality were maintained. None of the respondents were
coerced to respond. Their participation in the research was entirely free will. Thus, ethical
considerations were not violated by the research process.
3.9Chapter Summary
This chapter dealt with the techniques used to collect data from primary and secondary data
sources, discussing the merits and demerits of each technique. It also dealt with the analysis of
the population under study and how the individuals were drawn from the population to form the
study sample. The chapter ended by reviewing the validity and reliability of the data collected
and reviewing how the research was based on ethical considerations. The next chapter focuses on
the presentation and analysis of the data collected using the methodology prescribed in this
chapter.
23
CHAPTER FOUR
Data Presentation and Analysis
4.0Introduction
This chapter focuses on the presentation and analysis of the primary data collected using the
methods prescribed in the previous chapter. The use of graphs, charts and tables is incorporated
in this chapter to turn the raw data collected into meaningful information that allows for a
conclusion to be drawn in relation to the research objectives.
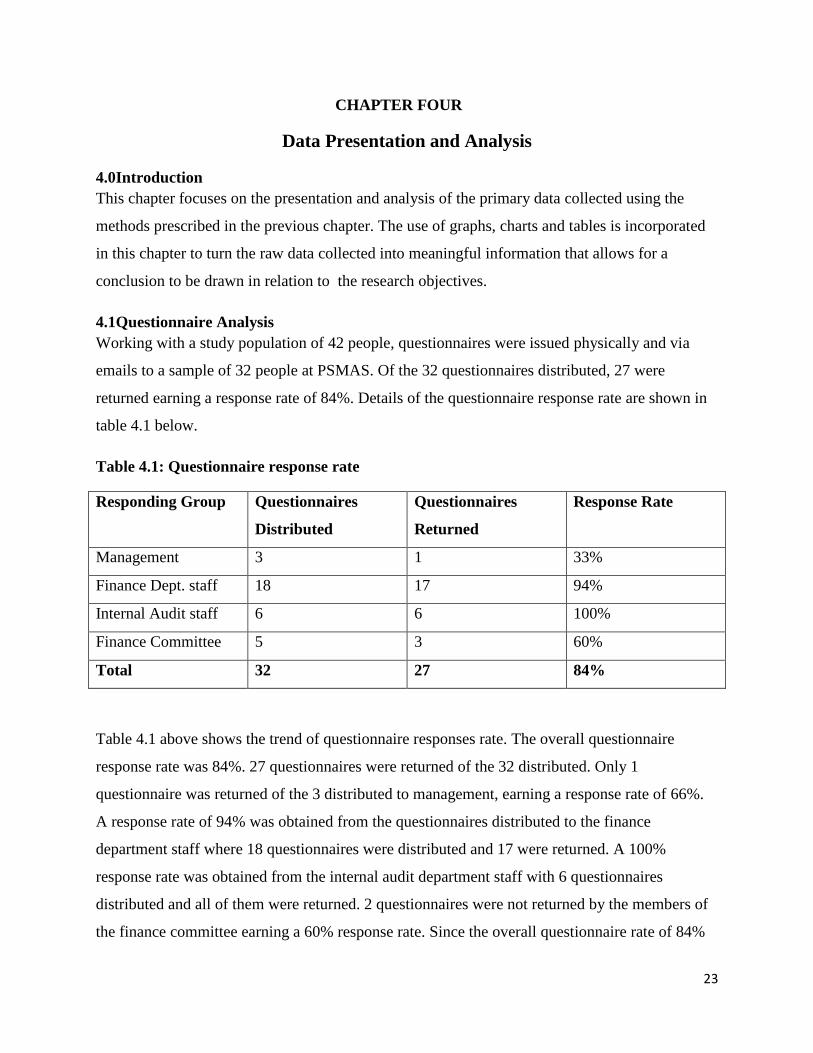
4.1Questionnaire Analysis
Working with a study population of 42 people, questionnaires were issued physically and via
emails to a sample of 32 people at PSMAS. Of the 32 questionnaires distributed, 27 were
returned earning a response rate of 84%. Details of the questionnaire response rate are shown in
table 4.1 below.
Table 4.1: Questionnaire response rate
Responding Group Questionnaires
Distributed
Questionnaires
Returned
Response Rate
Management 3 1 33%
Finance Dept. staff 18 17 94%
Internal Audit staff 6 6 100%
Finance Committee 5 3 60%
Total 32 27 84%
Table 4.1 above shows the trend of questionnaire responses rate. The overall questionnaire
response rate was 84%. 27 questionnaires were returned of the 32 distributed. Only 1
questionnaire was returned of the 3 distributed to management, earning a response rate of 66%.
A response rate of 94% was obtained from the questionnaires distributed to the finance
department staff where 18 questionnaires were distributed and 17 were returned. A 100%
response rate was obtained from the internal audit department staff with 6 questionnaires
distributed and all of them were returned. 2 questionnaires were not returned by the members of
the finance committee earning a 60% response rate. Since the overall questionnaire rate of 84%

24
is more than half, then the reliability of the data collected through it is assumed to be enhanced.
Findings from the questionnaires are presented and analysed below.
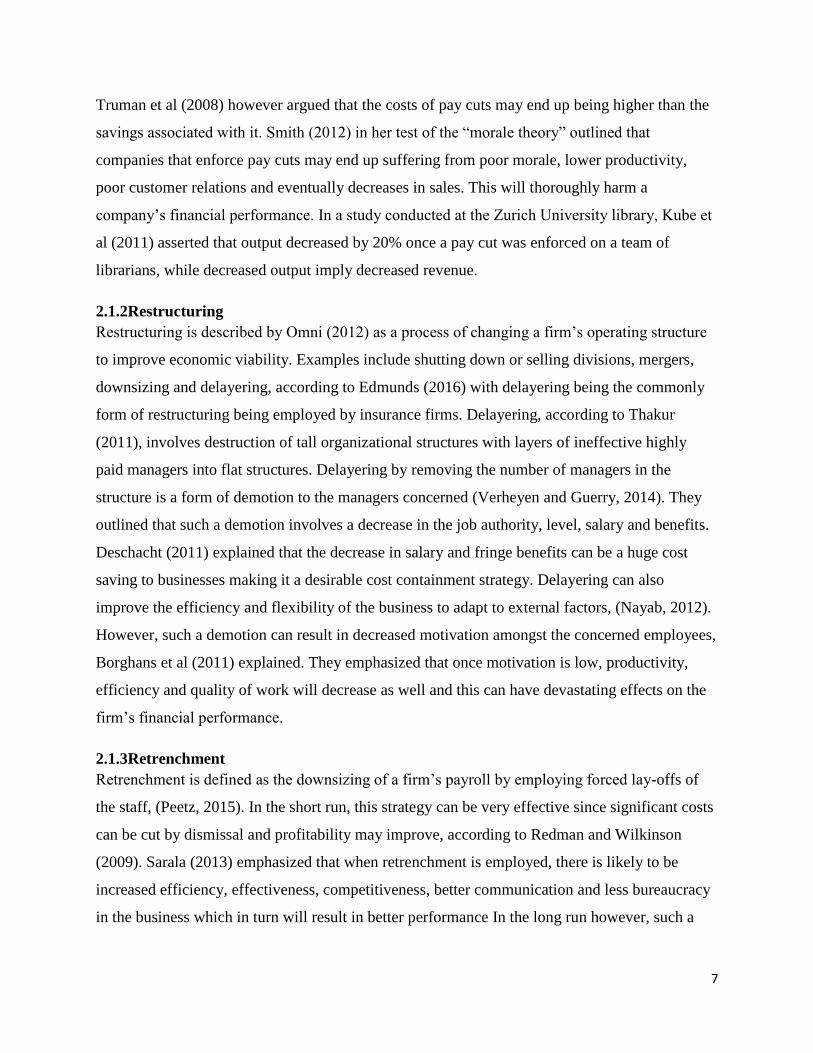
4.1.1Cost containment strategies being implemented by PSMAS.
The question sought to identify the strategies being implemented by PSMAS as a health
insurance firm in an attempt to curb costs and the following raw data was obtained:
Table4.2: Responses on the cost containment strategies being implemented by PSMAS
Cost containment measures
being implemented
Strongly
agree
Agree Indecisive Disagree Strongly
disagree
Total
a. Pay cuts 27 0 0 0 0 27
b. Restructuring 15 12 0 0 0 27
c. Reduction in overtime
spending
0 0 15 10 2 27
d. Retrenchment 17 10 0 0 0 27
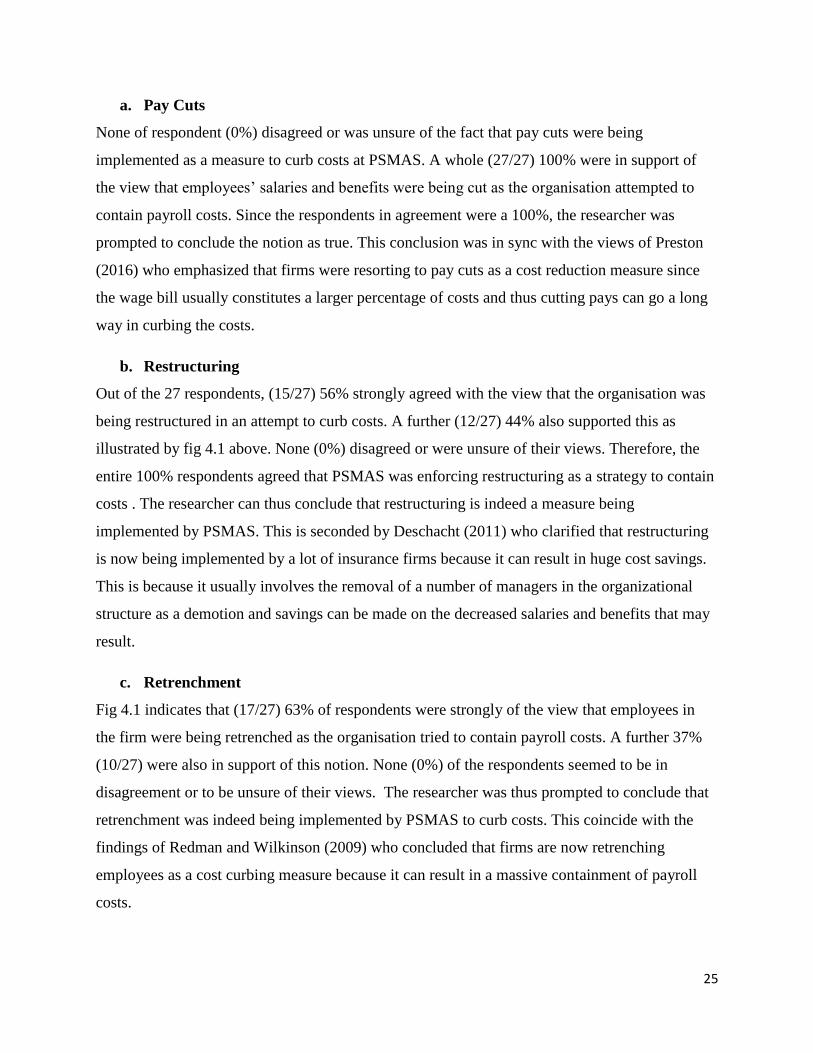
Fig 4.1 Cost containment strategies being implemented by PSMAS
0% 20% 40% 60% 80% 100%
Pay cuts
Restructuring
Reduction in overtime spending
Retrenchment
Strongly disagree
Disagree
Indecisive
Agree
Strongly agree
25
a. Pay Cuts
None of respondent (0%) disagreed or was unsure of the fact that pay cuts were being
implemented as a measure to curb costs at PSMAS. A whole (27/27) 100% were in support of
the view that employees’ salaries and benefits were being cut as the organisation attempted to
contain payroll costs. Since the respondents in agreement were a 100%, the researcher was
prompted to conclude the notion as true. This conclusion was in sync with the views of Preston
(2016) who emphasized that firms were resorting to pay cuts as a cost reduction measure since
the wage bill usually constitutes a larger percentage of costs and thus cutting pays can go a long
way in curbing the costs.
b. Restructuring
Out of the 27 respondents, (15/27) 56% strongly agreed with the view that the organisation was
being restructured in an attempt to curb costs. A further (12/27) 44% also supported this as
illustrated by fig 4.1 above. None (0%) disagreed or were unsure of their views. Therefore, the
entire 100% respondents agreed that PSMAS was enforcing restructuring as a strategy to contain
costs . The researcher can thus conclude that restructuring is indeed a measure being
implemented by PSMAS. This is seconded by Deschacht (2011) who clarified that restructuring
is now being implemented by a lot of insurance firms because it can result in huge cost savings.
This is because it usually involves the removal of a number of managers in the organizational
structure as a demotion and savings can be made on the decreased salaries and benefits that may
result.
c. Retrenchment
Fig 4.1 indicates that (17/27) 63% of respondents were strongly of the view that employees in
the firm were being retrenched as the organisation tried to contain payroll costs. A further 37%
(10/27) were also in support of this notion. None (0%) of the respondents seemed to be in
disagreement or to be unsure of their views. The researcher was thus prompted to conclude that
retrenchment was indeed being implemented by PSMAS to curb costs. This coincide with the
findings of Redman and Wilkinson (2009) who concluded that firms are now retrenching
employees as a cost curbing measure because it can result in a massive containment of payroll
costs.

26
d. Reducing overtime spending
Fig 4.1 highlights that none (0%) of the respondents agreed that overtime spending had been
reduced to curb costs. The chart indicates that(15/27) 56% were unsure of whether overtime
spending had been reduced to contain costs and this may be because the company’s policy
towards overtime was not clearly communicated to everyone in the organisation. However,
(10/27) 37% disagreed that overtime spending was reduced while another (2/27) 7% strongly
disagreed. This prompted the researcher to conclude that the majority of respondents were unsure
of whether overtime spending in the organisation had been reduced or not. This however is
contrary to the views of US Department of Labour (2016) who postulated that insurance firms
are cutting down spending on overtime to save on labor costs.
It can be concluded from the above responses that pay cuts, restructuring and retrenchment are
indeed being implemented to curb costs at PSMAS but the majority of respondents were unsure
of whether overtime spending was reduced. Interview responses however clarified that indeed
overtime spending was reduced.
4.1.2Factors influencing the successful implementation of cost containment strategies.
The objective of the question was to ascertain the factors influencing the successful
implementation of cost containment strategies in health insurance firms and table 4.3 and fig4.2
show details of the data collected from PSMAS.
Table4.3: Responses on the factors influencing successful implementation of cost
containment strategies.
Factors Strongly
agree
Agree Indecisive Disagree Strongly
disagree
Total
a. Management
Commitment
6 11 8 2 0 27
b. Employee
Involvement
17 4 3 3 0 27
c. Accountability 12 5 6 4 0 27
d. Monitoring of
progress
5 2 4 11 5 27
27
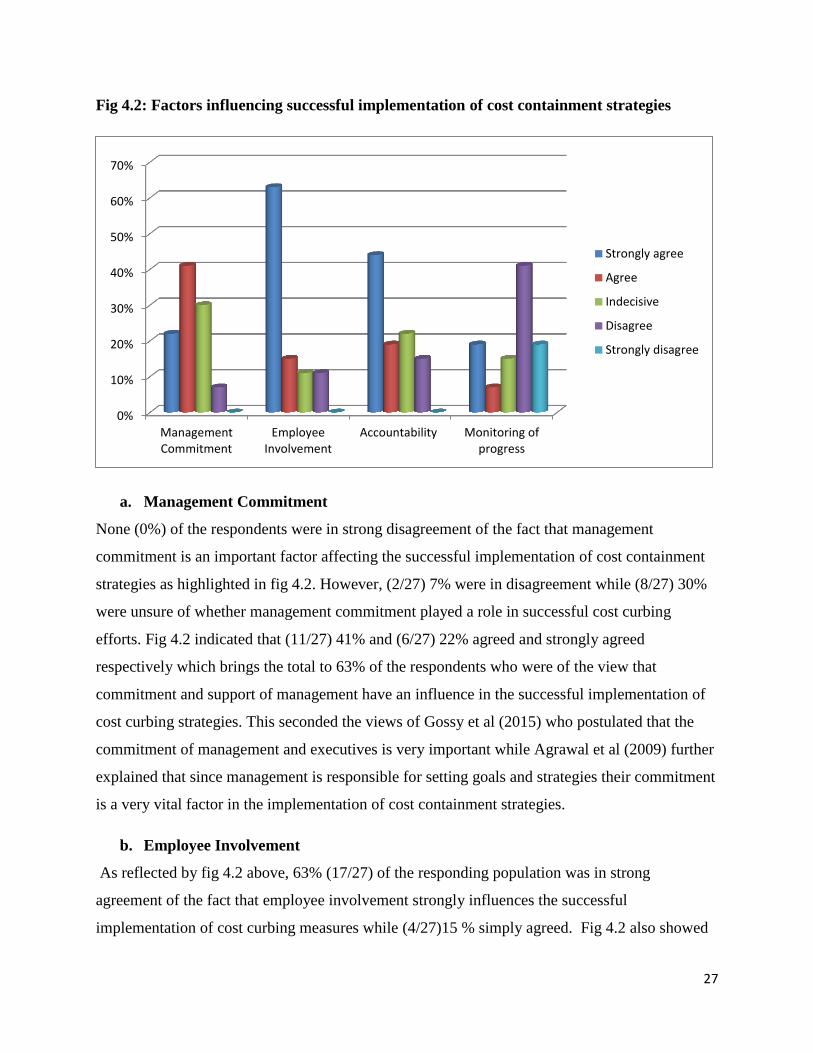
Fig 4.2: Factors influencing successful implementation of cost containment strategies
a. Management Commitment
None (0%) of the respondents were in strong disagreement of the fact that management
commitment is an important factor affecting the successful implementation of cost containment
strategies as highlighted in fig 4.2. However, (2/27) 7% were in disagreement while (8/27) 30%
were unsure of whether management commitment played a role in successful cost curbing
efforts. Fig 4.2 indicated that (11/27) 41% and (6/27) 22% agreed and strongly agreed
respectively which brings the total to 63% of the respondents who were of the view that
commitment and support of management have an influence in the successful implementation of
cost curbing strategies. This seconded the views of Gossy et al (2015) who postulated that the
commitment of management and executives is very important while Agrawal et al (2009) further
explained that since management is responsible for setting goals and strategies their commitment
is a very vital factor in the implementation of cost containment strategies.
b. Employee Involvement
As reflected by fig 4.2 above, 63% (17/27) of the responding population was in strong
agreement of the fact that employee involvement strongly influences the successful
implementation of cost curbing measures while (4/27)15 % simply agreed. Fig 4.2 also showed
0%
10%
20%
30%
40%
50%
60%
70%
ManagementCommitment
EmployeeInvolvement
Accountability Monitoring ofprogress
Strongly agree
Agree
Indecisive
Disagree
Strongly disagree
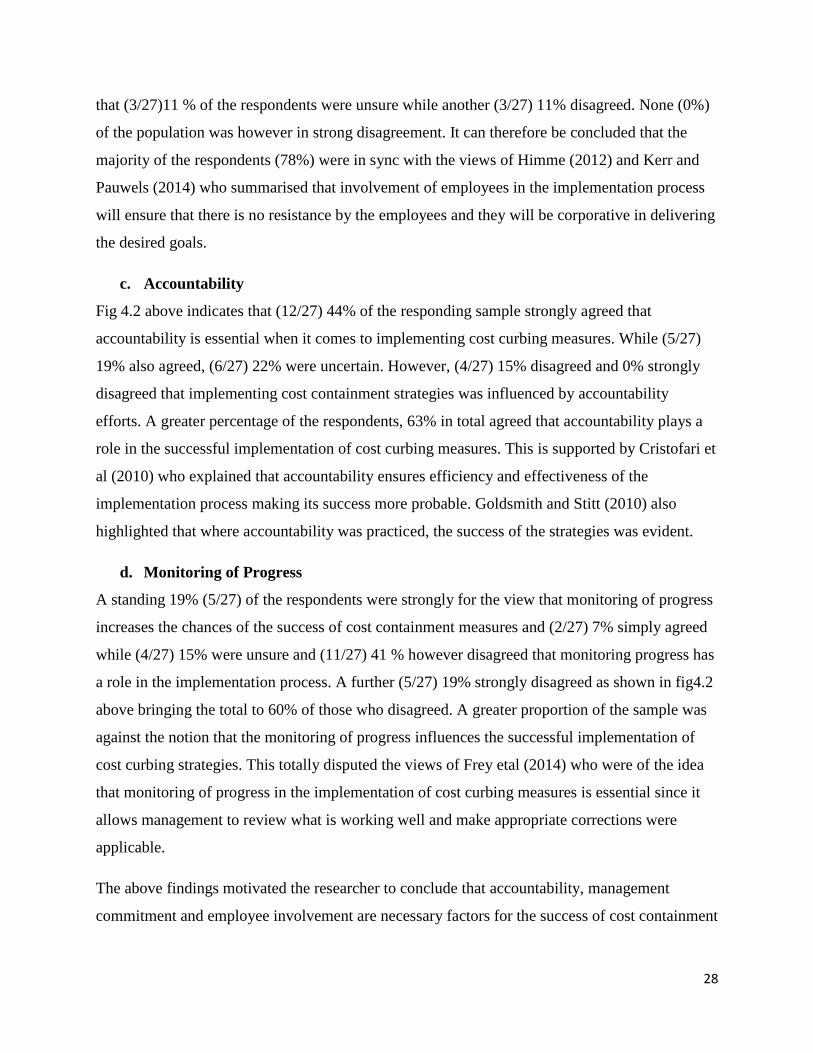
28
that (3/27)11 % of the respondents were unsure while another (3/27) 11% disagreed. None (0%)
of the population was however in strong disagreement. It can therefore be concluded that the
majority of the respondents (78%) were in sync with the views of Himme (2012) and Kerr and
Pauwels (2014) who summarised that involvement of employees in the implementation process
will ensure that there is no resistance by the employees and they will be corporative in delivering
the desired goals.
c. Accountability
Fig 4.2 above indicates that (12/27) 44% of the responding sample strongly agreed that
accountability is essential when it comes to implementing cost curbing measures. While (5/27)
19% also agreed, (6/27) 22% were uncertain. However, (4/27) 15% disagreed and 0% strongly
disagreed that implementing cost containment strategies was influenced by accountability
efforts. A greater percentage of the respondents, 63% in total agreed that accountability plays a
role in the successful implementation of cost curbing measures. This is supported by Cristofari et
al (2010) who explained that accountability ensures efficiency and effectiveness of the
implementation process making its success more probable. Goldsmith and Stitt (2010) also
highlighted that where accountability was practiced, the success of the strategies was evident.
d. Monitoring of Progress
A standing 19% (5/27) of the respondents were strongly for the view that monitoring of progress
increases the chances of the success of cost containment measures and (2/27) 7% simply agreed
while (4/27) 15% were unsure and (11/27) 41 % however disagreed that monitoring progress has
a role in the implementation process. A further (5/27) 19% strongly disagreed as shown in fig4.2
above bringing the total to 60% of those who disagreed. A greater proportion of the sample was
against the notion that the monitoring of progress influences the successful implementation of
cost curbing strategies. This totally disputed the views of Frey etal (2014) who were of the idea
that monitoring of progress in the implementation of cost curbing measures is essential since it
allows management to review what is working well and make appropriate corrections were
applicable.
The above findings motivated the researcher to conclude that accountability, management
commitment and employee involvement are necessary factors for the success of cost containment
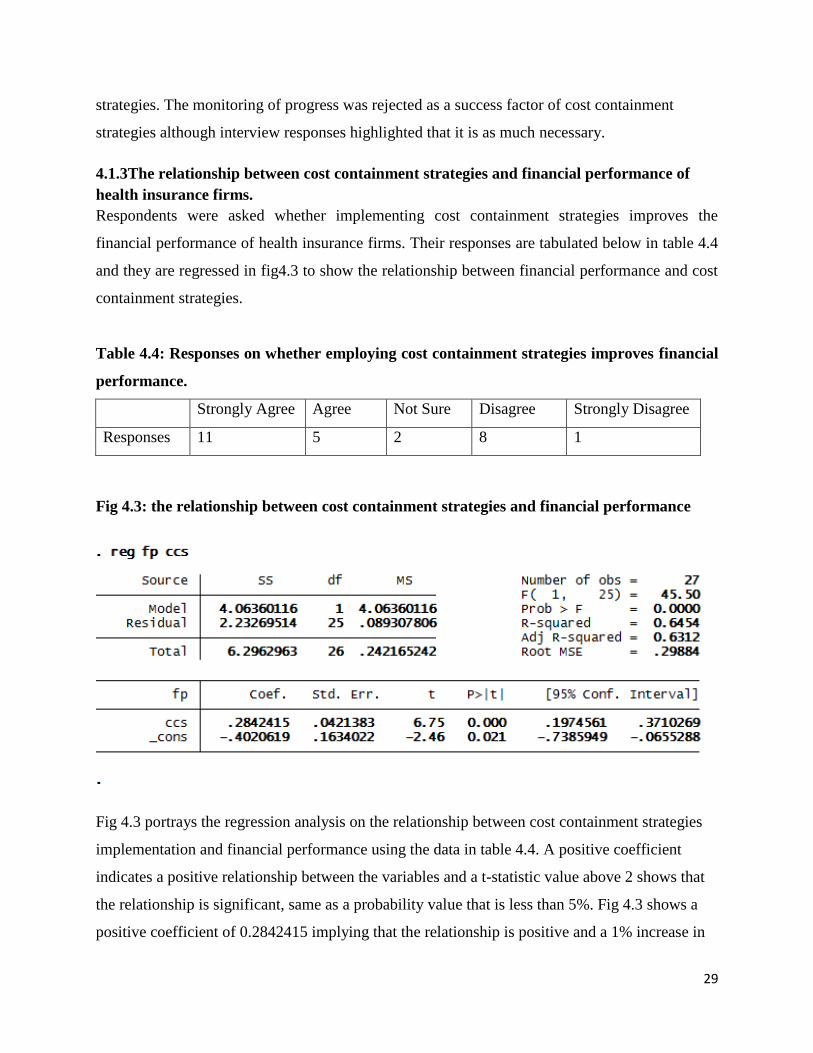
29
strategies. The monitoring of progress was rejected as a success factor of cost containment
strategies although interview responses highlighted that it is as much necessary.
4.1.3The relationship between cost containment strategies and financial performance of
health insurance firms.
Respondents were asked whether implementing cost containment strategies improves the
financial performance of health insurance firms. Their responses are tabulated below in table 4.4
and they are regressed in fig4.3 to show the relationship between financial performance and cost
containment strategies.
Table 4.4: Responses on whether employing cost containment strategies improves financial
performance.
Strongly Agree Agree Not Sure Disagree Strongly Disagree
Responses 11 5 2 8 1
Fig 4.3: the relationship between cost containment strategies and financial performance
Fig 4.3 portrays the regression analysis on the relationship between cost containment strategies
implementation and financial performance using the data in table 4.4. A positive coefficient
indicates a positive relationship between the variables and a t-statistic value above 2 shows that
the relationship is significant, same as a probability value that is less than 5%. Fig 4.3 shows a
positive coefficient of 0.2842415 implying that the relationship is positive and a 1% increase in
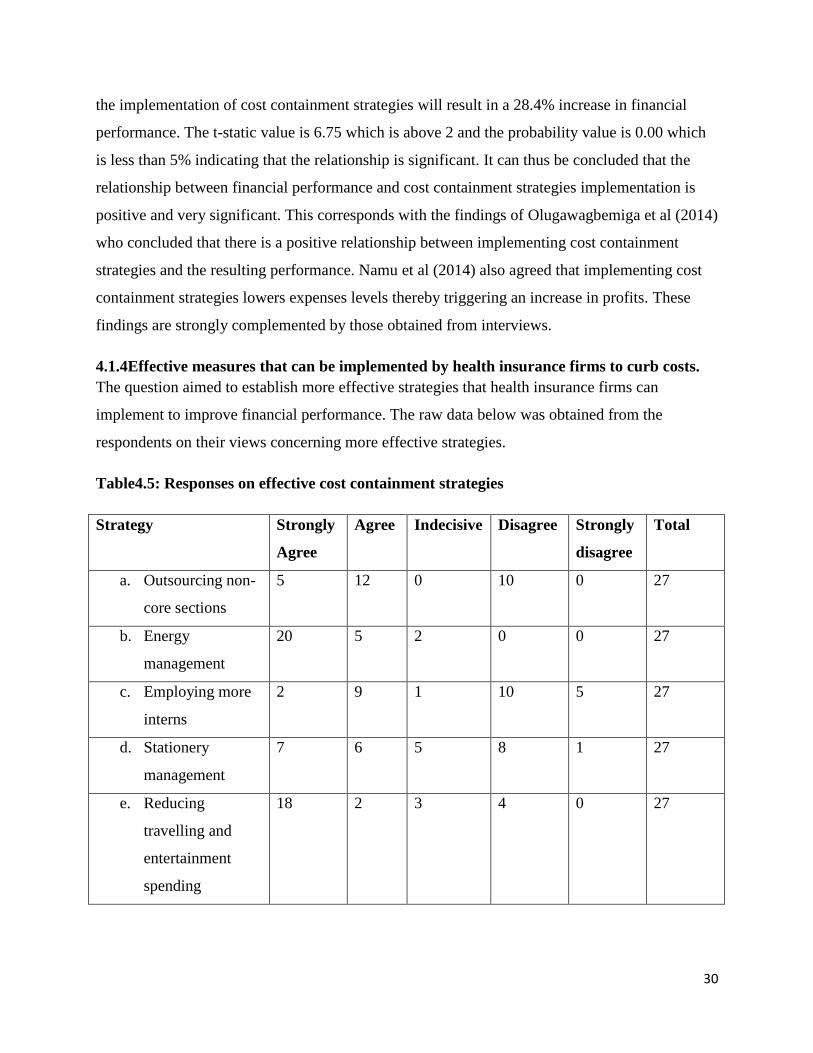
30
the implementation of cost containment strategies will result in a 28.4% increase in financial
performance. The t-static value is 6.75 which is above 2 and the probability value is 0.00 which
is less than 5% indicating that the relationship is significant. It can thus be concluded that the
relationship between financial performance and cost containment strategies implementation is
positive and very significant. This corresponds with the findings of Olugawagbemiga et al (2014)
who concluded that there is a positive relationship between implementing cost containment
strategies and the resulting performance. Namu et al (2014) also agreed that implementing cost
containment strategies lowers expenses levels thereby triggering an increase in profits. These
findings are strongly complemented by those obtained from interviews.
4.1.4Effective measures that can be implemented by health insurance firms to curb costs.
The question aimed to establish more effective strategies that health insurance firms can
implement to improve financial performance. The raw data below was obtained from the
respondents on their views concerning more effective strategies.
Table4.5: Responses on effective cost containment strategies
Strategy Strongly
Agree
Agree Indecisive Disagree Strongly
disagree
Total
a. Outsourcing non-
core sections
5 12 0 10 0 27
b. Energy
management
20 5 2 0 0 27
c. Employing more
interns
2 9 1 10 5 27
d. Stationery
management
7 6 5 8 1 27
e. Reducing
travelling and
entertainment
spending
18 2 3 4 0 27

31
Fig 4.4: effective strategies that can be implemented to curb costs
a. Outsourcing non-core sections
Fig 4.4 above indicates that (5/27) 19% of the respondents strongly agreed that outsourcing non-
core sections of the organisation can be an effective way of containing costs. Another (12/27)
44% also agreed to this notion. None (0%) of the respondents were uncertain although (10/27)
37% disagreed that out sourcing services that do not relate to the organization’s main line of
business can be effective in curbing costs. The majority of the sampled population being a total
of 63% was in agreement of the notion and thus it can be concluded that outsourcing non-core
sections can be effective in containing costs as seconded by Rampton (2012) who explained that
up to 60% savings can be made when outsourcing is enforced. This is because the organisation
will have been spared of the burden of providing benefits and insurance to the employees of the
outsourced services as it would have been had they not outsourced, according to Stanley (2015).
b. Energy Management
Questioned on whether energy management can be effective in containing costs, (20/27) 74% of
the respondents strongly agreed while (5/27) 19% just agreed. None or 0% disagreed to the
0% 10% 20% 30% 40% 50% 60% 70% 80%
Outsourcing non-core sections
Energy management
Employing more interns
Stationery management
Reducing travelling and entertainmentspending
Strongly disagree
Disagree
Indecisive
Agree
Strongly Agree
32
notion although a small (2/27) 7% was unsure. It is without doubt that the majority of the
respondents were in agreement and it can be concluded that energy management can be an
effective strategy to curb costs. This is supported by Cigarran (2012) who pointed out following
his research on a local university that huge cost savings can be made when energy management
is implemented. Kramer et al (2009) also agreed by emphasizing that energy management
requires little or no capital expenditure and thus is one of the most convenient strategies to
contain costs.
c. Employing more interns
When questioned on whether employing more interns can be a viable option to contain costs, the
respondents had mixed views. While (2/27) 7% agreed that it is, another (9/27) 33% simply
agreed and (1/27) 4% were unsure. Fig 4.4 shows that (10/27) 37% disagreed and another (5/27)
19% strongly disagreed. Since the greater proportion of respondents were in disagreement, it can
thus be derived that employing more interns may not be that effective at curbing costs. This
however goes against the views of Mgaya and Mbekomize (2014) as well as those of Lyons
(2013) who all argued that employing more interns can contain a huge percentage of payroll
costs as interns are paid no or a mini salary and no benefits.
d. Stationery Management
Fig 4.4 shows the responses form the sampled population when they were asked if stationery
management can be an effective cost containment strategy. Fig 4.4 also indicates that (7/27) 26%
of the respondents strongly agreed that it really can be effective and another (6/27) 22% also
agreed. While (5/27) 19% of the respondents were unsure, (8/27) 30% disagreed and a further
(1/27) 4% strongly disagreed that managing stationery can be effective at curbing costs. By a
close margin, respondents for the notion were more; being 48% in total and thus it can be
concluded that stationery management can really be effective at cost containment. This is backed
by Msunduzi Municipality (2013) who argued that implementing stationery management can go
a long way in cutting costs as organisations will do away with costly paper transactions and
introduce digital processing. McCool (2008) also highlighted that millions were seen to be saved
when organisations under his study implemented stationery management as a cost containing
strategy.

33
e. Reducing travelling and entertainment expenditure
Out of the 27 respondents, (2/27) 7% agreed and another (18/27) 67% strongly agreed that
reducing travelling and entertainment expenditure can be a viable efficient cost curbing measure.
A small (3/27) 11% of the respondents were unsure while (4/27) 15% disagreed although no
(0%) respondent was in strong disagreement. A total of 73% of the respondents were in
agreement of the notion that reducing entertainment and travelling expenditure can effectively
contain costs in an organisation like PSMAS and their view was supported by Parekh (2009) and
Matt (2012) who argued that reducing entertainment and travelling expenditure can be very
effective as it does not really damage employees’ morale like most strategies do.
The researcher can thus conclude that respondents were of the view that outsourcing non- related
services, energy and stationery management as well as reducing entertainment and travel
expenditure are effective strategies to curb costs. Employing more interns was however rejected
as an effective strategy although interviewees strongly felt it can very effective at curbing costs.
4.1.5 Other factors that affect the financial performance of health insurance firms.
The objective was to determine factors, other than cost containment strategies that also affect the
financial performance of health insurance firms. Responses obtained are presented in table 4.6
and fig 4.5 below.
Table 4.6: Responses on other factors affecting financial performance
Strategy
Strongly
Agree
Agree Indecisive Disagree Strongly
disagree
Total
a. Liquidity 10 7 3 5 2 27
b. Consumer demand 12 8 5 1 1 27
c. Firm size 10 5 5 5 2 27
d. Economic conditions 18 6 2 1 0 27

34
Fig 4.5: Other factors influencing financial performance
a. Liquidity
When asked if liquidity also affects the financial performance of health insurance firms, (10/27)
37% of the respondents strongly agreed and another (7/27) 26% supported this view. While
(3/27) 11% were uncertain of their views, (5/27) 19% of the respondents disagreed and a further
(2/27)7% strongly disagreed to this notion. Since a greater proportion, a total of 63% are in
agreement, it can be finalized that liquidity does affect the financial performance of health
insurance firms. This view is seconded by Banafa et al (2015) who emphasized that a more
liquid firm generally performs better financially. Almajali (2012) also agreed and highlighted
that the relationship between liquidity and financial performance is strongly positive.
b. Consumer Demand
Out of the 27 respondents, 12 (44%) respondents were in strong agreement and 8 (30%)
respondents also agreed that consumer demand has an effect on the financial performance of
health insurance firms. Fig 4.5 indicates that (5/27) 19% were uncertain of their views while
(1/27) 4% disagreed and another (1/27) 4% also strongly disagreed that financial performance is
affected by consumer demand. A total of 74% were in agreement of with the notion and this
0%
10%
20%
30%
40%
50%
60%
70%
Liquidity Consumerdemand
Firm size Economicconditions
Strongly Agree
Agree
Indecisive
Disagree
Strongly disagree

35
prompted the researcher to conclude that consumer demand does have an impact on the financial
performance of insurance firms. This is in sync with the view of PWC (2012) and Hagel 111 et
al (2011) who emphasized that when demand is high, revenue and profitability increase and the
reverse also applies.
c. Firm Size
Fig4.5 above indicates that (5/27) 19% of the respondents agreed and (10/27) 37% strongly
agreed that the size of a firm affects financial performance in the insurance industry. Another
19% were not certain on their views although another (5/27) 19% again disagreed on the notion.
A further (2/27) 7% of the respondents strongly disagreed. In total, 56% of the respondents were
in agreement and the researcher was prompted conclude that firm size really has an effect on the
financial performance of an organisation like PSMAS. This conclusion corresponds with that of
Lee (2009) whose findings on 700 firms indicated that larger firms generally perform better than
smaller ones. Kioko (2013) also agreed that since larger firms benefit from economies of scale,
they end up earning more revenue and making more profits. Niresh and Velnampy (2014)
however argued that the larger a firm gets, the poorer it performs financially due to the effects of
diseconomies of scale.
d. Economic Conditions
As shown by fig 4.5, (18/27) 67% of the respondents were strongly for the view that economic
conditions affect financial performance. A further (6/27) 22% also supported the view while
(2/27) 7% were really uncertain and only (1/27) 4% disagreed. Thus a total of 89% of the
respondents were in agreement of the notion so a conclusion can be reached that economic
conditions do affect the financial performance of insurance firms. Yap et al (2014) share the
same view as they highlighted that when an economic is weak characterized by high inflation,
unemployment and even high interest rates, insurance firms perform poorly. Dorofiti and Jakubik
(2014) also emphasized that in states where the economy is performing poorly, insurance firms
perform financially poorly and the reverse also applies.
The respondents agreed that liquidity, consumer demand, firm size and economic conditions are
other factors influencing financial performance and these responses are complemented by those
from interviews.

36
4.2Interview Analysis
Interviews were scheduled to be conducted on the sampled management and members of the
finance committee at PSMAS for purposes of this research. A total of 5 individuals were
scheduled to be interviewed, 3 managers and 2 members of the finance committee. However,
two respondents were unavailable for interviewing, inspiring an interview response rate of 60%.
Table 4.7 below details the interview response rate.
Table 4.7: Interview response rate
Targeted population Scheduled
interviews
Conducted
interviews
Response rate
Finance Director 1 0 0%
Management Accountant 1 1 100%
Internal Audit Director 1 1 100%
Finance Committee Chairperson 1 0 0%
Finance Committee Secretary 1 1 100%
Total 5 3 60%
A 60% response rate was obtained with the Management Accountant, Internal Audit Director,
Finance Committee Secretary being interviewed and the Finance Director and the Finance
Committee Chairperson were not available for interviewing. Interview responses were thus based
on 3 individuals and their responses are analysed below.
4.2.1What cost containment strategies are being implemented by PSMAS?
The respondents highlighted that various measures were currently being employed by the
organisation to curb costs. These include cutting of salaries and benefits, reducing overtime
spending and retrenchment of mangers. They also highlighted that a restructuring exercise was
currently in place to flatten the organisation that was heavily populated with numerous levels of
managers. They argued that most of these strategies are targeted on reducing payroll costs which
can be very destructive to a firm if they are too high as postulated by Preston (2016) and Mc
Querrey (2013). These responses were in sync with responses from questionnaires except that

37
questionnaires indicated that most respondents were unsure of whether overtime spending had
been reduced or not.
One interviewee however also added that the firm was also trying to curb claims costs by
engaging in claims audits to reduce losses through medical aid fraud as well as claims limits to
avoid members claiming more than they pay for.
4.2.2What factors influence the successful implementation of cost containment strategies?
The majority the respondents were of the view that implementing cost containment measures
successfully was largely dependent on the efforts and support of management. They argued that
because management is the figurehead in cost containment their commitment and support will
ensure that the strategies go in the right direction and be successful. They share this view with
Gossy et al (2015) who postulated that when top management is committed in the
implementation process, success is more often evident. One interviewee strongly felt that
allowing employees to participate increases the chances of the success of cost containment
strategies.
The respondents also highlighted that tracking progress is as much important if implementation
is to be successful. They emphasized that the progress of the implementation process has to be
tracked and corrective measures taken where deviations from the expected occur. This view
however is in dispute of findings from questionnaires that concluded that monitoring of progress
does not influence the success of cost containment strategies.
4.2.3Does implementing cost containment strategies improve the financial performance of
health insurance firms?
It does, was the unhesitant response of two thirds of the respondents. They highlighted that if
cost containment strategies are effectively and efficiently implemented, they can result in
massive cost savings. This is in sync with the views of Namu et al (2014) who concluded that
there is a positive linear relationship between financial performance and implementing cost
containment strategies. They clarified that most of the firms in the insurance industry that have
extensively implemented cost curbing measures have been performing better for example First
Mutual and Old Mutual.

38
A third of the respondents however argued that the relationship between the two is very negative.
The reasoning behind this view being that PSMAS has been implementing containment
strategies since 2013 but is still performing poorly. This view however diverges from findings
from questionnaires that established that the relationship between the two variables is
significantly positive.
4.2.4 What more effective strategies can be implemented to curb costs in the organisation?
Two thirds of the respondents portrayed that outsourcing is the most effective strategy the firm
can employ to curb costs and plans are already underway to try and outsource some services that
are not related to the organization’s main line of business like cleaning and security. This will
help the firm to do away with insurance and benefits costs that are currently being paid to
employees providing these services in the firm. This is seconded by Heric and Singh (2010)
All respondents also believed that if the organisation employed more part time, temporary and
student employees, payroll costs can be cut by almost half. These earn significantly lower than
permanent employees since they are not entitled to much employee benefits and neither are they
entitled to any form of insurance, according to Lyons (2013). So the respondent felt this can be
an effective measure. Questionnaire findings however disagreed with the view that employing
more interns can be effective in curbing costs.
4.2.5What other factors affect financial performance of insurance firms?
The respondents felt that the financial performance of insurance firms is strongly affected by the
country’s state of economy. They explained that currently the economy is in bad shape
characterized by a heavy liquidity crunch. This is one huge factor making PSMAS perform
poorly since cashflows are always in the negative. This view is in sync with that of Yap et al
(2014) who emphasized that a poor and weak state of economy makes insurance firms perform
poorly. The respondents also thought highly of consumer demand being a factor influencing
consumer demand. They emphasized that it is just a common rule of economics that when
demand increase, income and profitability increases and vice versa, as is supported by
Chintagunta and Nair (2011).
The responses complement those from questionnaires except for one respondent who added that
unemployment rate also affect financial performance. The argument being that when

39
unemployment rate is low, more people are employed and this entails more income that can be
spent for health insurance. On the part of the insurance firms, this will increase revenue and
eventually profit.
4.3Chapter Summary
This chapter dealt with the presentation of data collected from questionnaires and interviews into
tables, graphs and charts and making analysis on it to make the data meaningful for conclusions
to be drawn in the following chapter.
40
CHAPTER FIVE
Summary, Conclusions and Recommendations
5.0Introduction
The basis of this chapter is to summarise findings on the research on the impact of cost
containment strategies on financial performance and to make conclusions on those findings as
well as to make recommendations and suggest areas for future researches.
5.1Executive Summary
The research was conducted in an attempt to establish the impact of cost containment strategies
implementation on financial performance of health insurance firms with PSMAS being the case
study.
Chapter One highlighted the background leading to the study and it was established without
doubt that PSMAS was performing poorly with continually rising costs and decreasing
profitability despite the fact that the firm had introduced some cost containment measures. The
chapter also outlined the objectives of the research as well as the questions the study was
supposed to answer at the end of the day. A justification of the study and limitations within the
research were also highlighted in this chapter.
The second chapter reviewed literature from other scholars and authors in relation to the research
objectives. Analysis were made on each objective and views of other authors like Bender (2015),
Anderson (2011), Bususu (2014), Chintagunta and Nair (2011) and Vieira (2010) were cited on
the cost curbing measures being implemented by health insurance firms, factors affecting the
success of the implementation, the relationship between implementing cost containment
measures and financial performance as well as their suggestions on effective cost curbing
measures to employ. The chapter ended by discussing the authors’ views on other factors
affecting financial performance of health insurance firms.
In Chapter Three the researcher highlighted the research methodology used to collect data. A
discussion of descriptive research and case study as the research designs to be used in data
collection was also included in the chapter. The sampling techniques, sample population and size
were also included. Chapter Three also reviewed the primary and secondary sources of data as

41
well as interviews and questionnaires as instruments to collect the data. Reliability and validity
of data and ethical issues were also considered.
Chapter Four was basically concentrated on the presentation and analysis of the data collected
using the methodology in chapter three. 84% and 60% response rates were obtained from
questionnaires ad interviews respectively. The data obtained via these instruments was presented
into charts, graphs and tables to allow for meaningful analysis and conclusions to be drawn.
5.2Summary of Major Findings
Cost containment strategies being implemented by PSMAS
The research established that PSMAS as a health insurance firm has implemented claims limits,
claims audits, pay cuts, retrenchments, restructuring and reduced overtime expenditure as
measures to curb increasing costs.
Factors influencing the successful implementation of cost containment strategies in health
insurance firms.
It was also established in the research that for the implementation of cost containment strategies
to be successful, management commitment, employee involvement and participation,
accountability and tracking of progress are necessary factors that should be present within the
organisation.
The relationship between implementation of cost containment strategies and financial
performance of firms.
The relationship is significantly positive. The research established that if cost curbing strategies
are implemented, efficiently and effectively, they can result in the reduction of costs and the
increasing of profits.
Effective cost curbing measures that can be implemented by PSMAS.
Outsourcing non-core services, energy and stationery management, employing more temporary
and cheap staff as well as reducing spending on entertainment and travelling can be effective
measures to curb costs as established by the research.

42
Other factors affecting financial performance of health insurance firms.
According to the research findings, financial performance of health insurance firms can also be
affected by the condition of the economy, unemployment rate, levels of consumer demand as
well as the size of the firm.
5.3Conclusion
The research was generally quite successful as it managed to provide answers to all the research
objectives and questions. It managed to ascertain the impact of cost containment strategies on
financial performance as well as the factors influencing the success of these strategies. The
research also managed to establish more effective cost curbing strategies, factors influencing the
successful implementation of these strategies as well as to determine other factors influencing
financial performance of health insurance firms. Since it managed to meet the objectives of the
research, the research was quite successful.
5.4Recommendations
The researcher recommends that for PSMAS to make the existent strategies more effective and
successful at containing costs, management should be thoroughly committed to the
implementation process as established by Gossy et al (2015). PSMAS should also involve
employees in the implementation process and allow them to participate thoroughly as this creates
the desire within them to contribute towards cost curbing efforts and make the implementation
successful, according to Frey et al (2014). The researcher also recommends that individuals
amongst the workforce should be made responsible and accountable for the implementation
process and should also monitor the progress of the strategies, (Deloitte, 2016).
PSMAS is also recommended to try other more effective cost containment strategies like energy
and stationery management, outsourcing non-core sections, employing more cheap staff like
interns and reducing travelling and entertainment spending to thoroughly contain costs and
improve profitability, (Msunduzi Municipality, 2013).
The researcher also recommends the organisation to investigate and address other factors like
consumer demand, liquidity and economic conditions as they could be the factors resulting in
poor performance of PSMAS.

43
5.5Suggestion for further research
The researcher suggests that further studies be done on the challenges being faced by insurance
firms in implementing cost containment strategies as well as ways to mitigate those challenges.
A greater need however, is to research on the major cost drivers in health insurance firms and
establish strategies to curb them.
44
REFERENCE LIST
BOOKS
Astron Solutions, (2013) Overtime out of control? Effective strategies you can use to manage
these costs, Astron Solutions Printers: New York.
Bryman, A. (2012) Social Research methods 4th
edition, Oxford University Press: Oxford.
Burns, P. (2012) Research Methodology in Social Sciences, Himalayan Publishing House:
Bombay.
Church, H. (2013) Social Research, Strategy and Tactics, The Macmillan Company: NewYork
Cigarran, J. (2012) How four industries use the same methods to cut energy costs,
Greenbuildbooks.
Creswell, J.W. (2011) Research Design, Qualitative, Quantitative and Mixed approaches 2nd
edition, University of Nebraska, Sage Publications: Lincoln.
Good, S. and Hatt, F. (2013) Research Methodology, Sage Publications.
Green, S. and Carmone, O. (2011) Case study Research: Design and Methods- applied Social
Research Methods, McGraw Hill: New York.
Preston, T. (2016) Cutting Pay in Insurance Firms, LLP: New York.
Price, C. (2008) HR Management in a business context, Thompson Learning: London.
PWC, (2012) Financial Performance Report: Profitable growth-driving the demand chain, PWC
Publications.
Rampton, I. (2012) How outsourcing can save your money, John Chowebooks.
Redman, T. and Wilkinson, A. (2009) Contemporary HRM: Text and Cases 3rd
edition, Prentice
Hall: England.

45
Saunders, M. (2010) Research methods for business students 5th
edition: Harlow.
Scott, L. and Morrison, K. (2013) Sampling Techniques, John Willey and Sons: New York.
Thakur, S. (2011) Business Restructuring: A look at some strategies: Sage Publications.
Yin, R. (2010) Qualitative Research from start to finish: Guilford Press.
JOURNALS
Almajali, M. (2012) The use of theory reasoned theory to study finance, Journal of Internet
Banking and Commerce 16(1).
Banafa, A.S., Muturi, W. and Ngugi, K. (2015) The liquidity factor on financial performance of
listed non-financial firms in Kenya, International Journal of Finance and Accounting Volume
4(7).
Cooper, D. (2011) Impact of management commitment on employee behavior, Indiana: Journal
of Human Resources Volume 3(1).
Deschacht, S. (2011) The definition of promotion gap, University of Brussels: Economic
Business Journal Volume 15(4).
Dorofiti, C. and Jakubik, P. (2014) Insurance Sector profitability and macroeconomic
environment, CRORR Volume 3(1).
Eljelly, A. (2014) Liquidity-Profitability tradeoff: An empirical investigation in an emerging
market, IJCM 14(2).
Erkens, D.H., Hun, M. and Matos, P. (2008) Corporate Governance in the 2008 financial crisis,
Journal of Corporate Finance Volume 18.
Farias, R. and Gasparetto, V. (2016) Inhibiting factors of inter organizational cost management-
Contemporary study, International Business Research.

46
Garanina, T. and Petrova, O. (2015) Liquidity, cash conversion cycle and financial performance:
case of Russian Firms, Investment Management and Financial Innovations Volume 12(1):
Russia.
Guilford, H. (2013) Quantitative Methodology: Is it useful for accounting research, Qualitatative
Research in Accounting, Wiley Online Journals.
Hagel 111, J., Brown, J. S. and Davidson, L. (2011) The best ways to measure company
performance, IJCT Volume 3(1).
Heric, S. and Singh, B. (2010) Outsourcing can do much better than cutting costs, Journal of
Business and Accounting Management Volume 2(2).
Himme, A. (2012) Critical success factors of strategic cost reduction: Journal of Management
CRT Volume 3(3)
Jones, S. and Henshen, D.A. (2014) Predicting firm financial distress :A mixed logit model, The
Accounting Review 79(4).
Lee, S. (2009) Does firm size matter in financial performance-US Public Firms, International
Journal of Business Economics Volume 16(2).
Lorenz, B. (2009) 10 tips for facility managers to cut energy costs, Energy efficiency- building
operational management, Journal of Business Management Volume 4(3).
Nayab, N. (2012) Ten reasons why businesses should consider restructuring, Journal of
Management Research Volume 4 (2).
Niresh, J.A. and Velnampy, T. (2014) Firm size and profitability- A study of listed firms, Sri
Lanka, Internal Journal of Business Management Volume 9(4).
Peetz, D. (2015) Retrenchment and labour market disadvantages, Journal of Industrial Relations
Volume 4(3).
Pervan, M. and Visiic, J. (2012) Influence of firm size on business success, CRORR Volume 3.
47
Raneman, S. and Wasr, R. (2011) Working Capital Management and profitability- ease of
Pakistan Firms, International Review of Business Research Papers Volume 3(1).
Yap, B., Mohamed, Z. and Chong, K. (2014) Effects of financial crisis on the financial
performance of Malaysian companies, Asian Journal of Finance and Accounting Volume 6(1).
ARTICLES
Agrawal, A., Nottebohm, O. and West, A. (2009) 5 ways CFOs can make costs cuts stick,
Mckinsey Global Institute.
Anderson, M. (2011) Outsourcing: The reality of cost reduction, PE: CMC.
Beck, T., Kunt, D.A. and Maksimovic, V. (2015) Financial and Legal Institutions and firm size,
World Bank.
Bender, R. (2015) Risk management in a cost cutting environment, Cranfield School of
Management, Ernst and Young.
Bhunia, A.S., Mukhuti, S. and Ray, G. (2011) Financial Performance analysis, University of
Calcutta: West Bengal India.
Borghans, L., Corvers, F. and Kriecher, B. (2011) Productivity, reward and the participation of
older employees: Maastricht.
Bruers, B., Jensen, R., Riley, P., Lara, A. and Lu, X. (2011) Effective Cost Cutting, George
Washington University: Department of Health Policy.
Bususu, E. (2014) Effectiveness of cost cutting employee related costs as a performance
measure, Midlands State University: Gweru.
Chintagunta, P.K. and Nair, H.S. (2011) Discrete- choice models and consumer demand in
marketing, Duke University.
Corbett, C. (2014) The outsourcing revolution-why it makes sense and how to do it right,
Business Management Research.

48
Cristofari, T., Familusi, T., Perrin, O. and Sevin, J. (2010) Energy Perspectives- 5 essentials for
improper operational costs: Accenture.
Dermirhan, H. and Anwar, W. (2014) Factors affecting the financial performance of firms during
the financial crisis: Turkey.
Doraisamy, P and Lewis, P. (2009) Cutting costs not customers- maintaining customers in a
challenging market, Ernst and Young : Australia.
Edmund, S. (2016) The Impact of Restructuring on organisation: Houston Chronicle.
Feder, J. (2010) Cost containment is key: Healthcare Reform will bring costs under control,
Center of African Progress.
Frey, F., Minz, R. and Schmid, C. (2014) Taming the beast-cutting government costs
sustainably, Boston Consulting Group.
Gandolfi, F. (2008) HR strategies that can sting out of downsizing related layoffs, Ivey Business
School Journal, Western University: Canada.
Gichuki, C.W. (2014) Effects of cost containment strategies on financial performance of
companies, University of Nairobi: Nairobi.
Goldsmith, R. and Stitt, N. (2010) Governing the states and localities: Harvard Kennedy School.
Gossy, G., Seungwook, O. and Messenboek, R. (2015) Beyond cost cutting , Financial
Worldwide Ltd, Boston Consultancy Group.
Haliassos, M. (2012) Salary cuts and competitiveness, Safe Center of Excellence, Goethe
University: Frankfurt.
Ingram, D. (2009) Cost Management and Efficiency, The Houston Chronicles: Texas.
Katzenbach, J. and Bromfield, P. (2008) How to get your employees to help , Katzenbach
Centre: New York.
Kerr, M. and Pauwels (2014) Cost cutting with no regrets, Bain and Co.

49
Kolbaek, R. (2014) Research designs- Lecture for WIP 2014, IRIS Network.
Kramer, K., Masaret, E. and Worrel, E. (2009) Energy Efficiency Improvement- cost saving
opportunities for the pulp and paper industry, Ernest Orlando Lawrence Berkeley National Lab.
Kube, S., Marechal, M. and Puppe, C. (2011) Do wage cuts damage morale? Evidence from a
field experiment, University of Zurich.
Lyons, B. (2013) Interns are workers too, OECD Forum Yearbook.
Malinconico, J. (2016) Paterson on target for major cuts in overtime spending , Paterson Press.
Mc Cool, C. (2008) How to reduce printing by 17%- a guide to doing well and doing good by
printing less, Green Print Technologies: Portland.
McQuerrey, L. (2013) Overtime Management Techniques, Houston Chronicles: Texas.
Metcalf, C. (2012) 7 steps to effective energy management, Kentucky Poll Press Centre.
Metzeger, E. (2009) Bottom line on cost containment, World Resources Institute: Washington.
Mgaya, K. and Mbekomize, L. (2014) Benefits to host organisation from participating in
internship programs in Botswana: Gaborone.
Michigan State University research, (2012) Hiring interns, Career Surveys, Michigan.
Msunduzi Municipality, (2013) Approved 2013 Cost Containment Strategies Report.
Namu, N., Kaimba, G., Murithi, D.K. and Nkasi, I.M. (2014) Impact of cost reduction strategies
on performance of tea factories, Kenya.
Napoli, T.P. (2012) Management and Control of Overtime costs: New York City Health and
Hospital Corporation, New York State Office of the State Comptroller.
Oaxaca, R. (2014) Effects of Overtime regulations on employment, University of Arizona,
World of Labour: IZA.
Ochieno, C. N. (2013) Effects of retrenchment on organizational performance at the Telkom
Kenya, Eldoret Branch , Jomo Kenyatta University of Agriculture and Technology: Kitale.

50
Olugawagbemiga, O.E., Olubenga, O.M. and Zaccheaus, Cost Management Practices, Jomo
Kenyatta University of Agriculture and Technology: Kenya.
Omni (2012) Guide for successful restructuring: London.
PA Consulting Group report, (2012) Addressing weaknesses in financial management and costs
within the Health Service Executive- A report and Action plan, P A Consulting Group.
Potter, C. (2016) Four types of pay cuts and what do about them, Research Centre: New York.
Prow, C.L., Hines, D.C. and Prieto, D.B. (2012) Strategies to cut costs and improve
performance, IBM Center for Business Management.
Rose, S., Spinks, N. and Canhoto, A.I. (2015) Management Research – applying the principles.
Sanchez, A. (2011) Restructuring: A comprehensive analysis.
Sarala, A. (2013) Retrenchment Labor Law: Washington.
Sarantis, H. (2012) Business Guide to paper reduction- A step by step plan to save money by
saving paper, Forestethinics.
Smith, J. (2012) Pay cuts and morale- A test of downward nominal rigidity, University of
Warwick: UK.
Stanley, M. (2015) Outsourcing vs. Insourcing in a cost cutting climate, FM World.
Strickland, L (2012) Cost cutting- a traditional approach to poor financial performance, Focus
Resources.
Taga, K., Opitz, M., Portal, T. and Kuruvilla, T. (2015) Cost reduction in the telecom industry,
Telecom and Media Viewpoint.
The Sutton Trust Research (2014) Internship-Inductive research, UK.
Truman, F. and Bewley, C. (2008) Why not cut pay? Yale University: New Haven.
US Department of Labor, (2016) Overtime for white collar workers- overview and summary of
final rule 2016, Department of Labor: Washington.

51
Verheyen, H. and Guerry, A. (2014) Clustering downward mobility features: working paper.
Vieira, S.J. (2010) The relationship between liquidity and profitability, Umnea University.
Wyk, B. (2012) Post Graduate enrollment and throughput, University of the Western Cape.
Xou, M. and Banchuenvijit, W. (2013) Financial performance of firms listed on the Shanghai
Stock Exchange, University of Thailand: Shanghai.
WEBSITES
Unilever Annual Report, (2014) available at www.unilever.org. accessed (15/09/16)
Parekh, S. (2009) How to turn travel and entertainment spending into an easy source of cost
saving, available at www.preshbusinessthinking.com accesses (14/09/16).
Matt, N. (2012) ways to cut your expenses, grow your bank balance and have money to travel,
available at www.nomadicmatt.com. Accessed (12/09/16).
Greene, I. (2013)7 ways to reduce business travel expenses, available at
www.businessinsight.com accesses (15/09/16)
Deloitte (2016) Cost Reduction: Bridging the gap. Available at www.deloitte.org (accessed
12/09/16).
Bretta, K. (2008) Management Commitment: it’s not all about delegation, available at
www.qualitydigest.com. (accessed 02/09/16).
PSMAS Internal Reports
PSMAS Board meeting minutes (2014)
PSMAS Finance Committee meeting minutes (2013)
PSMAS Financial Statements (2013-2015)

52
APPENDIX I
COVER LETTER
Midlands State University
Department of Accounting
P. Bag 9055
Gweru
19 September, 2016
Dear Sir/Madam
RE: AUTHORIZATION TO CARRY OUT RESEARCH AT YOUR ORGANISATION
I am a final year student at Midlands State University who is studying for the Bachelor of
Commerce Accounting Honours Degree. As a partial fulfilment to my studies, I am required to
carry out a research by the University on a problem area of my choice. My research is based on
the topic “the impact of cost containment strategies on the financial performance of health
insurance firms,” with your organisation as the case study To conduct the research, there is
need for information from finance and audit departments’ staff as well as from members of the
finance committee.
I therefore kindly request assistance from the afore mentioned individuals by way of completing
questionnaires and responding to interview questions for input in my research study. The
information to be gained is entirely for academic purposes and will be guarded with the highest
degree of confidentiality. Your assistance will be sincerely appreciated.
Yours sincerely
Mfarinya Elizabeth

53
APPENDIX II
REQUEST LETTER
Midlands State University
Department of Accounting
P. Bag 9055
Gweru
19 September, 2016
Dear Respondent.
RE: ASSISTANCE WITH FILLING OF QUESTIONNAIRE
May you kindly complete the attached questionnaire by putting ticks in appropriate boxes and
filling in the spaces provided? The information provided will assist in the accomplishment of the
research titled: The impact of cost containment strategies on the financial performance of
health insurance firms. The research is compulsory for the partial fulfillment of my studies for
the Bachelor of Commerce Accounting (Honors) Degree at Midlands State University (MSU).
Information provided will be treated as confidential and will be used for academic purposes only.
Your cooperation will be greatly appreciated.
Yours faithfully
Mfarinya Elizabeth

54
APPENDIX III
QUESTIONNAIRE
Instructions
Answer by ticking in the appropriate box.
Fill in the space where it is provided.
1. The cost containment measures being implemented by PSMAS are:
Cost containment measures
being implemented
Strongly
agree
Agree Indecisive Disagree Strongly
disagree
a. Pay cuts
b. Restructuring
c. Reduction in overtime
spending
d. Retrenchment
2. In your view, the factors that affect the successful implementation of cost containment
strategies are:
Factors Strongly
agree
Agree Indecisive Disagree Strongly
disagree
a. Management Commitment
b. Employee Involvement
c. Accountability
d. Monitoring of progress
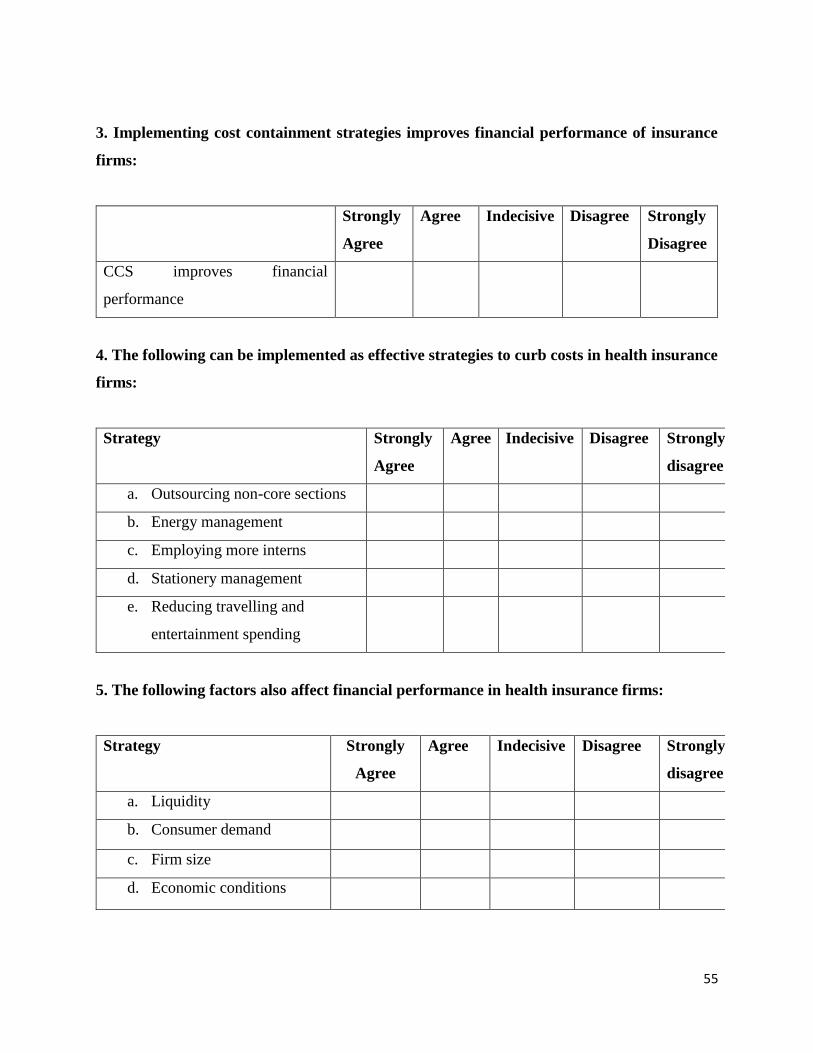
55
3. Implementing cost containment strategies improves financial performance of insurance
firms:
Strongly
Agree
Agree Indecisive Disagree Strongly
Disagree
CCS improves financial
performance
4. The following can be implemented as effective strategies to curb costs in health insurance
firms:
Strategy Strongly
Agree
Agree Indecisive Disagree Strongly
disagree
a. Outsourcing non-core sections
b. Energy management
c. Employing more interns
d. Stationery management
e. Reducing travelling and
entertainment spending
5. The following factors also affect financial performance in health insurance firms:
Strategy Strongly
Agree
Agree Indecisive Disagree Strongly
disagree
a. Liquidity
b. Consumer demand
c. Firm size
d. Economic conditions

56
Additional comments:
……………………………………………………………………………………………………
……………………………………………………………………………………………………
……………………………………………………………………………………………………
………………………………………………………………………………………..
……………………………………………………………………………………………………
……………………………………………………………………………………………..
Thank you for your assistance.

57
APPENDIX IV
INTERVIEW GUIDE
Interview questions
1. What cost containment strategies are being implemented at PSMAS?
2. What factors influence the successful implementation of the strategies?
3. Does implementing cost containment strategies improve financial performance of
insurance firms?
4. What more effective strategies can be implemented to curb costs in the organisation?
5. What other factors also affect the financial performance of health insurance firms?