i Life Support Systems Analysls- nd Technical Trades … Processing Technology Trade ..... V-18 8....
116
NASA Technical Memorandum 109927 _--_- F. /o_P .- m / i ! W i ! ! i ! II i z m B m m m i Life Support Systems Analysls-_nd " Technical Trades for a Lunar OiJtpost ................ December 1994 National Aeronautics and Space Administration https://ntrs.nasa.gov/search.jsp?R=19950016777 2018-05-20T09:46:00+00:00Z
Transcript of i Life Support Systems Analysls- nd Technical Trades … Processing Technology Trade ..... V-18 8....

NASA Technical Memorandum 109927
_--_--__
F.
/o_P .-m/i
!W
i
!!
i!II
izmB
mm
m
i Life Support Systems Analysls-_nd "Technical Trades for a Lunar OiJtpost.........................
December 1994
National Aeronautics and
Space Administration
https://ntrs.nasa.gov/search.jsp?R=19950016777 2018-05-20T09:46:00+00:00Z

m
m
m
m

NASA Technical Memorandum 109927
Life Support Systems Analysis andTechnical Trades for a Lunar Outpost
J. F. FerrallG. B. GanapathiN. K. RohatgiP. K. Seshan
Jet Propulsion Laboratory
Califomia Institute of Technology
Pasadena, CA
National Aeronautics andSpace Administration
Office of Management
Scientific and Technical Information Program
1994


TABLE OF CONTENTS
LIST OF FIGURES ....................... iv
LIST OF TABLES ...................... vi
NOMENCLATURE ........................ vii
EXECUTIVE SUMMARY ..................... ES-I
I. INTRODUCTION ....................... I-I
II. BASELINE SYSTEM DEFINITION FOR TECHNOLOGY TRADES . II-i
i. Metabolic Load Basis .............. II-I
2. Hygiene Load Basis ................ II-4
3. Baseline System Configuration . . . ....... II-4
III. SYSTEM AND MISSION ASSUMPTIONS ............ III-i
i. Life Support System Modeling Assumptions . . . III-i
2. Mission Parameter Definitions and Assumptions . III-2
IV. TECHNOLOGIES ................. IV-I
V. TECHNOLOGY TRADE RESULTS ............... V-I
i. Case Matrix ..................... V-I
2. CO2 Removal Technology Trade ......... V-8
3. CO 2 Reduction Technology Trade .......... V-10
4. 02 Generation Technology Trade .......... V-12
5. Potable HzO Processing Technology Trade ..... V-14
6. Hygiene H20 Processing Technology Trade ...... V-16
7. Urine Processing Technology Trade ......... V-18
8. Solid Waste Treatment Technology Trade ...... V-20
9. Equivalent System Penalty Weight Comparisons . V-26
VI. CONCLUSIONS AND RECOMMENDATIONS ............ VI-I
I. Conclusions ............... VI-i
2. Recommendations ............... . . . VI-6
VII. REFERENCES ..................... VII-I
APPENDIX A
DESCRIPTION OF LiSSA TOOL ............... A-I
APPENDIX B
DESCRIPTIONS AND PROCESS FLOW SCHEMATICS
OF PHYSICAL/CHEMICAL LIFE SUPPORT TECHNOLOGIES .... B-I
iii
_1W'_%'_ PAG[ SLA{'_ NO] FILMED

LIST OF FIGURES
ES-I. Subsystem Weight Comparisons for 90-day Mission . ES-5
ES-2. Subsystem Weight Comparisons for 600-day Mission . ES-5
ES-3. Subsystem Power Comparisons .......... ES-6
ES-4. Equivalent System Weight Comparisons
for Air Revitalization Technologies ES-8
II-l. Baseline Life Support System Configuration ..... II-5
V-I. Total System Weight Comparisons (90-day mission) V-3
V-2. Total System Weight Comparisons (600-day mission) . V-3
V-3. Subsystem Weight Comparisons (90-day mission) ..... V-5
V-4. Subsystem Weight Comparisons (600-day mission) .... V-5
V-5. System Power Comparisons (90- or 600-day mission) . V-7
V-6. Subsystem Power Comparisons (90- or 600-day mission) . V-7
V-7. CO2 Removal Trade Weight Comparisons ........ V-9
V-8. CO 2 Removal Trade Power Comparisons .......... V-9
V-9. CO2 Reduction Trade Weight Comparisons ....... V-11
V-10. CO 2 Reduction Trade Power Comparisons ......... V-f1
V-II. 02 Generation Trade Weight Comparisons ....... V-13
V-12. 02 Generation Trade Power Comparisons ........ V-13
V-13. Potable Water Processing Trade Weight Comparisons V-15
V-14. Potable Water Processing Trade Power Comparisons . V-15
V-15, Hygiene Water Processing Trade Weight Comparisons . V-17
V-16. Hygiene Water Processing Trade Power Comparisons . V-17V-17. Urine Processing Trade Weight Comparisons ...... V-19
V-18. Urine Processing Trade Power Comparisons ..... V-19
V-19. Solid Waste Treatment Trade Weight Comparisons . V-21
V-20. Solid Waste Treatment Trade Power Comparisons .... V-21
V-21. Equivalent System Weight Comparisons:
Air Revitalization Technologies ...... . V-27
V-22. Equivalent System Weight Comparisons:
Water Management Technologies ............ V-29
V-23. Equivalent System Weight Comparisons:
Solid Waste Treatment Technologies ......... V-31
V-24. Equivalent System Weight Comparisons:
Solid Waste Treatment Technologies (90 days) .... V-32
iv
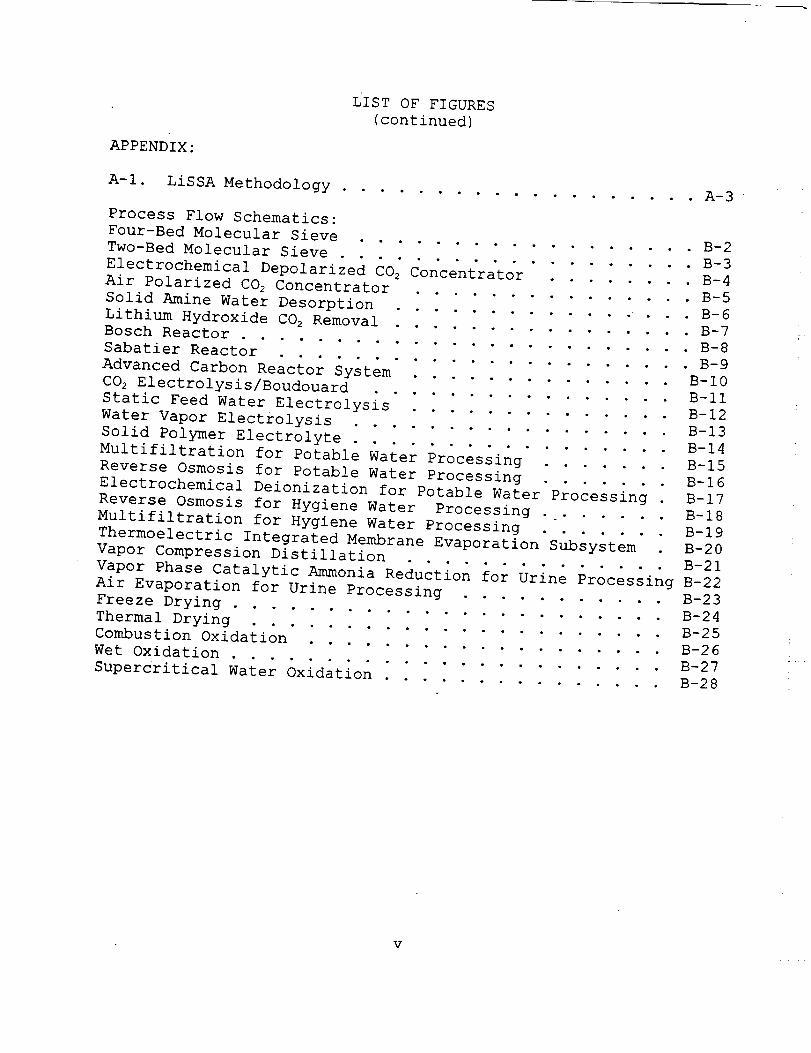
LIST OF FIGURES
(continued)
APPENDIX:
A-I. LiSSA Methodology ........ ......... A-3
Process Flow Schematics:
Four-Bed Molecular Sieve ................. B-2
Two-Bed Molecular Sieve ................. B-3
Electrochemical Depolarized C02 Concentrator ........ B-4
Air Polarized C02 Concentrator ............. B-5
Solid Amine Water Desorption ............. . . . B-6
Lithium Hydroxide C02 Removal .............. B-7
Bosch Reactor ........................ B-8
Sabatier Reactor ..................... B-9
Advanced Carbon Reactor System .............. B-10
CO2 Electrolysis/Boudouard ................ B-II
Static Feed Water Electrolysis .............. B-12
Water Vapor Electrolysis ................. B-13
Solid Polymer Electrolyte ................. B-14
Multifiltration for Potable Water Processing ....... B-15
Reverse Osmosis for Potable Water Processing ....... B-16
Electrochemical Deionization for Potable Water Processing B-17
Reverse Osmosis for Hygiene Water Processing ....... B-18
Multifiltration for Hygiene Water Processing ....... B-19
Thermoelectric Integrated Membrane Evaporation Subsystem . B-20
Vapor Compression Distillation .............. B-21
Vapor Phase Catalytic Ammonia Reduction for Urine Processing B-22
Air Evaporation for Urine Processing ........... B-23
Freeze Drying ...................... B-24
Thermal Drying ..................... B-25Combustion Oxidation ................. B-26
Wet Oxidation ........................ B-27
Supercritical Water Oxidation ............... B-28
V

LIST OF TABLES
ES-I. Case Runs and Technology Choices ....... ES-2
II-l. Metabolic Mass Balance (kg/person-day) ....... II-2
III-l. LiSSA-TT Parameter Choices ............. III-3
III-2. Esf and Its Relation to Number of Storage Tanks . III-4
IV-I. Validity Level Definitions ............. IV-I
IV-2. Air Revitalization Subsystem Technology Data Sources IV-2
IV-3. Water Management Subsystem Technology Data Sources . IV-3
IV-4. Solid Waste Treatment Subsystem
Technology Data Sources .............. IV-3
V-I. Technology Choices ................. V-I
V-2. Metabolic Balance for Crew of 4:
(1.83 food-water-to-dry-food ratio) ...... V-23
V-3. Metabolic Balance for Crew of 4:
(0.01 food-water-to-dry-food ratio) ........ V-25
VI-I. Comparisons of Air Revitalization
Subsystem Technologies ............... VI-3
VI-2. Comparisons of Water Management
Subsystem Technologies ............... VI-4
VI-3. Comparisons of Solid Waste Treatment
Subsystem Technologies .............. VI-5
vi

NOMENCLATURE
2BMS
4BMS
ACRS
AIRE
APC
AR
ASCII
ASPEN PLUS
BL
CLLS
COMB
CO2EL
CO2EL/BD
CPGM
EBSS
EBSSA
EDC
ELDI
ELIOH
ESF
FD
GMFS
GTVO
HABVOL
HW
ICES
JSC
JPL
LiOH
LiSSA
LiSSA-ST
LiSSA-TT
LSS
LTVO
MCL
MCS
MF
MFHW
MFPW
MS FC
OACT
OD
P/C
PCES
Two bed molecular sieve
Four bed molecular sieve
Advanced carbon reactor system
Air evaporator
Air polarized concentratorAir revitalization
American standard Code for information interchange
State-of-the-art chemical process simulation
software program from AspenTech, Inc.Baseline
Closed loop life supportCombustion
CO 2 electrolysis
CO2 electrolysis/Boudouard reactor
Concentrated polluted gas mix
Emergency backup storage specification
Emergency backup storage specification-air
Electrochemical depolarized concentratorElectrochemical deionization
Emergency lithium hydroxide
Exhaust storage factor
Freeze dryingGeneric modular flow schematic
Gaseous trash venting option
Habitation volume
Hygiene waterInternational Conference on Environmental Systems
Johnson Space Center
Jet Propulsion Laboratory
Lithium hydroxide
Life support systems analysis
Life support systems analysis-simulation tool
Life support systems analysis-trade tool
Life support system
Liquid trash venting option
Mission crew loadingMaximum crew size
Multifiltration
Multifiltration hygiene water
Multifiltration potable water
Marshall Space Flight Center
Office of Advanced Concepts and Technology
One-way duration
Physical chemical
Property constant estimation system
vii

PC/LSSPWRLSROROHWROPWRSLRTOPSAESABSAWDSCWOSFE
SFWESPESPELFSSSSFSTDOSWTTDTMDTCSTCCT & HCTIMES
VCDVPCARWMWOXWPWRW.R.T.WVE
Physical chemical life support systemPetable waterRegenerative life supportReverse osmosisReverse osmosis hygiene waterReverse osmosis potable waterResupply launchesResearch and technology objectives and plansSociety of Automotive EngineersSabatierSolid amine water desorptionSupercritical water oxidationSubsystem functional elementStatic feed water electrolysisSolid polymer electrolyteSolid polymer electrolyte-liquid feedSubsystemSpace Station FreedomSolids trash dumping optionSolid waste treatmentThermal dryingTotal mission durationTotal crew size ..........Trace contaminant control
Temperature and humidity control
Thermoelectric integrated membrane evaporation
system
Vapor compression distillation
Vapor phase catalytic ammonia removal
Water managementWet oxidation
Water processing
Water recovery
With respect to
Water vapor electrolysis
viii

EXECUTIVE SUMMARY
The Office of Advanced Concepts and Technology funded thedevelopment of a rigorous systems analysis software tool forphysical-chemical life support. As part of this development, atechnology trade study was conducted to illustrate the use of the
tool. This document presents the results of this study. Such
studies can help break down the mindset that repeatedly commits
enormous resources into a variety of technology hardware - even
up to flight qualification - before performing rigorous systems
analysis. By conducting system and technology trade studies at
every branch of the technology development decision tree, great
savings in resources can be realized.
Life support system and technology trades were performed for a
hypothetical lunar outpost using the NASA/JPL Life Support
Systems _Analysis(LiSSA) software tool. Steady-state material and
energy balance calculations were made using a chemical-process
simulation program called ASPEN PLUS on a one-person, daily
basis. Inputs to the life support simulation model included
metabolic balance load data, hygiene load data, technology
selection, and various assumptions for process operations.
METABOLIC BALANCE AND HYGIENE LOAD BASIS
A metabolic balance was generated based on literature data and
equivalent estimates of chemical formulas for metabolic waste
species. The elemental compositions of the food and waste solids
were specified since models of chemical processing and
transformation require the use of stoichiometric coefficients.
Representative chemical formulas used for food and waste streamsare as follows:
Food protein
Food carbohydrateFood fat
Urine solids
Feces solids
Sweat solids
Wash solids
C4HsON
C6H1206
C16H3202
C2H602N2
C42H69OI3Ns
C13H28013N2
C_3H2BO_3N2.
TECHNOLOGY SELECTION
A baseline set of technologies has been used against which
comparisons have been made. The baseline set was configured into
a system only for the purpose of trade analysis. Twenty-two cases
were run with technology choices substituted for the baseline
technology in Case 1 as shown in Table ES-I. The baseline
ES-I

Table ES-I. Case Runs and Technology Choices
CASE
NO.
L ........
.g (BL)
2
AR SS WM SS SVVT SS
......................[ ...........TH......"--oT................................CO2 CO2 02 , POTABLE YGIENE H2 URINE DRYING OXIDATION
REMOVAL REDUCTION IGENERATIOI_ H20 IPROCESSING]PROCESSING
/ PROCESSINGI |I .... I / I • , I
4BMS BOSCH SF--'3N,E MF RO TIMES ..NON.E NONE
,2BMS
3
,4
5
6
.7
8
9
10
11
12
13
14
15
16iL u
17
18
19
EDC " " "
APC ....I,-
SAWD " " _ "
L!OH NONE "
4BMS SABATIER _ " " "
" ACRS
" CO2E,UBD "17 U I I
" BOSCH WVE " "
" " SPELFi , i , . m
" " SFWE RO "
" " ELDI "if i u i i i i
i .i
i|
w
[i
n
i
u
" " MF MF "ii
" " . RO VCD .
m
i i i, i
i
i ii
VPCAR
AIRE.
TIMES
i .i
FD
TD
2O
21
22
e N
w
w
NONE COMB
WOX
SCWO
ES-2

technologies are:
Air Revitalization (AR) Subsystem:
COz Removal: Four-bed molecular sieve
CO2 Reduction: Bosch
Oz Generation: Static-feed water
electrolysis
Water Management (WM) Subsystem:
Potable Water Processing: Multifiltration
Hygiene Water Processing: Reverse osmosis
Urine Processing: Thermoelectric integrated
membrane evaporation system
Solid Waste Treatment (SWT) Subsystem:
Drying: NoneOxidation: None.
SYSTEM MODELING AND MISSION PARAMETER ASSUMPTIONS
Some of the assumptions used to model the life support system areas follows:
Air Revitalization and Cabin Air:
• Cabin pressure = 1 atmosphere.
• Cabin air maximum temperature = 27 ° C.
• Cabin air minimum temperature = 16 ° C.
• Maximum C02 partial pressure = 2.7 mm Hg.
• The cabin air leakage rate is assumed to be very small
(< 0.001v%/day of the habitable volume).
Water Management and Purity:
• Water processed in potable water processing is assumed
to meet potable water requirements similar to those
established for Space Station Freedom. The total
organic carbon level is on the order of 500 Dg/l.
• Water processed in hygiene water processing is assumed
to meet hygiene water requirements similar to those
established for Space Station Freedom. The total
organic carbon level is on the order of I0,000 _g/l.
• Brines from water processing are not processed by water
management technologies. They are sent to solid waste
treatment if they are to be processed.
Solid Waste Treatment:
• Feeds to solid waste treatment include brines from water
processing and feces from the human habitat. Papers,
kitchen wastes, spent chemical beds, filters, etc. are
sent to trash and are not processed for resource
recovery.
ES-3

=
Z
]
Condensates produced from solid waste treatment must be
polished by hygiene water processing with the exception
of supercritical water oxidation (SCWO): SCWO
condensate is mixed with hygiene water processing
product without polishing.
Mission parameter assumptions are as follows:
Mission crew size
Total mission duration
Resupply launches
Emergency backup supply storage
Use of LiOH canisters for emergencies
Habitat volume (ft 3 per person)
Gaseous trash vent or dump option
Liquid trash vent or dump option
Solid trash dump or store option
4
90 and 600 days0
5 days
yes
1,000
Vent
Vent
Dump
SYSTEM AND SUBSYSTEM WET WEIGHT COMPARISONS
Wet weights for all 22 cases, including a breakdown of
subsystems, are given in Figures ES-I and ES-2 for 90 days and
600 days, respectively. Wet weights include equipment, storage
tanks, and the weight of stored items, such as water. Overall
system weights vary between 3840 kg and 4440 kg for the 90-day
mission and 13,400 kg and 18,400 kg for the 600-day mission. Note
that the cases maintain their relative positions with a few
exceptions. For example, in both the 90- and 600-day missions,
Case i0, which pertains to the use of water vapor electrolysis
technology for 02 generation, shows the minimum weight; however,
Case 22 (supercritical water oxidation for solids waste
treatment) has the maximum weight for the 90-day mission, but
Case 6 (non-regenerative LiOH for CO2 removal), which pertains to
nonregeneration of oxygen, is the heaviest for the 600-day
mission. In general, nonregenerative system/subsystem
configurations would impose increasing weight penalties with
increasing mission duration. The dominance of nonregenerable
supplies is readily seen by a comparison of various subsystem
weights constituting the total system weight. Storage subsystem
weights include the weights of consumables and their containers.
By keeping the crew size the same for both the 90- and 600-day
missions, the differences between the two figures are entirelydue to the effect that mission duration has on the demand for
consumable supplies.
ES-4

SYSTEM COMPARISONS
5000
4500
4000
3500
3000
2500
2000
1500
1000
500
0
WET WEIGHTS OF SUBSYSTEMS
1 2 3 4 5 6 7 8 9 10 11 12 13 14 15 16 17 18 19 20 21 22
..... CASE NO ....
LUNAR OUTPOST: Crew = 4; Mission Duration = 90 days lLOTT REPORT-4-360-90-0-5-0-1000-14-10-1-1-1-BASELINE-1-4BMS(Fig.V-3) I
m STORAGE
r-1 AR SS
OTHER SS
WM SS
===SWT SS
Figure ES-I.
20000
18000
1600O
14000
12000
10000
8000
6000
40OO
2000
01 2
Subsystem Weight Comparisons for
SYSTEM COMPARISONSWET WEIGHTS OF SUBSYSTEMS
90-day Mission
m STORAGE
r-1 ARSS
D OTHER SS
WM SS
m SWT SS
3 4 5 6 7 8 9 10 11 12 13 14 15 16 17 18 19 20 21 22
CASE NO.
1Figure
LUNAR OUTPOST: Crew = 4; Mission Duration = 600 daysLOll" REPORT-4-2400-600-0-5-0-1000-14-10-I-I-I-BASELINE-I-4BMS(Fi_.V-4)
ES-2. Subsystem Weight Comparisons for 600-day Mission
ES-5

SYSTEM AND SUBSYSTEM POWER COMPARISONS
Since the weight of process equipment is independent of mission
duration, the power demand summaries shown in Figure ES-3 are the
same for either 90-day or 600-day missions. The total system
power use ranges from a low of 3760 watts for Case 6 to a high of
7050 watts for Case 18. Cases 18 through 22 are significantly
higher than other cases primarily due to the additional power
required for the added solid waste treatment technologies. It is
clear that for all cases, the air revitalization subsystem is the
largest consumer of power; the water management subsystem is
roughly 1/4 to 1/2 that of the air revitalization subsystem;
oxidation technologies in the solid waste treatment subsystem use
less power than the water management subsystem.
750O70006500600055005000
o3 4500
40003500300025002000150010005OO
0
SYSTEM COMPARISONSPOWER DEMAND OF SUBSYSTEMS
2 3 4 5 6 7 8 9 10 11 12 13 14 15 16 17 18 19 20 21 22CASE NO.
LUNAR OUTPOST: Crew = 4; Mission Duration = 90 daysLOTTREPORT-4-.360.-90-0-5-0--1000-14-10-1-1-1-BASELINE-1-4BMS(Fig.V-6)
BB AR SS
r-7 OTHER SS
m WM SS
BB STORAGE
BBT&HC SS
SWT SS
Figure ES-3. Subsystem Power Comparisons
ES-6

EQUIVALENT SYSTEMPENALTY WEIGHT COMPARIS_
By assigning a weight value to the incremental power required fordifferent life support technologies, an equivalent system weightcan be calculated and compared to the baseline technology used.For this report, a regenerative fuel cell technology has beenassumed using a value of 3 watts/kg for the incremental power.The life support system weight is added to the equivalent powerweight to represent a total equivalent life support weight. Thecombined effects of weight and power penalties and advantagesrelative to the baseline system can be compared. The most
significant advantages were found with air revitalization
technologies as represented in Figure ES-4. The two-bed molecular
sieve shows an advantage of 280 kg; most of these advantages are
attributed to power. C02 electrolysis shows a total equivalent
advantage of 500 kg. Water vapor electrolysis shows a significant
total equivalent advantage of 600 kg. Technologies for water
management and solid waste treatment do not show any total
equivalent advantages. The supercritical water oxidation
technology offers the advantage of reducing potentially hazardous
solids waste in addition to closing the water cycle and producing
an excess of water. For extremely long duration missions of over
1200 days, the supercritical water oxidation technology could
offer an overall equivalent weight advantage over the baseline.
CONCLUSIONS
The trade results presented in this report were obtained in 1993
and do not include new technologies and advances in technologies
beyond 1993. In order to realize the advantages identified by
systems analysis of an immature technology, research and
development investment must be made. During the development,
analysis should be continued to assess technical progress against
past investment and the need for further investment. Conclusions
concerning the best technologies should be revisited following
significant progress in technology development. By this iterative
process of systems analysis and hardware development, the risk of
investing in technology development can be significantly reduced.
.
Regenerative technologies showing significant system weight
advantages include CO 2 electrolysis and water vaporelectrolysis.
Regenerative technologies showing significant system power
advantages include two-bed molecular sieve, electrochemical-
depolarized concentrator, solid amine water desorption, CO 2
electrolysis, and multifiltration for hygiene water.
L
ES-7

SYSTEM WEIGHT PENALTY COMPARISONSEQUIVALENT WEIGHT PENALTY W.R.T. BASELINE AR TECHNOLOGIES
5OOO
40OO
3000
2000
1000
0 _ _ _-"--
-1000
2000
p.--
lOOO E__
0
-1000
750
250
-250
2BMS EDC APC SAWD UOH
CO2 REMOVAL TECHNOLOGY (BASELINE = 4BMS)
7-SAB 84kCRS 9-CO2EL
CO2 REDUCTION TECHNOLOGY (BASELINE = BOSCH)
_JJ__ "ll-tW'ml
L
-750
r-7 System penalty
BB Total equivalent system penalty
m
10-WVE 11 -SPE
02 GENERATION TECHNOLOGY (BASELINE = SFWE)
I]_ Equivalent power penalty @ 3 watts/kg
LUNAR OUTPOST: Crew = 4; Mission Duration = 600 daysLOTT RE PORT-4-2400-600-0-5-0-1000-14-10-I-I-I-BASELINE- 1-4BMS(Fig.V-21)
Figure ES-4. Equivalent System Weight Comparisons
for Air Revitalization Technologies
ES-8

. When power demand is represented in terms of equivalent
weight and added to the system weight, the two-bed molecular
sieve, CO2 electrolysis, and water vapor electrolysis have
advantages over the baseline for long durations.
RECOMMENDATIONS FOR FURTHER WORK
Recommendations based on the results of this analysis are asfollows:
I ,
,
•
4.
.
6.
,
.
As technologies are funded for development, contractors
should be required to generate and report data that can be
utilized for quantitative technology comparisons.
Technology development directions should be aimed at
reducing the weight of resupplies in addition to minimizing
system weight and power demand.
Technology development should be directed to outperform the
current best technology or a selected baseline technology.Basic research should be directed toward identification and
use of lighter construction materials, minimization or
elimination of resupplies, and minimization of power demand.
The effects of process dynamics on technology trades should
be examined thoroughly.
Systems analysis is an iterative and continuing process
throughout the technology development cycle from concept
evaluation to mission readiness. By stepping back again and
again to obtain a system view following technology
selections for further development or mission system design,
systems analysis enables significant cost reductions in
developing, designing and commissioning any complex system.
LiSSA is such an analysis tool for physical- chemical life
support systems.
Life support systems analysis shouldbe extended to include
biological systems and in situ resource utilization systems
so that technologies pertaining to these systems can be
traded for assessment of system impacts. The modular andarchitectural construction of LiSSA lends itself to
performing these trades [Reference ES-I]. In addition,
future trades should include power and propulsion systems to
complete the picture for mission and project planners.
Life support systems analysis using dynamic models and
integrated controllers must be undertaken to assess the
operational impact of technology selections for any given
system•
ES-9

ACKNOWLEDGEMENT
JPL gratefully acknowledges the consistent and committed supportand advocacy provided by Ms. Peggy L. Evanich of NASA/OACT forthis effort, Johnson Space Center for using LiSSA during thedevelopmental phases and providing valuable feedback, and otherswho participated in beta-testing, providing comments andsuggestions. The research described in this report was carriedout at the Jet Propulsion Laboratory, California Institute ofTechnology, Pasadena, California under a contract with theNational Aeronautics and Space Administration.
Reference herein to any specific commercial product, process, or
service by trade name, trademark, manufacturer, or otherwise,
does not constitute or imply its endorsement by the United States
Government or the Jet Propulsion Laboratory, California Institute
of Technology.
I
ES-IO

I. INTRODUCTION
A life support systems analysis tool has been developed at theJet Propulsion Laboratory for the National Aeronautics and SpaceAdministration to enable synthesis and evaluation of system andtechnology options for advanced human missions. The tool iscalled LiSSA, which stands for _ife Support Systems _Analysis.LiSSA consists of two parts: the LiSSA-Simulation Tool (LiSSA-ST)and the LiSSA-Trade Tool (LiSSA-TT). LiSSA-ST models the lifesupport system based on a steady-state, one-person, daily basisin ASPEN PLUS. LiSSA-TT uses data generated from a LiSSA-TTsimulation and mission parameters that are selected in aspreadsheet format (Lotus 1-2-3) to yield system analysisresults. The model and its GMFSarchitecture has been describedin several publications [references I-I through I-7]. A moredetailed description of LiSSA is given in Appendix A. For acomplete description and explanation of how to use LiSSA, the
reader is referred to user and developer manuals [I-8, I-9, and
1-10]. LiSSA uses a modular, top-down hierarchical breakdown of a
physical/chemical closed-loop life support (P/C CLLS) system into
subsystems, and further breakdowns of subsystems into subsystem
functional elements (SFEs); these SFEs can be realized in
hardware by specific processing technologies. This architecture
is called the Generic Modular Flow Schematic (GMFS).
Section II includes a description of a baseline system that will
be used as a reference to compare alternative technologies.Included in this section is a discussion of the derivation of the
metabolic loads used in the life support simulation model. The
metabolic balance is broken down into an elemental balance
including C, H, O, N, and ash for human input and output streams.
A hygiene water load model is presented based on literature
sources. The baseline life support system configuration that is
described in this section does not represent any optimized or
NASA baseline; it is given here for the purpose of making trade
comparisons in this report.
Section III includes assumptions used in all the life support
system modeling in LiSSA-ST. Mission parameter choices are also
given and defined as they are used in the trade model (LiSSA-TT).
In Section IV, the sources of information and the degree of
validity are shown for the various air, water and solid waste
treatment technologies to be traded against their counterpart s in
the baseline system configuration.
I-i

]
In Section V, a case matrix is set up that identifies the
substitution of technologies for the baseline. Comparisons of all
the cases relative to system and subsystem weight and power are
presented in detail, and a system level comparison is discussed.
Technology trade results and short discussions of these results
are provided for carbon dioxide removal, carbon dioxide
reduction, oxygen generation, potable water recovery, hygiene
water recovery, urine water recovery, and solid waste treatment
technologies. Power equivalent weight is given by assuming a
regenerative fuel cell with an equivalent weight of 3 watts/kg.
Overall system equivalent weights, including system weight and
equivalent weight of power, are presented. Results of the effect
of changing the food water content is given also.
Based on these results, some significant conclusions and
recommendations are provided in Section VI.
A list of references cited in the main body of the report is
given in Section VII.
Appendix A includes a brief description of the LiSSA tool.
References to detailed descriptions and uses of LiSSA are given.
Appendix B gives brief process descriptions and schematics of the
technologies used for the trades.
I-2

II. BASELINE SYSTEMDEFINITION FOR TECHNOLOGYTRADES
I. Metabolic Load Basis
A metabolic mass balance has been established and is presented inTable II-l. This balance is the result of combining severalliterature sources into a consistent elemental balance that issufficiently detailed to perform systems analysis using theLiSSA-ST with ASPEN PLUS.
Space Station Freedom [II-l] has established nominal mass valuesfor the following:
METABOLIC INPUTS METABOLIC OUTPUTS
Dry foodWater in foodDrinking waterConsumed oxygen
C02Urine H20Urine SolidsFeces H20Feces solidsRespiration & Perspiration H20Sweat solids
In addition, there is also a nominal value specified by SpaceStation Freedom for metabolic heat release rate.
However, the elemental compositions of the waste solids are not
specified. If chemical processing and transformation (e.g.,
oxidation of feces and urine wastes) are to be performed, this
information must be known. Wydeven[II-2] and Golub[II-3] have
collected chemical compositions of various human waste streams
including trace compounds. However, the data collected is not
correlated to the composition of food ingested by the human crew.
Volk[II-4] presented mass balance relationships by establishing
representative chemical formulas for-food and waste streams asfollows:
Food protein
Food carbohydrateFood fat
Urine solids
Feces solids
Wash solids (no soap)
C4HsON
C6H1206
C16H3202
C2H602N2
C42H69OI3N5
C13H28OI3N2.
II-i

Table II-l. Metabolic Mass Balance
(kg/person-day)
INPUTS
Ill
1. DRY FOOD
Protein, C4HsON
Carbohydrate, C,H,20= .
Fat, C,,H_O=
Minerals, Ash
2. LIQUlpS (WATER)
Drink
Food Preparation
Food Water Content
CARBON HYDROGEN
I m
NITROGEN ASH
,I
TOTALS
I
0.07"70 0.0081 0.0225 0.1332
0.1489 0.0250 0.3723
0.0858 0.0144 0.1145
. o..oo_ o.o_.
o.1_2 ..
0.0884
1.61 O0
0.7900
0.1287 1.15,00
3. G.ASES
Oxygen
INPUT SUMS 0.00950.44480.3118 0.0225
0.8359
5.0155
OXYGEN
0.0257
._0.1984
0.0143
1.4298
0.7016
1.0213
0.8359
4..227o
0.0213
0.0073
0.0099
1.3440
0.0806
2.0429
0.7209
4.227O
ou_rPUTS ....
I. SOLID,W, ASTES , .._
.Urine, C2H,O=N2
Feces, C,_H_OI_N_
Sweat, C!_H_=O,_N2
2. LIQUIDS (WATER) •
Un_ne
0.0160 0.0040 0.0187 0.0077 0.0678.
0.0177 o.oo24 o.oo24 0.0018 0.0318
0.0074 0.0014 0.0013 , O.p200
,. , ,,
o.159_
0.0102Fece,$, , • ,
Sweat & Perspiration .....
3 TGASES r,
_.,s_33
0.908
2.3003
Carbon dioxide 0.2706 0..9915I
OUTPUT SUMS 0.3,118 0.4448 I 0.0225. 0..0095 5.0155
II-2

These representative formulas were developed to account for the
major elements, C, H, N, and O found in human and biological
components (e.g., edible and inedible plants). The elemental
compositions were necessary to estimate oxygen requirements in a
waste processor that would oxidize human and plant wastes. Thesefood and waste chemical formulas have been used as indicated in
Table II-l. These compounds were used in the LiSSA-ST using the
Property Constant Estimation System (PCES) of the chemical
process simulation package called ASPEN PLUS.
In addition to the elements C,H,N, and O, other elements
appearing in human wastes include P, S, Ca, Mg, K, and others.
These elements are all treated as ash, which is taken in with the
food and rejected as ash wastes. In the LiSSA-ST modeling, these
ash constituents will be distributed as 80% leaving with urine
solids and 20% leaving with feces solids. The relative ash
distribution was based on elemental compositions of freeze-dried
urine and feces (II-2).
Trace compounds, such as alcohols, ammonia, and methane generated
by the human metabolic function, could significantly affect the
sizing of trace contaminant control units and other processes
interacting with them. These compounds would also impose
consumable demands associated with processes for their removal.
LiSSA uses reasonable estimates for the anticipated levels of
release of these compounds into the human habitat without any
explicit correlation with the composition of ingested food.
II-3

2. Hygiene Load Basis
Hygiene water use and waste load estimates based on referenceII-2 are as follows for a 1 person-day basis:
Z_
_Z
Water Use: (kg)
Oral hygiene H20
Hand/face Wash H20
Shower H20
Clothes wash H20
Dish wash H20
Flush H20
Waste Loads:
Hygiene H20
Latent hygiene H20
Clothes wash H20
Latent clothes wash H20
Dish wash H20
Latent dish wash H20
Flush H20
0.36
1.81
5.44
12.47
5.44
0.49
26.01
7.17
0.44
11.87
0.60
5.41
0.03
0.49
26.01
3. Baseline System Configuration
In order to perform technology trades, a baseline system to trade
against was chosen. Baseline technologies in this report are not
baselined identically in any known life support system design nor
do they represent an optimal system configuration. They have been
arbitrarily chosen as representatives of the technology functions
constituting a physical-chemical life support system. Figure II-i
shows the baseline system.
II-4

BASEUNELSSCONFIGURATION
AIR H.__T AIR
+'=""'=" 1 " +22 27
i HUMIDITY CONTROL AIRCOOLING AIRClRCULA_ONSUBSYSTEM
AIR CONDENSATE AIR
AIR C.X_2 C CO2 H2AIR 1-12 02
+ 33 34 35 37 !
i ........ I REMOVAL REDUCTION I CONTROL I t GENERATION [ +
r " 7 '+_.................................................. : ............................ -..,..2._:....................................................................................... : ................J
AIR CONDENSATE PURGE AIR H20GASES,CPGM
POTABLE HYGIENE WASH HYGIENEH20 H20 H20 H20
is_s___.,._............................!_.._Mt__....J.......!._.l_.._:_o.......i..!.._.!_...l_:_._E_._.:_l._.!...........................................iCONDENSATE WASH BRINE URINE BRINE
H20
CONDENSATE TRASH GASES CONDENSATE CPGM
.................._.............................___.........................._...................................................._....................__..................................+i SOUD WASTE ,_ iim_mE_r I OR_,NGt I • O×,O_,ONI +
FECES BRINE 02 FECES BRINE
Figure II-l. Baseline Life Support System Configuration
II-5


III. SYSTEM AND MISSION ASSUMPTIONS
i. Life Support System Modeling Assumptions
Assumptions used in the life support simulation are as follows:
Air Revitalization and Cabin Air:
• Cabin pressure = 1 atmosphere.
• Cabin air maximum temperature = 27°C.
• Cabin air minimum temperature = 16°C.
• Maximum CO 2 partial pressure = 2.7 mm Hg.
• All CO2 recovered from CO2 removal is sent to CO2reduction.
• Oxygen used in the life support system is generated via
water electrolysis.
• Potable water purity levels are required for 02 generation
via electrolysis.• Trace contaminants in the cabin air are assumed to be
equivalent to methane and ethanol as they impact the
oxygen required for catalytic oxidation in the trace
contaminant control process.
• The cabin air leakage rate is assumed to be very small
(0.0005 kg/day).
Water Management and Purity:
• Water processed in potable water processing is assumed to
meet potable water requirements similar to those
established for Space Station Freedom. The total organic
carbon level is on the order of 500 _g/l.
• Water recovered as cabin air condensate and process
condensates is routed to potable water processing.
• Water recovered as hygiene wash water wastes is routed to
hygiene water processing.
• Water processed in hygiene water processing is assumed to
meet hygiene water requirements similar to those
established for Space Station Freedom. The total organic
carbon level is on the order of I0,000 zg/l.
• Water recovered from urine processing is mixed with water
from wash water processing to make hygiene water. It is
assumed that the combined quality of product water from
hygiene water processing and urine processing meets the
hygiene water purity requirements.
• Brines from water processing are not processed by water
management technologies. They are sent to solid waste
treatment if they are to be processed.
• The life support system will process all water streams
III-I

L
that are available regardless of the requirement of
potable and hygiene water required. In some cases, this
leads to an excess of potable and/or hygiene water. Excess
potable water (i.e., water produced in excess of the
hygiene water requirement) is used for hygiene water; if
excess hygiene water is produced, it is sent to trash
storage or dumped.
Solid Waste Treatment:
Feeds to solid waste treatment include brines from water
processing and feces from the human habitat. Papers,
kitchen wastes, spent chemical beds, filters, etc. are
sent to trash and are not processed for resource recovery.
Condensates produced from solid waste treatment must be
polished by hygiene water processing with the exception of
supercritical water oxidation: its condensate is mixed
with hygiene water processing product without polishing.
2. Mission Parameter Definitions and Assumptions
Mission parameters chosen are given in Table III-i and aredefined as follows:
MAXIMUM CREW SIZE (MCS) is the maximum number of people that
would occupy the human habitat at any time during the mission.
This number is required to size the processing equipment.
MISSION CREW LOADING (MCL) is the sum of the products of crew
size and corresponding durations spent in the human habitat
during the mission. For example, during a 100-day mission, if a
crew of four occupy the habitat for 25 days and a crew of two for
75 days, the crew loading for the entire 90-day mission would be
250 person-days(4x25 + 2x75). MCL can never exceed the product ofmaximum crew size and total mission duration.
TOTAL MISSION DURATION (TMD) is calculated as the sum of one-way,
return and planetary surface duration quantities in days.
RESUPPLY LAUNCHES (RSL) is set to zero for no follow-on launches
for resupply, as it is assumed that the lunar outpost is
completely supplied at the beginning of its mission for the total
mission duration. Resupply includes all materials that will not
be regenerated by the life support system including provisions
for leakage and emergencies.
HABITAT VOLUME (HABVOL) is the value for habitat volume per
person in cubic meters.
III-2

Table III-l. LiSSA-TT Parameter Choices
PARAMETER
Mission crew size
Mission crew length
LISSA-TT VARIABLE NAME
1
MCS
MCL
VALUE
4"g0 and 4°600 (<=MCS'MCL)
Total mission duration TMD 90 and 600
Resupply bunches RSL 0
Emergency backup supply storage EBSS 5(da)'s),
Use of LiOH canisters for emergencies ELIOH 1(1--yes, 0=no)
EBSSA 0Emergency backup supply storage for airif air used rather than t.iOH (hrs)
Habitat volume (m' per prson)
Leak fraction (=fraction of HABVOL x10') ,.
Exhaust storage factor (%)
Gaseous trash venting option (vent= 1 orstore=0)
,HABVOL
LEAKFRAC
ESF 10
GTVO
LTVO
STDO
Liquid trash venting option(vent=l or store=0)
Solids trash dumping option(dumP=l or store=o)
28.3 (1000 _)
0.000014
EMERGENCY BACKUP STORAGE SPECIFICATION (EBSS)is the amount of
emergency backup storage of regenerated materials, except air, in
number of days required to handle the longest life support system
emergency anticipated for the mission. Additional storage will be
accounted for the various materials in the storage subsystem in
proportion to this number.
EMERGENCY LITHIUM HYDROXIDE (ELIOH) is set to 1 in this study to
specify the use of lithium hydroxide sorption technology for
emergency CO2 removal. This is in addition to the selection of
nonregenerative LiOH technology or any other technology for
continual CO2 removal.
EMERGENCY BACKUP STORAGE SPECIFICATION-AIR (EBSSA) is specified
in hours instead of days, as an option to supply fresh air and
vent cabin air during emergencies pertaining to CO2 removal. This
specification will be disregarded if is set to I.
III-3

HABITAT LEAKAGE FRACTION (LEAKFKAC) is the fraction of thehabitat volume that is leaked per day to space.
EXHAUST STORAGEFACTOR (ESF) provides for the distribution ofmaterials stored in a number of identical storage tanks orcontainers to enable reuse of supply storage tanks for wastestorage. ESF is specified in this study to be 10%. The use of ESFis illustrated in Table III-2.
The gaseous trash venting option (GTVO), liquid trash ventingoption (LTVO), and solids trash dumping option (STDO) are set inthis study such that gaseous, liquid, and solid trash streams arevented or dumped rather than stored. Hence, there will not be anystorage requirements for these trash streams.
Table III-2. ESF and Its Relation to Number of Storage Tanks
ESF
0
100
5O
10
Number of identical storage tanks for
supplyand waste/trashI I|I I
ONEThis is impractical, since wastes haveto be stored in same tank as freshsupplies. Total storage volume is100% of the required volume.
TWOOne tank to contain fresh supplies andone tank to store wastes. Totalstorage volume is 200% of therequired volume.
THREETwo tanks to contain fresh suppliesand one tank empty atthe start of themission. Two tanks to contain wastesand one tank empty atthe end of themission. Total storage volume is150% of the required volume.
ELEVENTen small tanks to contain freshsupplies and one empty tank at thestart of the mission. Ten tanks to!contain wastes and one tank empty at[the end of the mission. Total storagevolume is 110% the required volume.
111-4

IV. TECHNOLOGIES
Technologies are grouped as subsystem functional elements (SFEs)within subsystems. The SFE functions traded in this study includeCO2removal, CO2 reduction, and 02 generation for the airrevitalization(AR) subsystem; potable water (PW) processing,hygiene water (HW) processing, and urine processing for the watermanagement (WM) subsystem; and drying and oxidation for the solidwaste treatment (SWT) subsystem. Data sources for technologiesincluded in this report are included in this section in TablesIV-2, IV-3, and IV-4. Technology developer companies and contactsare listed wherever applicable. If no contact was available, thedata from references was utilized. Also, a "validity level," asdescribed in Table IV-I below, is attributed to each technologybased on the authors' judgement. This validity level can beviewed as a relative uncertainty associated with the data foreach technology. Scale-up formulas used to calculate the wet
weight, dry weight, power, and volume of each technology is
included in the LiSSA-TT spreadsheet. The methodology of scale-uphas been described in reference IV-I. Brief functional
descriptions and schematics of each technology included in this
report can be found in Appendix B.
Table IV-I. Validity Level Definitions
VALIDITYLEVEL
2
3
4
5
6
7
DESCRIPTION
Measurement
Calculated from a dimensioned drawing with knownmaterials of construction
Estimated from scaling procedure using data from 1 and/or 2above
Estimated from high validity data for similar equipment
Estimated from detailed paper design for nonexistent hardware
Unvalidated third part), estimates
"Engineering judgement"
IV-I

Table IV-2. Air Revitalization Subsystem Technology DataSources
SFE TECHNOLOGY COMPANY/CONTACT
AirResearch/Mr. Scott Manatt
REF.NO.
CO2 Removal 4BMS IVo2, 3IV-3
" " 2BMS AirResearch/ IV-2 4Mr. Scott Manatt
. n 4EDC
APCu m
1
" " SAWD
" " LiOH
CO2 Reduction Bosch
" Sabatier
" ACRS
" " CO2EL/SD
02 Generation SFWES
WVE
Life Systems/Dr. Chin I_in (NASA-JSC); Ph: (713)-483-9126
Life Systems/Dr. Chin Un (NASA-JSC); Ph: (713)-483-9126
Hamilton Standard/Mr. Jeff Faszcza
Ph: (203)-654-3350
Hamilton Standard/Mr. Jeff Faszcza
Ph: (203}:654-3350
Life Systems/Mr. Paul Weiland MSFCPh: (205)-544-7215
Hamilton Standard/Mr. Jeff FaszczaPh: (203)-654-,3350
Hamilton Standard/Mr. Jeff Faszcza
Ph: (203)-654-3350 ,,.
Westinghouse /Dr. Chin Un (NASA-JSC)Ph: (713)-483-9126
Life Systems/Mr. Paul Weiland MSFCPh: (2.05)-544-7215 ,,
Hamilton Standard/Mr. Jeff Faszcza
Ph: (203)-654-3350
SPELF
IV-3,IV-4
1%'-3, 71%'-4
IV-3 7
IV-5 3
,,,,,
IV-3, 3IV-4
IV-3, 3IV-4
IV-3, 4IV-4 -
IV-2 7
IV-3, 3IV-4
IV-2 7
IV-3,IV-4
VALIDITYLEVEL
IV-2

Table IV-3. Water Management Subsystem Technology Data Sources
SFE
Potable H20
Processing
TECHNOLOGY
I
MF
RO
ELDI
Hygiene H20 ROProcessing
" " MF
Urine Processing TIMES
" VCD
" " VPCAR
COMPANY/CONTACT
Hamilton Standard/Mr. Jeff Faszcza
Ph: (203)-654-3350
Hamilton Standard/Mr. Jeff FaszczaPh: (203)-654-3350
Hamilton Standard/Mr. Jeff FaszczaPh: (203)-654-3350
Hamilton Standard/Mr. Jeff Faszcza
Ph: (203)-654-33_0
Hamilton Standard/Mr. Jeff Faszcza
Ph: (203)-654-3350 ,.
Life Systerns/Mr. Paul Weiland MSFCPh: (205)-544-7215
REF.NO.
VALIDITYLEVEL
IV-2, 3IV-3
1%'-2 3
IV-2 7
IV-3,IV-4
IV-3
IV-3, 3IV-4
IV-3, 3IV-4
7IV-3,IV-4
m
" " AIRE -- IV-2 7
Table IV-4. Solid Waste Treatment Subsystem
Sources
Technology Data
SFE
Drying
=
TECHNOLOGY
FD
COMPANY/CONTACT
Labconco Corp.
REF.NO.
IV_
TD -- IV-7 7
Oxidation COMB -- IV-8, 7IV-9
" WOX -- IV-9, 7IV-10
" SCWO 7MODAR,Inc./Glenn Hongph.(508) 965-2920
IV-l,IV-9,IV-11,IV-12
VALIDITYLEVEL
IV-3


V. TECHNOLOGYTRADE RESULTS
I. Case Matrix
Twenty-two cases were run with technology choices substitu£ed forthe baseline technology, as identified in Table V-l:
Table V-I. Technology Choices
CASE
NO.
AR SS WM SS SWT SS
....ZT--T---co-;..... .... .....REMOVAL | REDUCTN. H20 [ H20 PROC.
/ PROC. I PROC.II I I
1 4BMS BOSCH SFWE M F RO TIMES NONE NONE
2 2BMS ....
3 E.DC " " " " "
4 APC .......
5 SAWD
6
7
8
9
10
11
12
13
14
is
16
17
18
19
LIOH
4BMS
N,ONE, " " ,, "
SABATIER ......
" t ACRS" CO2EL/BD
" BOSCHF
w u
w •
w m
=,
WVE
SPELF " "i •
SFWE RO "
ELDIi,
,MF MF
" RO VCD
w w
ii
• w
u
M
VPCAR
AIRE
TIMES FD
TD
2O
21.
22
! • NONE COMB
• " WOX
• " SCWO
V-1

System Weight Comparisons:
The results of the technology substitutions in terms of system
wet weights for the 22 cases are presented in Figures V-I and V-2
for mission durations of 90 days and 600 days. The impact of
technology substitutions on subsystem wet weights are shown in
Figures V-3 and V-4. Similar comparisons in terms of overall
system power demand and subsystem power demand are shown in
Figures V-5 and V-6, respectively.
Overall system weights vary between 3840 kg and 4440 kg for the
90-day mission and from 13,400 kg to 18,400 kg for the 600-day
mission, as seen in Figures V-I and V-2, respectively. Note that
the cases maintain their relative positions with a few
exceptions. For example, in both the 90-day mission and 600-day
missions, Case I0, which pertains to the use of water vapor
electrolysis technology for 02 generation, shows the minimum
weight; however, Case 22 (supercritical water oxidation for
solids waste treatment) has the maximum weight for the 90-day
mission, but Case 6 (nonregenerative LiOH for C02 removal), which
pertains to nonregeneration of oxygen, is the heaviest for the
600-day mission. In general, nonregenerative system/subsystem
configurations would impose increasing weight penalties with
increasing mission duration. On the other hand, Case 7, which
provides for the regeneration of oxygen using Sabatier technology
to recover 02 in the form of condensate from CO2,turns out to be
the second heaviest system as the mission duration is increased
to 600 days. This is due to the need to trash hydrogen in the
form of methane and the consequent need to store water to provide
for this continual trashing operation (water is used to generate
hydrogen and oxygen in the oxygen generation SFE). As mission
duration is increased, the weight of consumable supplies to be
stored at the start of the mission increasingly dominates over
process equipment weight.
V-2

SYSTEM COMPARISONS 1WET WEIGHTS OF TOTAL SYSTEMS I4600
4400 f
4200
'°°°il38o0
1 2 3 4 5 6 7 8 9 10 11 12 13 14 15 16 17 18 19 20 21 22CASE NO.
I LUNAR OUTPOST: Crew = 4; Mission Duration = 90 days 1LOTT REPORT-4-360-90-0-5-0-1000-14-10-1-1-1-BASELINE- 1-4BMS(Fig.V-1) I
Figure V-I. Total System Weight Comparisons (90-day mission)
20000
18000
16000
14000
12000
10000
SYSTEM COMPARISONSWET WEIGHTS OF TOTAL SYSTEMS
t
I .... r !t i , '
I
I
Ilil i il,li iijitili1 2 3 4 5 6 7 8 9 10 11 12 13 14 15 16 17 18 19 20 21 22
CASE NO.
|
LUNAR OUTPOST: Crew = 4; Mission Duration = 600 days ILOTT REPORT-4-2400-600-0-5-O-1000-14-10-1-1-1-BASELINE-1-4BMS(Fig.V-2) I
Figure V-2. Total System Weight Comparisons (600-day mission)
V-3

Subsystem Weight Comparisons:
The dominance of nonregenerable supplies is readily seen by a
comparison of various subsystem weights constituting the total
system weight as shown in Figures V-3 and V-4. In these figures,
storage subsystem weights include the weights of consumables and
their containers. By keeping the crew size the same for both the
90- and 600-day missions, the differences between the two figures
are entirely due to differences in the demand for consumable
supplies. The weight of process equipment, being a function of
crew size and independent of mission duration, is the same for
the two figures.
V-4

5O00
4500
4000
3500
3000
O 2500v'
2000
1500
1000
500
0
SYSTEM COMPARISONS lWET WEIGHTS OF SUBSYSTEMS
1 2 3 4 5 6 7 8 9 10 11 12 13 14 15 16 17 18 19 20 21 22
, CASE NO.
LUNAR OUTPOST: Crew = 4; Mission Duration = 90 days ILOTT REPORT-4-360-90-0-5-0-1000-14-10-1-1-1-BASELINE-I..4B MS(Fig.V-3) I
BB STORAGE
r-7 AR SS
i OTHER SS
WM SS
I sw-r ss
Figure V-3.
20000
18000
16000
14000
1200O
10000
8000
6O00
4OO0
2000
0
1 2
Subsystem Weight Comparisons (90-day mission)
SYSTEM COMPARISONSWET WEIGHTS OF SUBSYSTEMS
ii STORAGE
1_ AR SS
m OTHER SS
WM SS
IB svv-r ss
3 4 5 6 7 8 9 10 11 12 13 14 15 16 17 18 t9 20 21 22
CASE NO.
LUNAR OUTPOST: Crew = 4; Mission Duration = 600 days ILOTT REPORT-4-2400-600-0-5-0-1000-14-10-1-1 - 1-BASELINE-1-4BMS(Fig.V..4) I
Figure V-4. Subsystem Weight Comparisons (600-day mission)
V-5

7
System and Subsystem Power Comparisons:
Since process equipment is identical with respect to mission
duration, the power demand summaries shown in Figures V-5 and V-6
are identical for either 90-day or 600-day missions. Figure V-5
gives a total system power comparison, while Figure V-6 shows
individual subsystem power comparisons. The total system power
use ranges from a low of 3760 watts for Case 6 to a high of 7050
watts for Case 18. Cases 18 through 22 are significantly higher
than other cases primarily due to the additional power required
for the added solid waste treatment technologies. From Figure V-
6, it is clear that for all cases, the air revitalization (AR)
subsystem is the largest consumer of power. The water management
(WM) subsystem is roughly 1/4 to 1/2 that of the AR subsystem;
oxidation technologies in the solid waste treatment subsystem use
less power than the WM subsystem.
V-6

7800
7400
7000
6600
6200
5800
, 54005000
4600
4200
3800
3400
3000
SYSTEM COMPARISONS
7500
7000
6500
6000
5500
5000
o9 4500
40003500
3000
2500
2000
1500
1000
500
0
POWER DEMAND OF TOTAL SYSTEMS
1 2 3 4 5 6 7 8 9 10 11 12 13 14 15 16 17 18 19 20 21 22
CASE NO.
LUNAR OUTPOST: Crew = 4; Mission Duration = 90 days _, LOll" REPORT-4-360-g0-0-5-0-1000-14-10-1-1-1-BASELINE-1-4B MS(Fig.V-5) I
Figure V-5. System Power Comparisons (90- or 600-day mission)
SYSTEM COMPARISONSPOWER DEMAND OF SUBSYSTEMS
1 2 3 4 5 6 7 8 9 10 11 12 13 14 15 16 17 18 19 20 2t 22
CASE NO.
LUNAR OUTPOST: Crew = 4; Mission Duration = 90 days ILOTr REPORT-4-360-90-O-5-0-1000-14-10-1-1-1-BASELINE-1-4BMS(Fi_I.V4 ) I
i AR SS
r--] OTHER SS
_'_ WM SS
i STORAGE
I T&HC SS
a SWT SS
Figure V-6. Subsystem Power Comparisons (90- or 600-day mission)
V-7

2. CO2 Removal Technology Trade
Six different technologies were included, as shown in Figure V-7
for wet weight and Figure V-8 for electrical power demand. These
figures illustrate the impact of technology substitution on the
various subsystems and the entire system: while a technology
candidate can show significant weight or power advantages over
other candidates at that functional level (e.g., CO2 removal),
the advantage may not be maintained through the subsystem (e.g.,air revitalization) and through the entire life support system.
The wet weights of various systems considered for comparison of
CO2 removal technologies could differ by as much as 340 kg (for
the 90-day mission) primarily due to differences in the demand
for stored supplies and in the weight of process equipment.
Differences in process equipment weights for the various CO2
removal technologies are on the order of 100-300 kg. In addition
to their impact on the AR subsystem, even the WM subsystem
weights are seen to be affected somewhat by the choice of CO2
removal technology. Such interactions between different
subsystems cannot be recognized quantitatively by comparing the
weight, power demand, etc. of individual technologies by
themselves. For example, the solid amine water desorption (SAWD)
process puts steam into the cabin air, which is condensed and thecondensate becomes an additional load on the hygiene water
processing unit, thereby increasing its weight and power demand.Because of the increased throughput, any nonregenerable chemicals
used by hygiene water processing also increases and can beaccounted for in the increased storage subsystem weight. The LiOH
CO2 removal technology is for nonregenerative capture of C02. The
weight of the LiOH sorption equipment itself is small compared to
the other regenerative C02 removal process units. However, since
the process is nonregenerable, there is a high demand for LiOH
canisters (as seen in the storage subsystem weight), which is
directly proportional to crew size and mission duration.
Subsystem power demands also show significant differences. The
power demand for the various CO2 removal technologies is less by
hundreds of watts compared to the baseline four-bed molecular
sieve (4BMS) with the exception of the air polarized concentrator
(APC). Even though the electrochemical depolarized concentrator
(EDC) shows a marked decrease in power demand for the CO 2 removal
SFE, the power advantage does not carry through exactly into the
AR subsystem. EDC adversely affects the AR subsystem by requiring
additional H2 generation and thus increasing the size,
throughput, and power demand on the water electrolysis unit. LiOH
requires the minimum power for the SFE, AR subsystem, and the
overall system since the LiOH technology has low power and the
C02 reduction process is eliminated.
V-8

t CO2 REMOVAL TRADESWET WEIGHT COMPARISONS W.R.T. BASELINE
3500
3000
2500
2000
1500
1000
500
0
CO2 REMOVAL SFE
¢n ARSS
m+ WM SS
=¢ STORAGE S$
1-4BMS 2-2BMS 3-EDC 4-APC 5-SAWD 6-LIOH
CASE/TECHNOLOGY
LUNAR OUTPOST: Crew = 4; Mission Duration = 90 days lLOTT REPORT-4-360-90-0-5-0-1000-14-10-1-1-1-BASELINE-I-4BMS(Fig.V-7 X
Figure V-7. CO 2 Removal Trade Weight Comparisons
CO2 REMOVAL TRADES IPOWER COMPARISONS W.R.T. BASELINE
3000
250O
20001500
1000
5O0
0
1-4BMS 2-2BMS 3-EDC 4-APC 5-SAWD 6-LIOH
CASE/TECHNOLOGY
I LUNAR OUTPOST: Crew = 4; Mission Duration = 90 days /LOTT RE PORT-4-360-90-0-5--0-1000-14-1 0-1-t-1-BASELINE-1-4BMS(Fig.V.-8_
f'_ CO2 REMOVALSFE
_m ARSS
mWMSS
Figure V-8. CO 2 Removal Trade Power Comparisons
V-9

3. C02 Reduction Technology Trade
The baseline uses Bosch technology to recover 02 as water
condensate and is compared for subsystem weights and power
demands to the Sabatier advanced carbon removal system (ACRS),
and the C_ electrolysis/Boudouard (CO2EL/BD or CO2EL) process in
Figures V-9 and V-10, respectively. The technology choice here
has no intersubsystem impact except for the storage subsystem.
The simplest of the four processes in terms of weight and power
is the Sabatier process, which catalytically converts all of the
CO 2 in its feed to CH4 by reacting with H2. However, the H2
requirement places an additional burden on the 02 generation SFE
of the AR subsystem, thereby losing its advantage over other
technologies. Since the CH 4 produced by Sabatier technology is
vented as trash, the associated H2 loss must be supplied by
additional storage of hydrogen or preferably water, which is
reflected in the higher storage subsystem weight. For the
baseline system, using Bosch, there is a net requirement of 0.8
kg per day of makeup water for a crew of 4; with the Sabatier
process, this makeup water increases to 3.7 kg per day. However,
the Bosch process also requires chemical supplies in the form of
canisters to collect the carbon formed in the process. These
canisters account for 0.5 kg per day. Hence, the net consumables
difference per day between the Sabatier and the Bosch processes
is 2.4 kg, which amounts to over 200 kg for a 90-day mission.
Another way of configuring the system with the Sabatier process
would be to convert only part of the CO2 produced. This scheme
would take only available H2 created from the 02 generation SFE
due to metabolic 02 requirements. This would reduce the size of
the 02 generation unit significantly as the stoichiometric ratio
of HJCO2 requirement for Bosch is 2 and for Sabatier is 4 for
complete C02 reduction. The impact would significantly affect the
power requirements for the CO 2 reduction and H20 electrolysis
processes.
The ACRS and CO2EL processes show results comparable to the
baseline Bosch process in terms of weight; ACRS shows slightly
higher power than Bosch for both the SFE and AR subsystem, while
CO2EL shows a higher SFE power but a slightly lower AR subsystem
power.
V-lO

tCO2 REDUCTION TRADESWET WEIGHT COMPARISONS W.R.T. BASELINE
3500
3000
2500
2000
1500
1000
500
01-BOSCH 7-SAB 8-ACRS 9-CO2EL
CASE/TECHNOLOGY
LUNAR OUTPOST: Crew = 4; Mission Duration = 90 days }LO'I-F REPORT-4-360-90-0-5-0-1000-14-10-I-I-I-BASELINE- 1-4BMS(Fig .V-9)J
/
1_ CO2 REDUCTION SFE
m ARSS
¢_ WM SS
STORAGE SS
Figure V-9. CO 2 Reduction Trade Weight
POWER COMPARISONS W.R.T. BASELINE
3ooo ! ,,2500
i 20001500
1000
5O0
0
1-BOSCH 7-SAB 8-ACRS 9-CO2EL
CASE/TECHNOLOGY
Comparisons
LUNAR OUTPOST: Crew = 4; Mission Duration = 90 days /LOTT REPORT-4-360-90-0-5-0-1000-14-10-1-1-1-BASELINE-1-4BMS(Fig.10_
C3 CO2 REDUCTION SFE
mARSS
_WMSS
Figure V-10. C02 Reduction Trade Power Comparisons
V-If

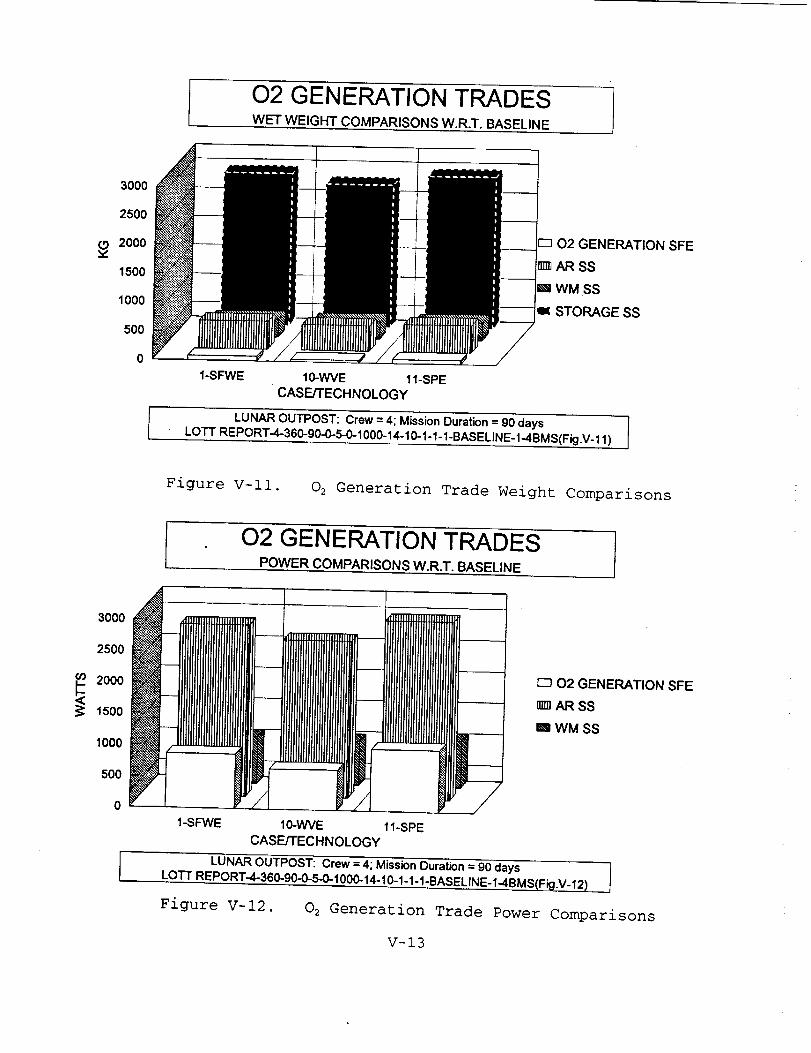
4. 02 Generation Technology Trade
The 02 generation subsystem functional element uses the static
feed water electrolysis (SFWE) process as its baseline. SFWE is
compared to the subsystem weight and power parameters for water
vapor electrolysis (WVE) and solid polymer electrolyte liquid
feed (SPE) in Figures V-II and V-12.
SFWE and SPE compare closely both in weight and power demand,
with SFWE having only a slight advantage due to the lower weight
and power demands at the SFE level. However, the WVE affects both
the WM and storage subsystems because the WVE process draws water
out of the cabin air and then electrolyzes the H20 to H 2 and 02.
This avoids the condensation of atmospheric moisture and the
subsequent cleaning of condensate water to standards of purity
required for electrolysis. The net effect is to reduce the
magnitude of condensate processing imposed on the WM subsystem
and thereby reducing the WM subsystem weight, power, and chemical
supplies by that required for condensate treatment. This then
results in the lowest overall system weight as shown in Figures
V-I (90 days) and V-2 (600 days).
The comparison of power demand numbers shows that WVE results in
significantly lower overall system power by over 200 watts. The
primary reduction is seen at the 02 generation SFE level. A
slight reduction is also realized in the WM subsystem.
V-12
02 GENERATION TRADESWET WEIGHT COMPARISONS W.R.T. BASELINE
3000
2500
2000
1500
1000
500
0
1-SFWE IO-WVE 11-SPE
CASE/TECHNOLOGY
r"-I 02 GENERATION SFE
n_ AR SS
i WM SS
111STORAGE SS
LUNAR OUTPOST: Crew = 4; Mission Duration = 90 days 1LO'rT REPORT-4-360-90.0.5-0.1000.14-10.1-1-1-BASELINE-1-4BMS(Fig.V-11) I
Figure V-II. 02 Generation Trade Weight Comparisons
3OOO
25O0
2000
1500
1000
5OO
0
02 GENERATION TRADESPOWER COMPARISONS W.R.T. BASELINE
1-SFWE 10-WVE
CASE/TECHNOLOGY
lllll[llllllllllllilllllIlllllIllIIllIII11-SPE
t-7 02 GENERATION SFE
_m ARSS
m WM SS
LUNAR OUTPOST: Crew = 4; Mission Duration = 90 days I
LOTT RE PORT-4-360-90.0-5-0-1000-14-10-1-1-1 -BASELINE-1-4B MS(Fig.V- 12) I
Figure V-12. 02 Generation Trade Power Comparisons
V-13

5. Potable H20 Processing Technology Trade
The subsystem functional element for potable water recovery uses
multifiltration for potable water(MFPW or MF) as its baseline
which is compared to the subsystem weights and power of reverse
osmosis for potable water (ROPW or RO) and electrochemical
deionization (ELDI) in Figures V-13 and V-14.
RO and ELDI recover less water (~90%) compared to the baseline
value of 99.99%, thereby showing a higher storage subsystem
weight to carry the extra makeup water not recovered; this
represents about a 2 kg per day difference in water. However, the
higher water recovery rate for MF is tempered by a higher demand
for consumable chemicals (MF unibeds) compared to the RO. The
weights computed for the potable water recovery SFE and for the
WM and AR subsystem are similar for all the three processes; the
storage subsystem is lowest for the MF as it recovers the mostwater.
Power demand for the MF and RO is essentially equal, while ELDI
shows a significantly higher rate. Other SFEs and subsystems are
not affected by the change in the technology candidate for
potable H20 processing. On the other hand, if it would be
possible to route the RO brine from potable water processing to
urine processing, then the overall water recovery could be
increased at the expense of higher SFE weight and power demand of
urine processing. It would also be possible to compute the
mission duration for a break-even point where the reduced water
supply requirement matches the increased weight and power demand
(equating incremental power to weight) for urine processing.
V-14

POTABLE WATER PROCESSING TRADESWET WEIGHT COMPARISONS W.R.T. BASELINE
3000
2500
2000
1500
1000
500
0
1-MFPW 12-ROPW 13-ELDI
CASE/TECHNOLOGY
l LUNAR OUTPOST: Crew = 4; Mission Duration = 90 days ILOTT REPORT-4-360-90-0-5-0-1000-14-10-1-1-1_BASELINE.1.4BMS(Fig.V_13) I
ED POT 1-120PROC. SFE
ml WMSS
ARSS
I1' STORAGE SS
Figure V-13. Potable Water Processing Trade Weight Comparisons
POTABLE WATER PROCESSING TRADESPOWER COMPARISONS W.R.T. BASELINE
f./)
3000
2500
2000
1500
1000
500
0
I
1-MFPW 12-ROPW 13-ELDI
CASE/TECHNOLOGY
LUNAR OUTPOST: Crew = 4; Mission Duration = 90 days ILOTT REPORT-4-360-90-0-5-0-1000-14-10-1-1-1-BASELINE-1-4BMS(Fig.V-14) t
E_ POT H20 PROC. SRE
ml WMSS
== ARSS
Figure V-14. Potable Water Processing Trade Power Comparisons
V-15

6. Hygiene H20 Processing Technology Trade
The reverse osmosis for hygiene water (ROHW or RO) baseline
process has a lower water recovery rate (93.5%) compared to the
99.99% recovery for multifiltration for hygiene water (MFHW or
MF). By switching to MF, the system completely regenerates all
the hygiene water requirement: in fact, an excess of H20 is
generated, which must be stored as trash or dumped overboard. For
the baseline ROHW process, the makeup rate for four persons is
0.8 kg per day and for the MFHW process, there is no demand for
makeup. However, in treating all of the wash waters, the MF
process consumes an additional i.i kg per day of ion exchange and
adsorption beds (unibeds), thereby causing a net increase in
consumable supplies of 0.3 kg per day compared to the RO process.
The overall impact on the storage subsystem is small (less than
50 kg). The primary weight difference between the two cases is
mostly attributed to the weights of the RO and MF processes with
the ROHW weighing about i00 kg more than the MFHW.
The power demands for RO and MF are compared in Figure V-16. The
MF shows a power decrease relative to the RO process of over 300watts at the SFE level. This difference accounts for the entire
difference at the system level; i.e., the choice between RO and
MF limits their comparison at the SFE level since neither of them
have any impact on other SFEs or subsystems with respect to powerdemand.
An option for RO would be to route the RO brine to urine
processing thereby increasing the overall H20 recovery depending
on the recovery rate of the urine processing technology selected.
V-16

HYGIENE WATER PROCESSING TRADESWET WEIGHT COMPARISONS W.R.T. BASELINE
3000
2500
2000
1500
1000
500
01-ROHW 14-MFHW
CASE/TECHNOLOGY
C_ HYG 1-120PROC. SFE
.n WMSS
e_ ARSS
STORAGE SS
LUNAR OUTPOST: Crew = 4; Mission Duration = 90 daysLOTTREPORT-4--360-90-0-5-O-1000-14-10-1-1-1-BASELINE-1-4BMS(Fig.V-15)
Figure V-15. Hygiene Water Processing Trade Weight Comparisons
t HYGIENE WATER PROCESSING TRADES I_ O_POWERCOMPARISNSW.R.T. BASELIN ___
3000
2500
o_ 2000
1500
--'-_}llllllll|lll|}|lltll|lllt|llll|
'°°° J iiiiiiiiiiiiiiiiiiiiiiiiii]iiiiiii
E3 HYG H20 PROC. SFE
rm WMSS
_ARSS
1-ROPW 14-MFHW
CASE/TECHNOLOGY
LUNAR OUTPOST: Crew = 4; Mission Duration = 90 daysLOTTREPORT-4-360-90--0-5-0-1000-14-10-I-I-I-BASELINE-1-4BMS(Fig.V-16)
Figure V-16. Hygiene Water Processing Trade Power Comparisons
V-17

7. Urine Processing Technology Trade
Thermoelectric integrated membrane evaporation system (TIMES)
technology, as the baseline for urine processing, was compared in
terms of the impact of substitution with vapor compression
distillation (VCD), vapor phase catalytic ammonia removal
(VPCAR), and air evaporator (AIRE) processes in Figures V-17 andV-18.
Water recovery rates for the TIMES baseline, VCD, VPCAR, and AIRE
range from 90% for VCD and VPCAR to 99.9% for the AIRE process,
respectively, resulting in small differences in storage subsystem
weights relating to makeup water requirement. Makeup water for
the TIMES baseline is 0.8 kg per day for a crew of 4; for VCD,
VPCAR, and AIRE, the makeup rates are 1.5, 1.4, and 0.7 kg per
day, respectively. While the AIRE has the highest water recovery,
there is a significant weight associated with the use of wicks as
a nonregenerable chemical supply that amounts to 0.6 kg per day.
The overall weight effect is that the TIMES and AIRE cases are
similar and the VCD and VPCAR are slightly higher due to lowerwater recoveries.
Power demand shows the AIRE and the VPCAR processes requiringabout 100 watts more than the TIMES and the VCD for the urine
processing SFE. VPCAR also requires slightly more power from the
AR subsystem, as it requires additional oxygen generation for NH3oxidation.
V-18

URINE PROCESSING TRADESWET WEIGHT COMPARISONS W.R.T. BASELINE
3000
2500
2000
1500
1000
500
0
1-TIMES 15-VCD 16-VPCAR 17-AIRE
CASE/TECHNOLOGY
r"l URINE PROC. SFE
rm WM SS
=m ARSS
STORAGE SS
LUNAR OUTPOST: Crew = 4; Mission Duration = 90 daysLOTTREPORT4-360-90-0-5-0-1000-14-10-1-1-1-BASELINE-1-4BMS(Fig.V-17)
Figure V-17. Urine Processing Trade Weight
URINE PROCESSING TRADESPOWER COMPARISONS W.R.T. BASELINE
Comparisons
3000
2500
2000
_" 1500
1000
500
0
1-TIMES 15-VCD 16-VPCAR 17-AIRE
CASE/TECHNOLOGY
r_ URINE PROC. SFE
I_ WM SS
ARS$
LUNAR OUTPOST: Crew = 4; Mission Duration = 90 daysLOTTREPORT-4-360-90-0-5-0-1000-14-10-1-1-1-BASELINE-14BMS(Fig.V-18)
Figure V-18. Urine Processing Trade Power Comparisons
V-19

8. Solid Waste Treatment Technology Trade
The baseline system does not use solids waste treatment. In
Figures V-19 and V-20, it is compared to subsystem weight and
power demand for freeze drying (FD), thermal drying (TD),
combustion (COMB), wet oxidation (WOX), and super critical water
oxidation (SCWO).
System weight increases over the baseline are 260, 60, 90, 170,
and 280 kg for FD, TD, COMB, WOX, and SCWO, respectively. For the
FD and TD processes, the weight increases are mostly attributed
to the weight of the drying equipment, as shown in Figure V-19.
The drying processes produce water condensate that must be
treated in the WM subsystem. In the case of the oxidation
processes, additional condensate is produced by the oxidation of
organic solids. The C_ and trace pollutant gases released by
oxidation are considered to be a concentrated polluted gas stream
that must be treated by trace contaminant control in the AR
subsystem for pollutant oxidation, carbon rejection, and oxygen
recovery. Hence, the oxidation processes affect both the WM and
AR subsystems, while the drying processes impact the WM subsystem
only.
For the SCWO process, it has been reasonably assumed that the
condensate produced from the process can be routed directly to
the potable water bus where it could be mixed with other water
produced from the WM subsystem such that an acceptable average
water quality for potable water is achieved.
Storage subsystem weights are slightly higher (about 40 kg) than
the baseline for the drying processes. The weight savings in
makeup water is offset by the additional chemical supplies
required for the SWT and WM subsystems. For the oxidation
processes, the storage subsystem weights are higher by ii0 kg for
COMB and WOX and by only 50 kg for the SCWO process. Similar to
the drying processes, the savings in makeup water weight is
offset by the additional chemical supplies for SWT and WM
subsystems; for SCWO, no additional chemical supplies for WM is
required as its condensate is sent directly to the potable water
bus without having it processed in the WM subsystem. However,
since the oxidation process requires additional gas processing,
storage weights of several waste gases (such as 02, CO2, H2, and
Concentrated Polluted Gas Mix) are slightly increased.
V-20

SOLID WASTE TREATMENT TRADESWET WEIGHT COMPARISONS W.R.T. BASELINE
3000
2500
2000
1500
1000
500
0
I-NO SWT 18-FD 19-TD 20-COMB 21-WOX 22-SCWO
CASE/TECHNOLOGY
E3 sw-r ss
rtrl WMS$
mARSS
"_ STORAGE SS
LUNAR OUTPOST: Crew = 4; Mission Duration = 90 daysLOTTREPORT4-360-90-0-5-0-1000-14-10-1-1-1-BASELINE-1-4BMS(Fig.V-19)
Figure V-19. Solid Waste Treatment Trade Weight Comparisons
SOLID WASTE TREATMENT TRADESPOWER COMPARISONS W.R.T. BASELINE
3500 ! -
3000 I
¢n 2500
15oo -F i1000 ' i
500 , / -_
0
1-NO sw'r 18-FD 1_TD 20-COMB 21-WOX 22-SCWO
CASE/TECHNOLOGY
r-1SWTSS
lm WMSS
== ARSS
LUNAR OUTPOST: Crew = 4; Mission Duration = 90 daysLOTTREPORT4-360-90-0-5-0-1000-14-10-1-1-1-BASELINE-I-48MS(Fig.V-20)
Figure V-20. Solid Waste Treatment
V-21
Trade Power Comparisons

Increases in power demand over the baseline are 1580, 700, 950,
910, and 920 watts for FD, TD, COMB, WOX, and SCWO, respectively.
The additional power demands attributed to the SWT subsystem
alone are 1490, 600, 330, 290, and 370 watts, respectively. For
the drying processes, the power increases are predominantly due
to the drying processes themselves with a slight contribution
from the WM subsystem for processing of additional water
condensate. For the oxidation processes, more than half of the
power increase can be attributed to the additional gas processing
required of the AR subsystem; the power demand for oxidation
contributes slightly less than half of the additional power
required. For COMB and WOX, there is a slight additional power
demand on the WM subsystem similar to the drying processes; for
SCWO, there is no additional load placed on the WM subsystem as
its product condensate goes directly to the potable water bus.
Surplus Water and Food-Water:
Feed to the SWT subsystem includes feces from the human habitat
and brines from the WM subsystem. All SWT cases provide for
additional water recovery leading to a surplus of water developed
which must be trashed. For the drying processes (FD and TD), the
surplus amounts to 5.7 kg per day for a crew size of 4. Table V-2
illustrates a metabolic balance for a crew size of 4. Note that
the ratio of food-water content to dry-food constituents is 1.83.
With this quantity of water contained in the stored food, there
is an excess of water produced as a result of using solids waste
processing. If it is assumed that stored food can be reduced
significantly to levels such as freeze-dried food, then the
weight of stored food and the amount of excess water produced
will decrease accordingly.
V-22

Table V-2. Metabolic Balance for Crew of 4:(1.83 food-water-to-dry-food ratio)
!INPUTS: CARBON HYDROGEN OXYGEN NITROGEN ASH TOTALS
(kg)
Fat, C16H3202Minerals, Ash
2. LIQUIDS (WATER)Drink
(kg) (kg)...... (kg) (kg) (kg)1. DRY FOOD
Protein, C4HSON 0.3080 0.0324 0.1028 0.0896 0.5328
Carbohydrate, C6H1206 0.5956 0.1000 0.7936 1.48920.3432 0.0576 0.0572 0.4580
5.71920.7208Food Preparation 0.3536 2.8064
1.2468
0.0640
Food Water Content (1.83"dry food)3. GASES
Oxygen
0.51481
1.7792
0.01600.00960.0056
INPUT SUMS
OUTPUTS:
4.0852
3.3436
16.9080
0.08520.02920.0396
1. SOUD WASTESUrine, C2H602N2Feces, C42H69013N5Sweat, C13H28013N2
0.0896
0.07480.00960.00521
0.0708
0.0380
0.0380:
0.03080.0072
0.0296
0.0380
6.44003.16004.6000
3.3436
20.0616
0.27080.12640.0800
2. LIQUIDS (WATER)UrineFeces
Sweat & Perspira_on3. GASESCarbon dioxide
OUTPUT SUMS
Potable water recycled:Potable water with stored food:
Total water in:Total water out:Net water metabolized:
Excess water produced (HD):
1.0824
1.2468
0.67760.04081.0296
1.7792
1.07440.51481.58921.74800.1588
0.6418
5.37640.32248.1716
2.8836
16.9080
8.52564.0852
12.610813.870412596
5.0940
0.0896 0.0380
6.05400.36329.2012
3.9660
20.0616
9.60004.6000
14.200015.6184
1.4184
5.7358
V-23

Lowering the Food Water Content:
Table V-3 shows the same metabolic balance using a ratio of 0.01food-water-to-dry-food (0.01 is used here for illustrationpurposes and is not meant as a suggested food composition). In
both tables, the crew is ingesting the same water and food and
producing the same outputs. Decreasing the food water content
requires an increase in the recycled potable water from 9.6 to
14.2 kg per day while decreasing the excess water produced from
5.7 kg to 0.5 kg per day if thermal drying is used for solid
waste treatment. Note that 1.4 kg of water are created
metabolically regardless of the food water content.
For the oxidation processes, the surplus is 6.2 kg per person day
for the higher food water content. Creating this surplus comes at
the expense of weight and power. The oxidation processes
effectively create more water by oxidizing the solids waste to
CO 2 and HzO.
V-24

Table V-3. Metabolic Balance for Crew of 4:(0.01 food-water-to-dry-food ratio)
INPUTS:
1. DRYFOOD
Protein, C4H5ONCarbohydrate, C6H1206Fat, C16H3202M!.nerals,Ash
2. LIQUIDS (WATER)Drink
!CARBON
Food PreparaUonFood Water Content (0.01" dry food)
3. GASESOxygen
INPUT SUMS
OUTPUTS:1. SOLID WASTESUrine, C2H602N2Feces, C42H69013N5Sweat, C13H28013N2
!2. LIQUIDS (WATER)UrineFecesSweat & Perspiration
3. GASESCarbon dioxide
(kg)HYDROGEN
(kg)
0.03241
OXYGEN(kg)
0.1028
NITROGEN ASH(l_g)
TOTALS(kg)
0.53280.3080
0.5956 . 0.7936 1.48920.10000.057610.3432 0.0572
0.72080.86560.0028
1.7792 !
0.01600.00960.0056
0.6776
5.7192
6.86920.0224
3.3436
1.2 68
0.06400.0708
16.9,080
0.08520.02920.0396
5.37640.3224
0.0896
0.07480.00960.0052
0.4580
0.0296
1.0824_
0.0380 0.0380r
o.o: 8o
0.0308
0.0408
OUTPUT SUMS 1.2468
Potable water recycled:Potable water with stored foodi
0.0072
6.44007.73480.0252
Total water in:Total water out:Net water metabolized:
Excess water produced (HD):
3.3436
20.0616
0.27080.12640.0800
6.05400.3632
1.0296 8.1716 9.2012
2.8836 3.9660
1.7792 16.9080 0.0896 0.0380 20.0616
1.5864 12.5884 14.17480.0028 0.0224 0.02521.5892 12.6108 14.20001.7480 13.8704 15.6184
0.1588 !.2596 1.4184
0.40390.0507 0.4546
V-25

i
T
J
9. Equivalent System Penalty Weight Comparisons
By assigning a weight value to the incremental power required for
different life support technologies, an equivalent system weight
can be calculated and compared to the baseline technology used.
For this report, a regenerative fuel cell technology [reference
V-l] has been assumed using a value of 3 watts/kg for the
incremental power. The life support system weight is added to the
equivalent power weight to represent a total equivalent life
support weight. In this manner, penalties relative to the
baseline system weights are compared for air revitalization,
water management, and solid waste treatment technologies.
Penalties therefore represent additional mass that must be lifted
to the lunar surface relative to baseline technologies used in
Case i.
Air Revitalization Technologies:
Figure V-21 shows all of the AR technologies for the 4-
person/600-day mission. For the CO2 removal processes, the
largest penalty relative to the baseline 4BMS is associated with
LiOH. The 2BMS shows an advantage (negative penalty value) of 280
kg; most of these advantages are attributed to power.
For the CO2 reduction processes, SAB shows a significant weight
penalty relative to the Bosch baseline, while ACRS and CO2EL show
total equivalent advantages of 80 and 500 kg respectively.
For the 02 generation technologies, the WVE shows a significant
total equivalent advantage of 600 kg relative to the SFWE
baseline. This advantage is mostly attributable to lower storage
supplies for water processing of condensate; the WVE process
effectively removes moisture from the air, thereby reducing the
amount of condensate to be treated in potable water processing.
SPE is essentially identical to SFWE.
V-26

SYSTEM WEIGHT PENALTY COMPARISONSEQUIVALENT WEIGHT PENALTY W.R.T. BASELINE AR TECHNOLOGIES
5O0O
4000
I,3000 " I
2000
1000 f
-I000
20OO
1000
-1000
mJ_ _ilip -
2BI_S EDC _ ¢4.W0 UOH
CO2 REMOVAL TECHNOLOGY (BASELINE = 4BMS)
mlTtm
7.SAB C/ORS
CO2 REDUCTION TECHNOLOGY (BASELINE = BOSCH)
750
25O
-25O
-75OIO-WVE 1 I,,.SPE
02 GENERATION TECHNOLOGY (BASELINE = SFWE)
r-1 System penalty m Equivalent power penalty @ 3 watts/kg
B Total equivalent system penalty
LUNAR OUTPOST: Crew = 4; Mission Duration = 600 days 1LOTT REPORT-4-2400-600-0-5-0-1000-14.10-1-1-1-BASELINE-1-4BMS{Fig.V-21) I
Figure V-21. Equivalent System Weight Comparisons:
Air Revitalization Technologies
V-27

z
Water Management Technologies:
Figure V-22 shows the total equivalent system penalties for all
of the WM technologies. For the potable water processes, the
weight disadvantages are due to lower water recoveries; since
brines are not processed in this configuration, unrecovered water
must be made up from storage.
For the hygiene water processes, there is a penalty of using MF
relative to RO for using additional unibed material (which shows
up as a consumable item in the storage subsystem). However, there
is a power advantage of the MF system that roughly decreases the
disadvantage of storage supplies by one-third.
For the urine processing technologies, equivalent power weights
are similar to the baseline at the system level. Differences in
system level penalties for VCD and VPCAR are attributed to water
recoveries. For the AIRE process, even though the water recovery
is nearly 100%, there is a penalty associated with expendable
wicks amounting to over 200 kg.
V-28

I SYSTEM WEIGHT PENALTY COMPARISONSEQUIVALENT WEIGHT PENALTY W:R.T. BASELINE WM TECHNOLOGIES
.1200
1000
8O0
6O0
400
200
0
-200
ROPW ELDI
POTABLE WATER PROCESSING TECHNOLOGY (BASELINE = MFP_
600
200
-200
fllllillllllll'llll'llllllllllllllllll
MFI..IW
HYGIENE WATER PROCESSING TECHNOLOGY (BASELINE = ROHW)
1000
600
20O
m m
-200VCO _ AIRE
URINE PROCESSING TECHNOLOGY (BASELINE = TIMES)
r-_ System penalty Im Equivalent power penalty @ 3 watts/kg
m Total equivalent system penalty
LUNAR OUTPOST: Crew = 4; Mission Duration = 600 daysLOTTREPORT-4-360-90-0-5-0-1000-14-10-1-1-1-BASELINE-1-48MS(FigV-22)
Figure V-22. Equivalent System Weight Comparisons:
Water Management Technologies
V-29

Solid Waste Treatment Technologies:
Figure V-23 shows the total equivalent system penalties for allof the SWT technologies. The drying processes (FD and HD) and theoxidation processes (COMB, WOX, SCWO) are compared to thebaseline, which has no solid waste treatment.
SWT technologies show total equivalent penalties ranging from 350kg to over 1050 kg. As discussed above, by introducing SWT
processing, a surplus of clean water is produced; this surplus
could be reduced by decreasing the amount of water in stored
food. Power equivalent for the oxidation processes are similar
(300 kg); however, due to the reported ability of SCWO to create
near-potable quality water, system weight of the SCWO is lowest.
The weight advantage for SCWO is dependent upon the mission
duration and the assumption that SCWO condensate does not require
further treatment. At 90 days, the weight of the SCWO hardware
dominates any weight advantage gained by producing clean
condensate as shown in Figure V-24. At 90 days, the overall SCWO
system weight penalty (excluding the equivalent power penalty) is
480 kg; when the mission length is increased to 600 days, the use
of SCWO results in the penalty decreasing to 50 kg over the
baseline as shown in Figure V-23. By increasing the mission
duration to 700 days, the system weight penalty for SCWO goes to
zero and becomes an advantage. However, the power penalty would
still result in the SCWO having a total equivalent weight penalty
of about 300 kg. In order for SCWO to have a weight advantage,
mission lengths of about 1200 days for a crew size of four would
be required. However, if it is assumed that the SCWO condensate
requires additional cleanup before being accepted as either
potable or hygiene water, then it is unlikely that any system
weight advantages will be realized.
V-30
q

SYSTEM WEIGHT PENALTY COMPARISONSEQUIVALENT WEIGHT PENALTY W.R.T. BASELINE SOLID WASTE TREATMENT TECHNOLOGIES
1200
IOO0
800
(.9 6O0
4OO
|
,/200
0
DRYING-FD DRYING-TD OXID.-COMB OXID.WOX OXID.-SCWO
SWT PROCESSING TECHNOLOGY (BASELINE=NO SWT PROCESSING)
System penalty
II Total equivalent system penalty
• Equivalent power penalty @ 3 watts/kg
I LUNAR OUTPOST: Crew = 4; Mission Duration = 600 days I
I
LO'R" REPORT-4-2400-600-O-5-O-10OO-14-10-1-1-1-BASELINE-1-4BMS(Fig.V-23) I
Figure V-23. Equivalent System Weight Comparisons:
Solid Waste Treatment Technologies
V-31

SYSTEM WEIGHT PENALTY COMPARISONSEQUIVALENT WEIGHT PENALTY W.R.T. BASELINE SOLID WASTE TREATMENT TECHNOLOGIES
1000
8OO
6OO
400
200
0
DRYING-FD DRYING-TD OXID.-COMB OXID.WOX OXID.-SCWO
SWT PROCESSING TECHNOLOGY (BASELINE=NO SWT PROCESSING)
[] System penalty
• Total equivalent system penalty
• Equivalent power penalty @ 3 watts/kg
LUNAR OUTPOST: Crew = 4; Mission Duration = 90 daysLOTT REPORT-4-360-90-0-5-0-1000-14-10-1-1-1-BASELINE- 1-4BMS(Fig.Vo24)
Figure V-24. Equivalent System Weight
Solid Waste Treatment Technologies
V-32
Comparisons:
(90 days)

VI. CONCLUSIONS AND RECOM_ENDATIONS
i. Conclusions
As all of the regenerative technologies used in this study are
still under development, conclusions concerning the best
technologies must be revisited following significant progress in
technology development. Hence, identifying a less-developed
technology as having an advantage over a more-developed
technology must be seen only as identifying a potential advantage
that could be realized only by further investment in technology
development. Some of the technologies are currently included in
the design of the Space Station and therefore represent
considerable technological maturity. Some technologies are
conceptual in nature with varying degrees of uncertainty
associated with the data collected on these technologies; the
degree of data uncertainty is qualitatively represented by the
validity level ranking.
A baseline set of technologies has been used against which
comparisons have been made with a crew size of four. The baseline
technologies are:
Air Revitalization Subsystem:
CO2 Removal:
CO2 Reduction:
02 Generation:
Water Management Subsystem:
Potable Water Processing:
Hygiene Water Processing:
Urine Processing:
Four Bed Molecular Sieve
Bosch
Static Feed Water Electrolysis
Multifiltration
Reverse Osmosis
Thermoelectric Integrated
Membrane Evaporation System
Solid Waste Treatment Subsystem:
Drying: NoneOxidation: None.
For the 21 regenerative cases run (Case 6, using lithium
hydroxide is considered nonregenerative), overall regenerative
system weights vary from a -5 to a +9 weight% relative to the
baseline weight of 4060 kg for 90 days; for 600 days, the
variation from the baseline weight of 13,920 kg varied from a -4
to a +i0 weight%. For the nonregenerative case where lithium
hydroxide was used for CO z removal, the system weight penalty was
7 weight% for 90 days and 32 weight% for 600 days.
VI-I

Overall system power varied from a -8% to a +29% relative to thebaseline power of 5470 watts (excluding the nonregenerative LiOHcase). When comparing only air revitalization and water
management technologies, the variation narrows to -8 to +6%.
Regenerative technologies showing significant weight advantages
include CO2 electrolysis/Boudouard and water vapor electrolysis.
Regenerative technologies showing significant power advantages
include two bed molecular sieve, electrochemical depolarized
concentrator, solid amine water desorption, coz electrolysis/
Boudouard, and multifiltration hygiene water.
When power is equated to equivalent weight (3 watts/kg for a
regenerative fuel cell system) and added to the system weight,
the two bed molecular sieve, co2 electrolysis/Boudouard, and
water vapor electrolysis have advantages over the baseline for
long durations.
For mission durations below 700 days, there are no overall weight
advantages realized by solid waste treatment processing. Thedecision to include solid waste treatment must therefore be based
on considerations other than system weight reduction. For mission
durations beyond 700 days, supercritical water oxidation
technology is attractive relative to the baseline as it may
produce a high quality water condensate. However, the high power
and safety issues arising from the high pressure operation of the
supercritical water oxidation must be balanced against its weight
advantages. Total equivalent weight advantages of supercritical
water oxidation relative to the baseline would require extremely
long durations of over 1200 days.
Table VI-I summarizes advantages, disadvantages, and validity
levels of the technology choices for the CO2 removal, CO2
reduction, and 02 generation functions.
VI-2

Table VI-I. Comparisons of Air Revitalization
Subsystem Technologies
SFE
CO2 Removal
TECHNOLOGY
I
Fotir Bed MolecularSieve
" " Two Bed MolecularSieve
w = ElectrochemicalDepolarizedConcentrator
CO z Reduction
02 Generation
Air PolarizedConcentrator
Solid Amine WaterDesorption
Lithium Hydroxide
Bosch
Sabatier
Advanced Carbon
Reactor System
CO2 Electrolysis/Boudouard
Static Feed WaterElectrolysis
Water VaporElectrolysis
Solid PolymerElectrolyte
ADVANTAGES
Maturity; SpaceStationdevelopment
SFE weightSFE power
SFE power
SFE power
SFE power;AR power;
Maturity
Carbon and
oxygen recovery
Maturity: SpaceStation development
SFE simplicity
Low consumables
Produces oxygen;Low consumablesdue to WMsubsystem effect;Low AR power
Maturity:SpaceStation
development
Low SFE andAR subsystempower;Low consumablesdue to WM
subsystem effect
Stable long term cellactivity;Maturity (submarines)
DISADVANTAGES
SFE Power
Maturity 4
4Effect on AR powerMaturityH2 Required
Maturity
Effect on WM-consumablesMaturity
Nonregenerative,consumables
Catalyst activityConsumablecanister
Effect on AR subsystemHigh H=to COz ratio
MaturityTwo reactors, complexity
VALIDITYLEVEL
MaturityHigh SFE power
High SFE power
Maturity
Slightly higher SFE power
Note : SFE =
AR =
WM =
Subsystem FunctionalAir Revitalization
Water Management
Element
VI-3

Table VI-2 summarizes advantages, disadvantages and validitylevels of the technology choices for the potable waterprocessing, hygiene water processing, and urine processingfunctions.
Table VI-2. Comparisons of Water ManagementSubsystem Technologies
TECHNOLOGYSFE
Potable Water
Processing
Hygiene WaterProcessing
Urine Processing
Multiflltration
Reverse Osmosis
Electrochemical
Deion'B"ation
Reverse Osmosis
Multifiltration
ThermoelectricIntegrated MembraneEvaporation System
Vapor CompressionDistillation
Vapor Phase CatalyticAmmonia Removal
Air Evaporation
ADVANTAGES
H=O recoveryMaturity: SpaceStation development
Low consumables;Maturity (HzOdesalinization)
H20 recovery
Maturity: waterdesalinization
Maturity: SpaceStationdevelopment;
HzO recovery
H=O recovery
Maturity: SpaceStation development
Volatiles treatment
High HzO recovery
DISADVANTAGES
Consumables
H20 recovery
Maturity; 7SFE Power
Power 3
Consumables 3
Maturity; 3Membrane fouling
Complexity (mechanical) 3
7H20 recovery;,SFE power;,Maturity
Maturity;Consumables
VALIDITYLEVEL
Note: SFE = Subsystem Functional Elef_ent
VI-4

Table VI-3 summarizes advantages, disadvantages and validity levels
of the technology choices for the drying and oxidation functions
withinthe solid waste treatment subsystem.
Table VI-3. Comparisons of Solid Waste Treatment
Subsystem Technologies
SFE
ory_g
Oxidation
TECHNOLOGY
I
Freeze Drying
Thermal Drying
Combustion
Wet Oxidation
Super Critical WaterOxidation
ADVANTAGES
Condensate quality;Maturity (othermedical labapplications)
Potentialto use lowgrade heat
Low pressure;Minimizes hazardoussolids
Maturity (other wastewater applications);Minimizes hazardoussolids
Condensate quality;Minimizes WM
consumables;Maturity (other wastewater applications);
• Minimizeshazardous solids;Nearly completeorganic destruction
DISADVANTAGES
Maturity;,SFE weight;SFE power;Unreacted solids
disposal
Condensate purity;Maturity;,SFE weight;SFE power;Unreacted solids
disposal
Maturity;SFE weight;SFE power;,High temperature;Condensate quality
High pressure ;Maturity;SFE weight;SFE power
High pressure;High temperature;Maturity;SFE weight;SFE power
VALIDITYLEVEL
III IIIII
7
7
7
7
7
Note: SFE = Subsystem Functional ElementAR = Air Revitalization
WM = Water Management
VI-5

z
2. Recommendations
The following recommendations are based on the authors'
observations not only during the performance of this study but
also as the LiSSA tool was being developed:
i. As technologies are funded for development, it is
important to require contractors to generate and report data
that can be utilized forquantitative technology
comparisons. Estimates of heat and material balances,
equipment weights, power, volumes, and scaleup parameters
should be a part of the technology development effort. It is
suggested that NASA technical monitors add a "NASA
Perspective" summary page to the final report such that any
overly optimistic or conservative estimates or performances
can be identified.
2. In general, technology development directions should be
aimed at reducing the weight of resupplies. Nonregenerable
supplies impose additional weight to be carried by a
spacecraft plus additional manpower required for resupply
operations.
3. Technology development should be directed to outperform
the current best technology or a carefully selected baseline
technology. Baseline technologies should be identified that
have well documented weights, power usage, volume, feed and
product characterizations, in addition to quantitative
scaleup procedures.
4. Basic research should be directed towards identification
and use of lighter materials of construction, minimization
or elimination of resupplies, and minimization of power
demand. Basic research is needed, for example, in the
regeneration of sorption beds and membrane fouling for water
purification, and Bosch carbon deposition kineticsand
catalysts for air revitalization.
5. The effects of process dynamics on technology trades
should be examined. Most of the processes investigated do
not operate in a continuous mode and must deal with
fluctuating feed rates and compositions. However, processes
that can be designed to be continuous tend to be lighter and
energy efficient. If the dynamics of the process and the
fluctuating feed rates and compositions can be modeled so
that effective control strategies are possible, the
advantages of a continuous process design can be realized.
VI-6

6. Systems analysis is an iterative and continuing process
throughout the technology development cycle from concept
evaluation to mission readiness. By stepping back again and
again to obtain a system view following technology
selections for further development or mission system design,
systems analysis enables significant cost reductions in
developing, designing and commissioning any complex system.
LiSSA is such an analysis tool for physical-chemical life
support systems.
7. Life support systems analysis should be extended to
include biological systems and in situ resource utilization
systems so that technologies pertaining to these systems can
be traded for assessment of system impacts. The modular and
architectural construction of LiSSA lends itself to
performing these trades. An example of extending LiSSA to
biological systems in shown in Reference ES-I, and trade
studies for different lunar habitats are presented in
Reference VI-I. In addition, future trades should include
power and propulsion systems to complete the picture for
mission and project planners.
8. Life support systems analysis using dynamic models and
integrated controllers must be undertaken to assess the
operational impact of technology selections for any given
system.
VI-7


VII. REFERENCES
ES-I. Ganapathi, G.B., Seshan, P.K., Rohatgl, N. K. ,and Ferrall,
J.F., "Human Life Support During Interplanetary Travel and
Domicile - Part VI: Hybrid P/C - Generic Modular Flow Schematic
for Biological Life Support Systems," SAE paper 921120,
presented at the 22nd ICES Conference, July 1992.
I-l. Ferrall, J.F., Rohatgi, N.K., and Seshan, P.K., Project
Pathfinder - Physical Chemical Closed-Loop Life Support - Systems
Analysis and Assessment - FY'89 Annual Report, JPL D-12401
(internal report), Jet Propulsion Laboratory, Pasadena, CA,
January 1990.
I-2. Seshan, P.K., Ferrall, J., and Rohatgi, N., "Human Life
Support During Interplanetary Travel and Domicile - Part I:
System Approach," SAE paper 891431, presented at the 19th ICES
Conference, July 1989.
I-3. Ferrall, J., Seshan, P.K., and Rohatgi, N., "Human Life
Support During Interplanetary Travel and Domicile - Part II:
Generic Modular Flow Schematic Modeling," SAE paper 911322,
presented at the 21st ICES Conference, July 1991.
I-4. Seshan, P.K., Ferrall, J., and Rohatgi, N., "Human Life
Support During Interplanetary Travel and Domicile - Part IV:
Mars Expedition System Trade Study," SAE paper 911323, presented
at the 21st ICES Conference, July 1991.
I-5. Rohatgi, N. K. , Ferrall, J., and Seshan, P.K., "Human
Support During Interplanetary Travel and Domicile - Part IV:
Mars Expedition Technology Trade Study," SAE paper 911324,
presented at the 21st ICES Conference, July 1991.
Life
I-6. Ferrall, J., Rohatgi, N. K. ,and Seshan, P.K., "Human Life
Support During Interplanetary Travel-and Domicile - Part V: Mars
Expedition Technology Trade Study for Solid Waste Management,"
SAE paper 921119, presented at the 22nd ICES Conference, July1992.
I-7. Ferrall, J. Seshan, P.K., Rohatgi, N.K., and Ganapathi, G.
B., "Generic Modeling of a Life Support System for Process
Technology Comparisons," Session/paper number 101b, presented at
the March 1993 American Institute of Chemical Engineers Spring
National Meeting, Houston, TX, March 1993.
I-8. Ferrall, J., Rohatgi,N.K., Ganapathi, G.B., and Seshan,
P.K., LiSSA-ST User Manual, JPL D-II163 (internal report), Jet
Propulsion Laboratory, Pasadena, CA, September 1993.
VII-i

I-9. Ferrall, J., Rohatgi,N.K., Ganapathi, G.B.,and Seshan, P.K.,LiSSA-TT User Manual, JPL D-II164 (internal report), Jet
Propulsion Laboratory, Pasadena, CA, September 1993.
1-10. Ferrall, J., Rohatgi,N.K., Ganapathi, G.B.,and Seshan,P.K., LiSSA-ST and LiSSA-TT User Manuals, JPL D-II165 (internal
report), Jet Propulsion Laboratory, Pasadena, CA, September 1993.
II-l. Environmental Control and Life Support System Architectural
Control Document, SSP 30262, Revision D, NASA Marshall Space
Flight Center, Huntsville, AL, July 1991.
II-2. Wydeven, T. and Golub, M., Generations Rates and Chemical
Compositions of Waste Streams in a Typical Crewed Space Habitat,NASA TM-I02799, NASA Ames Research Center, Moffett Field, CA,
1990.
Z
II-3. Golub, M., and Wydeven, T., Waste Streams in a Typical
Crewed Space Habitat: An Update, NASA TM-I03888, NASA Ames
Research Center, Moffett Field, CA, February 1992.
II-4. Volk, T., and Rummel, J.D., "Mass Balances for a Biological
Life Support System Simulation Model," COSPAR Proceedings, 1986.
IV-l. Rohatgi, N., Ballin, M.G., Seshan, P.K., Bilardo, V.J.,
and Ferrall, J., "Hardware Scaleup Procedures for P/C Life
Support Systems," SAE paper 911395, presented at the 21st ICES
Conference, July 1991.
IV-2. Space Station ECLSS Evolution Study Report to MSFC,
McDonnell Douglas, Huntsville, Alabama, NAS8-36407, June 30,
1989.
IV-3. Rohatgi, N.R., Ferrall, J.F., and Seshan, P.K.,
"Extracted Data Taken by JPL From the Critical Design Review And
Preliminary Design Review Data Packages for the Technology
Demonstration Program Of Space Station Freedom -_Data Presented
by Subcontractors to Boeing Aerospace - 1987," JPL D-12402
(internal report), Jet Propulsion Laboratory, Pasadena, CA,
January 1991.
IV-4. Rohatgi, N.R., Ferrall, J.F., and Seshan, P.k.,"Notes Taken
by JPL from Presentation Made by Dr. C. H. Lin (NASA Johnson
Space Center, Houston, TX) - April 1992 ," JPL D-12400 (internal
report), Jet Propulsion Laboratory, Pasadena, CA, January 1991.
IV-5. Component Data Handbook - Environmental Control and Life
Support Systems, Hamilton Standard Division of United
Technologies Corp., 1980.
VII-2

IV-6. A Guide to Freeze Drying for the Laboratory, Labconco
Corporation, An Industry Service Publication, Kansas City,
Missouri, 1987.
IV-7. Fisher Scientific Catalog, 1988.
IV-8. Labak, L.J., Remus, G.A., and Shapira, J., "Dry
Incineration of Wastes for Aerospace Waste Management Systems,"
ASME 72-ENAV-2, 1972.
IV-9. Slavin, T., Liening, F., Oleson, M., and Olson, R.L.,
Controlled Ecological Life Support Systems (CELSS) Physiochemical
Waste Management Systems Evaluation, NASA Contractor Report177422, prepared by Boeing Aerospace Company, June 1986.
IV-10. Jagow, R., Jaffe, R., and Saunders, C., "The Processing of
Human Wastes by Wet Oxidation for Manned Spacecraft", ASME 70-
AV/Sp T-l, 1970.
IV-II. Hong, G., and Fowler, P., Supercritical Water Oxidation of
Urine and Feces, final report prepared by MODAR, Inc. for NASA-
JSC under Contract NAS2-12176, 1987.
IV-12. Standard Handbook of Hazardous Waste Treatment and
Disposal, Freeman, H.M., editor, McGraw-Hill Book Company, 1989.
V-I. Stafford, T., America at the Threshold-Report of the
Synthesis Group on America's Space Exploration Initiative,
prepared by the Synthesis Group for Vice-President J. D. Quayle,
Chairman of the National Space Council, May 1991.
VI-I. Ganapathi, G.B., Ferrall, J., Seshan, P.K., Lunar Base
Habitat Designs: Characterizing the Environment, and Selecting
Habitat Designs for Future Trade-Offs, JPL Publication 93-20, Jet
Propulsion Laboratory, Pasadena, CA, May 1993.
VII-3

=
=

APPENDIX A
DESCRIPTION OF LiSSA TOOL
The potential complexity of future life support systems for
manned missions necessitates the development of the appropriate
systems analysis capability within NASA as a guide to technology
and systems development (Evanich et al., 1991). The life support
system (LSS) most appropriate for a given human exploration of
outer space must be chosen from candidates ranging from a very
simple, nonregenerative LSS to a very complex, integrated
physical-chemical, and possibly biological, closed-loop LSS.
There are many regenerative processes that are potential
candidates to provide a particular function as part of the
overall LSS. To synthesize an LSS, all of the processes must be
integrated to perform certain generic life support functions such
as air revitalization and water recovery.
A GMFS architecture has been developed to enable synthesis,
analysis, and eventual selection of system and technology options
for defined missions. The architecture consists of a modular,.
top-down hierarchical break-down of the physical-chemical closed
loop life support (P/C CLLS) system into subsystems, and a
further break-down of subsystems into subsystem-functional
elements (SFEs) representing individual processing technologies.
This approach allows for modular substitution of technologies and
subsystems and for the traceability of parameters through all the
hierarchical levels, which is useful in comparing systems or
technologies rapidly and accurately. The GMFS is the central
feature utilized by the Life Support Systems _Analysis (LiSSA)
tool created by JPL as illustrated in Figure A-I.
A series of papers, describing the technique and results, titled
"Human Life Support During Interplanetary Travel and Domicile"
(Parts I,II,III,IV, and V), have been presented at recent
International Conference on Environmental Systems (ICES)
meetings. (It should be noted that the acronym LiSSA was adopted
in early 1992 and therefore will not be found in earlier papers.)
Another paper presented at the 21st ICES conference described
hardware scaleup procedures used in the LiSSA trade tool (Rohatgiet al., 1991a). A paper was presented at the March 1993 American
Institute of Chemical Engineers meeting that illustrated how the
tool can be utilized to do technology trades and system
optimization investigations.
A-I

LiSSA APPROACHAND CALCULATION SCHEME
A schematic of the LiSSA methodology is given in Figure A-I. Toinitiate the analysis, the system matrix, technology matrix,system specifications, and mission specifications are firstchosen.
The system matrix includes the types of life-support systems thatare of interest. It could include non-waste-processing, open-loopsystems, systems that process cabin air for carbon dioxideremoval only, andclosed-loop systems with varying degrees ofclosure of the oxygen and water loops. "Closing the loops" foroxygen and water is accomplished by processes that regeneratepur e oxygen and clean water from waste streams generated by thecrew. The amounts of oxygen and water regenerated depend on theefficiency of the regeneration processes selected for the system.
The technology matrix includes the processing technologies thatwould be utilized to regenerate oxygen and water. From thismatrix, a baseline set of technologies can be chosen forconfiguring the various systems in the system matrix. Currently,this includes technologies under consideration for Space StationFreedom (SSF) and some additional advanced technologies.
System specifications include metabolic and hygiene inputs andoutputs pertaining to the crew. These specifications are requiredas input parameters to the GMFSmodule integration and computersimulation. Mission specifications are required as parametricinputs to the LiSSA Trade Tool.
For all the technology candidates considered, performance data
must be acquired and utilized to model technologies as modules
using the ASPEN PLUS chemical process simulation package. Once
all the ASPEN PLUS modules are written, they are stored in an
insert library. The modules are integrated into the GMFS
architecture by calling them from the library using insert
statements in the ASPEN input file. The complete input-code
package represents the LiSSA Simulation Tool to produce output as
an American Standard Code for Information Interchange (ASCII)
file (with the *.PRN extension) that is used as input to theLiSSA Trade Tool.
The link between the LiSSA Simulation Tool and the LiSSA Trade
Tool is accomplished by a spreadsheet macro which processes and
loads the ASCII file from the simulation output into the Trade
Tool. The Trade Tool uses simulation output, mission specifi-
cations, and JPL-developed scaleup formulas for weight, power,
and volume. The entire spreadsheet represents the systems
analysis output with a variety of tables and graphs.
A-2

LiSSA CALCULATION SCHEME
LiSSA SIMULATION TOOL
SYSTEM CONRGURATION
[
TECHNOLOGY MATRIX
SYSTEMSPECS.
&
METABOLIC BALANCE
•. "_-__'__'t"_?:i __'"_'__!
J ____._ .ASCII FILE (tic'n)
lMODEUNG OF MODULES /
JIN ASPEN PLUS
flnsartmodules to LIBRARY)
LiSSA TRADE TOOL
r
I LOADING MACRO
IfC E MISSION SPECS. ___{_
REW SIZE, MISSION DURATION,
I_.RGENCY STORAGE, ETC.) ,
[
SYSTEM ANALYSIS
SPREADSHEET PROGRAM
1COMPREHENSIVE
ASSESSMENT
OUTPUT
TECHNOLOGY DATA
PERFORMANCE,
WTNOI.POWER
CORRELATIONS
.......... I
........ J
Figure A-I. LiSSA Methodology
A-3

=
I
=
=
REFERENCES FOR APPENDIX A
Evanich, P. L., Voecks, G. V., and Seshan, P. K., "Advanced Life
Support Technology Development for the Space Exploration
Initiative," AIAA paper AIAA-90-3726, presented at the AIAA Space
Programs and Technologies Conference, Huntsville, AL, September
25-28, 1990.
Ferrall, J.F., Seshan, P.K., and Rohatgi, N.K. and Ganapathi,
G.B., "Generic Modeling of a Life Support System for Process
Technology Comparisons," Session/paper number 101b, presented at
the March 1993 AIChE Spring National Meeting, Houston, TX, March
1993.
Ferrall, J.F., Seshan, P.K., and Rohatgi, N.K., "Human Life
Support During Interplanetary Travel and Domicile - Part II:
Generic Modular Flow Schematic Modeling," SAE paper 911322,
presented at the 21st ICES Conference, July 1991.
Rohatgi, N., Ballin, M.G., Seshan, P.K., Bilardo, V.J.,
Ferrall, J., "Hardware Scaleup Procedures for P/C Life
Systems," SAE paper 911395, presented at the 21st ICES
Conference, July 1991a.
a£i
Support
Rohatgi, N.K., Seshan, P.K., and Ferrall, J.F., "Human Life
Support During Interplanetary Travel and Domicile - Part IV: Mars
Expedition Technology Trade Study," SAE paper 911324, presented
at the 21st ICES Conference, July 1991b.
Seshan, P.K., Ferrall, J.F., and Rohatgi, N.K., "Human Life
Support During Interplanetary Travel and Domicile - Part I:
System Approach," SAE paper 891431, presented at the 19th ICES
Conference, July 1989.
Seshan, P.K., Ferrall, J.F., and Rohatgi, N.K., "Human Life
Support During Interplanetary Travel and Domicile - Part IV: Mars
Expedition System Trade Study," SAE paper 911323, presented at
the 21st ICES Conference, July 1991.
A-4

APPENDIX B
DESCRIPTIONS AND PROCESSFLOWSCHEMATICS
OF PHYSICAL/CHEMICAL LIFE SUPPORTTECHNOLOGIES
The Subsystem Functional Element (SFE) functions included in thisAppendix are CO2 removal, CO2 reduction, and 02 generation for the
air revitalization (AR) subsystem; potable water (PW) processing,
hygiene water (HW) processing, and urine processing for the water
management (WM) subsystem; and drYing and oxidation for the solid
waste treatment (SWT) subsystem. Data sources for technologiesare given in Tables IV-2, IV-3, and IV-4. Functional schematics
and brief descriptions of the technologies used for the tradespresented in the report are included.
B-I

(_J_r_K_x zzDAxz)
+
IDRSSXCA,NT
( _mSO_I'ZOS
_)
DZSSXCAI_
(D2SORP'/_ONCYCZ,Z)
iU_F/'m_AL"rZEDAZ_
(J_Ut)I
u I
J co2so_s_ /i-'[c Dzso_._zo_ crcr,s)
' ' ' ,I
C02VACUUM
PUMP
2__L I co2
ACCUMOIJ_TOR
Process Flow Schematic for Four-Bed Molecular Sievef
The Four-Bed Molecular Sieve (4BMS) removes CO2 from the inlet
air stream via an adsorption process. Water is removed from the
inlet air stream in an adsorbent bed packed with a mixture of
silica gel and zeolite 13X. The dry air stream is then cooled and
fed to a CO2 adsorbent bed packed with zeolite 5A. Additionally,
previously adsorbed water and CO2 sorbent beds are in a
desorption cycle. Desorbed water is used to rehydrate processed
air, and desorbed CO2 is pumped to an accumulation tank. Dotted
lines demonstrate flow for adsorption/desorption cycling
initiated when the adsorption capacity of a bed has been reached.
B-2

Process Flow Schematic for Two-Bed Molecular Sieve
The Two-Bed Molecular Sieve (2BMS) removes CO2 from the inletair stream via an adsorption process using a carbon molecularsieve (CMS). Unlike the zeolites of the 4BMS, the CMS is notaffected by the moisture in the process stream. The 2BMSeliminates the requirement of desiccant beds; in addition, italso desorbs at a lower temperature than zeolites, therebyreducing regenerating power requirements. Dotted linesdemonstrate flow for adsorption/desorption cycling initiated whenthe adsorption capacity of a bed has been reached.
B-3

RL_r£TAI_ZZRD<
lcaBxl > AXR J
J
<
EDC ¢02COEICZ_A'I'OR
i(ODUTJ
C02/82
> n20
>
FLUIDSCObI'rROL
ASSEMBLY
Process Flow Schematic for Electrochemical Depolarized CO 2
Concentrator
The Electrochemical Depolarized C02 Concentrator (ED) treats
cabin air in an electrochemical cell. Air containing CO2 passes
through the cathode of an electrochemical cell utilizing an
aqueous electrolyte. The CO2 diffuses to the electrolyte-airinterface where it is absorbed and reacted with hydroxyl (OH)
ions to form carbonate (CQ) and bicarbonate (HCOs) ions. The
carbonate and bicarbonate ions migrate to the cathode where CO 2
is released. When H2 is supplied to the anode side, H20 is also
released; heat and electrical power are generated by the cell.
The process requires a blower, fluids control assembly, and a
thermal control assembly to remove heat fromthe cell.
B-4

AIR
ECSM
MODULE
CO2 <COOLER lJ
EOSM
MODULE
CATBODE
ANODE
I C02, 02
CATHODE
ANODE O2
>AIR
Process Flow Schematic for Air Polarized CO2 Concentrator
The Air Polarized CO2 Concentrator (APC) combines an
electrochemical C02 separation module (ECSM) and an
electrochemical 02 separation module (EOSM) to remove CO2 fromcabin air. The ECSM is similar to the electrochemical cell used
in the ED process; CO2 diffuses to the electrolyte-air interface
where it is absorbed and reacted with hydroxyl (OH) ions to form
carbonate (CO3) and bicarbonate(HC03) ions. The carbonate and
bicarbonate ions migrate to the cathode where CO2 is released.
However, H2 is not supplied to the ABC process; some of the 02 in
the air migrates via the electrochemical process to the anode
where it is evolved with the CO 2. The 02 and CO2 are fed to the
EOSM to remove most of the 02 from the CO 2 stream using an
acid-electrolyte cell. The process requires a blower, fluids
control assembly, and a thermal control assembly to remove heat
similar to the ED process.
B-5

I<swwaMAMINE BZD s (C02 co2
DESOI_TZON CYCLE )
x_-zw, z.xm •&]3t
IADSORPTION CYCLE)
AXRIH20
WATER• STEAMGENERATOR
STEAM
C02
Process Flow Schematic for Solid Amine Water Desorption
The Solid Amine Water Desorption process (SAWD) removes CO2 from
the inlet air stream via an adsorption process. Dotted lines
demonstrate flow for adsorption/desorption cycling initiated when
the absorption capacity of a bed has been reached. Steam is used
to desorb the CO2 from the amine bed. During CO2 absorption, the
CO2 replaces the adsorbed H20 from the previous desorption cycle;
the water removed from the bed places an additional load on the
temperature and humidity control subsystem as it must condense
the water vapor. Regeneration can take place at cabin pressure;
i.e., vacuum conditions are not required.
B-6

LIOHCARTRIDGE
_ZVITALI |_
Process Flow Schematic for Lithium Hydroxide CO2 Removal
This process uses a nonregenerable LiOH cartridge to remove CO 2.
The cartridge consists of a radial flow cylindrical cartridge
containing LiOH which is designed for ease of replacement after
the absorber capacity has been reached. The cartridge alsocontains activated charcoal to control trace contaminant
constituents in the cabin atmosphere. Cabin air enters the
canister through a center tube and flows radially from the center
through the charcoal bed where odor is removed, then throughthe
LiOH, and finally through a particulate filter for dust removal
before exiting the canister. Efficient absorption of CO2 involves
an initial H20 absorption to form lithium hydroxide monohydrate
(LiOH-H20); this is followed by absorption of CO2 by the
monohydrate forming the final carbonate (Li2CO 3) and releasing
H20. The overall process actually is a net producer of H20 andheat.
B-7

H2
MAKEUP
CO2
RECYCLED C02, i12
> COMPRESSOR , _i
I ,
L_I Bo_a _JREACTOR
USED
CARTRIDGES &
CARBON
PURGE
CONDENSERWATER& "ISEPARATOR
WATER
:=
Process Flow Schematic for Bosch Reactor
The Bosch process reacts C02 with hydrogen in the presence of a
steel wool catalyst to produce solid carbon and potable water.
Less than 10% of the input CO2 is reduced with a single pass
through the Bosch reactor, but 100% conversion can be obtained by
recirculating the process gases with continuous deposition of
carbon and removal of water. CO2 is directly reduced to carbon
and water at 650°C in an expendable cartridge with iron catalyst.
Two such reactors are required to maintain continuous operation
and allow for cartridge replacement.
B-8

C02
H2MAKEUP
°=° IAIR _ AIR FAN _-
OUT
C02 BYPASS
_I CONDENSER CR4
WATER
(MET_TION) SEPARATOR WATE_
COOLING COOLING
AIR AIR
IN INY
Process Flow Schematic for Sabatier Reactor
CO2 is methanated with H20 at temperatures from 180°C to 530°C in
the presence of a ruthenium catalyst on a granular substrate. The
reactor produces CH4 and H20 with a stoichiometric reactor feed
ratio of 4 moles H 2 to 1 mole of CO 2. The reactor itself is
equipped with electric start up heaters. The methanation reaction
is exothermic; reactor feed gas enters one end of the reactor and
flows down a central tube where it is regeneratively heated by
the reactor product gases. The reactor is designed so that the
feed gases flow back down the catalyst bed which is located in
the annulus between the center tube and reactor housing. The
reactor is designed to create a favorable temperature profile
with high temperatures in the catalyst bed inlet (260 ° to 430°C)
and lower temperatures in the outlet (90 ° to 260°C). The gasesleave the reactor between 90 ° and 150°C and are cooled to
condense and separate the H20 vapor product. The reactor includes
air cooling to prevent overheating at elevated CO 2 reductionrates.
B-9

MAKEUP
>
C02 >too++,,o.
RECYCLED B2
PURGE
T
SABATIER
REACTOR.
(METBANATION )
____>
FORMATION
REACTOR
CONDENSER& _I
WATER I I
_ L _ _FORMATION
REACTOR
WATER
• USED i
CARTRZDGES& ..........................................................................YCARBON
Process Flow Schematic for Advanced Carbon Reactor System
The Advanced Carbon Reactor (ACR) system consists of a Sabatier
reactor, a gas/liquid separator to remove product water from
methane, and a carbon formation reactor (CFR) to reduce methane
to carbon and hydrogen. In the Sabatier reactor CO 2 is reacted
with hydrogen in the presence of a ruthenium catalyst on a
granular substrate. Operating temperatures range from i00 ° to
600°C, and reactor efficiency is greater than 98%. Water from
the produce stream is then removed with a gas/liquid separator,
and the methane is reduced to carbon and hydrogen in an
expendable CFR cartridge. Two such reactors are required to
maintain continuous operation and allow for cartridge
replacement.
B-10

RECYCLE, CO2 RICH, CO
' t'L'_°LY''_ i_L02
TO
CABIN
REACTOR
l
!
I-i
V
USED
CARTRIDGES &
CARBON
PURGE
T
f
Process Flow Schematic for CO2 Electrolysis/Boudouard
The CO 2 Electrolysis/Boudouard (CQEL/BD) process combines two
SFE functions: CQ reduction and 02 generation. CQ is
electrolyzed using a solid oxide electrolyzer producing 02 and
CO; CO is then catalytically decomposed into solid carbon and CO2
via the Boudouard reaction; CO 2 is recycled back to the
electrolyzer. Since this process generates 02 directly from CQ,
thereby reducing (or eliminating) the oxygen generation via water
electrolysis, the need to clean condensate for water electrolysiscan be reduced also.
B-II

i
a2 <
N2
!]20
PRESSURE
CONTROL
ASSEMBLY
I
I
FLUIDS
CONTROL
ASSEMBLY
SFWE
ELECTROLYSIS
> 02
Process Flow Schematic for Static Feed Water Electrolysis
The Static Feed Water Electrolysis (SFWE) process electrolyzes
water to produce H2 and 02 . Water is fed to the feed compartment
where it diffuses as a vapor through the water feed membrane and
into the anode. The cell electrolyte is an aqueous KOH held on a
retention matrix. H2 and 02 are generated in the cathode and
anode, respectively. _ is used for purging and pressurization
purposes. Normal operating conditions are 80°C and 12 atm.
B-12
i

CABIN AIR,B20 VAPOR
WVE
ELECTROLYSISCELL
"_U2PLUS 02 •
Process Flow Schematic for Water Vapor Electrolysis
The Water Vapor Electrolysis (WVE) uses a hygroscopic electrolyte
(H2SO 4) to absorb H20 vapor from the cabin air and generate 02,
H+ions, and electrons in the anode compartment. At the cathode,
H+ ions are joined with electrons to generate H 2.
B-13

=
_Z
=
.2 <
120
H2
K2/B20
SEPARATOR
l.,°J
SPXlff...,F,CTROLYSZS
CHLL
I o=I.=oSgPARATC_
Io,,o.-- I?
02
Process Flow Schematic for Solid Polymer Electrolyte
The Solid Polymer Electrolyte (SPE) uses a membrane made of
sulfonated perfluoro-linear polymer (NAFION). When fully hydrated
with H20, the membrane is an excellent conductor and functions as
the electrolyte. Deionized and cooled H20 is fed to the anode
where it is decomposed to 02, H+ ions, and electrons. The
electrons travel through the external electrical circuit to the
cathode, while the H+ ions migrate from anode to cathode by
passing between the fixed, hydrated sulfonic acid groups. The H+
ions and electrons recombine on the cathode to evolve as H2. Both
H2 and 02 evolved gases contain water droplets that are separated
from the gas phase. The recovered liquid H20 is returned to the
anode from H20 accumulators. A recombiner catalytically reacts 02
in the H2 that may occur due to 02 to H2 cross-leakage. The SPE
cell operates at 500°C and 14 atm on the 02 side; the H2 side is
at a lower pressure than the 02 side. N 2 is provided to maintain
02 pressures above H2 pressure and for purging purposes.
B-14

CONDENSATEWATER
HEAT _ HEATER
EXCHANGER & FILTER
i UNIBEDS
i-- IODINE
V
IMZCROBIAL> CHECK
.v_Lvz
ACCUMULATOR
USED/TRASH ALCOHOL
BEDS ( POTABLE SORBENTBED
/ WATER i
HEAT
EXCHANGER
Process Flow'Schematic for Multifiltration for Potable Water
Processing
The Multifiltration System is designed to produce potable quality
water using expendable adsorption beds to remove both dissolved
and ionic impurities. Water entering the process is first heated
to 125°C and sterilized for 40 minutes; it is also filtered to
remove any bacteria and particulates present. Flow is then
directed to a series of six unibeds composed of an adsorption bed
containing activated carbon and an ionic exchange resin bed
operating at 25 ° to 45°C; the goal is to have an effluent with a
total organic carbon concentration of 500 ppb or less.
Eventually, the first bed reaches storage capacity and is
removed. The remaining beds are moved up to fill the gap, and a
fresh bed is placed at the end of the series. Microbial growth
is impeded by heating and chemically treating the processed water
at similar temperatures and residence times as the first
heater/filter. Downstream of the unibeds iodine is injected into
the process stream . The stream is then passed through an
alcohol sorbent bed for the purpose of removing low molecular
weight alcohols.
B-15

CONDENSATE I
EXCHANGER
RO
MODULE
ALCOHOL
SORBENT
BED
USED BEDS......................... >
IODINE
V
I MICROBIAL
> CHECK
VALVE
ACCUMULATOR
HEAT
EXCHANGER
POTABLE
WATER
Process Flow Schematic for Reverse Osmosis for Potable Water
Processing
The Reverse Osmosis (RO) process for potable water processing is
designed to remove both dissolved and ionic impurities. Water
entering the process is first heated to 125°C and sterilized for
40 minutes; it is also filtered to remove any bacteria and
particulates present. Flow is then directed to an RO module that
operates at 13 atm and 45°C. Brine is flushed from the system
several times per day. The permeate is passed through an alcohol
sorbent bed used to remove low molecular weight alcohols.
Microbial growth is impeded by heating and chemically treating
the processed water at similar temperatures and residence times
as the first heater/filter.
B-16

CONDENSATEWATER
ORGANIC
SCAVENGER
SOFTENER I
IONPURE
DEIONIZER
>I CARTRIDGEFILTER
IBRM BRM
POTABLE
WATER
Process Flow Schematic for Electrochemical Deionization for
Potable Water Processing
The Electrodeionization (ELDI) process utilizes ion exchange
resins and membranes to deionize feed water. The ionpure
deionizer contains ion exchange membranes that act as barriers to
bulk water flow. The deionizer is divided into three adjacent
compartments: a diluting compartment bordered on either side by a
concentrating compartment. Feed water enters the diluting
compartment (after pretreatment of the feed water by the
multimedia filter, organic scavenger, and softener), which is
filled with the ion exchange resins, transferring through these
resins in the direction of an electrical potential gradient
applied across the compartments. Due to the semipermeability
properties of the ion exchange membranes and the directionality
of the potential gradient, ion concentration will decrease in the
diluting compartment and increase in the concentrating
compartments. The system outputs brine from the concentrating
compartments and purified deionized water from the diluting
compartment. The ion exchange resin is continually electrically
regenerated.
B-17

_'XCH_%"ER
k
H HEATER& FILTER
RO
]40DULE
IODINE
Y
J CHECK
VALVE
i UNXBEDS
BYGZL_I_
Z
Process Flow Schematic for Reverse Osmosis for Hygiene Water
Processing
The Reverse Osmosis (RO) is designed to produce hygiene quality
water using a combination of an Ultrafiltration (UF) Module (to
remove suspended solids, colloids, and macromolecules), a RO
module (to remove salts and compounds with molecular weights
>i00), and expendable adsorption beds to remove both dissolved
and ionic impurities from the RO permeate. The process is similar
to that used for potable water processing with the exception of
the lack of alcohol sorbent beds, the addition of the UF Module,
and the type of material in the Unibeds. Water entering the
process is first heated to 125°C and sterilized for 40 minutes;
it is also filtered to remove any bacteria and particulates
present. Flow is pumped to the UF Module with UF permeate
entering the RO module. Brines from UF and RO are recycled and
purged periodically. Flow is then directed to a series of six
unibeds composed of an adsorption bed containing activated carbon
and an ionic exchange resin bed operating at 25 ° to 45°C; the
goal is to have the effluent reach a total organic carbonconcentration of less than i0 ppm. Eventually, the first bed
reaches storage capacity and is removed. The remaining beds are
moved up to fill the gap, and a fresh bed is placed at the end of
the series. Microbial growth is impeded by heating and
chemically treating the processed water at similar temperaturesand residence times as the first heater/filter. Downstream of
the unibeds, iodine is injected into the process stream.
B-18

HYGIENE
EXCHANGER 8EATER& FILTER
UNIBEDS
V
USED/TRASE
BEDS
IODINE
V
MICROBIAL
CHECK
VALVE
ACCUMULATOR
HEAT
EXCHANGER
HYGIENE
WATER
1
Process Flow Schematic for Multifiltration for Hygiene Water
Processing
The Multifiltration System is designed to produce hygiene quality
water using expendable adsorption beds to remove both dissolved
and ionic impurities. The process is similar to that used for
potable water processing with the exception of the lack of
alcohol sorbent beds and the type of material in the unibeds.
Water entering the process is first heated to 125°C and
sterilized for 40 minutes; it is also filtered to remove any
bacteria and particulates present. Flow is then directed to a
series of six unibeds composed of an adsorption bed containing
activated carbon and an ionic exchange resin bed operating at 25 °
to 45°C; the goal is to have the effluent reach a total organic
carbon concentration of less than i0 ppm. Eventually, the first
bed reaches storage capacity and is removed. The remaining beds
are moved up to fill the gap, and a fresh bed is placed at the
end of the series. Microbial growth is impeded by heating and
chemically treating the processed water at similar temperatures
and residence times as the first heater/filter. Downstream of
the unibeds iodine is injected into the process stream. The
stream is then passed through an alcohol sorbent bed for the
purpose of removing low-molecular-weight alcohols.
B-19

RECYCLED
PRETREATED
(_NCE_£'RA_D
HOLLOWFIBER
MEMBRANEEVAP-ORATOR
I
_GAS/LZQUID
SEPARATOR _
Process Flow Schematic for Thermoelectric Integrated Membrane
Evaporation Subsystem
The Thermoelectric Integrated Membrane Evaporation Subsystem
(TIMES) is designed to produce hygiene quality water from urine
waste water attaining a 95% water recovery efficiency. Before
entering TIMES, urine is chemically pretreated to fix free
ammonia. After pretreatment, the waste water stream is first
heated and then passed through hollow fiber membranes for
evaporation at low temperatures. The evaporator consists of six
bundles of i00 Nafion tubes each. Steam evaporates from the
outer surface of the membranes and is partially condensed before
flowing to an air cooled heat exchanger. Noncondensible gases
entrained in the condensate stream are removed by a pump which
functions as a gas/liquid separator. Unevaporated waste water is
recycled until solid concentrations reach a predetermined level,
at which time the concentrated brine is removed for disposal.
Using thermoelectric devices, the latent heat of condensation is
recovered and reused in the evaporation process.
B-20

P_TREA_
PRODUCTWATER
RECYCLEDBRINERECYCLE/FILTER
TANK
(CONCENTRATED
_ATEXCHANGER
Evaporator
Condenser
DISTILLATIONUNIT
.>
Process Flow Schematic for Vapor Compression Distillation
The Vapor Compression Distillation (VCD) system maintains a
vapor/liquid interface using centrifugal force created by a
rotating drum. Waste water is discharged to the inner surface of
a centrifugal evaporator drum inside the distillation unit. Water
vapor is removed from the evaporator, compressed to raise its
saturation temperature, and then forced against the outer surface
of the rotating drum where it condenses. The latent heat of
condensation is transferred through the drum wall and reused in
the evaporation process. Unevaporated waste water is
recirculated until solid concentrations reach a predetermined
level, at which time the concentrated brine is removed for
disposal.
B-21

_RATZD
URINE
I
T
RECYCLE
HEAT GASES
i_CCL_d_ _-'_'OXYG_I
Process Flow Schematic for Vapor Phase Catalytic Ammonia
Reduction for Urine Processing
The Vapor Phase Catalytic Ammonia Removal (VPCAR) Process
utilizes catalytic reactors to react vaporized impurities in the
feed water to innocuous gases. Urine is vaporized at 100°C in an
evaporator. The process employs two catalytic reactors. The NH 3
oxidation reactor uses a Pt catalyst to oxidize NH 3 to a mixture
of N2 and N20 and volatile organic hydrocarbons are oxidized to
CO2 and water vapor at 250°C. The N20 decomposition reactor uses a
Ru catalyst at 400°C to N2 and 02 . The recovered H20 has little
NH 3, few hydrocarbons, low conductivity, and only requires pH
adjustment to be a candidate for potable water.
B-22

TREATED URINE-
COJDEMSATE
TO POSTTREATMENT
I AIR FAN
<
T .
CONDENSER
WICK
EVAPORATOR
I " USED
..................>WICKS &
URINE SOLIDS
i
COMPRESSOR
COOLANT<
EVAPORATOR
ii_/LZQUZD
Process Flow Schematic for Air Evaporation for Urine Processing
In the Air Evaporation (AIRE) process, treated urine is pumped to
a wick package along with a dry air stream. The circulating
heated air evaporates water from the urine leaving solids in thewicks. When sufficient solids accumulate in the wicks, the feed
is stopped and the loaded wicks are dried down and replaced.
Humid air leaving the wick evaporator passes through a heat
recuperator and a condensing heat exchanger. A water separatordownstream of the condenser removes water from the air and pumps
it out as condensate. Iodine is added to the water before it is
sent to post treatment before it can be used as hygiene water.
B-23

FEED
[WATER&
SOLIDS ]
VENT GASES
REFRIGERATION 1
(-26 r)
< VAC[_(JMPUMP '4------ _
TVACUUM
EVAPORATION
HEATER
REFRIGERATION 2
(-50 F)
HEATER
lWATER
SOLIDS
6O F
Process Flow Schematic for Freeze Drying
The freeze drying (FRZ) process consists of four major steps as
illustrated above:
(i) pre-freezing at -3°C to freeze dissolved and suspended
materials along with water;
(2) vacuum evaporation or sublimation of the frozen ice at
<0.0001 atm;
(3) re-freezing water vapor at -15°C and
(4) melting of the frozen ice at 16°C.
B-24

[m&
_LZDS]
CONDENSER
REGENERA_I"VEB
VAPOR
• VL'N_ GASES
r _r.tsSxTm
M
_W
VAPOR/SOLZD8SEPARA_OR SOLZDB
Process Flow Schematic for Thermal Drying
The Thermal (or hot) Drying (HD)process uses power to dry the
feed at temperatures exceeding 150°C. Regenerative heaters are
provided to increase the thermal efficiency. Potential waste heat
sources, rather than electrical power, could be process waste
heat from other physical/chemical processing steps, such as CO2
reduction.
B-25

FHD
[WITK_&
SOLXDS]
VAPORABSORPTION
CO2
¢ONDlmSL_
fV_OR/SOLZDSSEParATOR
Process Flow Schematic for Combustion Oxidation
The Combustion (COMB) Oxidation process uses pure oxygen to
incinerate the organics in the feed. Power is also required as
the stream has a low heating value. An ambient pressure furnace
is used; ash solids residue is separated after incineration.
After recovery of some of the waste heat in a regenerative
heater, the water condensate formed from the original water and
the oxidized organics is condensed. Unreacted or partially
oxidized organics and other contaminant vapors are absorbed. CO2
formed from oxidizing the organics is recycled to the air
revitalization subsystem to reduce the CO2 to carbon and oxygen.
B-26

I CO_AMINANT
VAPOR
ABSORPTION
COHDEHSER
TDRY BOIUlR
T
POWER
CO2
CONDENSATE
__+---• SOLIDS
Process Flow Schematic for Wet Oxidation
The wet oxidation (WOX) process uses pure oxygen to oxidize the
organics in the feed in a reactor maintained at 290°C atm and 150
atm. Power is also required as the stream has a low heating
value; in addition, power is required to pump the feed waste
stream and compress the oxygen. Ash solids residue is separated
after the reactor in a dry boiler, operated at low pressure and
over 230°C. The water condensate formed from the original water
and the oxidized organics is condensed. Unreacted or partially
oxidized organics and other contaminant vapors are absorbed. COz
formed from oxidizing the organics is recycled to the air
revitalization subsystem to reduce the CQ to carbon and water.
B-27

FEED
['_"_R&
80LZD5 ]
COOLA_ ZN
OXTGI_COMPRESSOR
BZGB PRESSUREPUMP
CONTAMINANT
VAPORABSORPTION
CONDENSER
RI_ENERATIVE
HEATER
CO2
COMDEmS_TB
mC20R
]IiORGJUlXC SALT _--_ GOLIDB
SEPARATOR
Process Flow Schematic for Supercritical Water Oxidation
The supercritical water oxidation process uses pure oxygen to
oxidize the organics in the feed in a reactor maintained at
supercritical conditions for water: over 250 atm and 600°C.
Power is also required as the stream has a low heating value; in
addition, power is required to pump the feed waste stream and
compress the oxygen. Ash solids residue consisting primarily of
inorganics, can be separated by an inorganic cyclone salt
separator, as inorganics are insoluble and can be precipitated at
reactor conditions. Regenerative heaters are used to recover some
of the reactor heat; the water condensate formed from the
original water and the oxidized organics is condensed. Organics
are estimated to be almost completely oxidized due to the high
conversion rate. Unreacted or partially oxidized organics and
other contaminant vapors are absorbed. C02 formed from oxidizing
the organics is recycled to the air revitalization subsystem to
reduce the CO 2 to carbon and water.
B-28

I
REPORT DOCUMENTATION PAGE Form,_pprovedOMB No. 0704-0188
"JO:< "eO3r:,r__. _ur_.=. " "¢r t_ls <=r._'_':,_On ._'f _nfocma:lOP rs .-3s_T_a_ec .'0 =_erage _ hour Oer res_::x3_se, ,_':L, dEn_ I:_e _:'_e _ot tevlewll_ in$[ruc'[iorts, searcS_P,,; ex_stlt'_ 9 data $Ource_,
,_3_P_rRr_ _r_C _'_l_a=_l._ 1[he g_:a _e.63de_l, a_cl col_Dle_t_ ._c re_,ew,nc_ :he collection of in, _ Dremat!Gr_ _r_o cOm_e_s reclard ng th s burden estimaie Or _ny other a_Dect of this
<ollec:_on Gf IrlfoI t_a_r_ ,ncludin_ sugge'_t_Ons for reducmo th,s b_rden _0 ,_/ashm_to_ HeadGuar_e_'_, S_r_lcE-$, _,rec'_.of_te _'or _for_'_a_lon Ol_eratlO_ _rl_ _epOCt$, 1215 ]ef_'efSo_
i ,_av s H _'_a._, Su,te 120== _,t ncj',_n _:, 22202-4302, and t'o _he O_l£e O_ "vlanagEme_._ arid 8uOge_. _3,D_'rwcri( Re_uc'[io_ Pro ed (0704-01SB).Washingt,'Jn. D(" 20503.
1. AGENCY U_;E ONLY (Leave blank) 2. REPORT DATE 3. REPORT TYPE AND DATES COVERED
October, 1993 Technical Memorandum
4. TITLE AND SUBTITLE 5. FUNDING NUMBERS
Life Support Systems Analysis and Technology TradesFor a Lunar Outpost
6. AUTHOR(S)
J.F. Ferrall, G.B. Ganapathi, N.K. Rohatgi,and P.K. Seshan
7. PERFORMING ORGANIZATION NAME(S) AND ADDRESS(ES)
JPL4800 Oak Grove Drive
Pasadena, CA 91109
9. SPONSORING/MONITORING AGENCY NAME(S) AND ADDRESS(ES)
National Aeronautics and Space AdministrationWashington, DC 20546-0001
11. SUPPLEMENTARY NOTES
8. PERFORMING'ORGANIZATIO_IREPORT NUMBER
NASA TM 109927
10. SPONSORING / MONITORING
AGENCY REPORT NUMBER
TM 109927
i2a. DISTRIBUTION/AVAILABILITY STATEMENT
Unclassified
:13. ABSTRACT (Maximum 200 words)
12b. DISTRIBUTIONCODE
Unlimited / Unclassified
The NASA/JPL life support systems analysis (LiSSA) software tool was used to
perform life support system analysis and technology trades for a Lunar Outpost.The life support system was modeled using a chemical process simulation programon a steady-state, one-person, daily basis. Inputs to the LiSSA model include
metabolic balance load data, hygiene load data, technology selection, processoperational assumptions and mission parameter assumptions. A baseline set oftechnologies has been used against which comparisons have been made by runningtwenty-two cases with technology substitutions. System, subsystem, andtechnology weights and powers are compared for a crew of 4 and missions of 90
an 600 days. By assigning a weight value to power, equivalent system weightsare compared. Several less-developed technologies show potential advantagesover the baseline. Solid waste treatment technologies show weight and powerdisadvantages but one could have benefits associated with the reduction of
hazardous wastes and very long missions. Technology development towardsreducing the weight of resupplies and lighter materials of construction was
recommended. It was also recommended that as technologies are funded fordevelopment, contractors should be required to generate and report data usefulfor quantitative technology comparisons.
14. SUBJECT TERMS
17. SECURITY CLASSIFICATIONOF REPORT
Unclassified
Life support; Lunar outpost; systems analysis
18. SECUREY CLASSIFICATION
OF THIS PAGE
Unclassified
NSN 7540-01-280-5500
19. SECURITY CLASSIFICATIONOF ABSTRACT
Unclassified
15. NUMBER OF PAGES
11216. PRICE CODE
20. LIMITATION OF ABSTRACT
Unlimi£_d
Standard Form 298 (Rev. 2-89)Pre_rlbed by ANSI Std Z39-18298-102

ZZ

r .
m
_-i-.__r

Z
=
4__--
w
I
m_
I
i
m
iI
=
I
i