I) J Bill ,;fl - Bf(K ( r, '2-) - SFU.cakkasa/Econ842_IntlRBC.pdf · PropertIes of BusInessCycles...
17
I) Lrk,1t '0_1 lfe6 J Bill ,;"fl C•• /es -Bf(K ( r, "'2-) 2.) bc,"~sl'Ol1 J - T~MSPO ., •• " - "'hAI"'~/, &o.rJ.s ( () . e e ) 1.) :r,,'OMple 14 •. ,1<, .&.~kf (,.,uc.l"" (rE.1f~", )
Transcript of I) J Bill ,;fl - Bf(K ( r, '2-) - SFU.cakkasa/Econ842_IntlRBC.pdf · PropertIes of BusInessCycles...
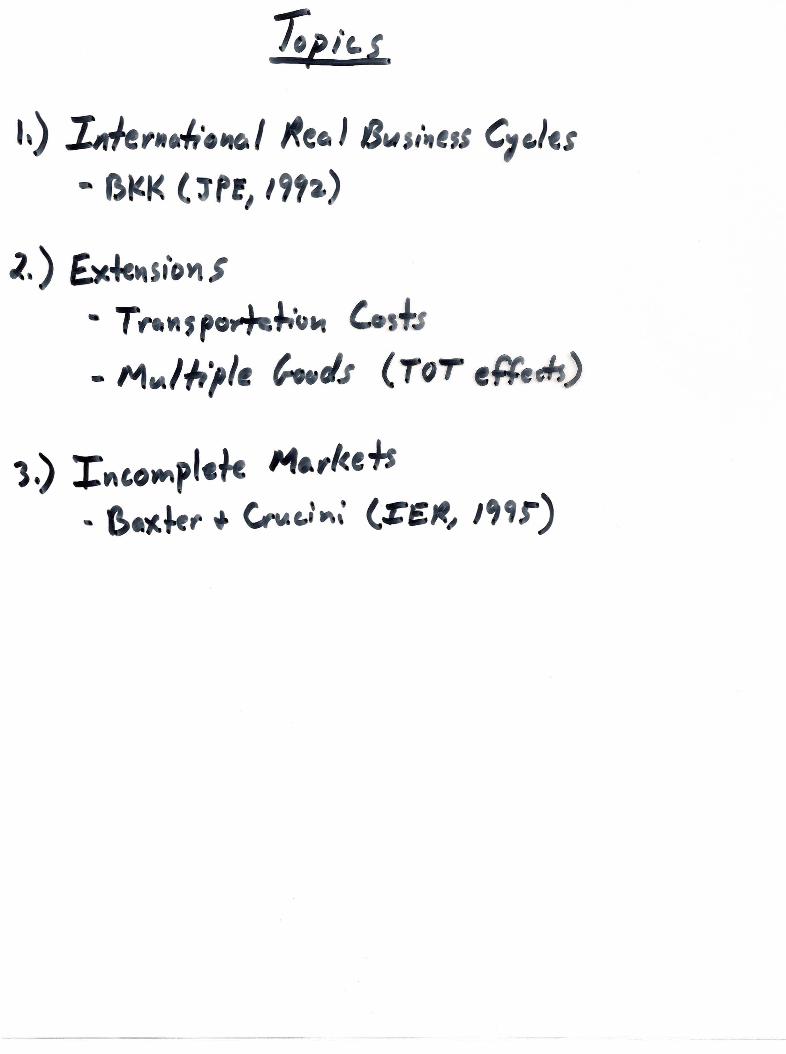
I) Lrk,1t '0_1 lfe6 J Bill ,;"fl C ••/es- Bf(K ( r, "'2-)
2.) bc,"~sl'Ol1J
- T~MSPO .,•• "- "'hAI"'~/, &o.rJ.s ( () . e e )
1.) :r,,'OMple 14•.,1<,. &.~kf (,.,uc.l"" (rE.1f~", )

~W\·ec. "':a bS'"f MoI,islQ
• ~t .fC "o1ll) 30i••••",p)ic.••-h'OIl\S 01'~t"''') !''4,'I,I".2 ·(W~. lie SI' S.W'Oflels I ,'I-~ ,..J. sJ..d&JQwJ. ~l'\oI0~eIt ••••s J.~(J'" $fIIP"~
eeale '\~e AsltAM '"$••) ' ••••p'ele M.~h ==/ f\tA~+ t\/i- SJ.t,t~-) e,III .'1. ( Pt.f,
2.) No'" ., · 0••" ltre.'" v ." lies.
e
1.) 2 (S2"""'";C.) e-~'tJ - •••" ~" "J,i,,"tOl'\ If.t "~, •., •.h:,,,,·t ~Clw'f'" ~~ ,,,,,,,."""J., ••, .,"'" II ,,"',
£t. ) I -3ooJ IN. 1CtIM$ J,twIt .f\ Ar.JU 111,;}(W~." ,~)( ~,~ J.I-t,)
$',) L,,'o~is ,·tI1t",.o~llf lelw'fltt eO"" ""',.C.) O"'J $OVfU of ,,~,:.~ 'S ,NI",J",,? sJ,tkt,
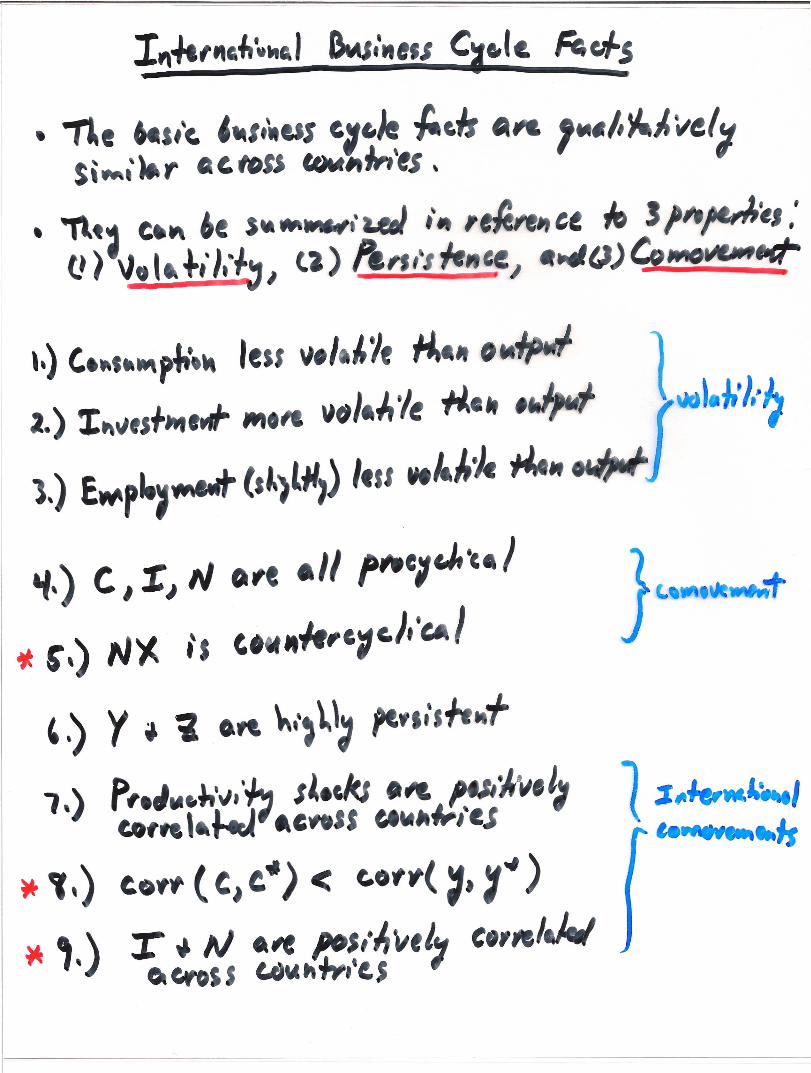
I,,-It ,,,,",,.•••, I Bt.u,'••,ss ~.I & Ft:.c;/-s
• -rle 6«s,c. ,.s.ltUS "file tat.1t ••• 1fA."-I.J,~elftl$,.,•.r 1& t.tolS t.tltA"Ir"ts, '
h) c.."t••~yIt" less '1,1 ~1t .,... " 0
2.) X"lIfS+W,..r """ lJfJ"J. It +I.•• ,1,) E~pt. -.r Csl)lll,) Itu .It./'-Jc tltt,.
'f. C I ~J N o,e .11 fl-c1c,h'c"/~ S\) N~ is t. ,.h,c'lC.J. 'UtI
,,) y ~ ~o." 'h",~\~ptfS"S il-
l.) P,.J,-.~''''·~s~.cks.~ '- j".llco,,., ~ .c~JS f,t~".li-lcS
* , ,) t.•.,.,( CJ c:') < e-o,.,(~.,"' )
~,.)r. N -" fJ:O$"~Vf'" '01111J.1o-CftSJ " ••••w.'t$ ,
1:t1l~k.t..1. """"'·'''11

PropertIes of BusInessCycles In OECD Economies
Standard Ratio of Standard DeviationDeviation (%) to Thlltofy Co"ei'ationwith Output
Autoco"-Country Y nx c x g n z y c' x g nx n 4
Australia 1.45 1.23 0.66 2.78 1.28 0.34 1.00 .60 .46 .67 .15 -;01 .12 .98Austria 1.28 1.15 1.14 2.92 0.36 1.23 0.84 .57 .65 .75 -.24 -.46 .58 .65Canada 1.50 0.78 0.85 2.80 0.77 0.86 0.74 .79 .. 83 .52 -.23 -.26 .69 .84France 0.90 0.82 0.99 2.96 0.71 0.55 0.76 .78 .61 .79 .25 -.30 .n .96Gennany 1.51 0.79 0.90 2.93 0.81 0.61 0.83 .65 .66 .84 .26 -.11 .59 .93italy 1.69 1.33 0.78 1.95 0.42 0.44 0.92 .85 .82 .86 .01 -.68 .42 .96japan 1.35 0.93 1.09 2.41 0.79 0.36 0.88 .80 ..80 .90 -.02 -.22 .60 .98Switzerland 1.92 1.32 0.74 2.30 0.53 0.71 0.67 .90 .81 .82 .27 -.68 .84 .93United"l(ingdom 1.61 1.19 1.15 2.29 0.69 0.68 0.88 .63 .74 .59 .05 -.19 .47 .90United States 1.92 0.52 0.75 3.27 0.75 0.61 0.68 .86 .82 .94 .12 -.37 .88 .96Emope 1.01 0.50· 0.83 2.09 0.41 0.85 0.98 .75 .81 .89 .10 -.25 32 .85
Notes: Statistics are·based on Hodrick·Prescott-filtered data. Variables are y, rea1 output; c; real consumption; x, real fixed investment; g real government purchases; 1lX,
ratio of net exports to output, both at current prices; n, civilian employment; z, Solow residuaJ.. defined in text Except for the ratio of net exports to output, statistics referto logarithms of variables. Data are quarterly ftorn the OECD's Quarterly National AcCounts, ('XCept employment, which is from theOJiCD'~Main ~conomic1ndicators.1be' sample periQcljs I:,97:.•.......':.::o:I,.:to..•., :.•.,..:.l.•..•:.9.9Q;Il;: .••..:'. .:::.••.··: ..··, >.-.0'.. ':"••,...•';,•..,••••.-:.--: : , .....•........•..•.. , .' ...•.. ·':..;.,.·.!.·.·::.~::.;.: .•.:_:.•_::.:~._B..·.; :.·.,:.:.i·.':.~..:_;.::c.:·.:_::.:~.·.i~.t·;;;t;i.:;: <,.:.: , •
. ".-,....:.-...;~::/.:.j .:::~:::;:.:!~.;::::{.:\-::Z:?<~;}.- . - . -_ .~\::{:;{~.~fj;:.;..... :~~~~[~·::~~E~J;~{,~1~~~{%i1W#t?}tf0MJft.;:tf;f~ ~-. '" -~ -
In~ Comovements In OECD EconornI8s
Corre1olion Of Each Country's Variablewith Same U.s. Variable
Country y c x g n
Austtalia .51 -.19 .16 .23 -.18Austria .38 .23 .46 .29 .47Canada .76 .49 -.01 -.ot .53France .41 ..39 .22 -.20 .26Germany .69 .49 .55 .28 .•52Italy .41 .02 .31 .09 -.01Japan .60 .44 .56 .11 .32Switzerland .42 .40 .38 .01 .36United Kingdom .55 .42 .40 -.04 .69Europe .66 .51 .53 .18 .33

0.,,- c. :r~ffJ ,',"+SS••• , ~, i", 1!.1< ~ e.~ct"': I,) I,ll,,, I••.,.,..~
~) r9"O'& rJ,'s4,.,,,,k.l", '" I•."s.,«
ie,~".t.It '-If
~ii ~ i .'of It~+nit
+
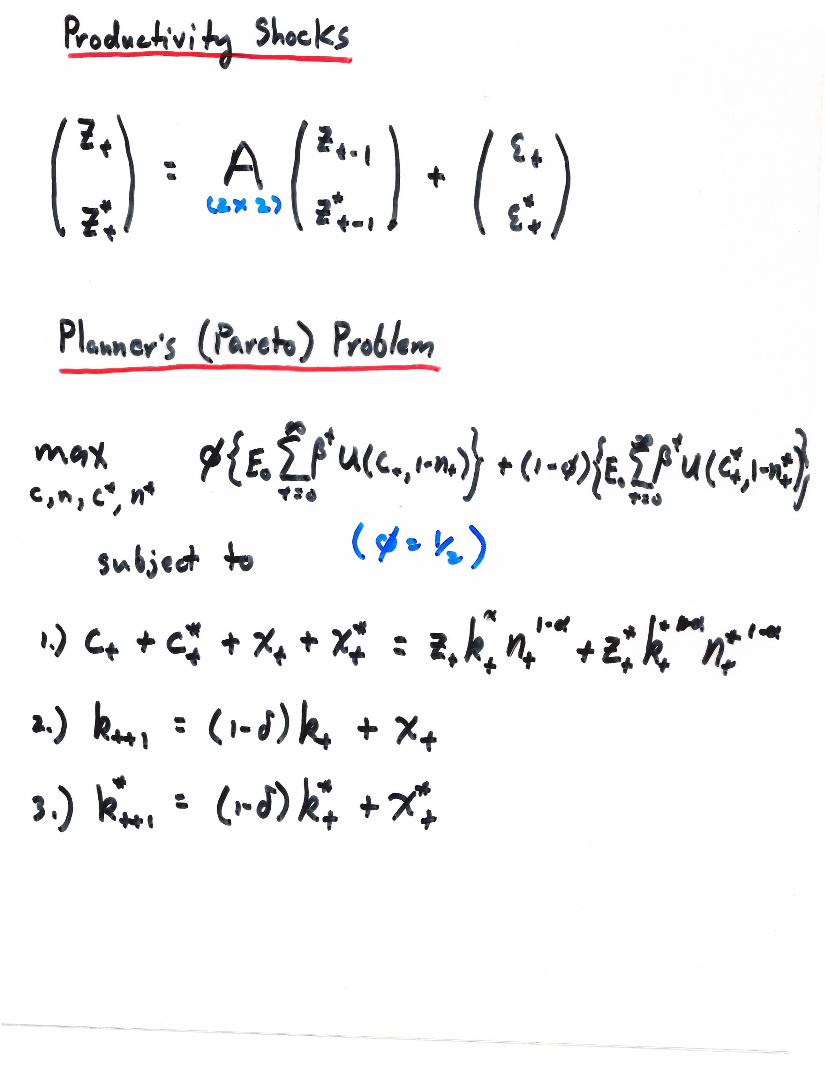
• .• '-~ ,." • L· H fa''''t.) c... .,. C.. .•. ~+ .•..-X+ : i."+ ~ + !,."* nila.) ~.•.•, : (I-I) k. + X.,.,.) ,,:., ~ Ce-l) k~ i- ~

~o/~/;Ol1 ~~
,.) ,.""p.-I« S'f.eJ~S.f.HI.) c."·'f"k ~r ••••••k,. v,/tA" I.
~f&~ffS • .p '"' S S ~)~,.h •'M.~ ·~"'~~.'"
'f.) c.Wl~~C ( ) "t,~e'H..ol
.. Ie 1
Po I , ( FtA~cJ,'0'" S
'+: ~(h+ I h:J l"l !~)c.~:~·l~J k:J ~ 1 -2':.)fl•. : ~ ( It.,~:) ~•.J ~~ )
n~~ ~•.(~+J It:J '.) I:~, : .(:(k I k:) -2f-) a~)~, ~ .p'(It.. J It~I 2''1") !~)

C"I;b,.I,·ob, (T,'~&lA~,'4-C Kt ~.", )
(!I: ."
9': "vf: ~01: ."
I~, f J
A:.
lit ~ •7I.'., sle.••• f " &, , Y)6~ •.f (_."s/.. · )+'~..lINt I-J """~A
e"W •
0: ·o2S-
~ = '1
.08' . ",
VlV'( to): v.r( f,-): ( ,0"Sl)"
C.o,,,( t I toC) :, '&rs
c.,,~e•.+S•
•,) 'J,." c.o~1*.J""'1 ~'" $0 10 't$ ~ Is, III' y,~IOJ.,. ., ~. ~"f,,'",•..,..,a"'" • 1';+o~ , IfA"."'"" e.~M'·(S
a.) ~.,. 6f.JffI 06\ !W1"I"",,,,f I'If'I- 4..'1.

BusIness Cycles In TheoretIcal Economies
A. BusIness Cycle PropertiesStandtlrd Ratio of Standard Deviation
Deviation (%) to Thtztofy Correlation with OutputAutocorr.
Economy y nx c x n z y c x nx n z'
U.S. data 1.92 0.52 .75 3.27 .61 .68 .86 .82 .94 -.37 .88 .96Benchmark 1.50 3.77 .42 10.99 .50 .67 .~2 .77 .27 .01 .93 .89Transport cost 1.35 0.37 .47 2.91 .47 .75 .61 .81 .92 .23 .92 .98Autarky 1.26 .54 2.65 .91 .99 .62 .90 .96 .91 .99
B. Intematlonal ComovemenfsCorrelation of Foreign and
Domestic Variables
Economy y c x n zU.S. data .66 .51 .53 .33 .56Benchmark -.21 .88 -.94 -.94 .25Transport cost -.05 .89 -.48 -,48 .25Autarky .08 .56 -.31 -.31 .25
Notes: Slatistits are based on Hodrick-l'resc:ott-fiItdala. Variables are defined in notes to'Thblc 11.1. Entries are averages over twentysimulations of length 100. The data column refers to the United Staees in part A and to correlation between the United States and Europe inpartB.

~t'o~\t""" ~;+~ eQSC',·..•c /-1"/./
t.) r I- I'J"I.. art 100 vo/fAh'/e.
~.)c ,s h» ~I"~"c.orrcIGhJ 0(10 s tAU,,'/Y"e.s
3.) Y I XI + N .f'( tfe".+"~c~c..rte ItJ.I-eJQ c.~oSS f.-"tA ••Iv-,·e$
E~eM SIO" 1~'Ti .ti•.~ l=ri~'."s
. ~\A~+-ot- •. +,,,,1•. toW or (r(IN.): "t' ~-"~W\ tl o,,~)h (CS • .-t'U cor.sh/llf'/-
~: ,'/~ss -=) VN1i",,,,J '~'''I''''~co, ,'s t>.Sl \ • _ •.L /.,W~e" JJ~I : 0~

•O"j
I.) eo-c.L c.o~",.Jv'1 ,', sper".1 ,'uJ I~ fA"ot ;+$ 0 ~ (t'••hf'wt,tI,.,,/e) ,rJOtJI.
~,) Co~,,~,'tC .J.r,Jf. II,H,w,eJ,;. 'J I ~~I-I'll';'+-~, 1'ooIs,
).) HtW\e CoM".w~ lues I p Is wi::1,'1..1 io.foo ,.,.rJ"'t.t ,'••-h"ttttef, h , ·I='Off'''~(O""~. I $es C.,,'I-/ ~ 1.,,60,. IrJ
p,ofIfIt't '~''"tIJ!,~ "Id H ~ ,.
fit) 1=. I aooJs QfC p"'IA"" 11/4 ~ CE.i"~~M"",-#o"A, ,,..~ oJo, I.

p, tf.re",&cs
(S,,~e.s B~t)
Tec.~lIl.r.u.Q+ t Q~ :
fA": H DPOm f~,.••• ft, F
~ : F •. ,..flt,1•.,.. h /tI
c••. t+ +,. : (,(At,&,.): [u~" + 't'·'J r.-•.
c.: + ~~ 4- ~; ~ G-la: J~:):: [~fA·'·.,.".~ *r(j : Y,,: e.l •.tI-•.Co jf; ~'fA & ,
1+ "",J F 'OtJJ
w: S~.t'C P" ~c:.ref

Wi+-'" +~\~$,ec.a'~'~+''o''J
: P.,.'te J IMptrU _ ~ _p, ~*'· r+ -
~\c " l.",~ Pi- = .Jr.vJ ...k ~ (~/~)
LC)\rI c.l&rh (r Sw,JJ) =i ptl'tes setl$,.J,'flf h,~ 'I-/el-=) \Sf teA ve"c.:~tV ,
- -
J H- 's TwJe ~ }o.Mce J
I N~: ~.•+ •.. e b.,.c.. ~~+iorr: ,. S' ($••toll e/&I. C4Jf ,.: ~,
W ae,of- So i't..J. i~rl:!.. I~ •7 6-~"- · ~ ·

Properties of the Terms of Trade in OECD Economies
Correlation of:SD Autocorr.
Country p(%) p (p, nx) (p, y)
Australia 5.78 .82 -.10 -.27Austria 1.73 .46 -.24 .04Canada 2.99 .85 .05 -.05France 3.52 .75 -.50 -.13Germany 2.66 .85 -.08 -.11Italy 3.50 .78 -.66 .38Japan 7.24 .86 -.56 -.22Switzerland 2.85 .88 -.61 .41United Kingdom 3.14 .80 -.58 .09Burope 3.68 .83 30 -.20
Notes: Statistics ~ based on HodDck-Prescon-filtered dala. Variables~ p, terms of trade. relativeprice ofbnports to exports; y. real output; ~ratio of net exports to output, bo1h at current prices. Except for the ratioof net elIpOrts to output, S1lItisticsrefer to Iogaritbms of variables. Mostvariables are from the OECD's Quarterly National AccoUIIIS. The sampleperiod is 1970:1 to Im-.ll.
Notes: Statistics are based on Hodrick-~ dala. variables are definedin the notes to ThbJe 11.5. &tries are averages over 20 silnulatioos of length 100. Thedata column Mfers to the United States.

,,) M."•.,I ) ~." ,
C I IS
) M.tI.' eo",.,.+ c • .,.r. oH.ec.o,~ I ») 0 ~,. VtAf" ( I " ) lOt' 0
Ulo\ ~,,4-c.~pe,s,',h",c .t p
vol ""/,', .~ fs ),
e (,l'l)C) ~ (),J..!
h-M
te'flt.,~)o ~ ••• , ••••• _-,. ••• ~••

•----'.Tfa
-rrr1" "lIIt I. ;t;t,~et,'-.IltApP', ./ "''''''IIt't.lrw1~~~,,~,.~e,~,k p,,-ee.,
o·

1 2Elasticity of Substitution
Rgure 11.4 Effec1s 9f varying the ElastIcIty of SubstiMion be1ween foreign andDomestic Goods on the VoIotIlIty of the Terms of Trade and the Import RatIo
co1ii~.4oo
.2
-.2o 4 6
Elasticity of Substitution
Agure 11.5 Effects of varying the 80stIcity of SubsfffuIion between ForeignDomestic Goods on the Cross-Country Correlations of selected variables