
I i ht f C ili Cli iInsights from Carilion Clinic: Healthcare Reform...
51
I i ht f C ili Cli i Insights from Carilion Clinic: Healthcare Reform, Accountable Care, Medical Homes Nancy Howell Agee Chief Operating Officer Chief Operating Officer Mark Werner MD Mark Werner, MD Chief Medical Officer
Transcript of I i ht f C ili Cli iInsights from Carilion Clinic: Healthcare Reform...

I i ht f C ili Cli iInsights from Carilion Clinic: Healthcare Reform, Accountable
Care, Medical Homes
Nancy Howell AgeeChief Operating OfficerChief Operating Officer
Mark Werner MDMark Werner, MDChief Medical Officer

Key FY ‘09 Carilion Clinic StatsCarilion Clinic Stats
• Employees 12,305• Licensed beds 1,215• Admissions 49 642• Admissions 49,642• Avg. daily census 624• Avg. daily ED visits 508.4g y• Total ED visits 185,595

Healthcare in the U.S.Large, complicated, ever-evolving, high variability
1960 – 2007: Outgrown all other economic activity- Health spending grew from 5.2% to 16% of
the economyO t f k t h k t 11% hil- Out of pocket expenses shrunk to 11% whilepublic “share” grew to 16%
Endless stream of billable eventsEndless stream of billable events
- High margin ambulatory services
- Procedure oriented services
- No money for coordination
Malpractice vs standard of care

Said Again: Healthcare SpendingSaid Again: Healthcare SpendingDollars are skewed toward separate
t t t id f di tpayments to separate providers for discrete services, particularly specialty and technology intensive servicestechnology intensive services
Volume is rewarded
No incentives for coordination, efficiency
Disincentive for improving quality (in theDisincentive for improving quality (in the hospital)

Wide Variation Across StatesWide Variation Across StatesMassachusetts ModelMassachusetts Model
Maryland – hospital budget regulation
North Carolina – relatively generous payments to PCP
New York – nonprofit insurances and hospital
Tennessee – free-wheeling competition
Ohio mostly solo and private practiceOhio – mostly solo and private practice physicians

Worries AboundC ’ h 50 ld i hCan’t change a 50-year-old system overnight
Grave concern about “unknown” and “unknowable”
Broad cuts to hospitals oad cuts to osp ta s
Decrease DSH payments
Public Plan
End of life
Illegal aliens
Pace
How to pay for it

Putting U.S. Healthcare on Ri ht T kRight Track
Strengthen and broaden co erageStrengthen and broaden coverage
Lower trajectory of healthcare spending
Improve outcomes (e.g. quality)
Assure value: Quality vs costAssure value: Quality vs cost
Align incentives and coordinate care
Don’t break the bank

What’s In the Proposed Reform Packages?What s In the Proposed Reform Packages?
1600 page bill - House1600 page bill House
Devil’s in the details
You can’t add more services and reduce costs without change
Change is hard and takes time to stick

Key Components - Medicarey pMarket Basket – Both houses recommend year over year reductions in market basket update to inpatient and outpatient services; House includes skilled nursing homes
M di C i i S t E t bli hMedicare Commission – Senate: Establishes an independent commission to submit proposals for reducing Medicare costs
DSH – Both houses recommend reductions; House ties to reductions in uninsured
Geographic Variation – House: directs IOM to address inappropriate variation in Medicare expenditures

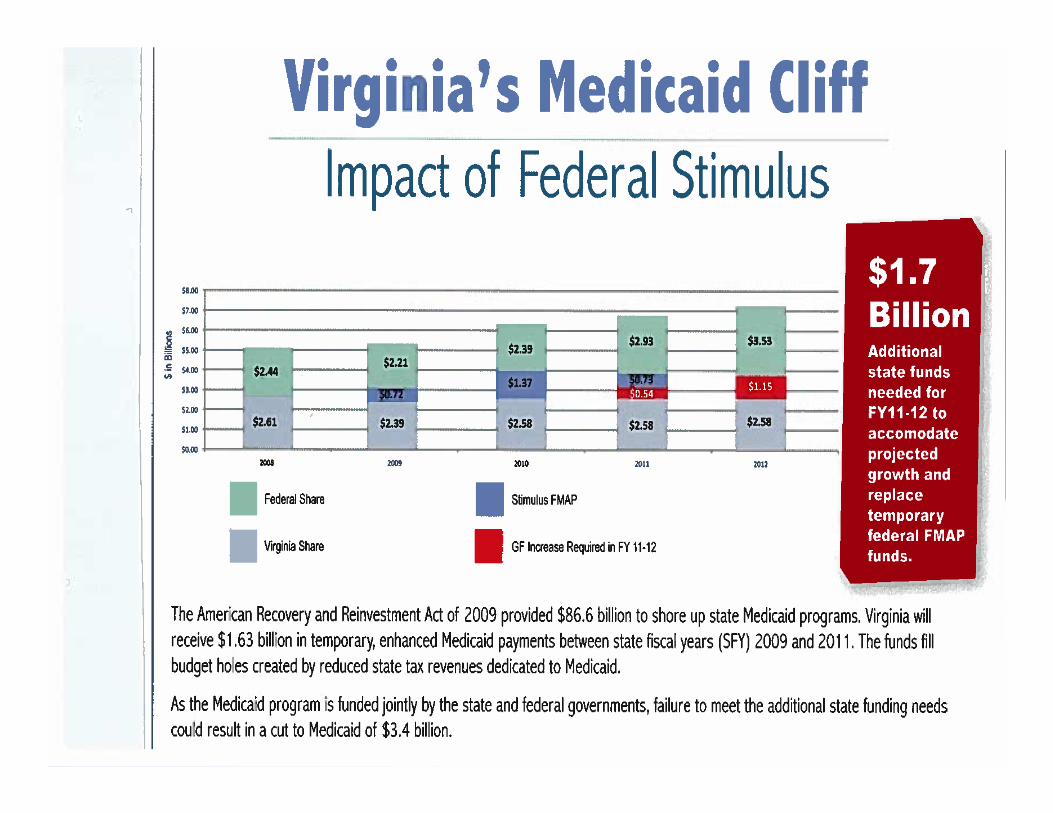
Key Components - MedicaidKey Components - MedicaidDSH – Both houses recommend reductions;DSH Both houses recommend reductions; House ties to reductions in uninsured
Expands Medicaid eligibility to 150% of FederalExpands Medicaid eligibility to 150% of Federal poverty level
R t h l ith di M di idRecent news – some help with pending Medicaid cliff

Key Components –Key Components Medical Education
GME: Both houses recommend redistribution of unused resident slots. House prioritizes resident training in ambulatory or rural settings, primary care and areas with low physicians to general population ratiophysicians to general population ratio
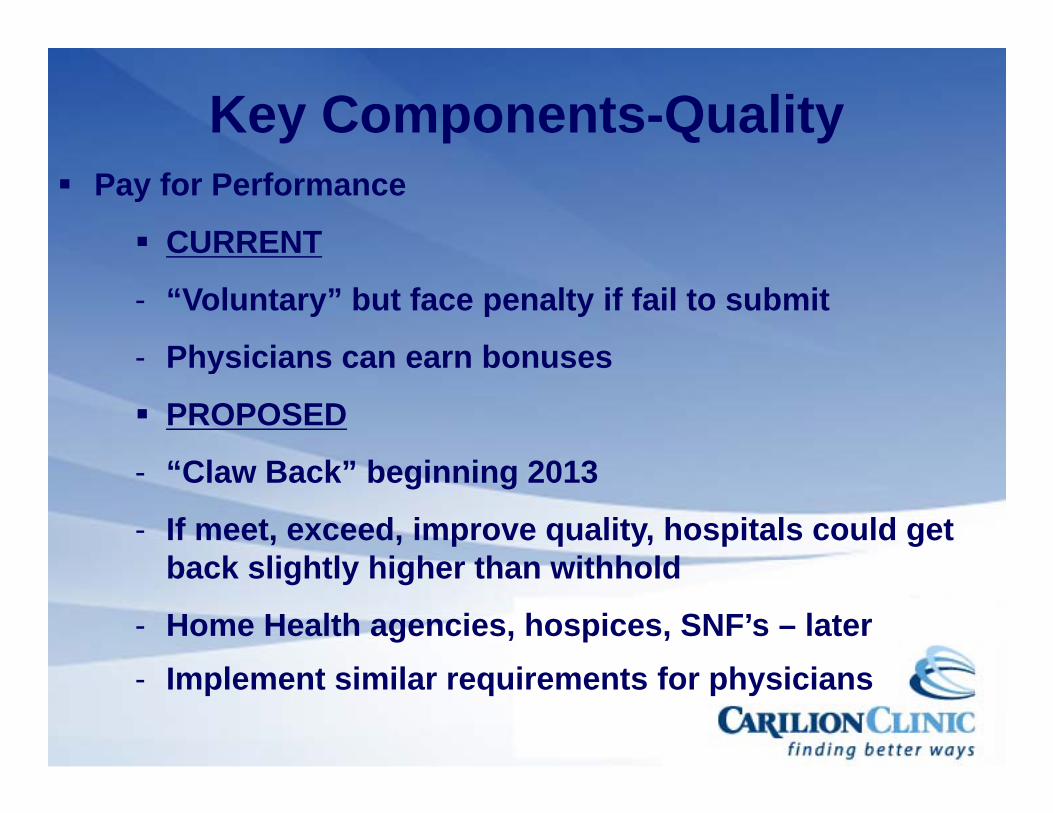
Key Components-QualityPay for Performance
CURRENTCU
- “Voluntary” but face penalty if fail to submit
Physicians can earn bonuses- Physicians can earn bonuses
PROPOSED
- “Claw Back” beginning 2013
- If meet, exceed, improve quality, hospitals could get b k li htl hi h th ithh ldback slightly higher than withhold
- Home Health agencies, hospices, SNF’s – later - Implement similar requirements for physicians

Key Components-Qualityey Co po e ts Qua tyReadmission Adjusted Payments – Both j yhouses recommend decreased payments or penalty for “avoidable” readmissions
Hospital acquired conditions – Senate version increases policy penalties for Medicare; House version extends policy to Medicaid

Demonstration Projects & Pilot Programs
Bundled payments to align incentives forBundled payments to align incentives for care coordination
ACO Accountable for overall care ofACO – Accountable for overall care of Medicare beneficiaries. Option for Medicaid
D Di t 340 B t dDrug Discount: 340 B - extends participation to children’s hospitals, Medicare – dependent rural hospitals soleMedicare – dependent rural hospitals, sole community hospitals, etc.

How’s Virginia Doing?How s Virginia Doing?
Considered low cost high quality stateConsidered low cost, high quality state
Dartmouth Atlas: Recognizes Virginia as in l t 10% f t t i M di dilowest 10% of states in Medicare spending per beneficiary
American Health Insurance Plans: Virginia in lowest quartile in insurance premium costscosts
Commonwealth Fund: Second highest til i lit fquartile in quality of care

Virginia hospitals and health systems107107 acute care, psychiatric, rehabilitation and specialty hospitals
14,000 beds 108,000 employees, ,In 2008:
$900 million in community benefit$900 million in community benefit
• $399 million in charity care
• $188 million in Medicaid shortfall
• $313 million in other community services$3 3 o o e co u y se ces
$419 million in bad debt
$570 million in Medicare shortfall

Virginia Magnet-Recognized Organizations City RecognizedYear
Bon Secours Memorial Regional Medical Center Mechanicsville 2009
Bon Secours St. Mary's Hospital Richmond 2008
Carilion Medical Center Roanoke 2003
Inova Fair Oaks Hospital Fairfax 2009
Inova Fairfax Hospital Falls Church 1997
Inova Loudoun Hospital Leesburg 2006Inova Loudoun Hospital Leesburg 2006
Lynchburg General Hospital Lynchburg 2005
Martha Jefferson Hospital Charlottesville 2006
Mary Washington Hospital Fredericksburg 2009
Montgomery Regional Hospital Blacksburg 2009
Reston Hospital Center Reston 2007
Sentara Norfolk General Hospital Norfolk 2008
UVA Health System Charlottesville 2006
VCU Health System Richmond 2006
Virginia Baptist Hospital Lynchburg 2005
Winchester Medical Center Winchester 2008Winchester Medical Center Winchester 2008
Photos from recent Magnet phone call ceremony at Mary Washington HospitalPhotos from recent Magnet phone call ceremony at Mary Washington Hospital

Carilion Medical Center, RoanokeCarilion Medical Center, RoanokeOb d/E t d M t lit I d
1.5
Observed/Expected Mortality IndexFYE'06 - FYE'09
1.2
1.3
1.4
1.0
1.1
ndex
0 7
0.8
0.9
I
0.5
0.6
0.7
1 2 3 4 5 6 7 8 9 10 11 12 13 14 15 16 17 18 19 20 21 22 23 24 25 26 27 28 29 30 31 32 33 34 35 36 37 38 39 40 41 42 43 44 45 46 47 48
Months Starting From Oct '05
Expected Rates all years based on 2007 Premier benchmarks
1 2 3 4 5 6 7 8 9 10 11 12 13 14 15 16 17 18 19 20 21 22 23 24 25 26 27 28 29 30 31 32 33 34 35 36 37 38 39 40 41 42 43 44 45 46 47 48
Oct
'05
Sep
'09
Oct
'06
Oct
'08
Oct

VCU Medical Center, RichmondVCU Medical Center, Richmond


McDonnell eyes health-care changes at state levelchanges at state level
11/16/09 - Gov.-elect Bob McDonnell worries that a national health-care
h l hoverhaul that includes a public option would lead tooption would lead to diminished access to quality care andquality care and reduced choice for Virginians…

Bending the Curve: Long Term Solutions
1. Building foundational tools such as IT systems
2. Comparative Effectiveness Research
3. Address scope of practice for healthcare workers
4. Address fee-for-service Medicare and Medicaid payment systems
5. Align providers
6. Support better individual choices
7. Support patient performance, palliative/end of life7. Support patient performance, palliative/end of life

Wh t D W D ?What Do We Do?Be realistic; cutting other public programs will no longer cover short fall in health care costs and tax increases would need to be socosts and tax increases would need to be so large as to not be feasible
T k ti l f th l tTake time; plan for the long term
Experiment; facilitate pilot projects


This We BelieveThis We Believe30% waste; yet patients don’t get what they
dneed
50% - no empirical evidence
- no comparative effectiveness
H lth i hi hl f t dHealthcare is highly fragmented
Variation is the enemy of quality
Culture trumps strategy
Integrated care works multi specialtyIntegrated care works- multi-specialty, planned and coordinated

Waste, Effectiveness & Variations,
Waste is characterized by misuse, overuse and d f h lthunderuse of health care resources
Wide variance in the care delivered in US hospitals as measured by clinical outcomes quality measuresas measured by clinical outcomes, quality measures, costs, and resource utilization rates
Factors that lead to waste & variationFactors that lead to waste & variation
Availability
L k f id b d di i i tiLack of evidence-based medicine in practice
Economic factors
Organizational culture
Limited accountability
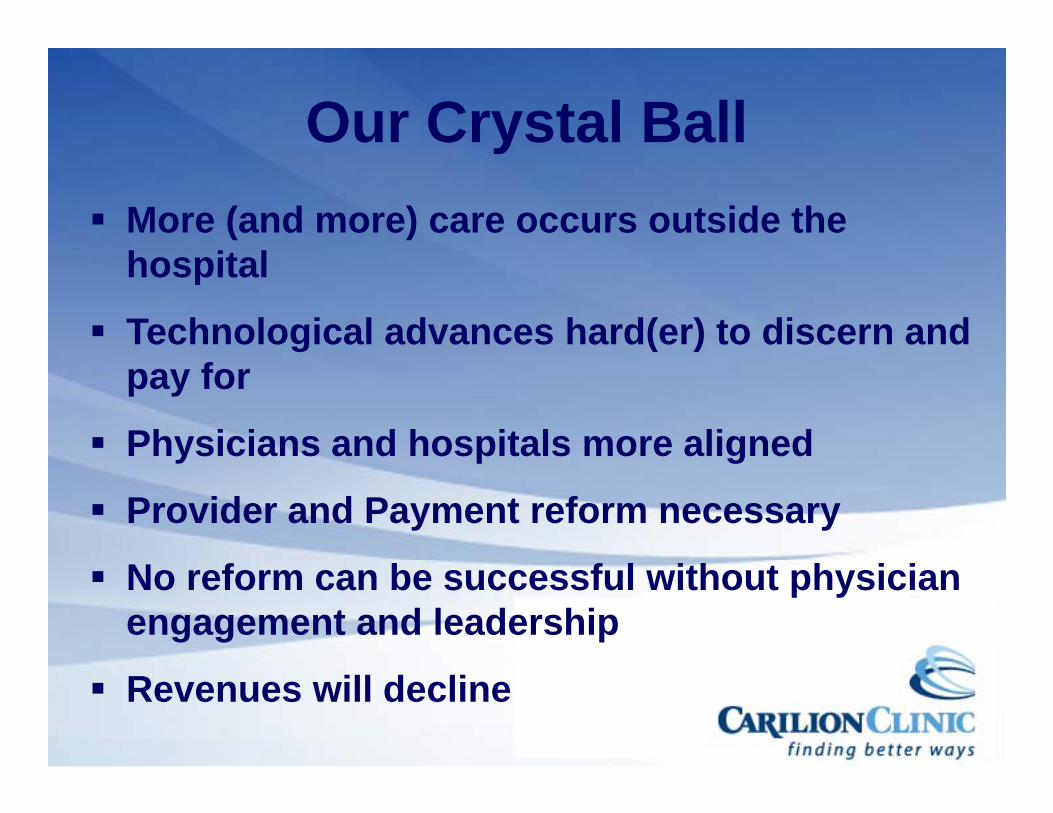
Our Crystal BallyMore (and more) care occurs outside the h it lhospital
Technological advances hard(er) to discern and pay for
Physicians and hospitals more alignedy p g
Provider and Payment reform necessary
No reform can be successful without physician engagement and leadership
Revenues will decline

Physician Practice at a CrossroadsCrossroads…
New physicians are seeking “employment” more th t diti l ti ttithan traditional practice settings
Physicians are not business-people
Continued importance of family considerations, work-life balance, more women physicians, p y
Call coverage is major issue
Indebtedness continues to be a factor in specialty practice decisions
Many physicians don’t need/use hospitals

Contributors to Cost Growth• Aging population- 2%• Price growth 22%• Price growth- 22%• New technologies- over 50%• Defensive medicine- real, complex,
lessor contributor• Overuse and inappropriate care
– 1/3 of surgeries of limited valueg– Up to 2/3 of carotid endarterectomies

Quality of Healthcare in U.S.• 439 Indicators of quality for 30 acute and
h i diti ll
Q y
chronic conditions as well as preventative care
• 12 Metropolitan areas across United States
• Patients received 54% of recommended care:care:
- range by condition: 10 5% 78 7%10.5% - 78.7%

Summary• We spend too much
S di i i t• Spending is growing at an unsustainable rate
• We get too many things we don’t needneed
• We often don’t get what we do need• We overspend and under perform
other industrialized countriesother industrialized countries

Our ResponsibilityOur Responsibility
Reclaim 30%Reclaim 30%,if not,
- Deterioration- ContinuedContinued
rationingP d i t tlProduce consistently good, transparent results

Only Physician-Led Health Only Physician Led Health Care Systems Can Do This
Physician orders spend the d d imoney and drive care
Clinical teams have theClinical teams have the knowledge/experience to ferret
t lout value

Our View of a ClinicOur View of a Clinic• Large interdisciplinary group practice g p y g p p
dedicated to integrated and coordinated care producing excellent efficient patient p g pcare supported by education and informed by researchy
• Physicians are key leaders• Organized around the physician group• Organized around the physician group• Hospitals work together with physicians
in support of patients’ needsin support of patients’ needs

Medical HomeMedical Home• Comprehensive primary carep p y• Imperative for wellness• Management of chronic disease• Management of chronic disease• Elimination of unnecessary potentially
h f lharmful care• Avoid preventable diseases• Stay healthy longer• Avoid hospitalization, ED visits, costlyAvoid hospitalization, ED visits, costly
diagnostic work-ups

Medical HomeMedical Home• Nurse case manager in office• Disease registries• Detailed clinical outcome reportingp g• Team-based care using guidelines and
good coordination & communicationgood coordination & communication• Internet access for questions,
medications appointments recordmedications, appointments, record access (MyChart)

Care Coordination:• Intensive management of high risk• Intensive management of high risk
patients (recurrent admissions/ED visits)visits)
• Outreach to pts with defined diagnoses that need more attention (DM HTNthat need more attention (DM, HTN, Asthma, CHF)
• Enriched visits with education sessionsEnriched visits with education sessions• Ensure appropriate screening is
performedperformed

Medical Home• Fee-for-service payment not consist• Payments need to promote community
and population focus, quality, service, and cost management
• Grow primary care “panels”p y p• Encourage coordination of care with
specialists- who what when whyspecialists who, what, when, why

What is an Accountable CareWhat is an Accountable Care Organization (ACO)?
• A provider-led organization whose mission is to manage the full continuum gof care and be accountable for the overall costs and quality of care for a q ydefined population

Three components of ACO pinfrastructure
• Local Accountability for Cost, Quality, and Capacity
• Shared Savings
• Performance MeasurementPerformance Measurement

ACOs will look very different, but a few characteristics are
essential
1 2 3Can provide or manage continuum of care as a
real or virt all
Are of a sufficient size
to support
Capable of internally
distrib ting
1 2 3
real or virtually integrated delivery
system
to support comprehensive performance measurement
distributing shared savings
payments
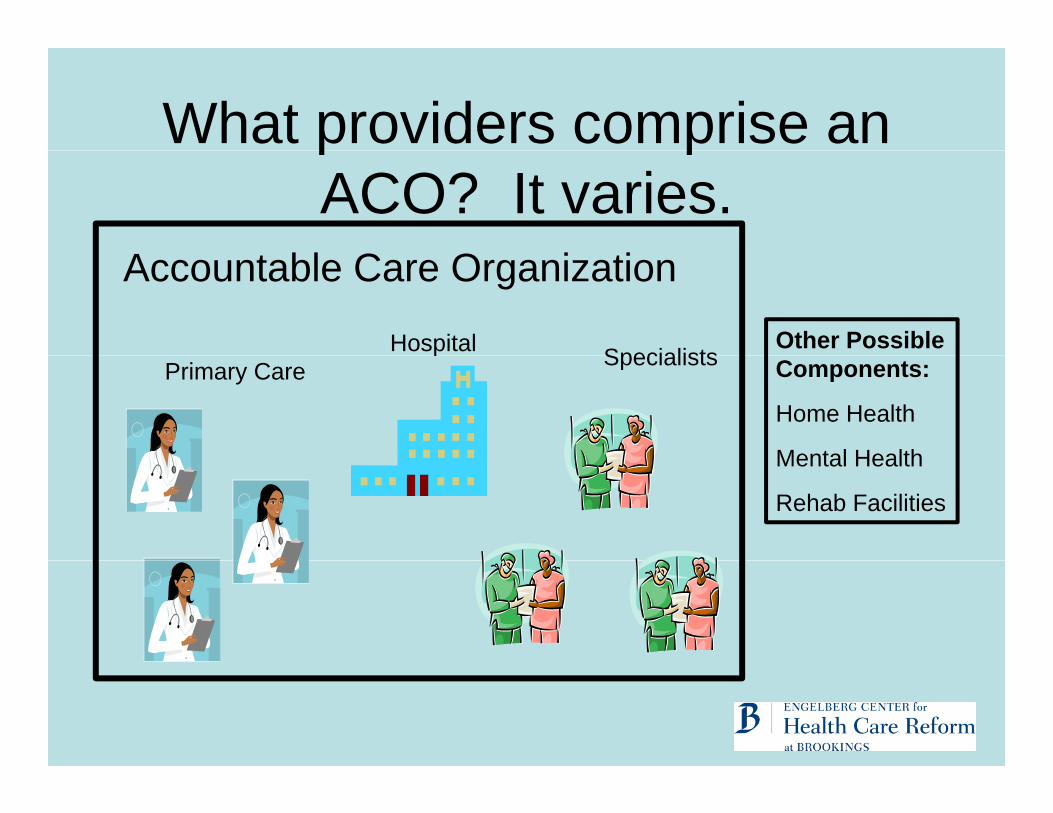
What providers comprise an
A bl C O i i
p pACO? It varies.
Accountable Care Organization
Hospital SpecialistsOther Possible p SpecialistsPrimary Care Components:
Home Health
Mental HealthMental Health
Rehab Facilities

Local accountability is the goalLocal accountability is the goal• Current proposals (bundled payments, p p ( p y ,
chronic disease management, pay-for-performance) while important, do not promote accountability for per capita cost, quality and capacity.
• In the ACO model, providers are accountable for cost and quality– Shared savings payments are based on total
patient expenditures and quality targets

Calculating savings based on g gspending targets
• Patients are assigned to 9.5g
physicians in the ACO
• 3-year historical average f t t l dit f
9
of total expenditures for ACO is calculated
• Expenditures for ACO 88.
5
• Expenditures for ACO are predicted
• Expenditure target is
8.5 9 9.5Fitted values
Fitted values Log Expenditures
Predicted and actual log age-sex-race Medicare expenditures 2003-05 for EHMSs Expenditure target is
negotiated between the ACO and its payers.
Medicare expenditures, 2003 05, for EHMSs with at least 5000 people.
N = 287, R2 = .94, Error = .04 Percent

Calculating savings based on spending targetsspending targets
Projected SpendingACO Launched
j p g
Shared Savings
Target Spending
Actual Spending

Multiple initiatives within the ACO model:
$800M (Target Expenditures)
ACO model:( g p )
- $525M (Traditional Fee for Service Payments)- $115M (Bundled Payments for Specific Conditions)
$150M (PMPM P t f M di l H )- $150M (PMPM Payments for Medical Home)
$10M (Available Shared Savings)(80/20 agreed upon split)
$8M to the Providers $2M to the Payers

Why would providers participate?Why would providers participate?• Improved professional working environment• Realization that at some point volume and
intensity will not be able to be increased further
• Understanding that the care currently being delivered is not always in the best interest of the patient
• Knowledge of other reform efforts underway and understanding that at least one will be implemented by Congress quickly.

How do ACOs reduce expenditures?expenditures?
• Through systematic efforts to improve quality and reduce costs across the organization:
Capacity
Appropriate Workforce
Patients
Informed Patient Choices
Processes
Improved Care Coordination
Physicians
Aligned Incentivespp p
Reduction/Conversion of Current Capacity
Choices
Health Risk Assessments
Coordination
Chronic Disease Management
g
Access to Timely Data
Health Information Technology
Point of Care Reminders
Reduced Waste
Medicaid Challengesg• High risk children
M di l h ff ti– Medical homes effective– ACO networks based in Children’s Hospitals
promisingpromising– Issues: risk profiling, mobility, social services
• High risk dual-eligible adultsg g– Challenging population– Many psychosocial service needs– Medical homes likely helpful– ACOs too complex to assess risk profiles and cost
trendstrends

Evidence it is Working• Reduced costs/in-patient over $200• Reductions in mortality rateReductions in mortality rate• Reductions in hospital-acquired infections• Access and service standardsAccess and service standards• Navigated or Coordinated scheduling• Team focused care• Team focused care• New programs- neurointerventional,
electrophysiology interventional pulmonaryelectrophysiology, interventional pulmonary, adolescent gynecology
• A 26 year old wife and motherA 26 year old wife and mother