I I - Costin Borc · Web viewA decentralized market has been set up for long and medium term...
165
1
Transcript of I I - Costin Borc · Web viewA decentralized market has been set up for long and medium term...

1
CONTENTS
Page.
I. ENERGY OVERVIEW OF ROMANIA; PRESENT AND FUTURE …………. 1II. SECURING OF ENERGY RESOURCES ………………………………………. 8III. ENERGY MARKET MODEL IN ROMANIA …………………………………….. 12IV. ENERGY POLICY IN ROMANIA ………………………………………………... 16
IV.1 Competitive energy sustains a competitive economy ………………. 16IV.2 Role of the Regulatory bodies and of the market operators ……… 19IV. 3 Investment and privatization …………………………………………….. 27IV.4 Pricing policy and social protection ……………………………………. 35
V. ENVIRONMENT …………………………………………………………………… 47VI. RESTRUCTURING OF THE POWER GENERATION SECTOR AND THE MARKET
OPERATION……………………………………….………………………………… 49 VI.1 Energy development program for the period 2003 – 2015 .… 52
VI.2 Power plans closure program ………………………………. 53 VI.3 Nuclear safety ……………………………………………………………. 53 VII.4 Electrification program ………………………………………………… 57VII. REGIONAL ELECTRICITY MARKET …………………………………………... 60
APPENDIX 1 - Primary energy balance for Romania for the period 2003-2015
- Macroeconomics and energy indicators for the period 2003-2015i. Basic scenario
ii. Alternative scenario- Structure of the domestic primary energy consumption
- Installed power demand; load curves for the period 2004-2015- Installed power structure in the period 2003 – 2015: basic scenario
- Gross electricity production structure in the period 2003-2015 – basic scenario
- Graphs for installed power structure, gross electricity production structure
- Load duration curves of the net electricity production (three curves)- Graphs of the evolution of the necessary power capacities
- Development program for the generation capacities for the period 2004-2015
- Proposal for the rehabilitation for the new units – installation program
2

- Thermal power units retirement evolution ( starting from existing units as of 01.01.2003
- Fuel consumption for electricity and heat production for the period 2003-2015 + graphs
- Fuel prices
- Electricity average cost - Requirements of investments in electricity sector + graphs
- Ranking order of candidate units according to the levelized costs ( graphs and tables)
- Ranking order of decided units according to the levelized costs
- Estimation of the electricity average cost in the period 2003-2015- Evolution of natural gas internal market opening degree in the perspective
of Romania's EU accession- Evolution of number of the eligible consumers and evolution of natural gas
internal market opening degree- Evolution of domestic market demand, production and import for natural
gas 2003 - 2015- Development of natural gas storage capacities in the period 2000 – 2010
APPENDIX 2- ELECTRICITY ROAD MAP: MARKET STRUCTURE AND REGULATION FOR
THE PERIOD 2003-2015
APPENDIX 3
- GAS ROAD MAP: MARKET STRUCTURE AND REGULATION FOR THE
PERIOD 2003-2015
3

I. ENERGY OVERVIEW OF ROMANIA; PRESENT AND FUTURE
Recognizing that Romania has continued to make progress towards being a
functional market economy, the present road map is focusing on the
remaining steps Romania needs to follow in order to accelerate the alignment
of its policies with the EU “acquis” in the energy field.
This roadmap has been drafted based on the energy policy of the
Romanian Government, by identifying specific task and targets, time table for
their implementation, as well as the needed financial effort and expected
resources to cover.
This Road map covers the power sector and natural gas sector; some other
sub-sectors such as coal/lignite and oil, energy efficiency are dealt only briefly
as supportive sectors (fuel suppliers) for the power sector. For these sectors
separate detailed strategies have been prepared.
The road map is emphasizing issues like:
- Romanian electricity and natural gas demand on short, medium and long
term basis starting with need of promoting the energy saving;
- Market model and structure, improvement of the regulatory and legal
frameworks, and reforms to be implemented in order to respond to the
requirements of the “acquis” and the development of Romania's electricity
and natural gas market capacity to cope with competitive pressure and
market forces within the European Union, by strengthening the competitive
market mechanisms through stable and transparent, methods, rules and
regulations to be implemented by the regulatory and operation bodies. In
these respect key issues to be resolved where identified;
- Progress in public energy enterprise reform, including the completion of
restructuring plans;
- Adjusting the regulatory framework for ensuring security of supply to
ensure compatibility with a market framework;
1

- Reducing the asymmetries in the implementation of the Directives which
can lead to considerable distortions of the internal market;
- Accelerating privatization in the electricity and gas distribution as well as
on the electricity generation side using flexible formulas such as public
private partnership, as well as closure or liquidation of unviable energy
capacities;
- Defining of the needed investments and their expected sources.
THE NEED OF DEVELOPMENT OF THE ENERGY SECTOR
The energy sector represents a strategic infrastructure of the national
economy on which relies the overall development of the country. In the same
time the energy represents a public utility with an important social impact.
The energy policy, is approaching this important sector of the Romanian
National Economy, as a public utility which needs more commercial
mechanisms and competitive environments, where the prices to be formed in
a free competition between a diversity of suppliers and customers, which are
gradually free to purchase their energy, as well as a transparent and stable
market mechanisms surveyed by independent regulating authorities and
market operators.
The basic evaluation of the energy is based on the consumption. The
consumption projections done, as per the Appendix nr .1 here to, are based
on the need of energy:
to sustain the development trend of the country,
as well as on the need of improving the energy efficiency, environment
protection, optimum utilization of the resources.
2

Consequently, the consumption projection done is based on following specific
vectors:
1. GDP evolvement . The Romanian Government policy is to sustain an
accelerated growth of the GDP in view of achieving the strategic objective
of reduction of the economic discrepancy between Romania and EU
countries. Two scenarios of GDP growth, where basically considered for
the period till the year 2015:
GDP growth in % Achieved in the
2000 – 20012002 – 2005 2006 – 2010 2011 – 2015 Average
value2002 - 2015
Base scenario 5.2% 5.1% 6.0% 5.2% 5.46%
Alternative scenario
4.4% 5.5% 4.8% 4.90%
The basic scenario is the one the Government is keen to implement,
based on accelerated development of the economy, where industry
development has a key role, as well as acceleration of the privatization in the
electricity gas and oil sectors, but also accomplishment of the privatization in
other sectors of the national economy.
The alternative scenario has been considered having in view to the
possible negative impact of the trend of the world wide economy on the
Romania market which could slow down some economic processes.
2. Energy intensity.
In the basic scenario as provided in the strategy for energy efficiency, the
overall energy intensity has to be reduced by 30-50% till the year 2015, in a
complex process which involves replacing of the technologies with high
energy consumptions in a structural adjustment of the economy.
The alternative scenario, of 25% is related to the alternative scenario of
the GDP. i.e. a slower development due to some unexpected effects.
3

Energy intensity measured as an amount of primary energy sources per GDP
unit (a ton of oil equivalent to US $ 1,000) is one of the key measures of
energy efficiency and an important component of a national economy, which
has been considered in the energy planning. Energy intensity in Romania
measured by this indicator is as follows:
Energy intensity, in t.o.e. /$ 1,000 of GDP
1989 1990 1991 1992 1993 1994 1995 1996 1997 1998 1999
Romania:a)b)
1,330,66
1,210,61
1,060,53
1,070,41
1,020,39
0,920,35
0,880,34
0,890,34
0,990,38
0,96 0,83
UE 0,19 0,19 0,19 0,18 0,19 0,18 0,19 0,18 0,17 0,16 0,15For Romania: - Source of information ISPE (Institute for Energetic Studies and Engineering)
a) Final energy consumption/GDP97
b) Final energy consumption/GDP - parity purchase power (ppc)
** - year 1989 has been calculated at the same ppc as in 1990;
- For the years 1998 - 1999 b) indicator has not been calculated due to the lake of ppc
The drop of energy intensity of 3% is mainly due to the structural change of
GPO i.e.:
- drop of industry ration in total GDP form 40,5% in 1990 to 33,2% in 1996
and 25,23% in 2000
- increase of the ratio of services
Specific targets to reduce heat emissions and intensity are included in the
strategy for energy efficiency. Energy intensity is important for this road map
from the point of view of its influence on the determination of the power
demand.
4

In the strategy for energy it is foreseen the following prognosis for energy
intensity:
Energy intensity in the period 2000 – 2015
Indicator MUYear
Scenario2000 2005 2010 2015
Final energy consumption/GDP
t.o.e./103 $
Optimistic - 0.522
0.409
0.334
Optimistic – moderate
- 0.522
0.426
0.352
Medium 0.835
0.533
0.456
0.410
Medium – pessimistic
- 0.547
0.482
0.434
Minimal - 0.557
0.499
0.451
Source: ISPE. The year 1999 has been considered as basic year
3. Population and their increasing energy consumption, by using more house
appliances. It is foreseen the population of Romania to be of 22,2 to 22,3
million inhabitants in the year 2007 and 22,6 million in the year 2015.
Based on the objectives of: GDP growth
Reduction of the energy intensity by 30-50%
Population energy demand
It was determined the following need of energy resources for Romania:
NEED OF PRIMARY ENERGY RESOURCEStoe /1000$ of GDP (tons of oil equivalent)
Achieved 2001
2005 2010 2015 Increase 2015/2001
Reduction of energy intensity
a) 50%b) 40%c) 30%
54.260 54.00057.77058.300
54.70063.80066.900
57.30068.50074.500
300014.20020.200
5

Having in view the Strategy of Energy Efficiency it is considered the
alternative of reduction of energy intensity by 40%, a realistic achievable
target.
Due to a more efficient energy use the average electricity consumption growth is 2.7% / year at a GDP growth of 4-5%/year.
The electricity demand has been projected (see Appendix nr.1) based on this assumptions, ad correspondingly it has been determined the following the gross electricity production chart for the period 2003-2015:
6

GROSS ELECTRICITY PRODUCTION STRUCTURE IN THE 2003-2015 PERIOD
17,04 17,00 17,00 17,20 18,00
5,34 5,34 5,3410,68
16,0213,50 14,00 14,50
15,00
15,004,36 4,60 4,60
4,60
4,60
4,606,70
6,393,80
3,50 3,30
3,00
3,00
6,537,23 7,43
6,70
6,70
8,25
7,00
1,33
1,33
0,930,930,93
0,00
10,00
20,00
30,00
40,00
50,00
60,00
70,00
80,00
2003 2004 2005 2010 2015
Year
Gross
Elec
tricit
y Pr
oducti
on [
TWh]
Thermal power plants onhidrocarbons
Thermal power plants onhard coal
Thermal power plants onlignite
Thermal power plants ofcondensation onhidrocarbons
Thermal power plants ofcondensation on hardcoal
Thermal power plants ofcondensation on lignite
Nuclear power plants
Hydro power plants
56.159.3 60.1
64.9
72.9
7

II. SECURING OF THE ENERGY RESOURCES
The basic criteria, used in the projections done, for the use of the energy resources
was the merit principle (the most efficient cost). Some other subsequent criteria
have been also considers such as:
o security of supply by maximum use of the domestic energy resources
available in the country, but responding to the need of cost efficiency;
o the need of import of energy resources, but in a more diversified structure to
secure a competitive access to the energy resources .
Based on these criteria, the following domestic energy resources where identified
in the strategy:
1. LIGNITE: Availability of domestic lignite reserves for the next 50 to 70 year at a
production rate of 30-35 million tons/year in open pits operations. The mining
strategy provides that the production of lignite is going to be concentrated in the
most cost efficient operations which are the open pits, and the unviable mining
operation (mainly underground) will be closed. The lignite production in Romania is
not subsidized, and represents a competitive source of energy, not influenced by
the market tendency of price increase of other fuels.
2. HARD COAL: Availability of domestic hard coal at a production rate of 3,5 million
tons/year;
Overall consumption of natural gas in Romania in the period 2003 – 2015Year 2003 2004 2005 2006 2007 2008 2009 2010 2011 2012 2013 2014 2015
8

Consumption (bill. c.m.)
18.3 18.3 18.4 18.8 19.2 19.6 20 20.4 20.8 21.2 21.6 22 22.4
Domestic sources (bill. c.m.)
12.7 12.5 11.5 10.9 10.4 10.1 9.8 9.5 9.2 8.9 8.6 8.3 8
Import sources (bill. c.m.)
5.6 5.8 6.9 7.9 8.8 9.5 10.2 10.9 11.6 12.3 13 13.7 14.4
Import in yearly consumption (%)
]30.6 31.7 37.5 42 45.8 48.5 51 53.4 55.8 58 60.2 62.3 64.3
3. NATRUAL GAS: Domestic natural gas production will register a sharp decrease
due to limited natural reserves. Consequently the dependency on import will be
increased as follows:Source: National Regulatory Authority in Natural Gas Sector, Bucharest 2003
4. HYDRO POWER: Using the hydropower reserves so that the annual hydro energy
production to increase with 1,5-2,5 GWh by having installed additional power
capacities of about 500-900MW.
5. NUCLEAR ENERGY: Nuclear energy program will be continued by putting into
operation at Cernavoda Nuclear Power Plant unit nr. 2 in 2006 and at a later date
unit nr.3.
6. RENEWABLE ENERGY: Renewable energy sources should be encouraged as
provided in the national program for renewable energy sources; this represents a
local source that can help reduce reliance on import and improves the security of
energy supply, meeting the environment protection criteria. The renewable energy
sources (biomass, hydropower plants, geothermal energy, etc.) represents an
important resource. But the high cost of initial investments represents a limiting
factor in their expansion so that in order to overcome this obstacle a special
incentive program should be enforced including a financial and or financing
component.
9

CONCLUSION
Based on the a.m. (as detailed in the Appendix nr.1 herewith), THE FOLLWING
CONCLUSION CAN BE SUMMARIZED FOR THE YEAR 2015:
The domestic energy resources will be limited at 24-25 million toe/year
By operating, the coal fire plants at slight constant production rate of 30 million
tons of lignite/year and 3,5 million tons of hard cola/year the decline in domestic
energy resources will be partially covered from the nuclear energy and hydro
generation
Even so the need of import of energy resources will increase form 33, 6% in
2001 to 39-40% in 2005 and 49-50% in the year 2015. In this respect the need of
import of natural gas will increase from 18.4 % in 2001 at 64.3 % in the year 2015.
Having in view the trend of increasing this share of imported energy sources, the Energy Strategy of Romania has been based on making strenuous efforts in two key areas: Reduction in specific energy intensity per GDP unit in economy;
Increase of use of renewable energy sources Dealing with transactions that cross the border of one or more countries
which require a degree of harmonization of the approach to tariffs and capacity
allocation.
Along with that, a significant effort should be done to improve the security of supply
of the energy resources from import, by growing the degree of their availability,
through long term consistent international arrangements and agreements, as wells by
diversification of energy sources, using Romania's key geographic location for the
transit of energy resources (natural gas, and oil) located in the Eastern part of the
Romania.
These objectives should be achieved in a functional market where energy
consumption and energy balance can only be streamlined under competitive terms.
10

Endorsing this vision, the Government of Romania, in its Energy Strategy, has
declared the further need of strengthening of the competitive energy market, as a top
priority for the energy sector.
III. ENERGY MARKET MODEL IN ROMANIA
11

The Strategy for Energy Sector and Energy Efficiency in Romania is based on
setting long - term objectives which are reflecting the needs of the National Economy
for:
- secure energy supply and safety
- energy efficiency,
- utilization of renewable energy sources
- environment protection.
In order to respond to the a.m. basic principles, in line with the “aquis” communautaire, the orientation of the energy structure and energy market model is towards a fully competitive market
The competitive market consists on:
- Bilateral, free negotiated contracts between internal producers and eligible
consumers or with other suppliers which will sell electricity to eligible consumers.
Eligibility will be increased step by step till the full opening of the market. On the
open market, eligible consumers, power suppliers and even the distribution
companies, have the opportunity to trade electricity by directly and freely
negotiated or by setting them on the spot market;
- negotiated contracts concluded by producers and self-producers with distribution
and supply companies;
- transaction on day ahead market.- export contracts, directly negotiated by the producer with the outside customers;
- for the network use, Romania has implemented the regulated third party access
both for transmission as well as for distribution, and related tariffs are published.
Both the existing and the new participants on the electricity market are equally
treated on a transparent and non-discriminatory basis, which also includes the
12

regulated access to the transmission and distribution networks. In this respect,
connection to the grids is compulsory public service.
At present the Romanian Wholesale Electricity Market (REM) is structured into two
parts:
A competitive market andA regulated market
The role of the regulated market is to assure correlated transactions between
producers and suppliers of captive consumers, corresponding to the final
consumption of the captive consumers. Prices on this regulated market are
established in order to cover costs and to include reasonable profit. The quantity of
electricity transacted on the regulated electricity market will diminish gradually, in line
with the market opening and the increase of competitive market.
On the regulated market, electricity is traded on regulated contract basis (with
regulated prices and regulated and usually firm quantities). The contracts concluded
on the regulated market are:
- portfolio contracts of main producers (firm quantities and prices established by the
regulator);
- contracts for electricity in cogeneration (quantities and regulated prices);
- long term contracts with regulated contracts, the “must run-must take” contract of
Nuclearelectrica, concluded for the whole output of nuclear power plant.
Considering the length of the contractual arrangements, REM (Romanian
Electricity Market) can be considered as a two-tire market:
13

- The first-tier of the market comprises (i) bilateral (regulated) contracts between
producers and D/S licensees; (ii) bilateral (negotiated) contracts between
producers and suppliers/eligible customers. During 2003-2004 period, the Initial
Contracts and Initial Option Contracts are to be developed, finalized and put in
place, in consultation with all relevant parties. From 2005 this contracts will replace
the actual portfolio contracts, and will have declining regulated quantities
established according to market opening (as of 2007 market will be fully opened)
After full opening of the market regulated energy prices will be applied only for the
consumers which are not exercising their right to go on the open market and will
prefer to stick with regulated tariffs.
- The second-tier the market comprises (i) Day-Ahead transactions which allow
producers, suppliers and D/S licensees to adjust their contractual positions
previously established in the “first-tier” of the market; (ii) Ancillary service
transactions between producers and the System Operator (Transelectrica); and
(iii) Real-time balancing transactions between the System Operator
(Transelectrica) and producers and/or suppliers. During 2003-2004 period, the
Market Operator (OPCOM) will design, pilot test and launch a “Power Exchange”
to accommodate all Day-Ahead transactions. The regulated production of
hydropower will be supplied on a non discrimination basis to all D/S licensees and
Suppliers through the “Power Exchange” (see Chapter VII hereunder). Also,
settlement of physical electricity sale/purchase transactions of the regulated
segment of the “first-tier” market and all transaction in the second-tier market will
be administered through the “Power Exchange”. When the OPCOM “Power
Exchange” will be commercially launched, it will be mandatory for all market
participants to handle short-term transactions through this “Power
Exchange”(2005-2007).
14
Starting with 2007 and onwards, the volumes in the Initial Contracts will be
reduced to a quantity corresponding to the acquisition need of the “Supplier of Last
Resort”. A key part of the rational for introducing a market for “capacity tickets” in
the OPCOM “Power Exchange” is to facilitate market liberalization by enabling D/S
licensees, Suppliers and Producers to adjust the volumes traded in bilateral
contracts while also meeting “Supplier of Last Resort” obligations as well as
stabilizing revenues for Producers.
The number of eligible consumer will increase under a pre-set schedule for opening
of the market reflecting the requirements of the EU Directive on Electricity.
15

IV. ENERGY POLICY IN ROMANIA
The safe, secure access and efficient functioning of the energy sector represents
the basic and vital millstone for the Romanian economy.
This is why a coherent and economically viable strategy for the energy filed, is a
fundamental prerequisite for the attainment of national objectives of a sustainable
growth and eradication of poverty.
IV.1 A COMPETITIVE ENERGY SUSTAINS A COMPETITIVE ECONOMY
For the past decade, radical institutional, regulatory and structural reforms are
being carried out allover the world with the main goal of deregulation that will improve
efficiency and quality of services.
The energy market model approach of Romania is based on the liberalization
(gradual opening) as an integral part of the overall philosophy of liberalization of the
national economy and free movement of goods and services.
The aim is to create such structures and market environment so that to respond
and cope with the increasingly integrated European energy market, where national
markets are step by step losing their traditional borders and are becoming part of a
common European market.
In the last three years, based on these trends, several important steps have been
already taken in Romanian energy sector, by implementation of a deregulation
process, based on the need of setting more market principles and free competition,
as well as by promoting a sustained privatization process.
In this respect the following have been achieved:
o Unbundling of the vertically integrated power companies into autonomous :
Generation, Transmission, Distribution and supply;
16

o Further unbundling of the generation side into: 5 thermal power producers, one
hydro producers, one nuclear producer and 14 cogeneration producers which
where transferred to the local authorities; there also three small IPP separated
in 1988;
o Unbundling of the natural gas sector into autonomous: Production and
Storage (Romgaz), Transmission (Transgaz) and two Distribution companies (Distrigaz North and Ditrigaz South)
o Reduction of the concentration of the natural gas production and import
by authorization and licensing to an increasing number of companies; o The regulated third party access, on a non discrimination bases to the
transmission system both for gas as well as for electricity has been secured by
law, in line with the trend in European Union;
o A decentralized market has been set up for long and medium term bilateral
contracts, supplemented by short term centralized markets initially compulsory
and on medium term becoming voluntary;
o In the year 1999 has been established the National Agency for Regulation for
Electricity (ANRE) and for Gas (ANRGN) in 2000, with the aim of creating
stable and transparent rules encouraging commercial activity and safeguarding
public interests, in accordance with the requirements of the EU Internal
Electricity Market Directive 96/92/EC for the establishment of an independent
regulatory body and of the Directive 98/30/CE of the European Parliament and
of the Council of 22 June 1998 concerning common rules for the internal
market natural gas;
o In the oil sector, necessary commercial frame has been established, and fixed
such as: a) wellhead prices track international prices; b)regulated tariffs for
crude oil transmission; c) consumer prices are set by the market; d) rules
preclude oil pipeline transmission assets and oil production, supply and refining.
17

o Regulatory intervention on certain market participants to ensure that all
customers are supplied with gas, including some groups which may be less attractive as clients (isolated locations, low users,…).
o A defined strategy for privatization and attraction of new investments.
Further actions should be taken in order to improve the specific issues, namely:
o Regulated prices in line with justified economic costs;
o Opening of the market with energy prices to be formed freely based on
competition and negotiation;
o A clear program for opening of the energy market. The opening the market
for energy will continue based on the following schedule:
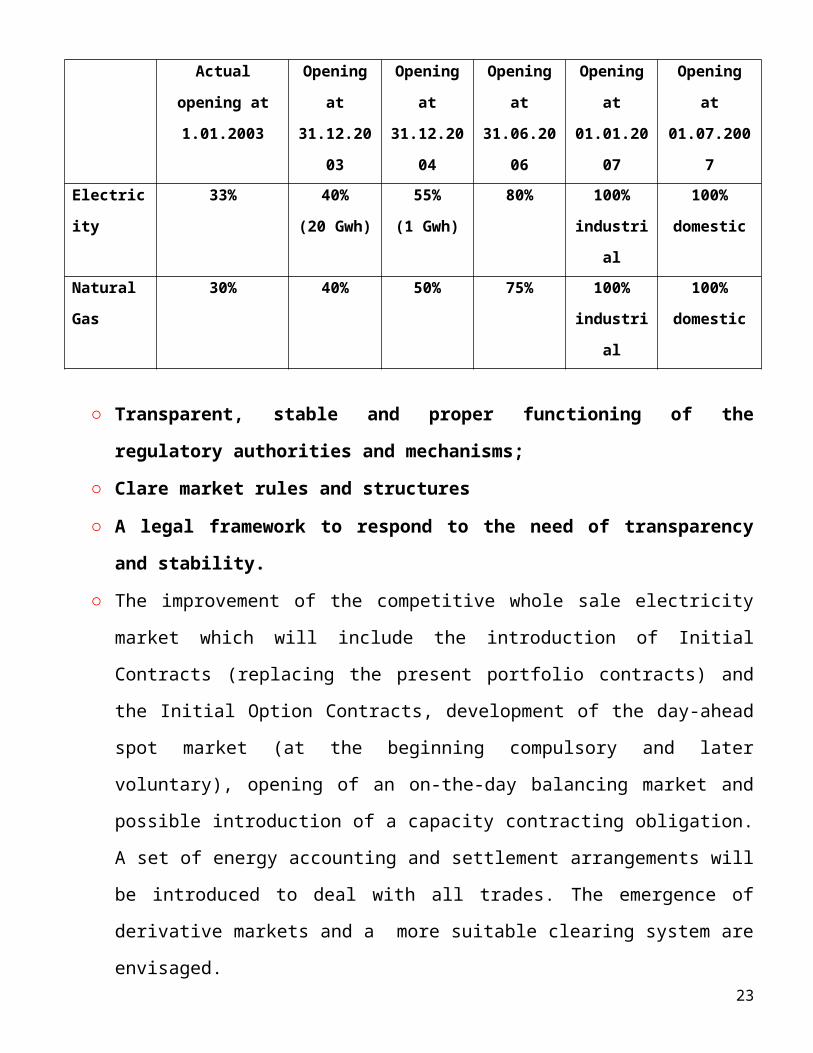
PROGRAM FOR OPENING OF THE MARKETS FOR ELECTRICITY AND NATURAL GAS
Actual opening at 1.01.2003
Opening at
31.12.2003
Opening at
31.12.2004
Opening at
31.06.2006
Opening at
01.01.2007
Opening at01.07.2007
Electricity 33% 40%(20 Gwh)
55%(1 Gwh)
80% 100%industrial
100% domestic
Natural Gas
30% 40% 50% 75% 100%industrial
100% domestic
○ Transparent, stable and proper functioning of the regulatory authorities and mechanisms;
○ Clare market rules and structures
○ A legal framework to respond to the need of transparency and stability.
○ The improvement of the competitive whole sale electricity market which will
include the introduction of Initial Contracts (replacing the present portfolio
contracts) and the Initial Option Contracts, development of the day-ahead spot
market (at the beginning compulsory and later voluntary), opening of an on-the-
day balancing market and possible introduction of a capacity contracting
obligation. A set of energy accounting and settlement arrangements will be 18
introduced to deal with all trades. The emergence of derivative markets and a
more suitable clearing system are envisaged.
○ The improvement of competition by the maintenance or improvement of the
quality of service to customers in terms of security and reliability.
○ The integration of the national power market into a prospective regional market
and a further integration in the Internal Electricity Market of the European Union.
Details of the proposed short, medium and long term transition and integration
schedule are shown in the attached Appendix nr.2 for electricity and Appendix.3 for
natural gas.
IV.2 ROLE OF THE REGULATORY BODIES AND OF THE MARKET OPERATORS
MAIN AREAS TO BE COVERED -By the establishment of a wholesale electricity and natural gas markets, the
captive consumers will continue purchasing energy from supply/distribution
companies that by virtue of their recognized right to monopoly in serving a designated
territory will remain subject to regulatory control.
-Transmission tariffs, as well as the distribution tariffs, are and will remain
regulated.
The transmission service will be provided only by natural monopolies, namely by
electric and gas transmission companies (Transelectrica, Transgaz).
-In the competitive retail market, where eligible customers have the opportunity to
choose their suppliers, the price for energy include a regulated component related to
the cost incurred by the transmission and distribution activities and, for natural gas, by
the underground storage. This component is paid to the relevant transmission and
distribution companies through regulated network access contracts.
- The methods of regulation will also become more complex and the impact of
regulatory decisions more significant at the stage of the forthcoming privatization in
the sector.
This is why the regulatory body both in electricity as well as in gas will continue to play an important role in the development and implementation of
19

the future market model. Detailed functions are shown in the Appendix nr.2 fo electricity and Appendix nr.3 foe gas.
Therefore, putting market structures in place will not diminish the significance and
functions of the regulatory body, but will rather lead to the transformation of their type.
In the market monitoring and dispute resolution the regulatory bodies will play a more
significant role.
The role of the Market Operators both in electricity and gas in the operation of the
wholesale power and gas markets will be reviewed and diversified, to be in line with
the power market liberalization and the increasing competition. This trend makes
necessary the implementation of functional physical and financial power exchange markets, to be operated by Market Operator.
Taking into consideration the proven experience and self-capacity to perform the
power and/or gas exchange functions, the Market Operators will play key role in the
development of the national and regional power trade.
ELECTRICITY MARKET OPERATOR – OPCOM
The electricity market operator OPCOM, is right now in a process of
implementation of new technical and commercial mechanisms for the electricity
market including some financial and commercial instruments, such as the clearing
house, sets of standard contracts to be implemented in the next future period, based
on an international qualified consultancy financed by Phare and World Bank. In the
Appendix nr.1 there is summary chart of all these instruments to be put in place which
will ensure the functionality of OPCOM’s power exchange function for the physical
power market (through two contracts, financed by the European Commission in Phare
2000 program and by the World Bank), as well as for the financial market (by the
Phare 2001 project financed by the European Commission and the Phare 2002
project co-financed by OPCOM and the European Commission).
20

The project developed under the Phare 2000 program is ongoing and consists in
the turnkey supply of an integrated IT system, covering equipment and dedicated
software applications, which will operate as the new IT trading platform for the
Romanian power market. The Phare 2002 program is aimed to implement the
exchange function for the financial power market administration, consisting in the
supply of an integrated IT system dedicated for this function (meaning both hardware
and specific software) and of a simulator of the financial market for training purposes.
These systems will be added with an information module dedicated to the short,
medium and long-term electricity demand forecast. The technical assistance will also
cover OPCOM’s institutional building aimed to ensure the implementation of the
exchange function for the financial power market, as well as the rules, regulations and
specific instruments for this market.
The project financed by the World Bank will be developed on long term, 2003 –
2007. The goal of the project is to provide a comprehensive consultancy and
assistance to OPCOM, in a twinning regime, through rules and regulations design for
the new power market, its testing and the Power Exchange design, pilot testing and
implementation. The consultant will ensure the correlation of the conceptual activities
involved in the design, testing and implementation of the new trading regime of the
Romanian power market. The most important function aimed for the twinning,
according to the new strategic vision to be developed for the Romanian power
market, is to provide technical assistance for the Electricity Market Coordination
Committee in its actions. Through the same project will provided the model for the
physical power market, as well as the updates of the IT system dedicated to the
physical market.
These implementations will allow to set up the Romanian power exchange, which is
aimed to become the regional South-East European market.
21

One of the new instruments will be the Long-Term Contracts (Initial or vesting
contracts)
The Long-Term Contracts (Initial Contracts or Regulated Multi-lateral Contracts)
are concluded between generators and suppliers, with firm quantities and profiled by
trading period.
The contracts will be put in place initially to stabilize electricity sale and purchase
transactions between the distribution companies (eight) and the producers, consistent
with GD 1524/2002 and would last around five years.
The volumes set in these contracts will be reduced each year, to encourage the
market participants to trade bilaterally with each other.
Due to the progressive reduction of the contracted volumes, a new trading
mechanism – the capacity market – will be set up and commissioned.
Prices will be also profiled and subject to quarterly indexation.
Hereunder is the scheme of the operation and place for the initial/vesting contracts.
These arrangements are considered as being the commercial solution able to
provide market stability and at the same time facilitate trading in an increasingly
competitive electricity market.
22

23

ANNEX AOVERVIEW
OPCOM’s projects by the allocation of the main tasks
PHYSICAL MARKET
IT: IT:
Vesting Contracts
Rules, Regulations SIMULATORPOWER EXCHANGE(settlement)
Capacity ContractsRules, Regulations SIMULATOR POWER EXCHANGE
Bilateral ContractsRules, Regulations SIMULATOR POWER EXCHANGE
(settlement)Hydro Regulation
Rules, Regulations SIMULATOR POWER EXCHANGESpot Market Day-Ahead
Rules, Regulations SIMULATOR
POWER EXCHANGE
AdjustmentRules, Regulations SIMULATOR POWER EXCHANGE
Balancing Market
Operated in the Day Ahead by the Market Operator, Horizon I Rules, Regulations SIMULATOR POWER EXCHANGEOperated in Real Time by the System Operator, Horizon II
Rules, Regulations
SIMULATOR
System Operator(DEN)
Phare 2000 – Investment (Alstom)
Including all contracts registration and settlement made for all trades
Twinning based consultancy - World Bank (including supply of the power market simulator and further software updating for the trading and settlement system, in accordance with the market evolution)
POWER MARKET COORDINATION
COMMITTEE
Phare 2002(Clearing implicitly)(With investment preparation under Phare 2001)
24

Ancillary Services
Rules, Regulations SIMULATOR
POWER EXCHANGE
Risks quotation and guarantee mechanisms (including clearing) Rules, Regulations SIMULATOR POWER EXCHANGE
FINANCIAL MARKET
Contracts: futures, options etc.Rules, Regulations PX
Clearing House Rules, Regulations PX
Forecast ModuleRules, Regulations IT
Phare 2002(Implicitly –with investment preparation under Phare 2001)
Phare 2001
LEGEND: - Phare Projects
- World Bank Project
Simulator for the financial market, for training purposes
Phare 2002(With investment preparation under Phare 2001)
25
26

GAS MARKET OPERATOR The role of the Gas Market Operator: The presence of a diversity of consumers (eligible and captive
consumers till full opening of the market, as well as of consumers, voluntarily
not exercising eligibility after full opening if the market) as well as temporary
presence of the mechanism of formation of “basket price”, requires the need
of a Market Operator in the natural gas sector.
Responsibilities:
Supervision of the ratio between purchases and sales, maintaining a non
discriminatory regime for all the players on the Romanian gas market;
Monitoring the interdependence between sources (domestic/import) –
parameters (flows, pressures, underground storage activity,
hourly/daily/seasonal fluctuations, peak demand-gas consumption):
Forecasting of the dynamics of gas demand on the Romanian gas market.
The development of competitive gas market and the possible
establishment of a gas “commercial market operator” (mirroring
developments in the electricity market) are under consideration.
27

To develop the system necessary for the operating and monitoring of gas
market, in order to control the interdependence between sources
(domestic/import) – parameters (flows, pressures, underground storage
activity, hourly/daily/seasonal fluctuations, peak demand-gas
consumption). This design should take into account the potential issues
connected with interoperability of the Romanian gas system with the gas
systems of EU Member States.
A blueprint for the development of the gas market in Romania, together
with a broad strategy for achieving this end.
To design the systems (hardware and software) necessary for the
operation of this developed gas market.
At this moment, it is under preparation the tender of the consultants for the
mentioned project.
It should review the external environment (such as social, legal, cross
border gas exchanges, commercial, economical and regulatory) which
impacts on the operations of TRANSGAZ / D.N.G.N.- O.P. and should review
the current design of gas market. This task requires close consultation with
ANRGN and an open dialog with other Romanian relevant gas market players
to develop a clear view of the present market operation (including a full
understanding of the deficiencies or difficulties in the operation of the present
market).
The output of this project will be a Task report setting out the consultants’
recommendations for the Operator and for the operating/monitoring
mechanisms to be used and their principles, function, proposed activities and
proposed operations to be performed by TRANSGAZ in order to ensure
interoperability with similar gas systems in EU member states.
In the same context , an IT system is necessary to provide and record the
data needed for the operating/monitoring the gas market, and processing it in
order to:
28

Select and analyze from a database (based on information about
supply/demand covering five year period) to estimate current gas demand
with high degree of accuracy; cross-checking against previous statistics
taking into account monthly/daily/hourly evolution of demand, related to
weather forecasted conditions;
Translate the current contractual agreements into an off take schedule to
give the suppliers the information they need to plan their operations;
Cover the whole spectrum of activities needed to match supply to the
projected demand;
Optimize the ratio between the levels of the current domestic production,
calling up the underground storage and the imported gas to cover peak
demand during winter time;
Programming and coordinating of maintenance work (routine or special)
and other activities on the system to ensure that they do not impact on the
security of gas supplies to customers.
The main objective is to develop of the gas market, to comply with the EU
Gas Single Market Directive and the consolidation and strengthening of the
gas market operator.
IV.3. INVESTMENT AND PRIVATIZATION THROUGH PRIVATE CAPTIAL PARTICIPATION AND STRATEGIC INVESTORS
NEED OF INVESTMENTS In order to upgrade the national energy system in Romania large-scale
investments are needed for upgrading, reconstruction, as well as for
expansion of the existing capacities and the construction of green field
capacities.
In despite of the efforts done in the generation sector, this sector is and will
be the mostly intensive investment sector to cover the target for upgrading as
29

well as for the new projects. It is very significant that for more than 5000MW in
the fossil fuel generation, the equipments are very old.
Overall summary picture in the energy sector is the following:
- In the electricity generation based on fossil fuel more than 32% of the
equipments are of more than 30 years of age, and 50% are between 20-30
years old. In this filed only 0, 7% are of less than 10 years old. In the hydro generation 24% of the equipments are of more than 30 years old, 51% of
more than 20 years old and only 13% are of more than 10 years old.
-In the Natural Gas Transmission System, 64% from the total length of
transmission pipelines are older than 25 years. Also, 29% of metering and
regulating stations have an overdue life span.
-The distribution networks operated by the main distribution companies
(S.C. DISTRIGAZ SUD Bucuresti and S.C. DISTRIGAZ NORD Targu Mures)
is in the same difficult situation: 46% of the distribution network is older than
15 years.
STRATEGY APPROACH FOR THE DEVELOPMENT OF THE POWER AND GAS SECTORS
ELECTRICITY In the Appendix nr.1 hereunder, are determined the investments needed in
all power sectors, starting form the need of securing the energy supply.
The new capacities to be built are determined based on the parallel program
of the capacities to be retired,(see details in Appendix nr.1) the overall picture
is as follows:
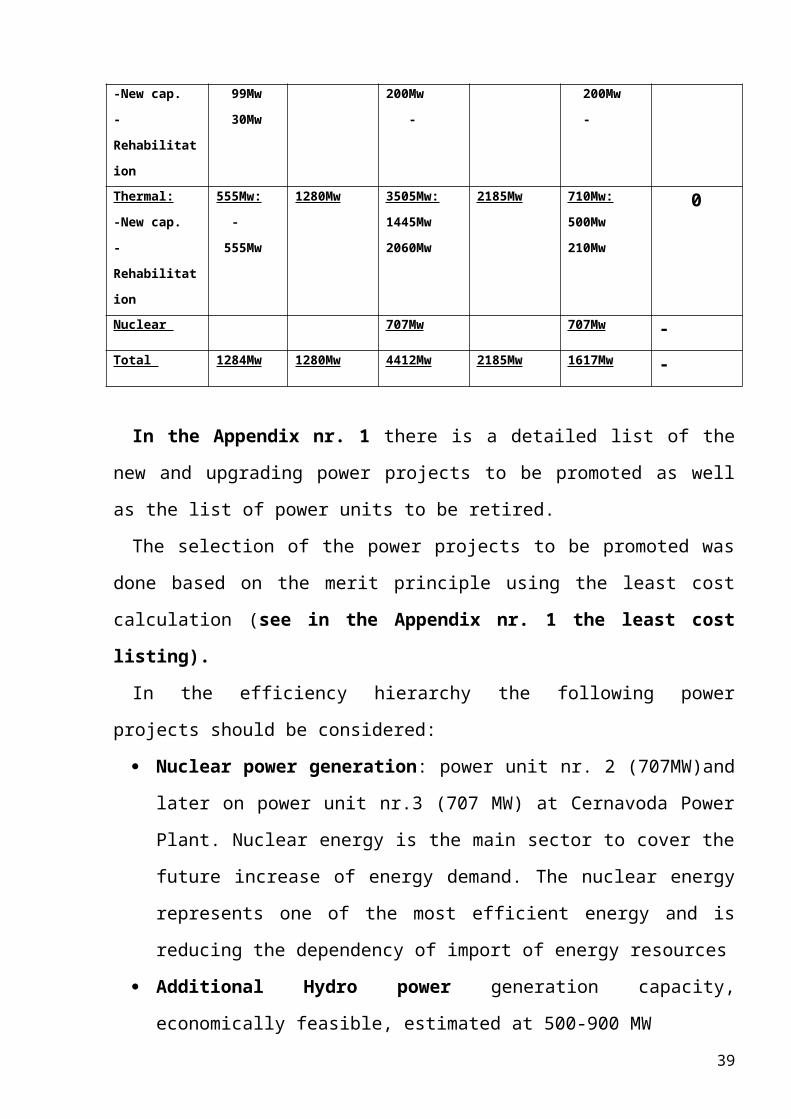
In MW
30

Sector2003-2005 2006-2010 2011-2015
New capacities
Capacities to be retired
New capacities
Capacities to be retired
New capacities
Capacities to be retired
Hydro:-New cap. -Rehabilitation
129Mw: 99Mw 30Mw
- 200Mw:200Mw -
- 200Mw: 200Mw -
-
Thermal:-New cap. -Rehabilitation
555Mw: - 555Mw
1280Mw 3505Mw:1445Mw2060Mw
2185Mw 710Mw:500Mw210Mw
0
Nuclear 707Mw 707Mw -Total 1284Mw 1280Mw 4412Mw 2185Mw 1617Mw -
In the Appendix nr. 1 there is a detailed list of the new and upgrading
power projects to be promoted as well as the list of power units to be retired.
The selection of the power projects to be promoted was done based on the
merit principle using the least cost calculation (see in the Appendix nr. 1 the least cost listing).
In the efficiency hierarchy the following power projects should be
considered:
Nuclear power generation: power unit nr. 2 (707MW)and later on
power unit nr.3 (707 MW) at Cernavoda Power Plant. Nuclear energy is
the main sector to cover the future increase of energy demand. The
nuclear energy represents one of the most efficient energy and is
reducing the dependency of import of energy resources
Additional Hydro power generation capacity, economically feasible,
estimated at 500-900 MW
Power generation based on lignite and hard coal by rehabilitation of some of the existing power, where the upgrading costs are less
than 50% than for a new capacity and/or built of new units, at the
following locations: Turceni, Rovinari, Isalnita, Deva-Mintia. The
rehabilitation projects could represent 35-45% of the total newly needed
power generation capacity
31

Combined cycle gas turbines. Only 15% of the total power generation
will be secured form natural gas.
Hereunder is a brief presentation of the needed investments effort for the whole energy sector, as well as a tentative definition of investment
sources:
N.B. In the process of determination of the invesmtent sources it has been
firstly considered the private participation to the maximum realistical
expectation possible. Only the difference has been considered to be secured
from state company resources.
In million US$Sector 2003-2005 2006-2010 20111-2015 Total
Total,
out of
which
from:
Investment
sources
Total.
out of
which
from:
Investment
sources
Total,
out of
which
from:
Investment
sources
Private State
owned
comp.
Private State
owned
comp.
Private State
owned
comp.
Thermal
generation
1595 400 1195 1588 800 788 300 200 100 3485
Hydro
generation
450 100 350 500 150 450 660 300 360 1610
Nuclear
generation
480 - 480 1046 400 646 360 100 260 1886
Transmission 491 - 491 234 - 234 341 - 341 1266
Distribution* 628 428 200 727 727 - 885 885 - 2240
Total 3644 928 2716 4095 2077 2018 2764 1485 1261 10485
*Distribution companies will be privatized
The environment investment cost is estimated at 10% of the total investments effort.
The energy sector needs of investments should be fulfilled through the private equity participation to the maximum extend possible and feasible.
32

The ongoing reform and restructuring of the energy field has as main target
to become attractive and convincing for the private investors, so that most of
the necessary capital to flow from the foreign capitals, because of the limited
financial capacity within the country.
It is therefore important to promote an appropriate sequence of
investments, starting with the most viable projects, which could represent a
success story and encourage the investors, as well as a stable, and
transparent legal and regulatory frame work and appropriate market model
and structure. New contracting mechanisms as described in the attached road
map for regulation will be put in place to respond the expectations of the
investors and to limit the practice of long-term power purchase agreements
which should be promoted on a very selective base and only if they will not
break the EU Directives of "stranded cost" or "state aid".
The limited investment capacity of the state companies (direct financing or
sovereign guarantees) will be used in the next years only for those projects
(natural gas and power production and transmission), important for the
national system, but less attractive for foreign investors at this transition stage.
NATURAL GAS It has been also done an estimation of the need of investments in the gas
sector till the year 2010:In million US$
Sector 2003-2005 2006-2010 Total Total, out of which from:
Investment sources Total. out of which from:
Investment sources Private State
owned comp.
Private State owned comp.
For prospecting and drilling works for new wells out of which:-Romgaz-Petrom * -others
626
405191 30
221
191 30
405
405
620
280300 40
340
300 40
280
280
1.246
685491 70
For national transportation network
172 120 52 305 305 - 477
For distribution network *
910 910 - 1260 1260 - 2170
For underground storage
88 40 48 517 200 317 605
Total 1.796 1291 505 2.702 2105 597 4.498* Petrom and the two distribution companies will be privatized
33

The natural gas industry is facing two important targets for having secured
the supply of gas:
o Increase of the underground storage capacity so that during winter time
(high season) to secure necessary pressure and flow into the pipe line.
In this respect important steps where done by doubling the storage
capacity in 2003. Further steps and programs are foreseen so that the
storage capacity to be increased as follows:
Underground storage capacity in billion c.m.
2000 2003 2004 2005 2006 2007 2008 2009 2010
1,3 2,5 3,23 4.05 5.0 5.8 6,3 6,5 6,55
o Diversification of gas supply sources. In this respect there are foreseen
the following actions:
to interconnect the Romanian transportation pipe line network with
European network. The connection pipeline Szeged Arad is actually
under implementation.
to make access of the Caspian and Middle East gas to Europe. A
preliminary agreement has been signed between interested countries
i.e. Turkey, Bulgaria, Romania, Hungary and Austria. Based on this a
feasibility study, partially financed by EU, is conducted, by a
consultant already selected.
PRIVATIZATION The strategy of the Romanian Government is to speed up the path of the
privatization processes in the energy sectors.
The Romania Government strategy is to privatize:
all downstream activities in the electricity i.e. the 8 electricity distribution
companies, as well as in gas i.e. the two gas distribution companies;
power generation activities starting by the most feasible ones.
34

At this stage there are no planes for the privatization of the transmission
companies (TRANSELECTRICA and TRANSGAZ) as well as of the national
gas producer company ROMGAZ. Anyhow there is a strategy for private
access on the new gas fields and there already private companies operating
in new gas production.
The consolidation of the appropriate legal and regulatory environment and
market structures with stable and transparent rules helps and promotes the
privatization process in the energy filed. Therefore the Romanian Government
has set up clear path to be followed as described in the attachments herewith
though that through the reforms and regulation successfully implemented to
offer the investors confidence.
The main goal of the privatization is to get into to the company the
necessary capital and to strengthen the company rather than maximization of
the proceeds, so that to have stronger and more competitive companies after
privatization in gas and power sector, as well as to avoid unnecessary
increase on the tariffs. The privatization strategy should be subordinated to
the long-term objective of attaining competitive prices for energy.
In this view, it is foreseen to use the revenues generated through
privatization in the energy sector for financing of energy projects with a
considerable economic and social impact, as well as for related social costs,
for targeted support for low-income households, and for environmental
investments.
That is why the privatization will be based on the following:
Attraction of the investments necessary for ensuring efficient, secure and
environmentally-friendly energy supply; privatization will be pursued mainly
by attraction of private capital into equity combined with buying of an
additional package of shares of the companies;
Attraction of strategic investors in the utility field which will represent the
guarantee of successful operation based on a up-to-date management
systems;
35

The privatization process in the energy filed will be carried out to respond to
the objectives of:
Well-defined chronological sequence;
Ensuring the transparency of the process, using selected international
consultants;
Building of managerial capacity needed for the operation in a market
environment.
PRIVATIZATION PROGRAM The Romanian Government has approved a privatization program, as
follows:
For the electricity distribution at a rate of 2 distributions/year; this year will
be finalized the privatization of the Electrica Banat and Electrica Doborgea,
and for the year 2004 other two distribution companies are in the
privatization process; it has been signed the contract for selection of the
consultant so that the process is developing as planed.
For the two gas distribution companies, Distrigaz Nord and Distrigaz Sud,
consultancy contract has been signed and the privatization process has
started.
From the year 2000 until present, several private companies in the gas
sector (14 for natural gas distribution and one for underground storage)
have been established. All these companies have applied and obtained the
necessary licenses from ANRGN (see the Appendix 1 referring to
“Participants on natural gas market”).
Also in the gas filed till now were granted:
79 authorizations for initiation the setting up of natural gas
distribution;
51 authorizations for natural gas distribution operation;
40 licenses for natural gas distribution;
1 natural gas dispatching license;
36

42 licenses for natural gas supplying;
2 natural gas storage licenses;
1 natural gas transport license;
1 natural gas transit license.
Privatization of the thermal power generation will start with the most
attractive ones i.e.:
- Turceni, Roivnari plants (lignite based) for which, under USAID
program, consultancy program has been started, funded by
USAID
- Iernut gas power plant
For HIDROELECTRICA, uncompleted projects (21 projects) privatization is
foreseen to be partially finalized this year and next year before the full
opening of the market. There is also foreseen that HIDROELECTRICA will
be unbundled into commercial structures, and to be privatized, preferably
in packages with thermal power plants and their access on the market will
be permitted. Unbundling it is foreseen to be happened even earlier if
market forces will ask for such a decisions.
IV.4.PRICING POLICY AND SOCIAL PROTECTION
PRIECES AND TARIFF POLICYThe price and tariffs policy envisaged will be governed by economic
criteria. i.e. The energy prices (gas and electricity) are fixed:
o for eligible consumers by free negotiation based on competition, following the trend of opening of the market
o for captive consumers, prices are regulated in line with justified economic costs plus a margin pf profit;
o The tariffs for distribution and transmission are regulated in line with justified economic costs plus a margin pf profit;
o Cross subsidies will be abolished. o For the categories of people with social problems (low income), a direct
subsidy mechanism form the budget sources will be introduced.
37

PRICE AND TARIFFS - PAST DEVELOPMENTS
Electricity prices for the final consumers where constantly increased by 3,6% in the period October 2001- march 2002, and as of April 2002 the electricity prices where increased by 14% to cover cost variation due to inflation. In July 2002 the electricity prices where increased by 1,5%. In the period October 2002 January 2003 it has been applied a price adjustment to cover the inflation so that the prices to be constant in US$ at the level had in July 2002. In this frame the prices of Termoelectrica where increased at 39 $/Mw and for heat at 20 $/Gcal as of first of July 2002. The electricity prices at the consumers where differentiated as follows:
o 50,4$/Mwh for captive consumerso 46,7$/Mwh for industrial consumers o 64,1$/Mwh for household consumers
Heat prices (except cogeneration units): starting with September 2002 price regulation is done by the Authority for regulation of the Municipal services (ANRSC), which has been set up by the Government Decision 373/18.04.2002
Natural gas: As of 2002 the price of natural gas has been set up at 82,5$/1000 c.m. (the previous price was 45,12$/1000c.m. for household consumers and 85 $/1000 c.m. for industrial consumers). As of March 2003 the price level ahs been increased to 90 $/a000 c.m. and as of July 2003 at 99 $/1000 c.m. By this, all the costs form the gas producers to the downstream are covered.
FUTURE DEVELOPMENT
Due to need of investment expenditures for setting up new power generation capacities, upgrading the existing capacities including for coping with the environment protection requirements, it expected an increase in the electricity production cost. In the Appendix nr.1 there is a determination chart of the electricity costs for the period till the year 2015. On top of that should be added the financing cost as well as the expected profit of the investor. Depreciation cost (including for environment protection, fuel cost evolvement as per EU projections, labor and other variable cost, but also positive impact of new technologies on the production efficiency have been considered in the production cost projection. Based on this it expected that the cost of energy production to increase in the year 2005 by 10,3% compared to 2003, in the year 2010 by 13,3% compared to 2003, in the year 2015 by 13,8% compared to 2003.
The main features of each period can be summarized as follows: (implementation done in the previous period are no more repeated in the next period, being considered as fully valid).
2003 – 2004
38

For electricity:
The electricity prices for generators will be:
o formed freely based on competition and negotiation between the producers
and eligible customers;
o regulated, for captive consumers, as approved by the Regulatory Authority.
o ANRE will maintain the obligation of Electrica's subsidiaries to take over
the co generated electricity, (corresponding to the heat delivered to
residential consumers) at regulated prices.
o ANRE will transpose or adapt the methodologies of the EU Energy
Regulators Council regarding the cross border tariffication. From 2004 a
CBT (Cross Border Trade) mechanism will be in place in the Balkan
Region, similar to CBT mechanism already in place in Western Europe.
o Having in view the harmonization with the EU Directives, ANRE's
methodology for establishing regulated prices for acquisition of electricity
generated by IPPs and self producers will be extended in order to
purchase the electricity from renewable sources at regulated prices.
Taking into consideration high costs for generating this kind of electricity,
ANRE will study the possibility of subsidizing it by the state/local budget or
will define financial incentive scheme for renewable sources, according to
EU practice of electricity from renewable sources.
Transmission ad distribution tariffs:
Due to nature of these activates i.e. natural monopolies, both the transmission
and the distribution tariffs will be regulated tariffs based on the following
principles, which are giving more stability and transparency to the process:
39

Till the end of 2003, tariffs for transmission and distribution will be
regulated based on justified cost plus profit. By the end of 2003 will be
accomplished the evaluation of the assets of the distribution and
transmission companies' assets will be accomplished.
Based on the evaluation mentioned above, as well as based on a more
representative determination of the historic costs, the implementation of the
ROR (rate of return) mechanism will be done in 2004;
The target is to implement the “price cap” mechanism (CPI-X) index as of
2005.
Tariffs for ancillary services are regulated and are based on the involved
costs as submitted by the generators.
ANRE will determine a mechanism for internalization of the external cost for
environment protection.
The tariffs policy envisages that by the end of the transition period the
monomial end - user’s tariffs to be removed.
National uniform tariffs for captive consumers will be maintained.
Having in view the new structure in the electric electricity sector, for
transmission and distribution services, is intend to include as a new tariff
component, the contracted demand or contracted capacity.
For heat: the residential heat consumers will continue to pay a National
Reference price, which will be adapted in accordance with the gas/fuel oil
price. In parallel, municipalities will develop studies to optimize the heating
solutions for their community.
Low income residential heat consumers will continue to receive subsidies.
40

For natural gas : The domestic gas prices are adjusted in order to cover the production
costs and to provide financial resources for future investments. The
domestic gas prices are fixed:
o for eligible consumers by negotiation
o for captive consumers, domestic gas price is regulated (as
approved by ANRGN)
Transmission, distribution and storage tariffs , are regulated tariffs approved
by ANRGN and ANRM, and than published, and they are based on justified
costs plus profit.
ANRGN is implementing a new pricing and tariffication methodology,
differentiated by consumers’ categories, so that to remove the crossed
subsidies between consumers’ categories and to reflect the effective costs of
natural gas supplied toward each of these categories.
The implementation of this system has started in the year 2001, and is under
further implementation right now, and consists practically of two stages:
In the first stage where elaborated the “Criteria and methods for
establishing regulated prices and tariffs in natural gas sector”, which are the
necessary instruments for ANRGN to start the regulatory activity for prices
applied to the captive consumers.
In the second stage should be differentiate the prices and tariffs for the
consumers, pending on the application of the specific technical solutions for
each type of consumer. In this respect ANRGN has identified two key types
of consumers:
a) those one directly connected to the national transmission system;
b) those connected to the distribution systems.
For these two types of consumers differentiated tariffs are applied, related
to the service used.
41
Based on the a.m. principles, the gas prices ant the tariffs for transmission,
distribution and storage are fixed as follows:
1. Final price of gas to the consumer result from the addition of the
transmission, storage and distribution tariffs, commercial component, to
average weighted price for purchasing of gas, based on the following
formula:
Final price = P average weighted purchasing price + T transmission + + T storage +T distribution + C commercial
The average weighted purchasing price is determined by multiplying the
gas quantities from domestic production and from import with their prices and
after that by dividing the obtained value by total quantity, using the following
formula:
Q internal x P internal + Q import x P importQ internal + Q import
In order to benefit of the domestic gas, all consumers are obliged to pay the
ratio of the imported gas at the import price (or in case of eligible consumers
to buy directly this gas from import). The ratio structure of the domestic and
imported gas is established monthly, by Market Operator.
2. The designing principles for the tariffs for transmission, distribution are: tariff should reflect the cost of service (fix, variable) and investments
plus profit.
At present there are two types of tariffs in force, one for the consumers
connected in distribution systems and another for consumers connected
directly in national transmission system.
The differentiation of the distribution tariffs between categories of
consumers, according to the tariff methodology, will be realized started with
the year 2005.
The tariff methodology will be revised, during the second part of year 2003
first part of 2004 with PHARE assistance
42

3. The storage tariff is determined by allocating the average value of
underground storage service related to a storage cycle at the reserved
average capacity of storage deposit. In the storage tariffs are included
costs for services (fix, variable) and investments plus profit.
The storage tariffs have been established as differentiated service tariffs for
each underground deposit, giving up the system post stamp “storage tariff”.
This has opened the access for eligible consumers to underground storage
systems.
Storage tariff has also a component for reserving capacity, a component
related to injection cycle and one related to extraction cycle for natural gas
from the storage deposit.
4. In order to encourage private producers of gas, by the Government
Decision approved in February 2003, for promoting of the exploration and
production of new domestic gas, establishes that the price for new
domestic gas to be at the level of up to 80% of the imported gas price at
Romanian border.
For the protection of low income residential consumers, the social tariff will be
maintained.
2005-2007
FOR ELECTRICITY:
An increase in real terms for end-users tariffs is estimated due to the
obligation of including environmental costs in the tariff structure
(internalization of externalities), according to the legislation and due to the
necessity of adequate investments for all electricity market participants.
43

The electricity prices: Electricity prices for the consumers exercising the eligible status will be
negotiated.
Despite the totally opening of the market, there will be residential and small
industrial end-users which will prefer to be supplied at regulated prices
through specific mechanisms. For these categories regulated prices will be
maintained. The suppliers selling electricity to these consumers are named
“Suppliers of Last Resort”.
During this period, ANRE will gradually reduce the obligation of the
electricity distribution/supply companies to take over electricity generated
in co-generation power plants, correlated with the results of studies and
programs for rehabilitation, modernization of and investments in systems
supplying heat to residential consumers. If the Directive on the promotion
of the electricity produced in co-generation units (CHP) will be adopted by
EU, a suitable mechanism will be put in place.
Transmission and distribution tariffs:
Due to nature of these activates i.e. natural monopolies, both the
transmission and the distribution tariffs will be regulated tariffs based on the
following principles, which are giving more stability and transparency to the
process:
The tariffication principles will be a the “price-cap” (CPI-X)
mechanism both for distribution and transmission activities.
The social tariff will be maintained, and in parallel a mechanism for direct
budget subsidy system of low income people will be defined and
implemented.
Fore heat: For residential heat consumers it is expected that the results of
the studies aimed to establish the optimal heating solution for each community
to be implemented and in a parallel program for reduction of the subsidies.
44

During this period the residential heat consumers will continue to pay a
National Reference Tariff, but the necessity to maintain it will be reviewed.
For cogeneration will result an obligation to purchase the energy, for which
specific mechanisms should be put in place.
Low income heat consumers will receive direct subsidies.
FOR NATURAL GAS
As of 2007 the market will be fully opened.
The domestic gas prices are fixed:
o for eligible consumers by negotiation
o for captive consumers, and for the consumers not exercising the
eligibility, domestic gas price is regulated (as approved by ANRGN)
Transmission and storage tariffs, are regulated tariffs approved by ANRGN
and ANRM, and than published, and they are based on justified costs plus
profit, and for distribution will be the “price-cap” (CPI-X) mechanism.
Until 2007, is estimated a gradual increase in natural gas end-users’ price
in order to be aligned to the wellhead import price.
In this stage of implementation of the prices and tariffs, ANRGN aims to
further differentiate the distribution tariffs for categories consumers supplied
from distribution systems.
The tariff for transmission services will remain unique at the national level,
“post stamp” type.
45

2008-2015
FOR ELECTRICITY:
The electricity prices: Electricity prices for the consumers exercising the eligible status will
be negotiated.
Despite the totally opening of the market, there will be residential and
small industrial end-users which will prefer to be supplied at regulated
prices through specific mechanisms. For these categories regulated prices
will be maintained. The suppliers selling electricity to these consumers are
named “Suppliers of Last Resort”.
During this period, ANRE will gradually reduce the obligation of the
electricity distribution/supply companies to take over electricity generated
in co-generation power plants, correlated with the results of studies and
programs for rehabilitation, modernization of and investments in systems
supplying heat to residential consumers. If the Directive on the promotion
of the electricity produced in co-generation units (CHP) will be adopted by
EU, a suitable mechanism will be put in place.
Transmission and distribution tariffs:Due to nature of these activates i.e. natural monopolies, both the
transmission and the distribution tariffs will be regulated tariffs based on the
following principles, which are giving more stability and transparency to the
process:
The tariffication principles will be the price-cap (CPI-X) mechanism
both for distribution and transmission activities and for distribution will
be the “price-cap” (CPI-X) mechanism
The social protection for low income consumers will be implemented by a
direct subsidy mechanism form the budget.
46

For heat, pending on the decision to continue the National reference price
system, in the invoice for each consumer will be reflected the cost of heat
based on a regulated price to be approved by the Regulatory Authority.
Low income heat consumers will receive direct subsidies.
For natural gasAs of 2007 the market is fully opened.
The domestic gas prices are fixed:
o -for eligible consumers by negotiation
o -for the consumers not exercising the eligibility, domestic gas price is
regulated (as approved by ANRGN)
Transmission, and storage tariffs are regulated tariffs approved by ANRGN
and ANRM, and than published, and they are based on justified costs plus
profit. In this stage for implementing the tariffs and prices system for
natural gas, ANRGN aims to differentiate the transmission tariff according
to the distance and the transported natural gas volume, and the distribution
tariffs according to the distribution zone covered by the operator.
47

BILL COLLECTION
Improvement of the energy bill collection
In the last two years it was recorded an important improvement of the bill
collection rate. In this respect the Government and the companies have taken
a serious approach by specific measures such:
A firm disconnecting program form power supply for the consumers not
paying the bills not
A clear program for recovery of the overdue, including the rescheduling
of the debts as well as:
the “escrow” accounts where payments for the heat as well state
subsidies are accumulated and than automatically distributed to
the distribution companies
an incentive instrument to pay the bills: such as rescheduling of
the old debts subject of paying the current bills and a forgiving
mechanism for the penalties of late payment in case the
customers follows the payment schedule;
A monthly monitoring program
As a consequence of this measures the collection rate has been significantly
improved: in the last twelve months (June 2002 – June 2003) to 94% for
electricity and to 97% for natural gas.
CONSULTANCY ASSISTANCE
In view of the implementation of these policies it will be needed the support of the EU as well as of international financial institutions, for implementation of the specific tasks with the participation of the specialized consultancy companies.
48

V. ENVIRONMENT
Romania has ratified the UN Framework Convention on Climate Changes.
In accordance with the Kyoto Protocol signed, Romania made the
commitment to reduce anthropogenic emissions of greenhouse gases by 8%
compared to the emissions of 1989 emissions level.
For the implementation of EU Directive 2001/80/Ec, The Romania
Government has prepared a draft of Government Decision for the limitation of
the emissions in the atmosphere coming from big power units i.e. over 50
MW, at the level of the EU Directives (for solid, SO2 and NOX emissions).
These limits are compulsory for any new unit to be implemented.
For the existing units in operation it is foreseen to achieve the required level
of emission in a gradual program so that by the year 2012 to cope with the
level of emission provided in the new regulation, by implementing a very
important investment program.
For the power plants in the structure of Termoelectrica, the total investment
effort for the period 2003 -2015 is estimated at the level of 1,026 billion $, out
of which 28,9% should be spend till the year 2007. The investment for
upgrading of the boilers and electro precipitator (solid emission) represents
8% of the total amount, for upgrading of the burners represents 6%, and for
desulphurization represents 86% of the total amount. EU and Word Bank financial support is needed to help Romania to comply with EU’s standards.
49

The result of the implementation of this program for the plants in the
structure of Termoelectrica is reflected in a significant reduction of the emissions, as
follows:
Emission 1989 2007 2012
SO2t/year 645.546 265.649 56.623
% compared to
1989
100 41% 8.8%
NOXt/year 112.152 62.125 56.386
% compared to
1989
100 55 50
Solidt/year 139.064 16.836 8.836
% compared to
1989
100 12 6
50

VI. RESTRUCTURING OF THE POWER GENERATION SECTOR AND THE MARKET OPERATION
As mentioned above the process of restructuring of the electricity and gas sector has started by: Unbundling of the vertically integrated power companies into autonomous :
Generation, Transmission, Distribution and supply;
Further unbundling of the generation side into: 5 thermal power producers,
one hydro producers, one nuclear producer and 14 cogeneration producers
which where transferred to the local authorities; there also three small IPP
separated in 1988;
Unbundling of the natural gas sector into autonomous: Production and
Storage (Romgaz) Transmission (Transgaz) and two Distribution
companies (Distrigaz North and Ditrigaz South)
Reduction of the concentration of the natural gas production and import by
authorization and licensing to an increasing number of companies;
Further unbandling has continued in the year 2002 and 2003 by:
Restructuring of the electricity distribution company into 8 regional
companies for electricity distribution The restructuring process of Termolectrica has started by:
o separation in the year 2001 of a power generation i.e. “Electrocentrale”
Deva
o by externalization of 19 power plants (18 to the local authorities and
one to Rompetrol SA).
o in order to create a better commercial environment the Government of
Romania, in December 2002 has approved a government decision for
restructuring of Termoelectrica, as follows:
51

As result of these restructurings of the energy production in thermal power plants, the following thermal power production entities are created and they are operating of the electricity market in Romania:
Name of the company Installed power in MW
Fuel
Electrocentrale Turceni SA 1990 MW lignite Electrocentrale Rovinari SA 1320 MW LigniteElectrocentrale Bucuresti SA 2.938 MW liquid fuel, natural gas and lignite Electrocentrale Deva SA 1.260 MW hard coal Termoelectrica SA* 2.237 MW liquid fuel, natural gas and hard
coal TOTAL 9.745 MW
It has been also done the separation of the maintenance and repair services
in 6 subsidiaries, and 12 repairing and maintenance branches has been
already implemented. They are operating based on service contracts.
* Termoelectrica keeps under its structure, as branches, 5 power plants with lower viability and for which special programs will be needed as per market configuration, including a conservation programs with an increased availability of other producers, as result of upgrading.
In the year 2003 fossil fuel sector in Romania has produced:
Generated power: 25.103 Twh and
Generated heat: 17.182 Tcal.
CONTRACTUAL MECHANISMS: ANRE has issued the necessary
regulation (licensing, tariffs and contractual arrangements) so that, these
entities exercise direct contracts commitments and access on the market.
These new commercial companies are operating based on own balance
sheets, which determine a more direct responsibility of the management for
lowering of the cost and improvement of the profit, compared with the
previous structures where these entities are cost centers of Termoelectrica.
For the two power generating companies based on lignite i.e., Turceni and
Rovinari, which are located close to the lignite mines mouth, established as
result of this restructuring, it is foreseen to incorporate the relevant lignite
open pits supplying coal, as cost centers of the power plants, in so called
"energy complexes", after finishing the ongoing restructuring process.
52

This is in line with the signals received from the potential investors in order
to have a direct control of the costs. The operation of the lignite mines, as
result of the restructuring process already implemented during the last 10
years, are no more subsidized, and they are operating on profit basis. By the
integration of the lignite mines as cost centers of the power generator, in a so
called "energy complexes" structure , it is foreseen to create a competitive
structure where the cost of mining operation to be controlled and subordinated
at the need of producing a competitive energy, and the disadvantage of
captivity to be cancelled. Such integrated power generating structures are in
operation successfully in countries like Germany, Spain, Hungary, Turkey,
and recently Poland.
Hydro power production will remain organized under the existing
structure of Hidroelectrica, and on a transition period till the year 2007 their
operation will be regulated. This regulatory regime is a transitional regime,
which will be maintained till 2007 (date of accession).
This regulatory regime consists of:
use the actual low costs of hydro generation in the benefit of all
consumers, captive or eligible, without discrimination;
Optimally use the water by using dedicated software – centralized hydro
optimizer - and considering thermal producer’s offers.
In order to put in place a transparent mechanism, two consultancy contracts
are used: one financed by PHARE , with Kema Consulting and one financed
by World Bank, consultant to be established.
Consultants should find best solutions for:
o setting up regulated revenues;
o setting up of non-discriminatory mechanisms for hydro rent allocation;
o procedures for the centralized hydro optimizer;
o setting up of the hydro producer’s multilateral contract, by which
OPCOM will collect from suppliers the regulated hydro revenues (if it
is the case).
53

The first step of fully regulating Hidroelectrica SA, was already done by
freezing the obligations in the contracts already concluded on the competitive
market (including export contracts).
Before the full opening of the market HIDROELECTRICA will be unbundled
into commercial structures to be privatized, preferably in packages with thermal
power plants (pending on the market reaction and decision) and their access on
the competitive market will be unrestricted.
VI. 1. ENERGY DEVELPOMENT PROGRAM FOR THE PERIOD 2003 – 2015
Assumptions:- Average electricity consumption growth: 2.7% / year
- Selection of rehabilitation & new units, based on legalized production cost
- Use of available domestic resources:
i. 30 mill. tones lignite (6.1 mill. toe)
ii. 3.5 mills. tones hard coal (1.2 mill. toe)
iii. Natural gas: domestic production in 2015 will represent 60-65% from
2001 production level
iv. Crude oil: domestic production in 2015 will represent 85% from 2001
production level
- New and rehabilitated coal-fired units with flue gas desulphurization (FGD)
devices and low NOx burners (LNB)
- Renewable – complementary to conventional resources: 3-4% from total
resources
- Total (maximum) domestic energy resources (including nuclear): about 24
mill. toe/year for 2005-2015 period
Projects to be promoted (see Apendix nr.1). The list of the projects to be promoted has been determined on the cost efficiency principle and their
qualification on the merit scale (see the Appendix nr. 1 with determination of
the levalized costs).
54

VI.2. POWER PLANTS CLOSURE PROGRAM
In the Appendix nr.1 there is an attachment of the power plants closure
program. This closure program has been determined based on the criteria’s of
efficiency for each generation unit, as well as the age of the equipment.
The moment of the closure will be decided by taking into account other
factors such availability of replacing power generation so that to secure to
cover of the pick demand and the need reserve margin.
The specific plant closure program will be finally validated based on the
EU/Phare assistance, which is under development.
VI.3 NUCLEAR SAFETY
For the past three years CERNAVODA power plant group nr. 2. Of 700 MW
has been providing 7% of the total average annual generation of electricity in
of Romania.
This nuclear power plant is operating based on updated technologies and
has an important contribution in satisfying the needs for electricity. The
operation is reliable.
The nuclear power projects are implemented by Romania by achieving the
requirements of the of acquis communitaire, including the Treaty of the
European Atomic Energy Community, as fundamental instruments for the
improvement of the living standard in the Member States and the
development of relations with other countries.
National legislation is harmonized with Community law in the area of
nuclear energy in the light of the EU enlargement.
Further securing the reliability of the plant is based on a complex plan of
action. In this respect the following additional targets have been approved and
followed:
55

ACTION PLAN IN ELECTRICITY (ELECTRICITY ROAD MAP) 2003-2015Improvement of nuclear safety according to UE document
“The Answer Of Romania Regarding The Recommendations Of The European Union ReportOn Nuclear Safety In The Context Of Enlargement”
Improvement of nuclear safety according to UE document
2003 – 2004 2005 – 2007 2008 - 2015SNN Action Time Period SNN Action Time Period SNN Action Time PeriodDevelopment and completion of seismic, fire and flood PSA 2002-2004
On -Site Emergency Operating Center at Cernavoda - Construction and Equipment Procurement
Q I 2005Completion of the Periodic Safety Review - Unit 1
2009
On -Site Emergency Operating Center at Cernavoda – Design Q I-IV 2003
On -Site Emergency Operating Center at Cernavoda - Commissioning
QII–III 2005
Specific safety improvement programs for nuclear power plants: Replacement of pump motors of primary heat transport system
Q II 2003Specific safety improvement programs for nuclear power plants: Design and installation of the test stand for the reactivity mechanisms
QIV 2005
Specific safety improvement programs for nuclear power plants: Up-dating stress analysis for Liquid Injection Shutdown System
QIII 2003Specific safety improvement programs for nuclear power plants: Rehabilitation of fire detecting system
QIV 2005
Specific safety improvement programs for nuclear power plants: Installation of expansion tank downstream PV78 in Emergency Core Cooling System
QIII 2003Completion of Probabilistic Safety Assessment - Level 2 and Level 3 2005 - 2006
On-site Emergency Operating Center at Cernavoda - Construction and Equipment procurement
Q III 2003 – 2004
Working Plan/Schedule for completion of the Periodic Safety Review - Unit 1
2006
Training Program for Preservation of Operators Competence Q IV 2003
56

Elaboration of the Chapter 15 (Accident Analyses) of Unit 2 - Safety Analysis Report Dec. 2003
Specific safety improvement programs for nuclear power plants: Up-dating/improvement of failed fuel detecting/locating system and gas analysis system
Q II 2004
Specific safety improvement programs for nuclear power plants: Refurbishment of D2O in H2O detecting instruments
QIII 2004
Specific safety improvement programs for nuclear power plants: Replacement/up-dating the gas chromatograph system
QIII 2004
Specific safety improvement programs for nuclear power plants: Means for maintaining of water temperature in dousing system
QIII 2004
Completion of Probabilistic Safety Assessment Level 1 « full scope » and implementation of the operation risk monitoring program
Q. IV 2004
ACTION PLAN IN ELECTRICITY (ELECTRICITY ROAD MAP) 2003-2015SPENT FUEL AND RADIOACTIVE WASTE MANAGEMENT
57

2003 – 2004 2005 – 2007 2008 - 2015
SNN Action Term Period SNN Action Term Period SNN Action Term Period
Commissioning of the first
storage module of the
spent fuel dry interim
storage facility, on
Cernavoda NPP site; the
storage capacity will be
extended every two year
mai.03
58

For further securing the requirements in this field Romania has taken
serious steps as mentioned above as well as training system, maintenance of
qualifications of the staff and its certification, as well as capacity building in the
organizations providing technical support in the field of nuclear energy.
VI.4 ELECTRIFICATION PROGRAM
Focus on areas with a low living standard
Isolated areas and spread-out (social) objectives, located at long
distances from communal centres can only be connected to the power system
if important funds are made available. The future customers cannot always
support the electrification expenses. In certain cases it is unlikely that the
investment can be recovered from the electricity sales profits in commercially
acceptable terms. The recovery period for such investments exceeds 12-15
years. For certain projects the investment is not even expected to be returned
during the lifetime of the fixed assets.
But this for the Romania Government this an important social program
which has to be continued in order to improve the living conditions for the
inhabitants of these areas which are lagging behind from an economic and
civilization point of view. Failure to make such investments has a negative
impact, causing discontent with social, administrative and political
connotations.
At the end of 2002 there were 93613 non-electrified households in
2571 localities, of which: 4636 households located in 203 completely non-electrified areas, 64207 households located in 2218 rural localities only
partially electrified and 24770 households located in 150 urban localities
requiring extension.
The total investment required for electrification of all households
throughout the country is about 300 mil Euro and the average specific cost
per household is about 3200 Euro/household.
59

The most unfavourable locations i.e. with the highest number of
households are located in rural areas with no electrification at all, as follows:
District No. of households No. of locations (villages)
Harghita 1088 32Alba 1029 42Bihor 312 4Hunedoara 294 22
The amount of works required for connection to the power system of the
4636 households out of the 203 completely non-electrified localities can be
expressed by the following global figures: 559.4 km overhead lines of 20 kV,
721.5 km overhead lines of 0.4 kV, 57 km overhead lines of 1 kV, 231 pieces
of new transformer substations of 20/0.4 kV (a total of 6033 kVA), 49 pieces
transformer substations of 1/0.4 kV (a total of 533 kVA). The funds required
for the electrification of these households amount to about 40 million Euros, and the average specific is pf about 8000 Euro/household.
Below is given, as an example, a number of villages with a significant
number of households and a minimum specific cost. We must mention that
the specific cost is not the only criterion when establishing the connection
priorities; as a rule, such priorities are established by the District Councils.
District Location No. Of households Specific cost(mil.ROL/Household
Alba Avram Iancu 45 52,4Zlatna 25 70,6Feteni 17 100Dealu Geoagiului 33 114,6
Harghita Laz 10 38,2Băile Chiriu 345 76,4Valea Rotundă 35 113
Hunedoara Dumeşti 25 155,4Bocşa Mare 25 160,6
Bacău Făgeţel 16 75Valea Lupului 48 78Tăula 46 96,9
60

INVESTMENTS NEEDED FOR COMPLETION OF THE ELECTRIFICATION PROCESS OF COMPLETELY NON ELECTRIFIED AREAS
(AS IDENTIFIED IN MAY 2002)
Nr.crt. SUBSIDIARY
No. of locations
[pcs.]
No. of households
[pcs.]
Investment
[mil. ROL]
Investment
[mil. Euro]
Specific Cost [mil. ROL/
household]
Specific Cost[k. Euro/
households]
1 MOLDOVA 18 407 60845.0 2.3 149.496 5.5372 DOBROGEA 4 72 10094.1 0.4 140.196 5.1923 MUNTENIA NORD 22 547 58024.0 2.1 106.077 3.9294 BANAT 34 569 230414.0 8.5 404.946 14.9985 OLTENIA 7 101 41148.4 1.5 407.410 15.0896 TRANSILVANIA NORD 23 535 96695.1 3.6 180.739 6.6947 TRANSILVANIA SUD 97 2628 549849.2 20.4 209.227 7.7498 MUNTENIA SUD 0.0 ELECTRICA 205 4859 1047069.8 38.8 215.491 7.981
In the implementation of these programs, financial assistance is needed from the financial institutions (World Bank) as well
within the programs of EU. Ministry of Industry is foreseeing to use also part of the proceeds form the privatization of the
energy utilities.
61

VII. REGIONAL ELECTRICITY MARKET
Romania should play an important role in the electricity market in the South-
Eastern Europe and, along with other countries systems, by ensuring the
balance of capacities in the second synchronous zone.
The evolvement of contractual relations should lead to the establishment of
a regional energy market in the context of the REM initiative of the countries
from the region (Albania, Bosnia-and-Herzegovina, Bulgaria, Greece,
Macedonia, Romania Serbia - Munte Negru and Turkey the newly accepted
member as of November Last year).
The regional market, in which Romania will play an important role, will
represent an important step for further integration with the EU energy market,
and is expected to provide better opportunities for free trade and for
marketing. In this respect has to be mentioned the initiative of Romania to set
up in Bucharest a national/regional power exchange, for which negotiations
are going on.
62

APPENDIX 1
» Primary energy balance for Romania for the period 2003-2015
» Macroeconomics and energy indicators for the period 2003-2015
» Structure of the domestic primary energy consumption
» Installed power demand; load curves for the period 2003-2015
» Development program for the generation capacities for the period
2003-2015
» Fuel consumption and heat production for the period 2003-2015
» Electricity average cost at end – users
» Electricity average cost at end-users
» Evolution of the natural gas internal market opening degree in the
perspective of the Romania’s EU accession
» Evolution of the number of eligible consumers and evolution of the
natural gas internal market opening degree
» Evolution of the domestic market demand, production and import of
natural gas for the period 2003-2015
» Development of the natural gas storage capacities in the period 2000-
2010
63
64

65

Macroeconomic and electricity indicators of Romania during the period 1998 - 2015Base scenario
U.M. 1998 1999 2000 2001 2002 2003 2004 2005 2010 2015
Achievements Preliminary achievements Estimation
1. Population mil loc 22,5 22,5 22,4 22,4 22,3 22,3 22,2 22,2 22,4 22,6
annual growth rate 0/00 -2,0 -1,9 -1,7 -1,5 -1,5 -2,7 -0,4 1,40 2,0
2. Gross Domestic Product (GDP) 109$98 42,1 41,6 42,4 44,6 46,7 49,1 51,8 54,5 72,9 93,9
annual growth rate % -5,4 -1,2 1,8 5,3 4,7 5,2 5,5 5,1 6,0 5,2
GDP/inhabitant $98/inhabitant 1872 1853 1890 1993 2090 2202 2329 2449 3255 4152
3. Final electricity consumption TWh 42,23 38,74 39,78 41,13 40,78 41,71 43,43 44,14 50,99 57,59
annual growth rate % -8,3 2,7 3,4 -0,8 2,3 4,1 1,6 2,9 2,5
final consumption/inhabitant kWh/inhabitant 1877 1725 1775 1838 1825 1869 1952 1985 2277 2546
4.1. Net consumption (4.1 = 3 + 5.1) TWh 42,95 40,67 41,25 43,21 44,07 44,72 46,43 47,14 51,0 57,6
4.2. Gross consumption (with losses) TWh 49,47 47,06 47,84 49,96 50,88 51,65 53,68 54,50 58,9 66,6
4.3. Gross domestic consumption (4.3 = 4.2 – 5.1) TWh 48,75 45,13 46,37 47,88 47,59 48,64 50,68 51,50 58,9 66,6
5.1. Export TWh 0,720 1,930 1,470 2,077 3,290 3,012 3,0 3,0 0,0 0,0
5.2. Import TWh 1,180 1,103 0,774 0,767 0,436 0,316 0,0 0,0 0,0 0,0
5. Net electricity generation (5 = 4.3 + 5.1 - 5.2) TWh 48,29 45,96 47,07 49,19 50,45 51,33 53,68 54,50 58,9 66,6
6. Selfconsumption TWh 5,21 4,75 4,88 4,67 4,70 4,76 5,60 5,65 5,94 6,32
7. Gross electricity generation (7 = 5 + 6) TWh 53,5 50,7 52,0 53,9 55,2 56,1 59,3 60,1 64,9 72,9
Note: After 2005 import and export are not considered
Macroeconomic and energy indicators of Romania during the period 1998 - 201566

Alternativ scenario
U.M. 1998 1999 2000 2001 2002 2003 2004 2005 2010 2015
Achievements Preliminary achievements Estimation
1. Population mil loc 22,3 22,3 22,2 22,2 22,4 22,6
annual growth rate 0/00 -1,5 -1,5 -2,7 -0,4 1,40 2,0
2. Gross Domestic Product (GDP) 109$98 46,7 48,7 50,7 53,0 69,3 88,4
annual growth rate % 4,7 4,2 4,2 4,6 5,5 5,0
GDP/inhabitant $98/inhabitant 2090 2181 2279 2385 3095 3909
3. Final electricity consumption TWh 40,78 41,91 43,15 44,59 51,35 58,01
annual growth rate % -0,8 2,8 2,9 3,3 2,9 2,5
final consumption/inhabitant kWh/inhabitant 1825 1879 1939 2005 2293 2565
4.1. Net consumption (4.1 = 3 + 5.1) TWh 44,07 44,93 46,15 47,59 51,4 58,0
4.2. Gross consumption (with losses) TWh 50,88 51,65 53,35 55,02 59,4 67,1
4.3. Gross domestic consumption (4.3 = 4.2 - 5.1) TWh 47,59 48,64 50,35 52,02 59,4 67,1
5.1. Export TWh 3,290 3,012 3,0 3,0 0,0 0,0
5.2. Import TWh 0,436 0,316 0,0 0,0 0,0 0,0
5. Net electricity generation (5 = 4.3 + 5.1 - 5.2) TWh 50,45 51,33 53,35 55,02 59,4 67,1
6. Selfconsumption TWh 4,70 4,76 5,57 5,71 5,98 6,37
7. Gross electricity generation (7 = 5 + 6) TWh 55,2 56,1 58,9 60,7 65,3 73,4
Note: After 2005 import and export are not nsidered 109,5
67

0
10000
20000
30000
40000
50000
60000
70000
2001 2005 2010 2015
Imported gas &crude oil
Renewables andothers
Nuclear
Domestic gas &crude oil
Coal
Hydro
STRUCTURE OF THE DOMESTIC PRIMARY ENERGY CONSUMPTION
[thou. toe]
34%
66%
imported resources domestic
resources
49%
51%
imported resources
DOMESTIC PRIMARY ENERGY CONSUMPTION IN 2015
domestic resources
68

Unit 2003 2004 2005 2006 2007 2008 2009 2010 2015Net electricity production - Total system TWh 51,33 53,68 54,50 55,35 56,22 57,10 57,99 58,90 66,60Load factor Hours 6320 6300 6300 6300 6200 6100 6100 6000 6000Peak load - Total system MW 8122 8521 8651 8786 9068 9360 9507 9817 11100Net electricity production – domestic consumption TWh 48,64 50,68 51,50 55,35 56,22 57,10 57,99 58,90 66,60
Load factor Hours 6393 6300 6300 6300 6200 6100 6100 6000 6000Peak load - domestic consumption MW 7608 8044 8175 8786 9068 9360 9507 9817 11100Evolution of the existing installed power MW 17357 16062 15007 13827 12732 12732 11742 11742 11742Evolution of the existing net available power MW 13206 12154 11221 10201 9221 9221 8377 8377 8377Available power reserve - MW (5=4-1.3) MW 5084 3633 2570 1415 153 -139 -1130 -1440 -2723 - % of net peak load % 62,6 42,6 29,7 16,1 1,7 -1,5 -11,9 -14,7 -24,5Necessary power reserve - MW MW 2599 2727 2768 2812 2902 2808 2852 2847 2775 - % of net peak load % 32 32 32 32 32 30 30 29 25Necessary net available power (7=6+1.3) MW 10721 11247 11419 11598 11969 12169 12359 12664 13875Available net power - Excess "+" / deficit "-" (8=4-7) MW 2485 907 -198 -1397 -2748 -2948 -3982 -4287 -5498
INSTALLED POWER DEMAND IN THE 2004 - 2015 PERIODBase Scenario
69

70

INSTALLED POWER STRUCTURE IN THE 2003 - 2015 PERIODBase scenario
- MW - 2003 2004 2005 2010 2015TOTAL 17357 16334 15691 16838 18455
1. Hydro power plants 6052 6099 6181 6381 65812. Nuclear power plants 707 707 707 1414 21213. Thermal power plants 10598 9528 8803 9043 9753 of which in units on: Lignite 4779 4264 4264 4064 4064 hard coal 1410 1215 1005 1265 1265 Hydrocarbons 4409 4049 3534 3714 4424
GROSS ELECTRICITY PRODUCTION STRUCTURE IN THE 2003 - 2015 PERIODBase scenarioHIDROELECTRICA's exports of 3 TWh/year till 2005 is included
- TWh - 2003 2004 2005 2010 2015TOTAL 56,1 59,3 60,1 64,9 72,9
1. Hydro power plants 17,04 17,00 17,00 17,20 18,002. Nuclear power plants 5,34 5,34 5,34 10,68 16,023. Thermal power plants 33,72 36,96 37,76 37,02 38,88 of which in units on: Lignite 17,30 17,50 17,80 18,00 18,00 hard coal 5,29 5,53 5,53 5,93 5,93 Hydrocarbons 11,13 13,93 14,43 13,09 14,95
71

TOTAL INSTALLED POWER STRUCTURE
0
4000
8000
12000
16000
20000
2003 2004 2005 2010 2015
MW
Hydro power plants
Thermal power plants onhydrocarbons
Thermal power plants onhard coal
Thermal power plants onlignite
Nuclear power plants
GROSS ELECTRICITY PRODUCTION STRUCTURE
0
10
20
30
40
50
60
70
80
2003 2004 2005 2010 2015
TWh
Hydro power plants
Thermal power plantson hydrocarbons
Thermal power plantson hard coal
Thermal power plantson lignite
Nuclear power plants
72

Load duration curve of the net production
0
2000
4000
6000
8000
10000
12000
1 1001 2001 3001 4001 5001 6001 7001 8001
MW
2003 2010 2015
2003Total En.: 51.31 TWhBase En.: 41.82 TWhHalf Peak En.: 5.53 TWhPeak En.: 3.96 TWhPmax = 8122 MWPmin = 3779 MW
2010Total En.: 58.90 TWhBase En.: 45.93 TWhHalf Peak En.: 7.56 TWhPeak En.: 5.41 TWhPmax = 9817 MWPmin = 3884 MW
2015Total En.: 66.60 TWhBase En.: 51.93 TWhHalf Peak En.: 8.55 TWhPeak En.: 6.12 TWhPmax = 11100 WPmin = 4392 MW
73

Load duration curve of the net production- 2003
0
1000
2000
3000
4000
5000
6000
7000
8000
9000
1 1001 2001 3001 4001 5001 6001 7001 8001
Total Base Half Peak Peak
Peak En.: 3.96 TWh; Pmax: 2275 MWHalf Peak En.: 5.53 TWh; Pmax: 1346 MWBase En.: 41.82 TWh; Pmax: 5770 MWTotal En.: 51.31; Pmax 8122 MW
Load duration curve of the net production - 2010
0
2000
4000
6000
8000
10000
12000
1 1001 2001 3001 4001 5001 6001 7001 8001
Total Base Half Peak Peak
Peak En.: 5.41 TWh; Pmax: 3108 MWHalf Peak En.: 7.56 TWh; Pmax: 1839 MWBase En.: 45.93 TWh; Pmax: 6603 MWTotal En.: 58.90 TWh; Pmax: 9817 MW
74

Load duration curve of the net production - 2015
0
2000
4000
6000
8000
10000
12000
1 1001 2001 3001 4001 5001 6001 7001 8001
Total Base Half Peak Peak
Peak En.: 6.12 TWh; Pmax: 3514 MWHalf Peak En.: 8.55 TWh; Pmax: 2079 MWBase En.: 51.93 TWh; Pmax: 7467 MWTotal En.: 66.60 TWh; Pmax: 11100 MW
75

EVOLUTION OF THE NECESSARY POWER CAPACITIES - net values -
6000
8000
10000
12000
14000
16000
2003 2004 2005 2006 2007 2008 2009 2010 2014 2015
MW
peak load
necessary available power
existing available power
Necessary power reserve
76

GENERATION CAPACITIES DEVELOPMENT PROGRAM FOR THE 2004 - 2015 PERIODBase Scenario Total Total Total Total Total Total Total Total
2004 20052004-2005 2006-2010
2011-2015
2004-2015 2004 2005
2004-2005 2006-2010
2011-2015
2004-2015
TOTALInstalled power Available power272 412 684 4412 1617 6713 198 340 538 3773 1413 5724
1. Rehabilitated capacity 240 345 585 2060 210 2855 178 300 478 1742 184 24031.1. Thermal power plants 225 330 555 2060 210 2825 163 285,2 448 1742 184 2373
- Turceni - unit 5*, 6, 3 1 x 330 330 2 x 330 990 1 x 285.2 285,2 2 x 282.2 850 - Rovinari - unit 3, 5 2 x 330 660 2 x 277.9 556 - Isalnita - unit 7 1 x 315 315 1 x 266 266 - Deva - unit 3*, 1 1 x 225 225 1 x 210 435 1 x 163 163 1 x 165 328 - Palas - unit 1 1 x 50 50 1 x 48.8 49
- Galati - unit 3, 4, 5, 6 1x10⁵; 1x60 2 x 10⁵ 375
1x91.8; 1x49.73 2 x 91.8 325
1.2. Hydro power plants (Portile de Fier) 15 15 30 30 15 15 30 302. New capacity 32 67 99 2352 1407 3858 20 40 60 2031 1229 33202.1. Thermal power plants 1445 500 1945 1246 450 1696 - Paroseni - unit 4* 1 x 150 150 1 x 125.6 126 - GT w/ HR Grozavesti 2 x 50 100 2 x 41.1 82 Craiova II 1 x 25 25 1 x 23.2 23 Bucuresti Sud 1 x 71 71 1 x 65.7 66 Titan 1 x 13.5 13,5 1 x 12.3 12 Palas 1 x 25 25 1 x 23.2 23 - CCGT electricity only 2 x 250 500 2 x 225 450 Cogeneration - Bucuresti Sud 2 x 100 200 2 x 86 172 - Bucuresti Vest 2 x 100 200 2 x 86 172 - lignite-fired unit w/ AFBC boiler Rovinari 2 x 330 660 2 x 285 570 Doicesti 2.2. Hydro power plants 32 67 99 200 200 499 20 40 60 126 120 3062.3. Nuclear power plants 707 707 1414 659 659 1318*) Decided units
77

PROPOSAL FOR THE REHABILITATION AND NEW UNITS INSTALLATION PROGRAM
2003 - 2005 period: TOTAL 684 MW
Rehabilitation of225 MW on hard coal
Rehabilitation of330 MW on lignite Rehabilitation of
30 MW hydro
New units99 MW hydro
2006 - 2010 period: TOTAL 4412 MW
Rehabilitation4 x 330 MW FGD
1 x 315 MW
New units on gas4 x 100 CCGT in cogeneration
New units707 MW nuclear
(unit # 2 NPP)
New units150 MW on hard coal
New units on lignite2 x 330 MW - AFBC
Rehabilitation of210 MW on hard coal
w/ FGD
New units200 MW hydro
Rehabilitation of215 MW on
hydrocarbons in cogeneration
2011 - 2015 period: TOTAL 1617 MW
New units200 MW hydro
New units707 MW nuclear
(unit # 3 NPP)
Rehabilitationof 2 x 10⁵ MW on hydrocarbons in
cogeneration
New units on gas2 x 250 MW
CCGT in condensing
78

Thermal power units retirement evolution - existing units on 01.01.2003(based on the unit rehabilitation plans and the unit life time expiration)
- MW - Total Total Total Total Total Total Total Total 2004 2005 2003-2005 2006-2010 2011-2015 2003-2015 2004 2005 2003-2005 2006-2010 2011-2015 2003-2015
Total Installed power Available power720 560 1280 2185 0 3465 603 512 1115 1912 0 3027
1. on lignite 200 0 200 1835 0 2035 160 0 160 1578 0 17381.1. condensing 200 200 1835 2035 160 160 1578 1738 - Turceni - unit 1, 7 2 x 330 660 1 x 284, 1 x 280 564 - Rovinari - unit 4, 6 2 x 330 990 1 x 287, 1 x 277 564 - Isalnita - unit 8 1 x 315 315 1 x 290 290
- Doicesti - unit 7, 81 x 200 200 1 x 200 400
1 x 160 160 1 x 160 320
1.2. cogeneration 2. on hard coal 210 210 420 100 0 520 175 175 350 89 0 4392.1. condensing 210 210 420 420 175 175 350 350
- Deva - unit 4, 21 x 210
1 x 210 420 420
1 x 175 1 x 175 350 350
2.2. cogeneration 100 100 89 89 - Paroseni - unit 1, 2 2 x 50 100 2 x 44.5 89
3. on hydrocarbons 310 350 660 250 0 910 268 337 605 245 0 8503.1. condensing 310 310 310 268 268 268
- Ludus - unit 31 x 100 100 100 1 x 95 95 95
- Borzesti - unit 81 x 210 210 210
1 x 173 173 173
3.2. cogeneration 350 350 250 600 337 337 245 582 - Grozavesti - unit 1, 2 2 x 50 100 100 2 x 44.2 88 88
- Bucuresti Sud - unit 5, 6 1 x 125 125 1 x 125 250 1 x 123 123 1 x 123 246
- Bucuresti Vest - unit 1, 2 1 x 125 125 1 x 125 250 1 x 126 126 1 x 122 248
FUEL CONSUMPTION FOR ELECTRICITY AND HEAT PRODUCTION
Base Scenario
U.M. 2003 2004 2005 2010 2015
Lignite mill. Tons 30,00 30,00 30,00 30,00 30,00
domestic hard coal mill. Tons 3,14 3,14 3,33 3,70 3,70
imported hard coal mill. Tons 0,36 0,36 0,36 0,36 0,36
natural gas bill.Ncm 3,41 3,88 4,17 4,14 4,45
Fuel oil mill. Tons 2,44 2,67 2,56 2,14 2,14
TOTAL mill. Toe 11,679 12,281 12,473 12,195 12,450
79

80
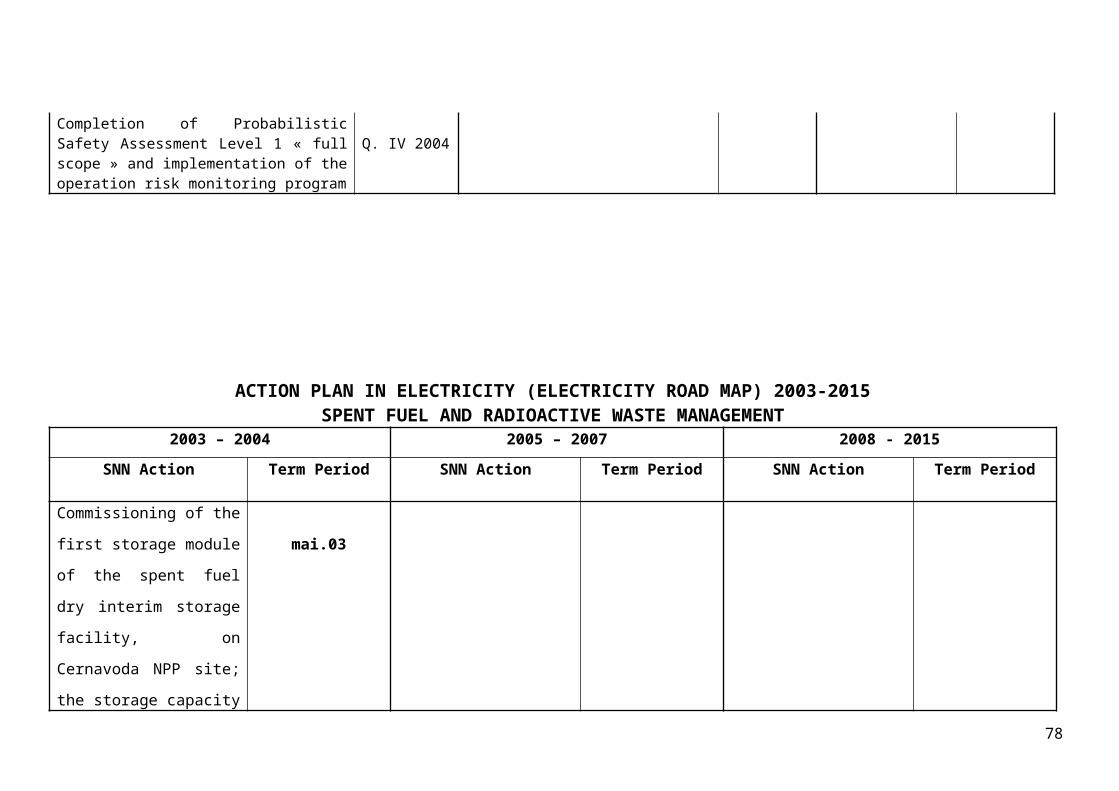
FUEL CONSUMPTION FOR ELECTRICITY & HEAT SECTOR
0,000
2,000
4,000
6,000
8,000
10,000
12,000
14,000
2003 2004 2005 2010 2015
[106 tep]
heavy fuel oil
natural gas
imported hard coal
domestic hard coal
lignite
81

FUEL PRICES
0
50
100
150
200
250
2005 2010 2015 2020 2030
$/toe
Imported oil
Importednatural gas
Domestichard coal
Domesticlignite
82
ELECTRICITY AVERAGE COST - ESTIMATION
Assumptions
- Straight line depreciation on the life time, without financial costs
- EU DG6 trend forecast for fuel prices evolution
- Increasing of efficiency by rehabilitation and new units
- Investment for environment are included
- Without profit
83

84

85

Discount rate 10%
No. Unit Installed Net long term Net Fuel Primary fuel Capacity Construction Life Levelized
capacity capacity efficiency fixed variab. type cost in 2010 factor time time cost
MW MW mil $ $/kWnet % $/kWnet,yr $/MWhnet $/GJ % years years $/MWhnet *)
1 DEVA, rehabilitation unit 3, Q=100 Gcal/h 224 176 72 410 35.2 18.8 0.9 hard coal 2.03 77 3 15 37.19
2 PAROSENI, rehabilitation unit 4, Q max 150 120 100 833 42.4 17.3 0.7 hard coal 2.03 78 3 20 41.90
3 TURCENI, rehabilitation unit 5 330 285 185 649 32.6 28.7 0.9 lignite 1.71 75 3 15 44.43
*) Levelized cost considers after 2007 the operation of FGD capacity
Ranking order of decided units according to the levelized cost
Investment O&M cost
cost
2003 2004 2005 2010 2015TOTAL 56.1 59.3 60.1 64.9 72.9
1. Hydro power plants 17.04 17.00 17.00 17.20 18.002. Nuclear power plants 5.34 5.34 5.34 10.68 16.023. Thermal power plants 33.72 36.96 37.76 37.02 38.88
of which in units on: lignite 17.30 17.50 17.80 18.00 18.00 hard coal 5.29 5.53 5.53 5.93 5.93 hydrocarbons 11.13 13.93 14.43 13.09 14.95
- TWh -
HIDROELECTRICA's exports of 3 TWh/year till 2005 is includedBase scenario
GROSS ELECTRICITY PRODUCTION STRUCTURE IN THE 2003 - 2015 PERIOD
No. Unit Installed Net long term Net Fuel Primary fuel Capacity Construction Life Levelized
capacity capacity efficiency fixed variab. type cost in 2010 factor time time cost
MW MW mil $ $/kWnet % $/kWnet,yr $/MWhnet $/GJ % years years $/MWhnet
1 CERNAVODA unit 2 706.5 664 686 1034 32.4 41.3 2.6 nuclear 0.24 85 4 30 27.38
2 Combined cycle 100 MW with cogeneration 100 86 49 573 57.1 20.1 1.2 nat gas 2.96 86 3 30 34.35
3 Gas turbine with heat recovery boiler 43 MW 43 38 25 672 55.1 29.3 0.9 nat gas 2.96 87 1 25 36.88
4 Combined cycle 250 MW 250 225 172 764 52.3 13.5 0.5 nat gas 2.96 82 2 30 37.85
5 Combined cycle 200 MW 200 179 142 795 51.3 16.6 0.5 nat gas 2.96 82 2 30 39.23
6 CERNAVODA unit 3 706.5 664 1200 1807 32.4 41.3 2.6 nuclear 0.24 85 4 30 39.79
7 ROVINARI, rehabilitation unit 330 MW with FGD 330 278 204 735 32.3 30.1 1.1 lignite 1.71 77 3 15 41.03
8 CERNAVODA unit 4 706.5 664 1250 1883 32.4 41.3 2.6 nuclear 0.24 85 5 30 41.83
9 CERNAVODA unit 5 706.5 664 1300 1958 32.4 41.3 2.6 nuclear 0.24 85 5 30 43.07
10 New unit with atmospheric fluidized bed comb. (ROVINARI) 330 285 360 1263 37.0 22.0 1.1 lignite 1.71 80 3 30 43.11
11 ISALNITA, rehabilitation unit 7 with FGD 315 266 182 684 33.8 23.9 0.8 lignite 1.71 77 3 15 44.76
12 DEVA, rehabilitation unit 1 with FGD, Q=50 Gcal/h 210 164 138 841 33.8 19.0 1.2 hard coal 2.03 77 3 15 46.72
13 TURCENI, rehabilitation unit 3 with FGD 330 282 227 804 32.3 28.8 1.0 lignite 1.71 77 3 15 46.85
14 TURCENI, rehabilitation unit 6 with FGD 330 282 235 833 32.3 28.8 0.9 lignite 1.71 77 3 15 47.34
15 New unit with atmospheric fluidized bed comb. (ISALNITA) 250 218 285 1307 36.7 21.0 0.7 lignite 1.71 80 3 30 49.81
16 New unit with atmospheric fluidized bed comb. (DOICESTI) 150 129 195 1512 35.0 19.9 1.6 lignite 1.71 80 3 30 54.04
cost
Ranking order of candidate units according to the levelized cost
Investment O&M cost
Discount rate 10%
86
APPENDIX 2
ELECTRICITY ROAD MAP
MARKET STRUCTURE AND REGULATION
FOR THE PERIOD 2003-2015
100%
75%
50%
40%
30%
0%
10%
20%
30%
40%
50%
60%
70%
80%
90%
100%
2003 2004 2005 2006 2007
Evolution of natural gas internal market opening degree in the perspective of Romania's EU accession
87

90%
10%
EVOLUTION OF NUMBER OF THE ELIGIBLE CONSUMMERSEVOLUTION OF NUMBER OF THE ELIGIBLE CONSUMMERS
25%
75%
30%
70%
2001 2002 2003
17
41
54
0
10
20
30
40
50
60
2001 2002 2003
100%
0%
2007
Total opening of the market
EVOLUEVOLUTION OF NATURAL GAS INTERNAL MARKET OPENING DEGREETION OF NATURAL GAS INTERNAL MARKET OPENING DEGREE
88

EVOLUTION OF DOMESTIC MARKET DEMAND, PRODUCTION AND IMPORT FOR NATURAL GAS
2003 - 2015
0
5
10
15
20
25
2003 2004 2005 2006 2007 2008 2009 2010 2011 2012 2013 2014 2015
BCM
0%
1%
2%
3%
4%
5%
6%
7%
Domestic production Import Annual growth of market demand GDP annual growth
89

ROMANIAROMANIANATIONAL REGULATORY AUTHORITY IN NATURAL GAS SECTORNATIONAL REGULATORY AUTHORITY IN NATURAL GAS SECTOR
1.301.50
2.00
2.50
3.25
4.05
5.00
5.80
6.30 6.306.55
0.00
1.00
2.00
3.00
4.00
5.00
6.00
7.00bln. c.m.
2000 2001 2002 2003 2004 2005 2006 2007 2008 2009 2010
Development of storage capacyties in the period 2000 - 2010
90

APPENDIX 2
ELECTRICITY ROAD MAP
MARKET STRUCTURE AND REGULATION
FOR THE PERIOD 2003-2015
91

ELECTRICITY ROAD MAP 2003- 2015Market structure and regulations
2003- 2004 2005- 2007 2008- 2015
I) Sector structure, market
participants,characteristics
stages
A)- Producers (P)
- 5 thermal producers (5T), about 45% market share (~3x 11%, 7% and 5%)
- 14 co-generation producers (50- 300MW) (14 CoGen), about 10% market share
- 1 nuclear-power producer – about 10% market share (NPP)
- 1 hydropower producer (HPP), about 31% market share, regulated through royalties;
- other small producers (P) and auto-producers (AP), about 4% market share, generally co-generation plants or plants using renewable resources.
A)- Producers (P)
- 5 thermal producers minimum, state-owned or private, other producers (5T+O)
- co-generation producers (CoGen) - 1 nuclear power producer- NPP
(with 2 operating units) -1 hydropower producer (HPP)
Before the full opening of the
market HIDROELECTRICA will be
unbundled into commercial
structures to be privatized,
preferably in packages with thermal
power plants (pending on the
market reaction and decision) and
their access on the competitive
market will be unrestricted.
- Hydro production will be regulated through royalties till the full opening of the market.
A)- Producers (P)
- several thermal and hydro producers; - 1 nuclear producer; - other producers and AP, generally
co-generation plants or plants using renewable resources.
92

Characteristics:- companies where the state is
major shareholder (MEC-Ministry of Economy and Commerce/ Local Administration); MEC attracts private investors.
- 5 T+ 14 CoGen The revenues of these producers are obtained through sales at regulated prices and through sales on the competitive market;
- NPP, HPP revenues are entirely regulated;
- beginning August 1, 2004 a reduction of the production quota taken at regulated prices for co-generation plants will gradually begin, correlated with efficiency programs
- the current regulatory regime of small P and AP continues.
- other producers, including hydropower producers resulting from public private partnerships and auto-producers (AP), generally co-generation power plants or plants using renewable resources.
Characteristics:- private companies in the thermal,
hydro, co-generation and AP sectors, will operate on the market
- companies where state is major shareholder (MEC/ Local Administration);
- 5T+A and CoGen revenues partially provided through sales at regulated prices while the weight of their revenues on the competitive market will increase in correlation with the opening degree of the market;
- NPP and SHE revenues are entirely regulated;
- for co-generation plants the gradual reduction of the regulated prices quota accepted on the market at regulated prices continue, correlated with efficiency programs;
- current regulatory regime of small P and AP continues/improves.
Characteristics- reshaped/ re-configured production
companies, privately owned;- plants from the initial 5T+O patrimony
(not closed) that are not privatized remain under state ownership and participate in the competitive market;
- for co-generation plants the gradually reduction of the regulated quota accepted on the market will continue to be correlated with their efficiency programs;
- producers act on the market exclusively on competitive basis;
- re-configuration- size and technological mix – in the producers’ privatization process through sales, mergers, concessions, bankruptcies, depending on the size of the internal/regional market.
B)- Transmission Operator (T) + System Operator (SO)
93

B)- Transmission Operator (T) + System Operator (SO)- state ownership, regulated
- third party access to the grid is regulated, based on transparent published tariffs
- Hourly market preparation: - CN Transelectrica SA with
PHARE assistance implements and tests metering systems required for the hourly market settlement.
C) Distribution Operators + Suppliers to captive consumers (D/S)
- 8 independent companies, under privatization; 2 D/S are offered for privatization in 2003 and another 2 D/S– at least - in 2004, and the process will continue at a path of 2 D/S/ year .
-Characteristics:- entirely regulated activity;- third party access to the grid is
regulated, based on transparent published tariffs
B)- Transmission Operator (T) + System Operator (SO)- state ownership, regulated
- third party access to the grid is regulated, based on transparent published tariffs
-
C) Distributors + suppliers to captive consumers (D/S)
- independent companies, privately ownership
Characteristics:- entirely regulated activity- third party access to the grid is regulated, based on transparent published tariffs
- state ownership, regulated
- third party access to the grid is regulated, based on transparent published tariffs
C) Distributors
- independent companies, private ownership
Characteristics:- entirely regulated activity;- third party access to the grid is
regulated, based on transparent published tariffs
94

- accounting separation of the distribution and supply activities of the D/S both for captive consumers supply as well as for eligible consumers supply.
D)Suppliers to eligible consumers:
-licensed suppliers for the entire country;-8 licensed suppliers with separate accounts from distribution
-producers also developing supply activities throughout the country, with separate accounts from generation
E) Eligible consumers-market gradually opens for industrial consumers -review of eligibility criteria to simplify the accreditation procedure
-by the end of 2007 all D/S companies will be offered for privatization-as of July 2007 the supply activity will be legally separated form the distribution activity in the D/S as per EU Directives
Preparation of subsequent evolution- MIR+ ANRE+ Consultant- defining, procedures to set and implement the Supplier of Last Resort (SLR) concept, including the mechanism to set prices to end users.D)Suppliers to eligible consumers:
-licensed suppliers for the entire country-licensed suppliers with separate accounts from distribution -producers also developing supply activities throughout the country, with separate accounts from generation-as of July 2007 supply activity will be legally separated form the distribution activity. E) Eligible consumers -market opening will continue reaching 100% for industrial consumers by 01.01.2007, -market opening will reach 100% opening for domestic consumers by 01.07.2007,
D)Suppliers to consumers (as of 2007 all consumers are eligible):-licensed suppliers for the entire country -nominated Suppliers of Last Resort
F) Market Operator–OPCOM 95

F) Market Operator– OPCOM
-100% subsidiary of T + OS -the electricity transactions administrator-has entirely regulated revenues-will be set up as Power Exchange (PX) to fulfill two functions: -administrator of the compulsory electricity physical market, regulated by ANRE-administrator of the voluntarily electricity financial market, regulated by CNVM (Romanian National Securities Commission)
F) Market Operator–OPCOM
-will begin to operate as a power exchange with two functions:
-administrator of the compulsory electricity physical market, regulated by ANRE-administrator of the voluntarily electricity financial market, regulated by CNVM (Romanian National Securities Commission)
G) Brokers & Traders
-power exchange, part of the regional South East European Market
G) Brokers & Traders
II) Electricity wholesale market
A)- Long and medium term electricity contracts market currently represented by:- negotiated contracts for eligible
consumers- regulated contracts (pxQ) for
captive consumers- import-export contracts- Preparation of the new
commercial/ trading arrangements for the sector:
A)- Long and medium term electricity contracts market represented by:- multilateral contracts for the HPP
and CoGen - Initial Contracts and Initial Option
Contracts (vesting contracts) operating between 5T+O and D/S
- electricity contracts freely negotiated among parties to complement captive consumption and cover the eligible market
- contracts to ensure the necessary capacity margin in SEN (capacity tickets)
A)- Long and medium term electricity contracts market represented by:- freely negotiated electricity contracts
will be generalized - contracts to ensure the necessary
capacity margin in SEN (capacity tickets)
- hedging contracts in the electricity financial market
- import-export contracts – the same as in the previous stage or according to the Regional Market rules
96

- ANRE sets a transitory mechanism for the new generation companies resulting from Termoelectrica, consequence of the GD 1524/2002 enforcement;
- ANRE+Consultant define and implement mechanisms to fully regulate HPP:o setting up regulated revenues
and freezing the obligations in the contracts already concluded on the competitive market (including export contracts)
o setting up of non-discriminatory mechanisms for hydro rent allocation– short and medium term
o procedures for the centralized hydro optimizer
o setting up of the hydro producer’s multilateral contract, by which OPCOM will collect from suppliers the regulated hydro revenues
- MAP + Local Authorities + MEC Consultant set up the CoGen policy and necessary assistance on short and medium run– December 2003
- ANRE+ Consultant draw up
- hedging contracts in the voluntary electricity financial market
- import-export contracts – the same as in the previous stage or according to the Regional Market rules
97

mechanisms and regulations required to enforce the set CoGen policies – September 2004
- ANRE+ Consultant define and design the Initial Contracts and the Initial Option Contracts (vesting contracts) – December 2003 – and assist the parties with their implementation
- ANRE+ Consultant examine the opportunity and, if needed, define contracting and payment mechanisms required to ensure the continuity of supply on medium-long term (capacity tickets)
- ANRE+ Consultant define and implement regulations, including mechanisms for access to the interconnect capacity, for import-export operations
- ANRE+ Consultant define and implement the new Commercial Code of the Wholesale Market and the associated regulations- December 2004
B) Short term electricity market–
98

the day-ahead market (DAM) is currently represented by:- spot market purchases- the daily centralized scheduling of
the production and the setting up of the system marginal price based on units bids, by using PCOMS software upgraded to fit the new production structure
Preparation of new trading platform of OPCOM - ANRE+ Consultant draw up
necessary regulations to ensure OPCOM functioning as a compulsory power exchange for the wholesale market participants (DAM), with bilateral bids/offers at company level and self-scheduling (including the functions of “centralized hydro optimizer agent” and “hourly settlement agent”).
- OPCOM+ Consultant draw up terms of reference for the new transaction platform defined by ANRE
- OPCOM+ Consultant +Market participants create and test the functions of the new DAM platform
- ANRE+ OPCOM+ Consultant
B) Short term electricity market– the day-ahead market (DAM):- use of the new transaction platform
developed in the previous stage- possible changing to the voluntarily
participation in the physical market- subsequently, according to the
Regional Market rules
Preparation of the regional electricity market and the extensive access to eligibility: - rules of the electricity Regional
Market will be defined;- ANRE+ T+ SO+ OPCOM+
Consultant prepare integration of the internal electricity market mechanisms in the Regional Market
- ANRE+ Consultant + OS+ OPCOM+ Suppliers define and implement a hourly allocation mechanism for the cost of energy purchased thru BM as well as the ancillary services purchased by the suppliers for non-metered consumers (Area/Consumer Load Profiling)
B)- Market of short term electricity contracts – the day-ahead market (DAM):- use of the transaction platform
developed in the previous stages continues
99

ensure the take over, by OPCOM, of the clearing house function for energy transacted outside the bilateral/vesting contracts as well as the implementation of the financial guarantees etc.
- OPCOM+ Consultant draw up the necessary regulations to complement the mandatory DAM with an optional financial market (forward and/or futures).
- OPCOM+ Consultant create and test the platform for the financial electricity market transactions
- ANRE+ Consultant draw up regulations to change the mandatory DAM into voluntarily DAM
- OPCOM+ Consultant- implement the regulations and test the mechanisms for the voluntarily participation
III) Ancillary Services (AS) market and the Balancing Market (BA)
Current status:- SO keeps the production/ demand
balance and ensures SEN security based on ancillary services contracts at regulated prices and by dispatching units up/ down in the merit order
- beneficiaries pay the c/value of AS based on the regulated AS tariff approved by ANRE
Preparation of new commercial arrangements and of SO real time transaction platform based on a system to ensure market discipline, including through severe penalizing mechanisms:
- ANRE+ Consultant set up the
AS and BM functioning based on: - security and production/ demand
balance of SEN are ensured by the SO through:- AS purchase contracts at regulated and competitive/ negotiated prices - Balancing Market developed in the previous stage- recovery, From the beneficiaries of costs incurred by SO in purchasing AS and on the BM
AS and BM functioning based on: - security and production/ demand
balance of SEN are ensured by the SO through:
- AS purchase contracts at regulated and competitive/ negotiated prices
- the Balancing Market - recovery, from the beneficiaries,
of costs incurred by SO in purchasing AS and on the BM
100

value of AS offered by suppliers as well as the tariff level for each supplier
- ANRE + Consultant define and set up regulations for the Balancing Market also considering the interference with the ancillary services contracts market; ancillary services are commercially re-defined, the contracting scope, mechanism and evaluation procedure should assure as much as possible competition in supply
- SO + OPCOM + Consultant draw up terms of reference for the trading & settlement platform of BM and ancillary services contracts
- SO + OPCOM + Consultant + market participants carry out the physical accomplishment of the new trading platform, it's pilot tests inclusive of integration with the settlement module of OPCOM
- ANRE + Consultant establish and implement a mechanism for recovery from clients of ancillary and balancing services costs, including the incentives for SO in order to minimize these costs
A) Generation contracts and tariffs A)Generation contracts and tariffs A) Generation tariffs101

IV) Regulated/ controlled contracts and tariffs
- regulated contracts and tariffs for the production – 5T, NPP, HPP – addressed to the captive market
- regulated contracts and tariffs for electricity produced from renewable sources and in cogeneration
- regulation of quantities of energy from renewable sources and from cogeneration that must be purchased at a regulated price
B)Contracts and tariffs for network access: - T&D(transport & distribution)+SO
have their revenues entirely regulated tariffs based on justified costs plus profit;
- from 2004 will be applied a RoR (rate of return) regulation mechanism, established with the consultant;
- regulated contracts with T&D
From 2005 - regulated contracts and tariffs
(CPI-X mechanism) for NPP& HPP generation
- production addressed to the captive market of 5T+O at tariffs with indexation proviso according to Initial Contracts and Initial Option Contracts
- transparently regulated contracts and tariffs for the energy produced from renewable sources and cogeneration
- regulation of energy quantities from renewable sources and cogeneration that must be purchased at a regulated price is maintained until it is implemented the transparent promoting mechanism (subsidy from the environmental tax)
B)Contracts and tariffs for network access:- T&D + SO have their revenues
entirely regulated through CPI-X mechanism; initial price control is for 3 years; a distinct incentive mechanism for SO in order to diminish costs for ancillary and balancing services acquisition
- distribution activity of D/F revenues
- transparent promoting mechanism for renewable and cogeneration (very small quantities/ plants)
B)Contracts and tariffs for network access:-T&D + SO have their revenues entirely regulated through CPI-X mechanism.
102

monomial tariffs; from 2004, binomial tariffs
- transit tariffs / compensation mechanism (CBT) according to EU methodologies
Work necessary to prepare the new tariff arrangements based on incentives for both network service providers and consumers- ANRE + Consultant define and
implement a price control mechanism – type RoR – for revenues (including reasonable profit) of the network service providers (NSP)
- ANRE + Consultant establish transformation procedures from the RoR mechanism into a CPI-X type applied to prices/revenues of network services providers
- ANRE + Consultant define and implement the mechanism for consumer contribution to new network connections (deep and shallow) costs
- ANRE + Consultant define and
entirely regulated through CPI-X mechanism, with initial price control for 3 years
- NSP have revenues from connections regulated; competition in works to connect to the T&D networks
- all consumers pay an environmental tax destined to encourage cogeneration and renewable
103

implement the procedures/ methodologies for appraisal, approval and application of the tariff system based on marginal cost allocation proposed by every NSP, integrating as well the tariff uniformization policy for final consumers
- Government +ANRE + Consultant establish the mechanisms for transparent incentivation of generation from renewable sources and cogeneration and the mechanisms for internalization of externalities
- ANRE + Consultant define new principles and regulatory mechanism for regulated take over of renewable and co-generated energy
Captive consumers contracts and tariffs
For captive consumers - a complex system of tariffs which
ensures:o the possibility to choose
according to the consumption characteristics
o national uniform tariffs for captive consumers
o a social tariff for disadvantaged categories of households
For captive consumers (as of 2007 all consumers are eligible):- are applied the mechanisms for
determining revenues from the captive market established in the previous stage and tariffs set on this basis
For Consumers, voluntarily not exercising eligibility mechanisms for establishing supply prices/tariffs specific to SLR are in force- social protection for disadvantaged
population categories is made by means of direct, transparent allocations from the state budget
104

o D/S: own and upstream costs recovery incurred in acquisition of energy and services destined to captive consumers
- apart from domestic consumers, every final consumer – irrespective of supplier – pays a development tax
Preparation for integrating the captive consumers tariff system in the new arrangements:- in 2004 there will be eliminated:
the small remnant cross-subsidies between high/low voltage levels
monomial supply tariffs for high and medium voltage
- MIR+ANRE+Consultant establish the policy, the mechanisms and set up the institutions (if it is the case) in order to ensure the national uniform tariff for captive consumers concept
- ANRE+Consultant implement the mechanism to ensure the national uniform tariff for captive consumers
105

- ANRE+Consultant define and implement mechanisms to recover energy costs from captive consumers (controlled transfer towards consumers of the hydrologic risk, initially entirely took over by the D/F)
- ANRE + Consultant define and implement the methodology for establishing the regulated revenues for supply under RoR and determine the procedures to transform it in CPI-X incentive mechanism
- ANRE + Consultant define and implement the procedures/ methodologies for appraisal, approval and application of the final tariff system based on marginal costs allocation, proposed by each D/S; integration of the tariff uniformisation procedures, as well
106

APPENDIX 3
GAS ROAD MAP:
MARKET STRUCTURE AND REGULATION
FOR THE PERIOD 2003-2015
107

NATURAL GAS ROAD MAP 2003 –2015Market structure and regulations
2003 – 2004 2005 – 2007 2008 – 2015Sector structure, market participants, key characteristics, stages
A) Producers (P) - 2 producers, totally or
majority state owned, oil agreement holders, market share of about 75%
- New private producers are expected to enter the market, having a market share of up to 1%
Obs. The difference for total covering of consumption, will be ensured from import – Russian Federation
Key characteristics- Incomes achieved from
selling at negotiated price- One state owned producer
(SNGN Romgaz – MIR)- One producer majority state
owned (SNP Petrom - MIR), being subject of privatization
A) Producers (P)- 2 producers, oil agreement holders,
market share of about 62%, from which SNP Petrom majority private owned and a market share of 30%
- Other producers, totally private, oil agreement holders, having a market share of up to 3%
Obs. The difference for total covering of consumption will be ensured from import, with main external source – Russian Federation and alternative sources from EU
Key characteristics- Incomes achieved from selling at
negotiated price- Diversification of sources from import
as a result of interconnection of SNTGN to transmission systems of EU
A) Producers (P)- 2 producers, oil agreement holders,
market share of about 50%, from which SNP Petrom majority private owned and a market share of 30%
- Other producers, totally private, oil agreement holders, having a market share of up to 10%
Obs. The difference for total covering of consumption will be ensured from import, with main external source – Russian Federation and alternative sources from EU and/or Caspian Sea area, Middle East
Key characteristics- Incomes arising from selling at
negotiated price- Diversification of sources from import
as a result of interconnection of SNTGN to transmission systems of EU and building new main pipelines, for connection to sources from Middle East and/or Caspian Sea
108

B) Transmission (T) + Operative Management SNTGN (OS-System Operator)
- State owned, regulated- Third party access to the grid
is regulated, based on transparent published tariffs (recognized costs + profit)
- OS ensures daily physical balance of the system and monthly for the offer/demand
- - T is supplying licensee for
natural gas quantities obtained in return for transit services
-Preparing future evolution- Commercial Operator does
settlings of the system services i.e.: programming, balance between demand/offer, monitoring of contracts, congestions management, establishing the system margin price for covering lack of sources in case of congestions
B)Transmission (T) + Operative Management SNTGN (OS)
- State owned, regulated- Third party access to the grid is
regulated, based on transparent published tariffs (recognized costs + profit)
- OS ensures daily physical balance of the system and monthly for the offer/demand
- T is supplying licensee for natural gas quantities obtained in return for transit services
Preparing future evolution- Achieving daily balance for natural
gas offer/demand - Organization of Commercial Operator
as a manager of natural gas exchange for physical transactions
- Daily programming of sources and establishing marginal system price
- Implementing SCADA system for managing natural gas flow into SNTGN
B)Transmission (T) + Operative Management SNTGN (OS)
- State owned, regulated- Third party access to the grid is
regulated, based on transparent published tariffs (recognized costs + profit)
- OS ensures daily physical balance of the system and monthly for the offer/demand
- T is supplying licensee for natural gas quantities obtained in return for transit services
Preparing future evolution- Achieving hourly balance of SNTGN- Developing natural gas exchange for
physical transactions and its regional integration
- Hourly programming of sources and establishing marginal system price
109

C) Operator of underground storage deposits
- One state owned operator, integrated into producer SNGN Romgaz, (storage capacity 3.15 bln m 3 )
- Access to storage system is regulated- based on transparent published tariffs (recognized costs + profit)
Preparing future evolution- Accounting unbundling of
supplying activity from the storage one
- Structuring the tariffs according to operational stages of storage
- Increasing storage capacities to 2.5 blnm3
D)Distributors and suppliers to captive consumers (D/F)- 15 companies from which:
two companies entirely state owned and with a market share of 98%, 12 companies majority or entirely private owned and with a market share of 1.75 %, and a vertical integrated company, majority state owned and with a market share of 0.25%
C) Operator of underground storage deposits
- One state owned operator, integrated into producer SNGN Romgaz, having a market share of about 75% - 4.3 bln m3
- Private operators for 1.5 bln m3, - Access to storage system is regulated
-based on transparent published tariffs (recognized costs + profit)
Preparing future evolution- Accounting unbundling of supplying
activity from the storage one - Increasing storage capacities to about
5 bln m3
D)Distributors and suppliers to captive consumers (D/F)- Two distributors majority private
owned and a with market share of 90%
- 30-40 independent companies, entirely private owned, having a market share of about 7.5%
- A vertical integrated company, majority private owned and with a market share of 2.5%
C) Operator of underground storage deposits
- One state owned operator, integrated into producer SNGN Romgaz, having a market share of about 65% - 4.3 bln m3
- Private operators for 2.25 bln m3
- Access to storage system is regulated based on transparent published tariffs (recognized costs + profit)
Preparing future evolution- Developing deposits meant to
balance STGN at regional level - Increasing storage capacities to
about 7 bln m3
110

Key characteristics- Till the end of the year 2004
the privatization of the two state owned distributions is foreseen
- D/F have national license for supply and can conclude contracts with any eligible consumer.
- Distribution and supplying activities are not accounting unbundled
- Access to distribution grid is regulated based on transparent published tariffs
Preparing future evolution- Accounting unbundling of
supplying activity from the distribution one
D) Suppliers to eligible
consumers (D/E)- 28 licensed suppliers for the
whole territory of Romania - The market opens at 40% -
for industrial consumers- Producers are licensed for the
whole territory of Romania;- The supplying activity is not
accounting unbundled from regulated activities (transmission, distribution, storage)
Key characteristics- D/F have national license for
supplying and could conclude contracts with any eligible consumer.
- Distribution and supplying activities accounting unbundled
- Access to distribution grid is regulated based on transparent published tariffs based on “price-cap” (CPI-X) mechanism
- as of July 2007 supply activity will be legally separated form the distribution activity
D) Eligible Consumers - Market opening will continue reaching
100% opening for industrial consumers by 01.01.2007,
- Market opening will reach 100% for domestic consumers by 01.07.2007,
- The provisions of EU Directive on natural gas market will be implemented
D) Consumers, voluntarily not exercising eligibility: – Licensed suppliers for the whole
territory of Romania– The provisions of the Directive
entirely implemented
111

Preparing future evolution- Accounting unbundling of
supplying activity from other activities
Wholesale natural gas markets
A)Market for medium and long term natural gas contracts, is represented by:- Acquisition natural gas
contracts, negotiated between producers/suppliers and distributors
- Sale-purchase contracts concluded between suppliers and eligible consumers or between producers/suppliers and distributors
B)Market for short term contracts (one month)- Sale-purchase contracts
concluded between suppliers and eligible consumers or between producers/suppliers and distributors
Preparing future evolution- Implementing the stock
exchange type transaction system, with one month term contracts
- Preparing spot transactions system, for the next day
A)Market for medium and long term natural gas contracts, is represented by:- Acquisition natural gas contracts,
negotiated between producers/suppliers and distributors
- Sale-purchase contracts concluded between suppliers and eligible consumers or between producers/suppliers and distributors
B)Market for short term contracts (one month)
- Sale-purchase contracts concluded between suppliers and eligible consumers or between producers/suppliers and distributors
- Spot contracts, with standard clausesPreparing future evolution- Implementing the stock exchange
type transaction system, with spot contracts, for the next day
112

Market for system services contracts
Present situation- Regulated contracts and
tariffs for transmission, distribution and storage services
- OS performs the balance of the system by monthly programming of natural gas sources and consumption Preparing future evolution
- Preparing Commercial Operator for providing system services
Commercial Operator- The Commercial Operator will be fully
independent in terms of legal form, organization and decision making
- The Commercial Operator daily balances the system
- Management of system congestions- Preparing transactions with reserved
capacities- Assure no-discrimination among
system users
Commercial Operator- The Commercial Operator assures
the hourly balances the system - Management of system congestions- Preparing transactions with reserved
capacities - Assure no-discrimination among
system users
Regulated/controlled contracts and tariffs
- Regulated third party access to distribution, transmission and storage systems, based on transparent published tariffs. Tariffs are set up by the principle of cost recovery method plus profit for transmission, storage and distribution activities
- Unique national tariff for transmission
- Storage tariff established for each underground deposit
- Unique national tariff for distribution
- Regulated third party access to distribution, transmission and storage systems, based on transparent published tariffs. Tariffs are set up by the principle of cost recovery method plus profit for transmission and storage and for distribution based on “price cap” (C PI-X) method.
- Unique national tariff for transmission- Storage tariff established for each
underground deposit- Differentiated distribution tariffs for
consumers categories (binominal tariff system) Applying binominal tariff system, differentiation of tariffs
- Regulated third party access to distribution, transmission and storage systems, based on transparent published tariffs. Tariffs are set up by the principle of cost recovery method plus profit for transmission and storage and for distribution based on “price cap” (C PI-X) method.
- Differentiated transmission tariffs for transmission areas (binominal tariff system)
- Storage tariff established for each underground deposit
- Differentiated distribution tariffs for consumers categories
113

Preparing future evolution- Preparation for
implementation of binomial distribution tariff system
by transmission areas-
Preparing future evolution - Elaboration of tariff systems hourly
differentiated
(binominal tariff system)- Applying tariff systems hourly
differentiated
Preparing future evolution- Preparation for applying tariff
systems for distribution services differentiated by localities
Contracts and tariffs for captive consumers
Captive consumers - Regulated contracts and
prices for natural gas supply - Unique price at national level
for all captive consumers - Social price/tariffs for poor
categories of population
Preparing future evolution
- Elaboration and implementation of regulated prices system differentiated by consumers’ categories (through differentiated distribution tariffs by consumers’ categories)
Captive consumers- Regulated contracts and prices for
natural gas supply - Price differentiated by consumers’
category- The social tariff will be maintained,
and in parallel a mechanism for direct budget subsidy system of low income people will be defined and implemented.
- Applying binomial tariff system by differentiation of tariffs by transmission areas
Consumers, voluntarily not exercising eligibility:
- Regulated contracts and prices for natural gas supply-Price differentiated by consumers’ category and geographical areas
114